Avalanche (AVAX-USD) Avalanche — 19-Jun-2026 Neutral-to-cautious technical read with mixed momentum
Avalanche (AVAX-USD) is presenting a broadly neutral KGNAI rank posture across horizons, while the underlying technical complexion is more conflicted. The instrument sits at #251 on the daily rank and #177 weekly, both consistent with a middle-of-the-universe profile rather than an extreme outlier. At the same time, trend framing remains pressured: price relative to the MA50 is flagged bearish and the MA50 vs MA200 relationship is also bearish, suggesting the market is still working through a longer-cycle downtrend regime. Momentum adds nuance—MACD histogram 0.0658 hints at near-term stabilization, but RSI(14) 38.28 keeps the bias soft. Volatility context is moderately elevated with Bollinger bandwidth 0.4560, which can amplify both breakdowns below support and failed breakouts at resistance.
Key Takeaways
- Rank stance: Short Neutral | Mid Neutral | Long Neutral
- Technical confluence: Neutral (18-signal confluence 0.056; blended technical score -0.199)
- Key levels: Support 6.5217 | Resistance 10.0524
- News sentiment bias: Bullish by normalized model score (0.59 as of 2025-10-03), while the digest mix is 100% neutral in the provided breakdown
- Confirmation / invalidation: A sustained push above 10.0524 with volume aligns with continuation framing; a close below 6.5217 increases deterioration risk per the scenario view.
What KGNAI Measures
KGNAI evaluates assets using large cross-sectional datasets built from millions of structured data points. Inputs incorporate fundamental metrics, technical structures, and systematically processed news sentiment. Statistical models, machine learning, and AI frameworks are used to assess relative positioning, signal alignment, and probabilistic behavior across broad universes.
How to Read This Report
- Ranks are comparative across the tracked universe, not absolute price targets.
- Confluence reflects alignment among independent signal groups.
- Support/resistance levels are probabilistic decision zones, not guarantees.
- Sentiment provides contextual bias within the broader analytical framework.
1) KGNAI AI Analysis
Region: CRYPTO
Total universe size: 800 ranked instruments
- Daily rank: #251 out of 800 — Neutral
- Weekly rank: #177 out of 800 — Neutral
- Monthly rank: #301 out of 800 — Neutral
- 3-Monthly rank: #246 out of 800 — Neutral
Cross-horizon positioning: stable, mid-pack behavior
AVAX-USD’s rank set is tightly clustered in the middle of the 800-instrument universe, which is typically consistent with indecisive relative strength rather than a persistent leadership or laggard profile. The weekly rank at #177 is modestly stronger than the daily #251 and the monthly #301, implying that near-term relative standing has improved versus the longer lookback, but not enough to shift the label away from neutral.
The 3-month rank of #246 sits close to the daily reading, suggesting the market’s broader relative positioning is not undergoing a sharp regime transition. In practical portfolio terms, this configuration often aligns with a range-building or repair phase—where modest improvements can appear without translating into persistent trend leadership.
KGNAI’s stance remains Neutral across short-, mid-, and long-term views, reinforcing that the ranking system is not detecting a high-conviction skew in either direction. With ranks this close together, the more informative evidence tends to come from the technical and level-based sections: whether price can reclaim key moving-average structure and whether momentum can move from “less negative” into “constructive.” Absent that, rank neutrality should be treated as a relative-probability plateau, not a directional signal.
2) Price & trend overview
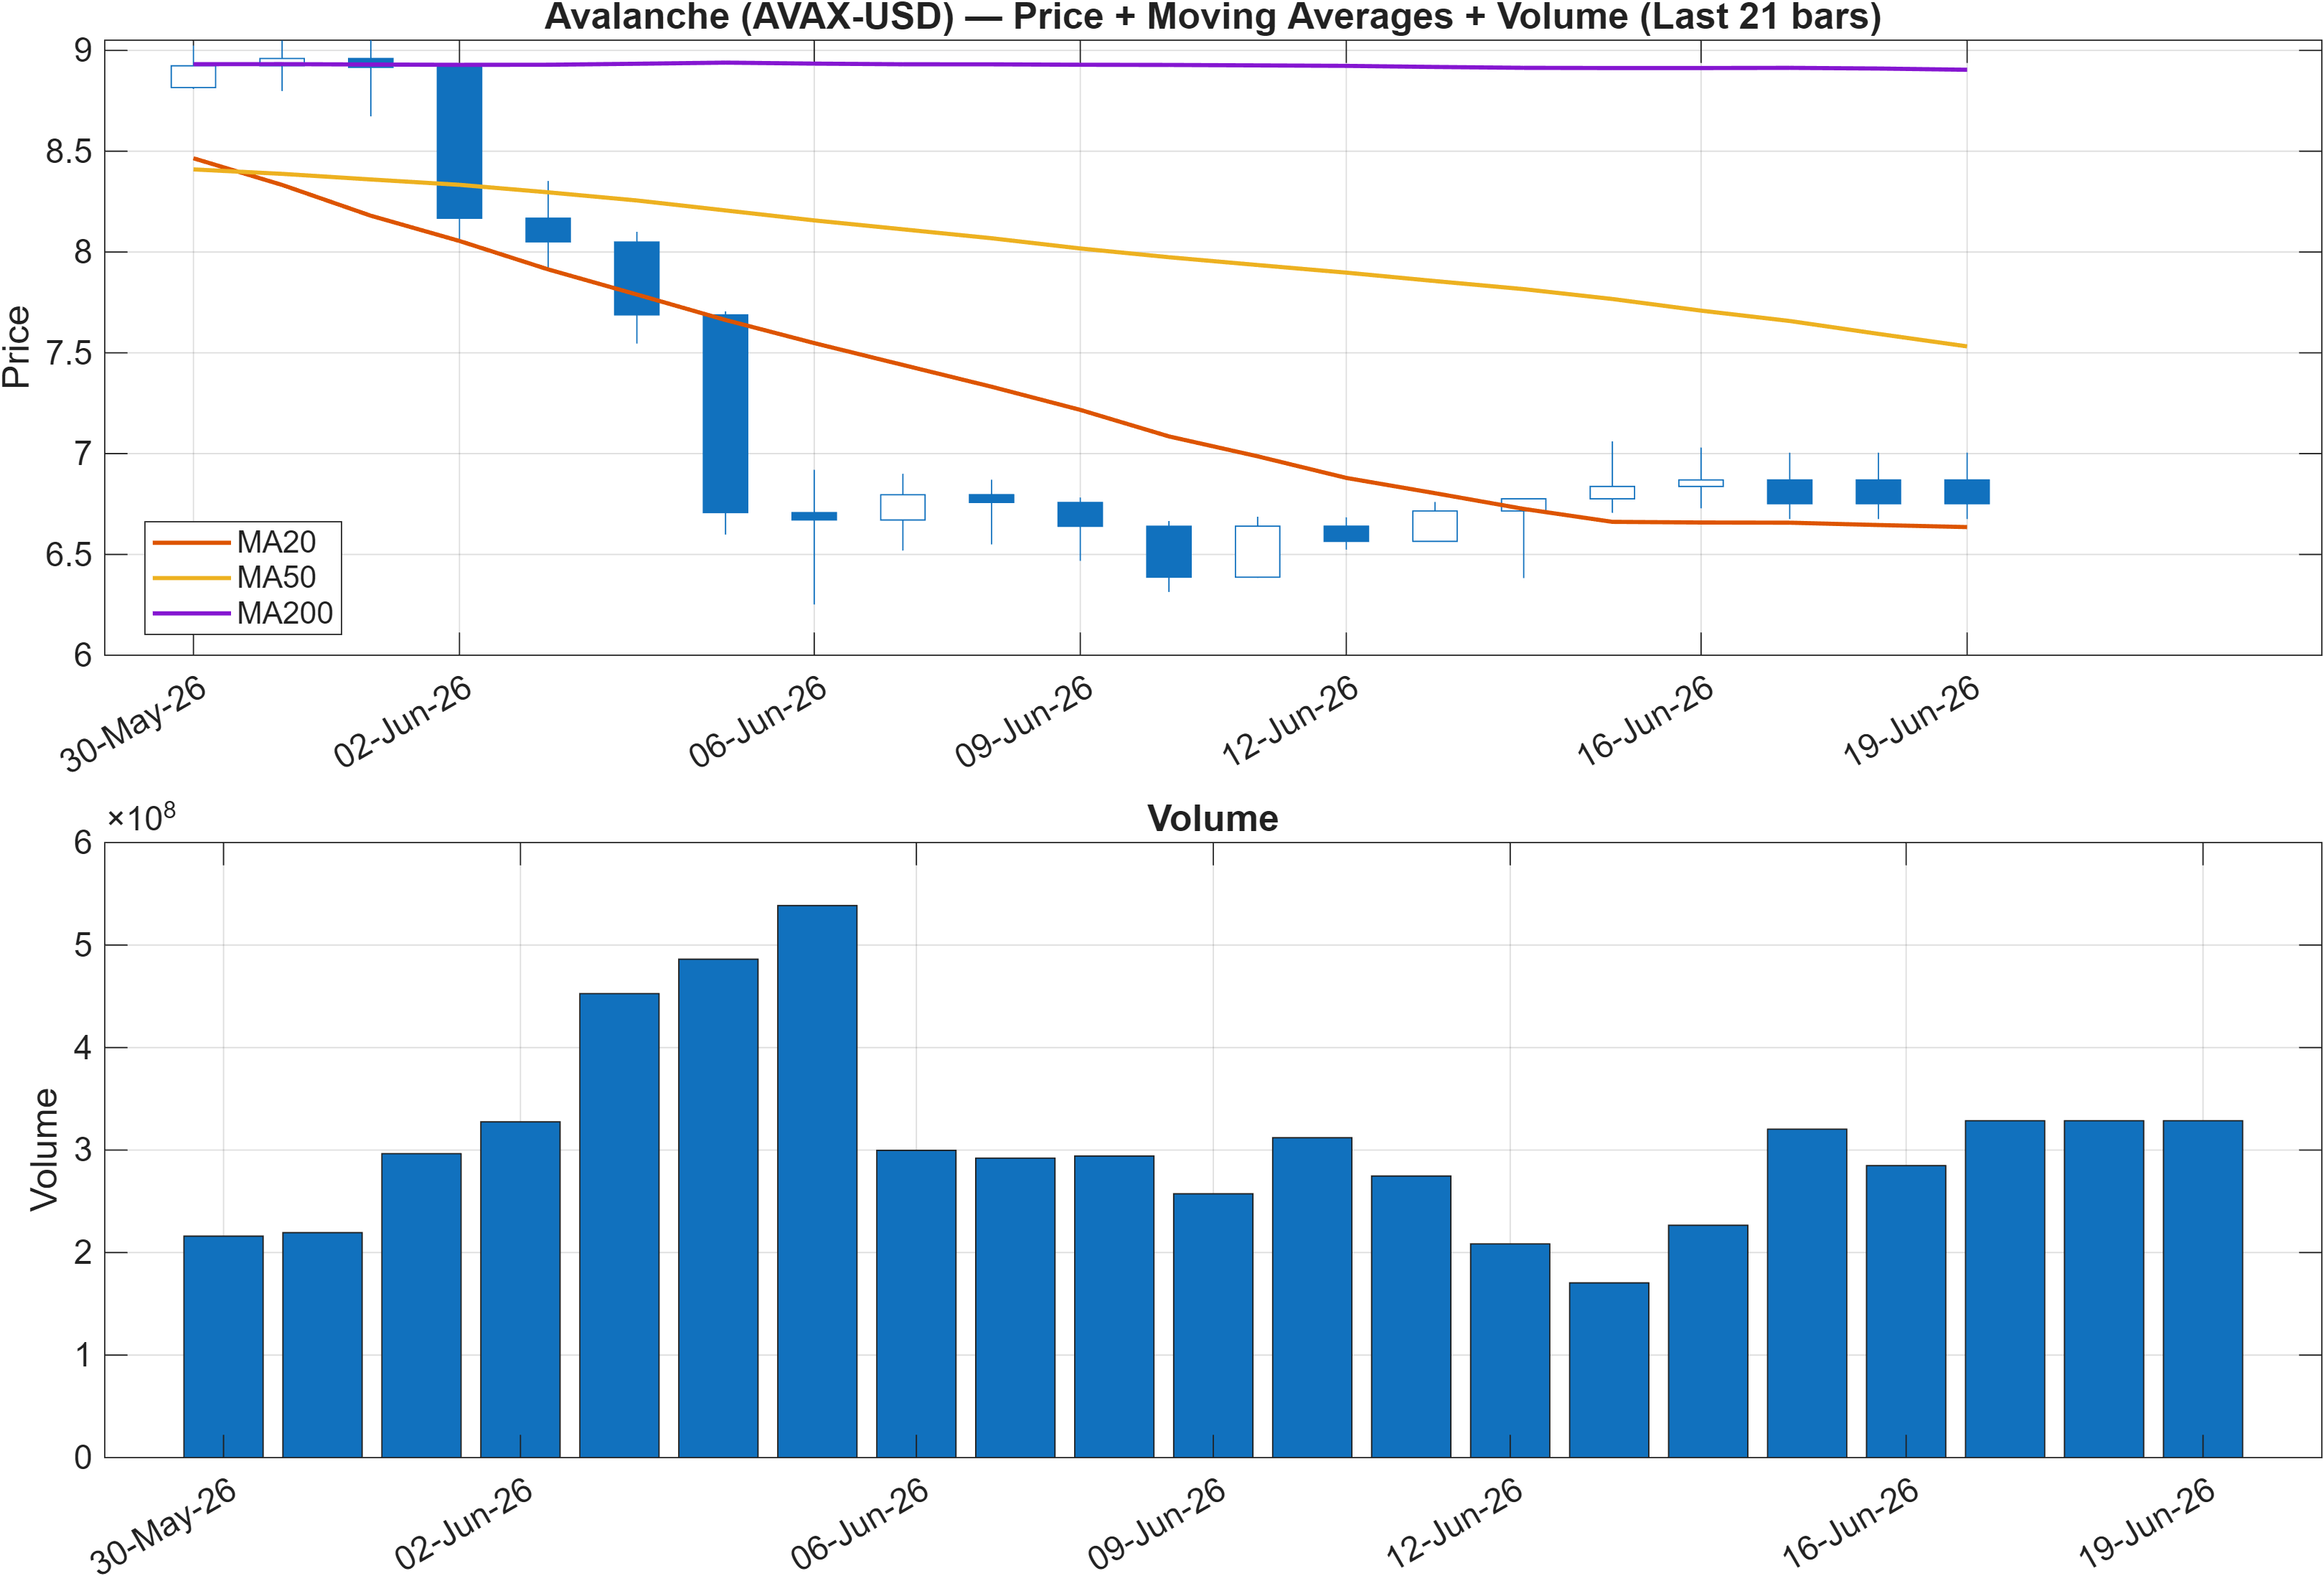
Trend structure: bearish moving-average stack vs neutral rank
The trend read is explicitly negative on two independent checks: close vs MA50 = Bearish and MA50 vs MA200 = Bearish. This combination generally characterizes a market trading below its intermediate trend while the intermediate trend remains below the long-term trend—often a sign that rallies can face supply before a durable reversal is established.
This is where the neutrality of the KGNAI ranks becomes informative: a daily rank of #251 and a weekly rank of #177 are not consistent with persistent leadership, so the bearish moving-average configuration is not being contradicted by strong relative-factor demand. Put differently, the tape is not yet showing the kind of cross-sectional strength that typically accompanies a trend “repair” phase.
The level map in the report provides an anchor for assessing whether the trend can improve: resistance is identified at 10.0524 and support at 6.5217. In a bearish moving-average stack, approaches into resistance often become the first meaningful test of whether demand is strong enough to change market structure. Conversely, proximity to support becomes a key stress point: if the market cannot hold above that zone, the probability of renewed downside volatility increases.
Overall, the trend section frames AVAX-USD as a market still operating in a downtrend regime with neutral cross-sectional ranks—consistent with a “prove it” setup where improvements must be validated by price reclaiming key structures rather than inferred from ranks alone.
3) Momentum & volatility dashboard
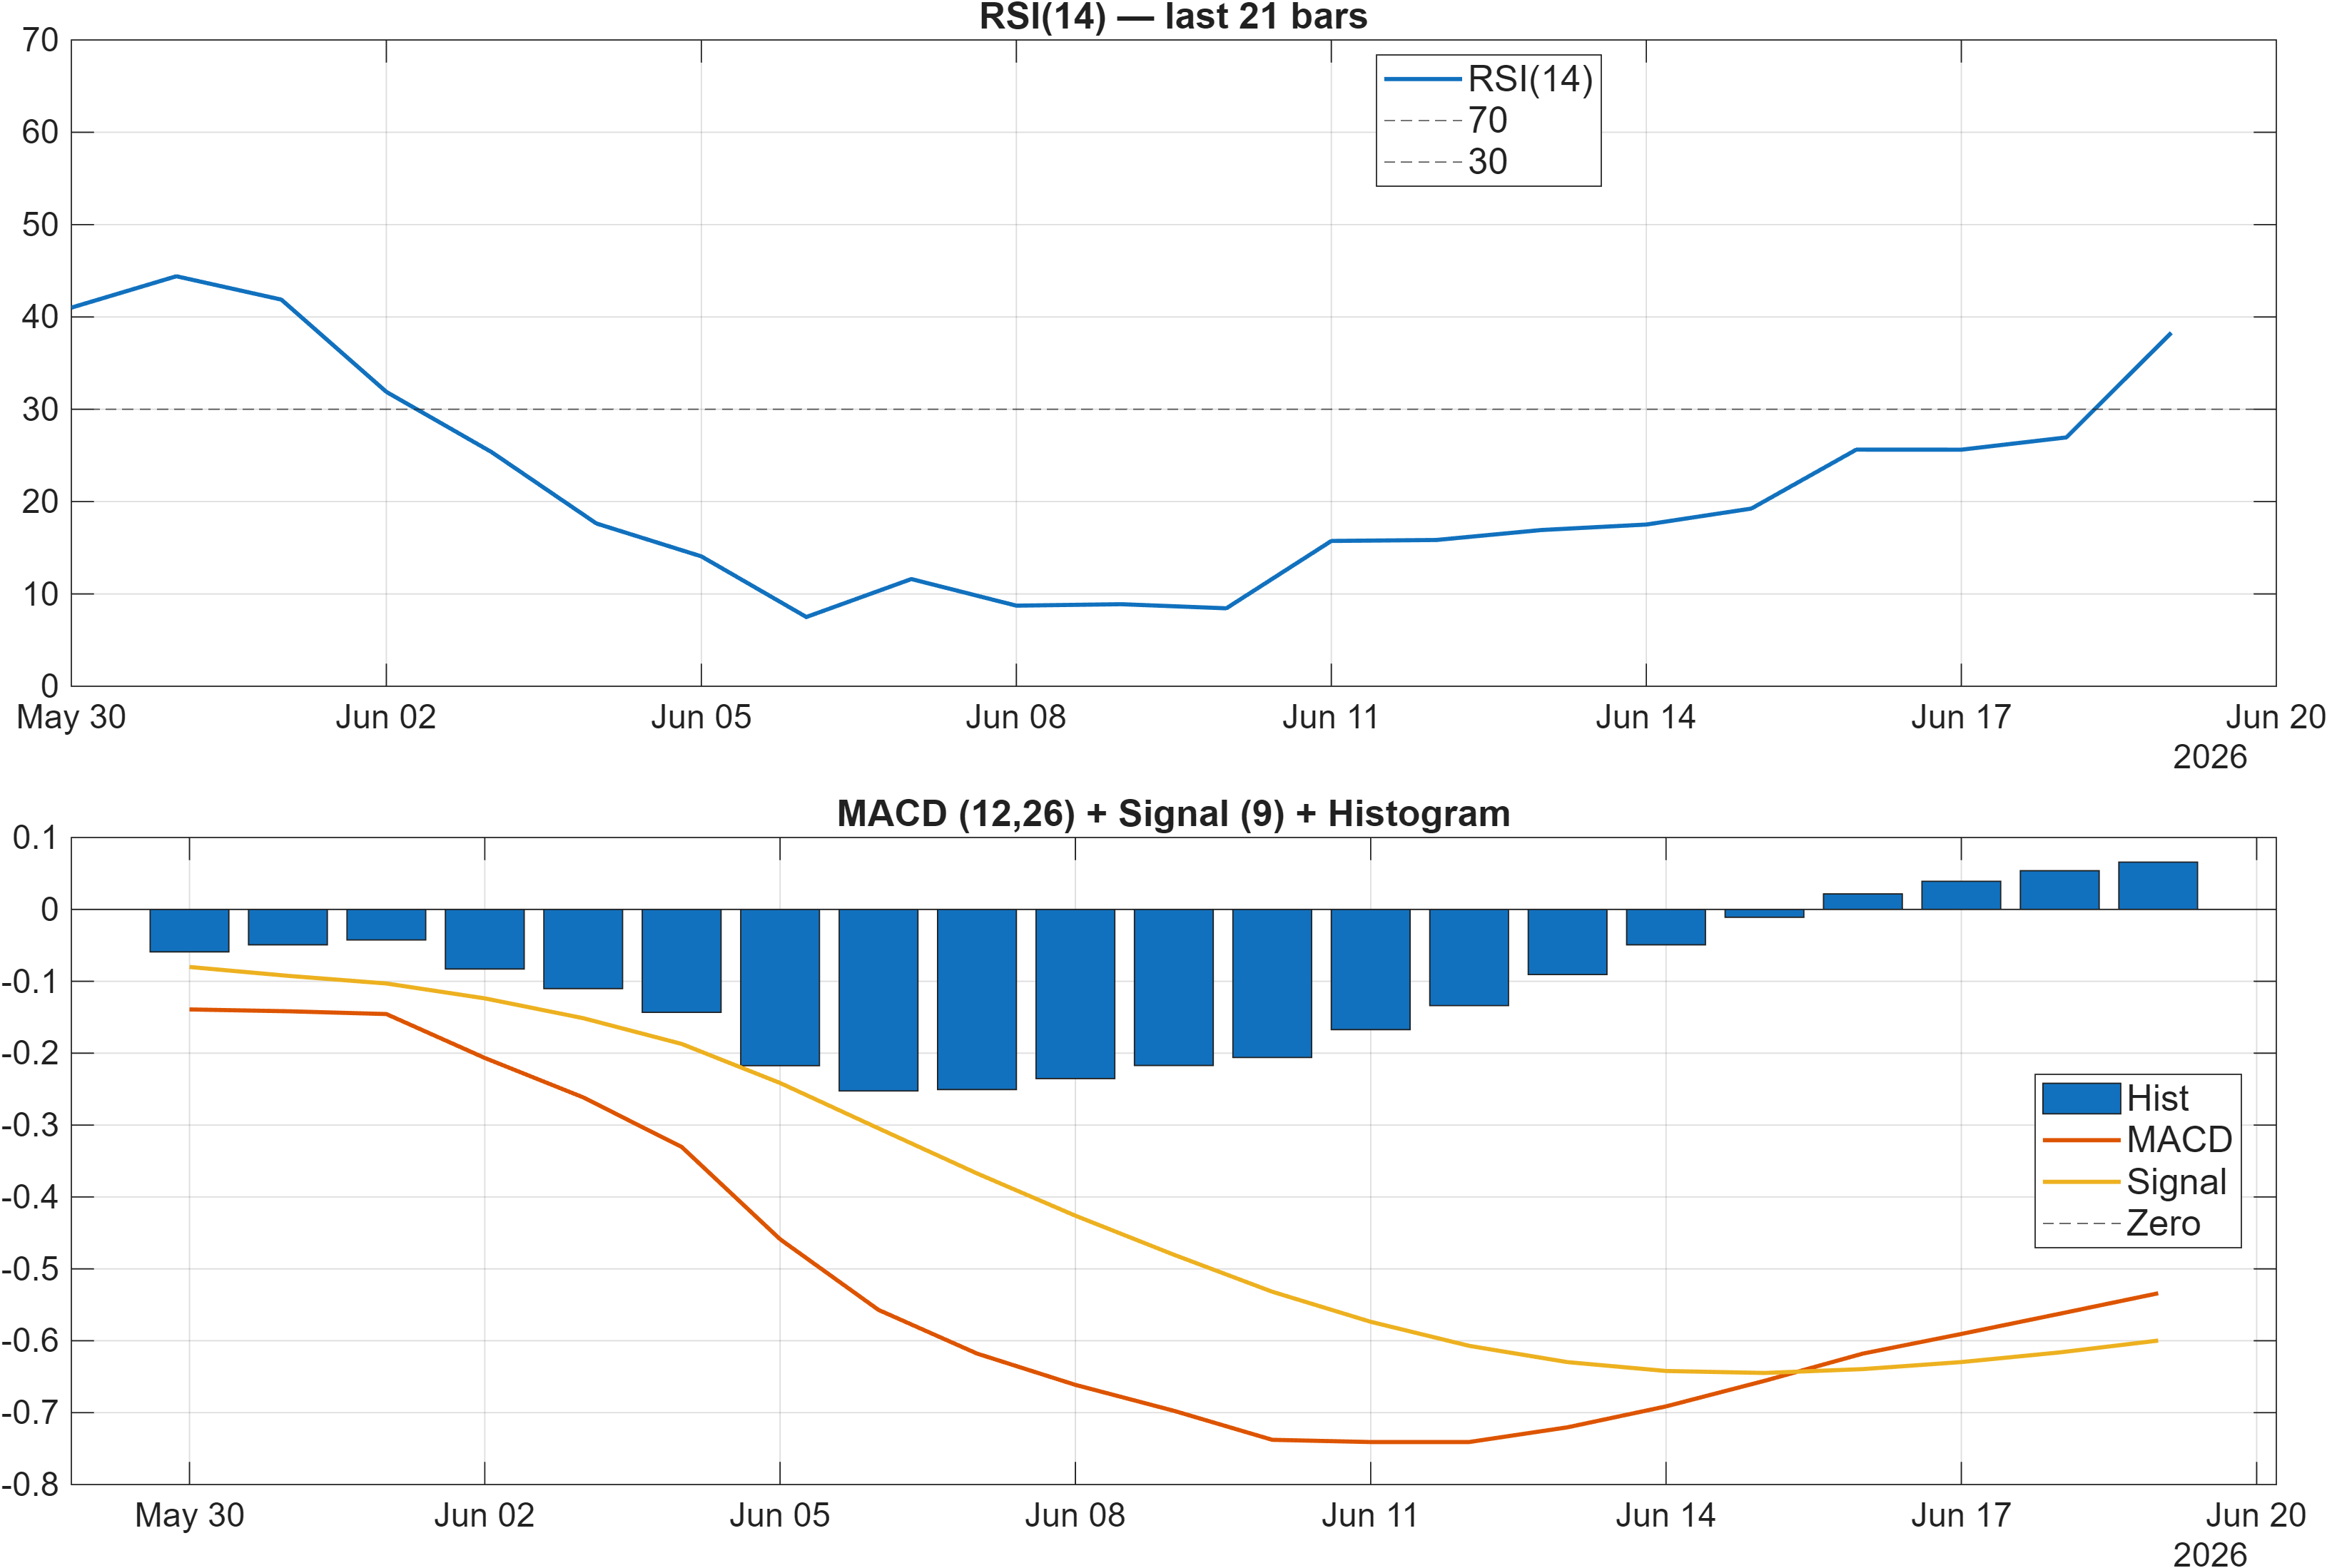
Interpretation: RSI bias = Bearish, MACD hist = 0.0658.
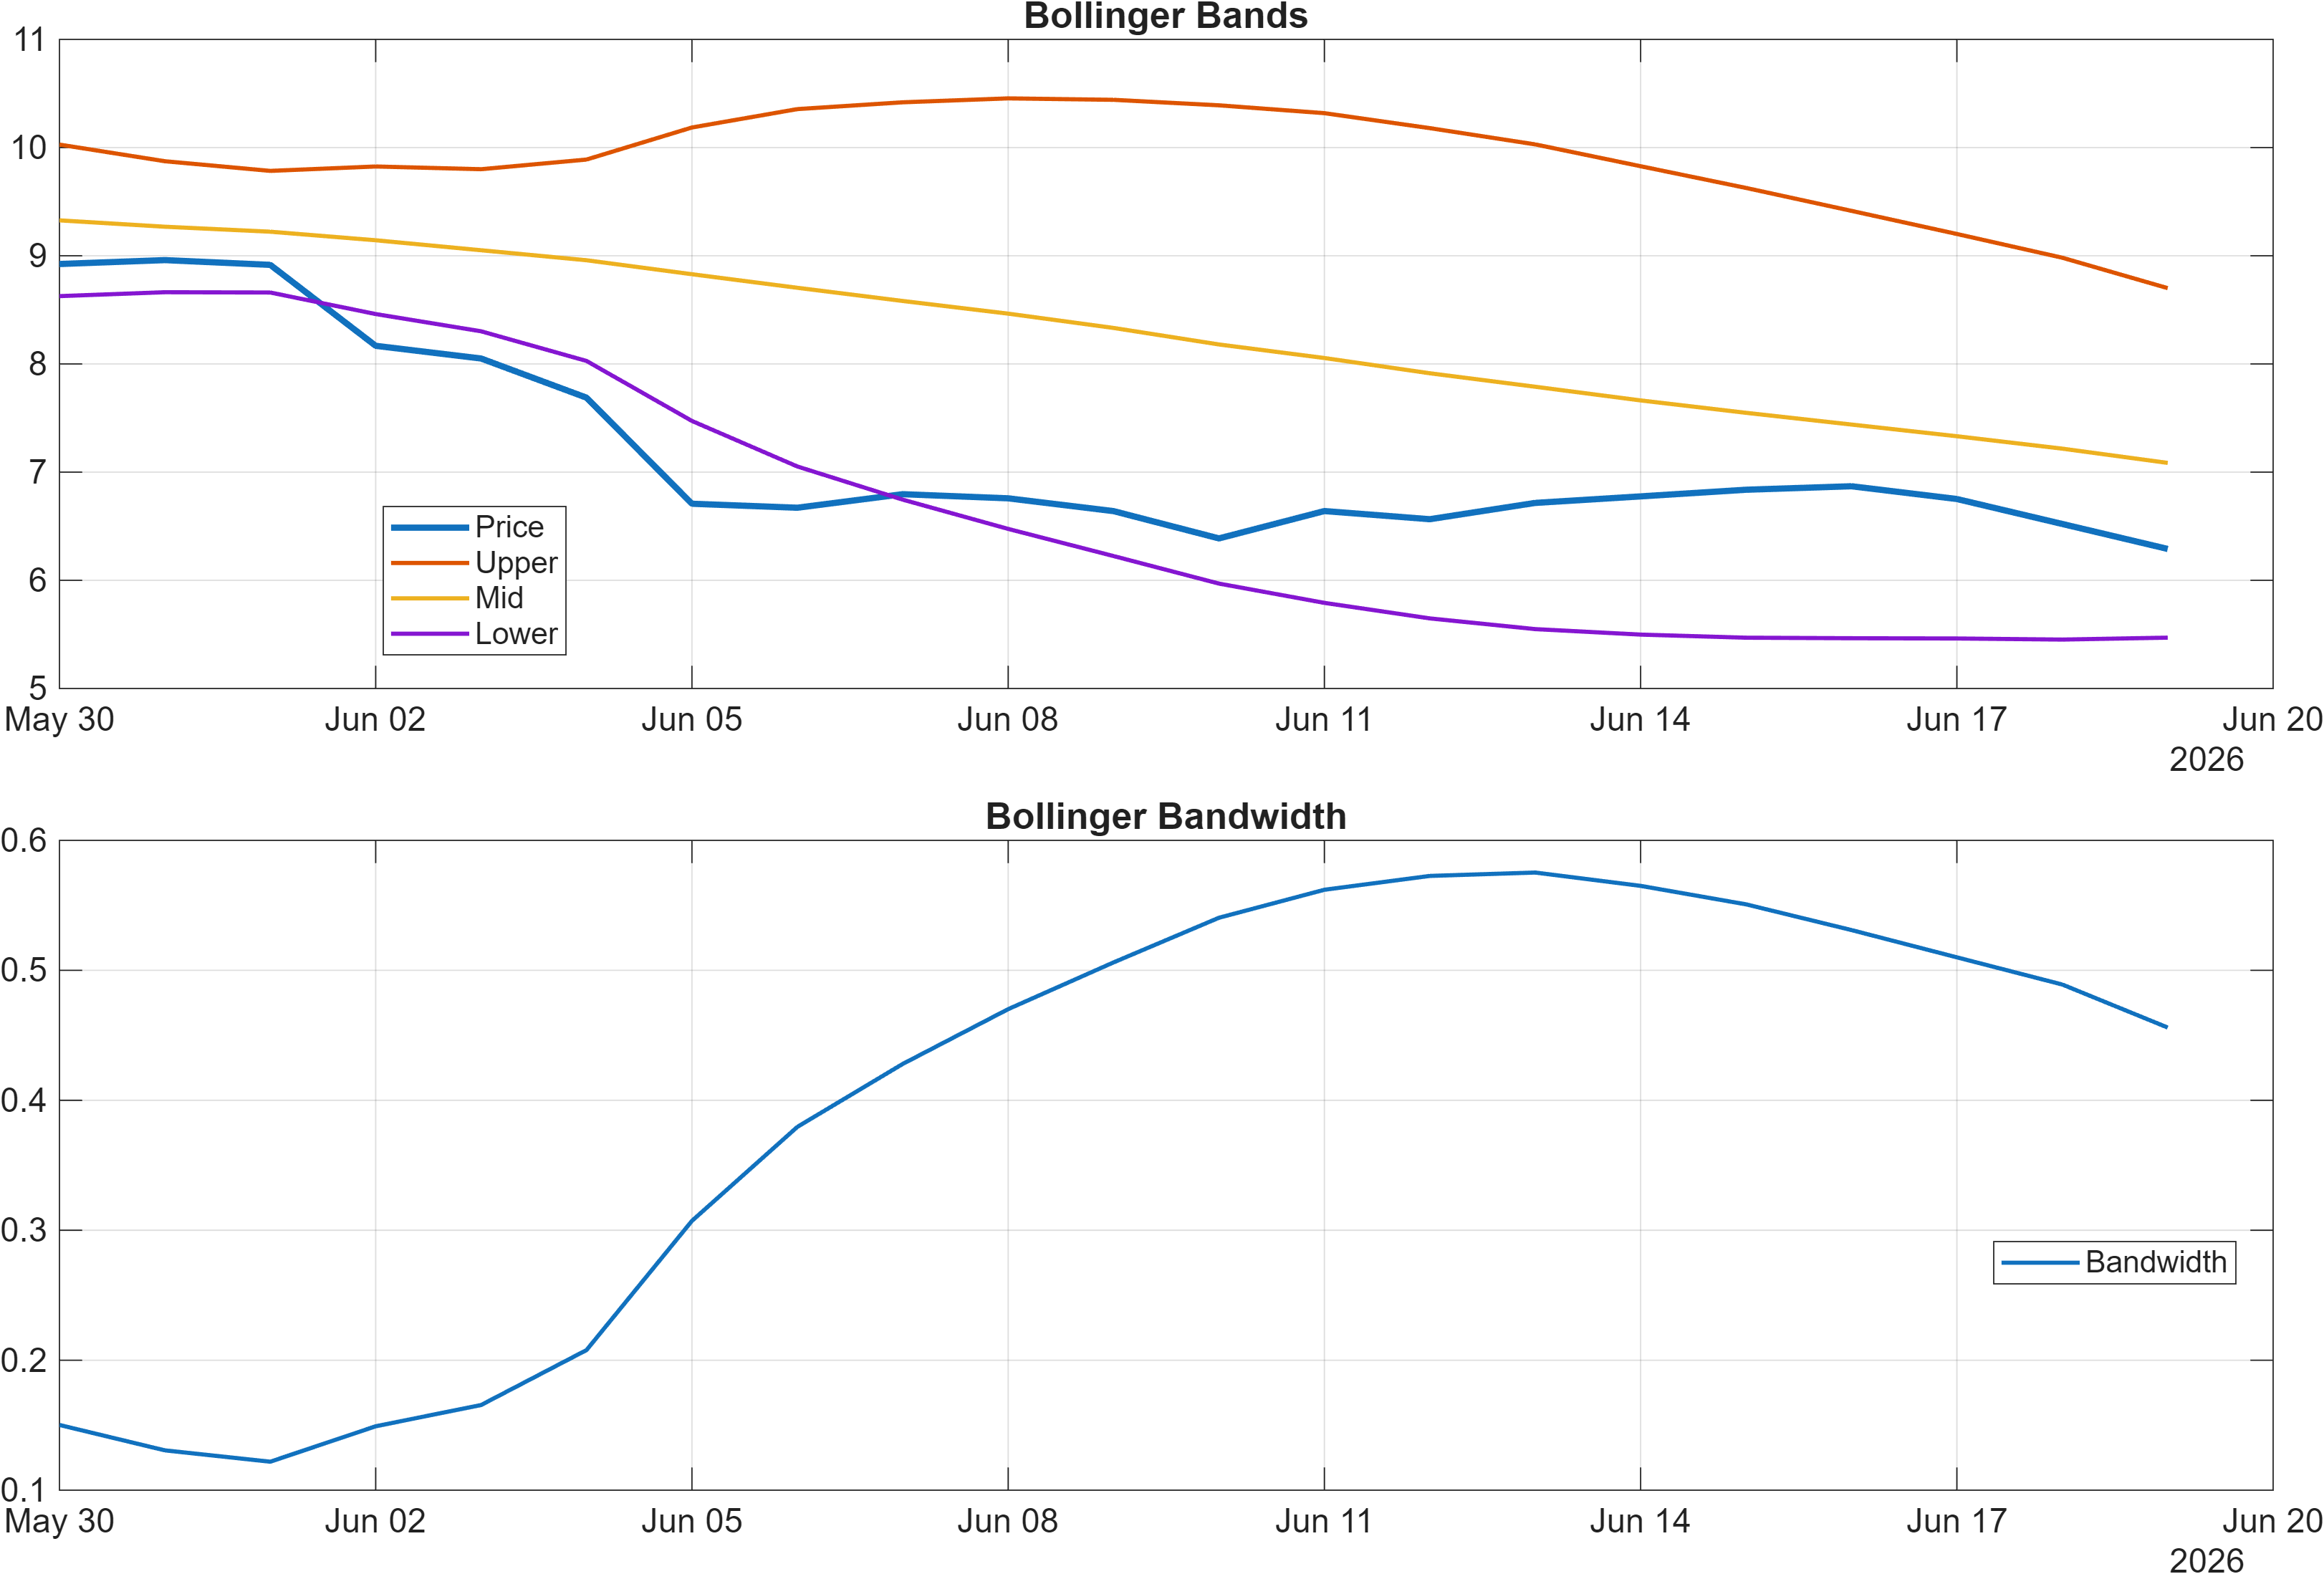
Interpretation: Bandwidth (volatility regime) latest = 0.4560.
Momentum divergence: MACD stabilization vs weak RSI
Momentum signals are not uniformly aligned. On one hand, the MACD histogram at 0.0658 points to a modest improvement in short-term momentum—often associated with a deceleration in downside pressure or an early-stage basing attempt. On the other hand, the broader oscillator condition remains soft: RSI(14) at 38.28 is still in a bearish zone, indicating that price strength has not yet recovered enough to shift the balance back toward sustained buying pressure.
Volatility regime: wider bands raise the cost of being wrong
Volatility context matters here because a neutral rank profile can still coexist with sharp, mean-reverting moves. The Bollinger Bandwidth at 0.4560 suggests a comparatively wide-band regime in the provided dataset, which can allow faster travel between decision points (support and resistance). In practice, this environment increases sensitivity to level breaks: a move through 10.0524 can extend quickly if participation is real, while failures near that area can unwind rapidly back toward the lower zone.
What to watch inside the dashboard
With trend still bearish per the moving averages, the most relevant question is whether momentum can transition from “less negative” to “constructive.” A positive MACD histogram alone is not sufficient if RSI remains depressed; similarly, RSI improvement without stability in volatility can be unreliable. The current mix favors a monitoring posture where confirmation is sought via both momentum improvement and level-based validation.
4) Support / Resistance zones
Support ~ 6.5217 | Resistance ~ 10.0524
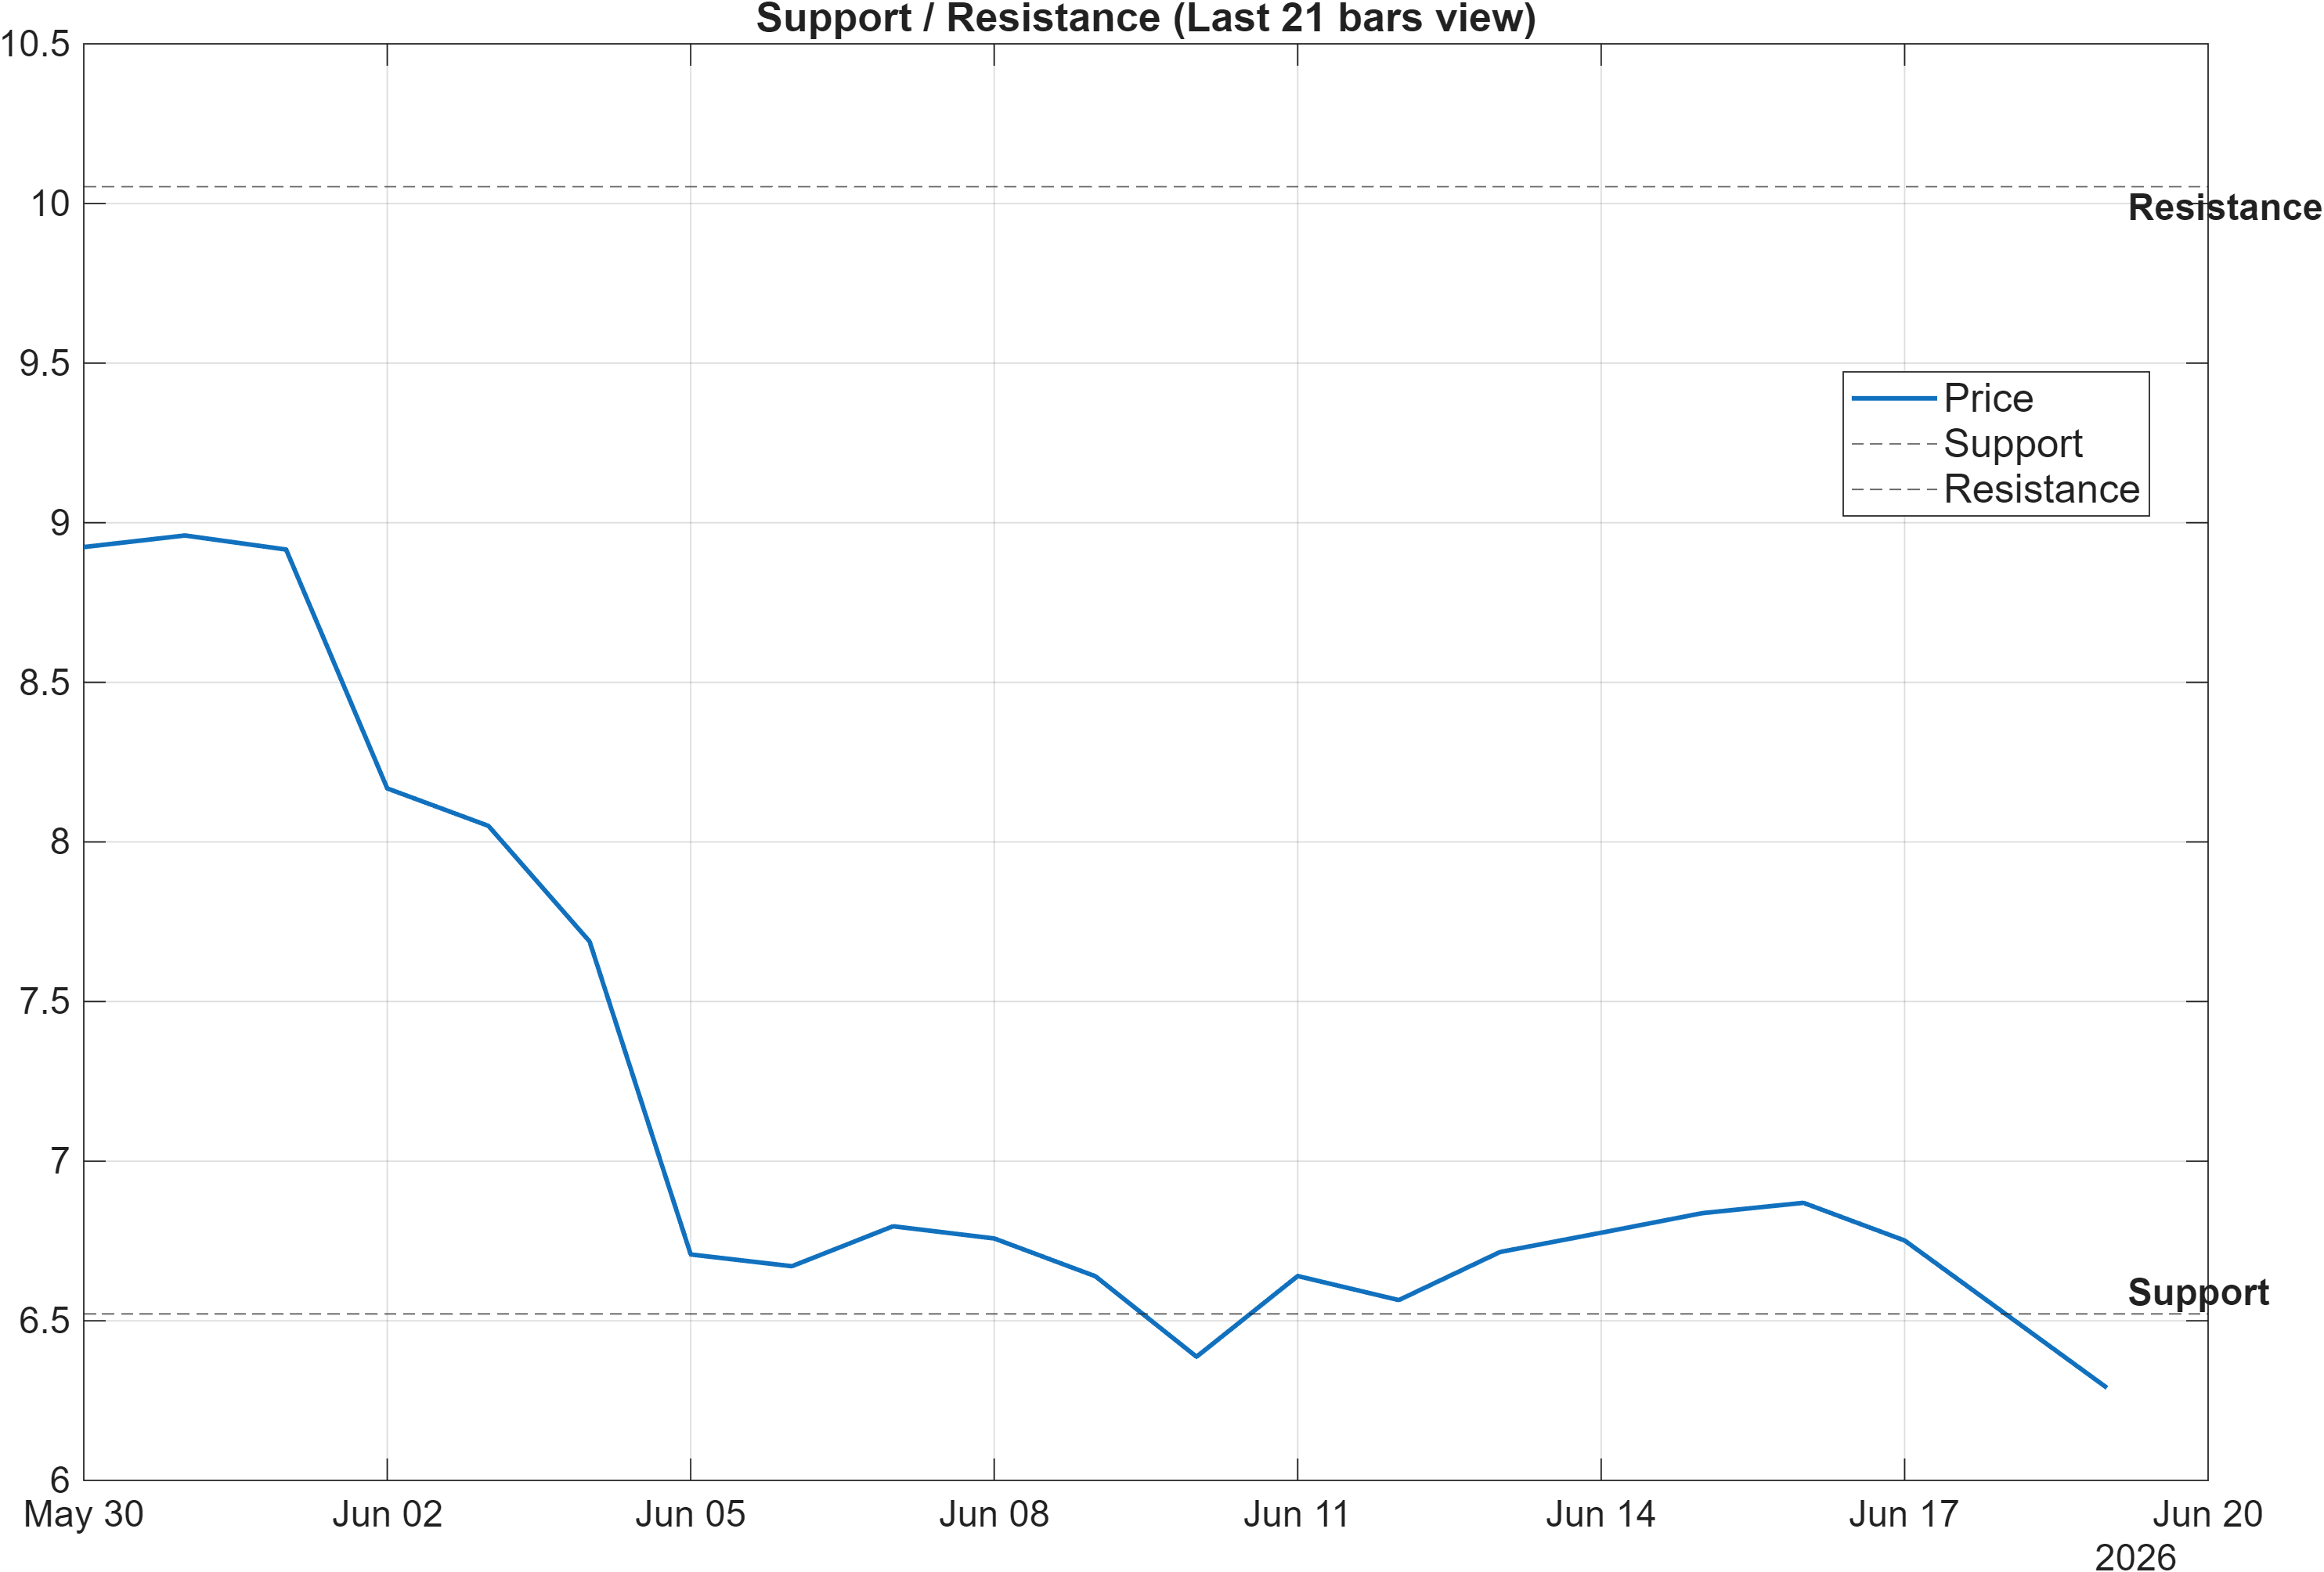
Decision zones: mapping regime continuation vs regime repair
The report defines a clear two-sided framework: support near 6.5217 and resistance near 10.0524. Given the bearish moving-average configuration, these zones act less like symmetrical “range boundaries” and more like checkpoints for whether the market is stabilizing or still trending lower.
On the upside, the scenario view emphasizes that a break above resistance with volume would align with continuation. In a downtrend context, this is best interpreted as a requirement for evidence: clearing 10.0524 is the first step toward challenging the bearish MA stack, but durability typically depends on whether follow-through emerges rather than a single print through the level.
On the downside, a close below 6.5217 is flagged as deterioration risk. That matters because momentum is already fragile (RSI bias bearish with RSI(14) 38.28), and the volatility regime (bandwidth 0.4560) can accelerate adverse moves after a support failure. If support is lost, the technical burden of proof shifts from “can the market recover” to “can it avoid a deeper extension.”
The levels also provide a practical way to interpret rank neutrality. With daily rank #251 and monthly #301, the market is not signaling strong cross-sectional leadership; therefore, level behavior becomes the primary arbiter of whether the market is transitioning away from the bearish trend structure.
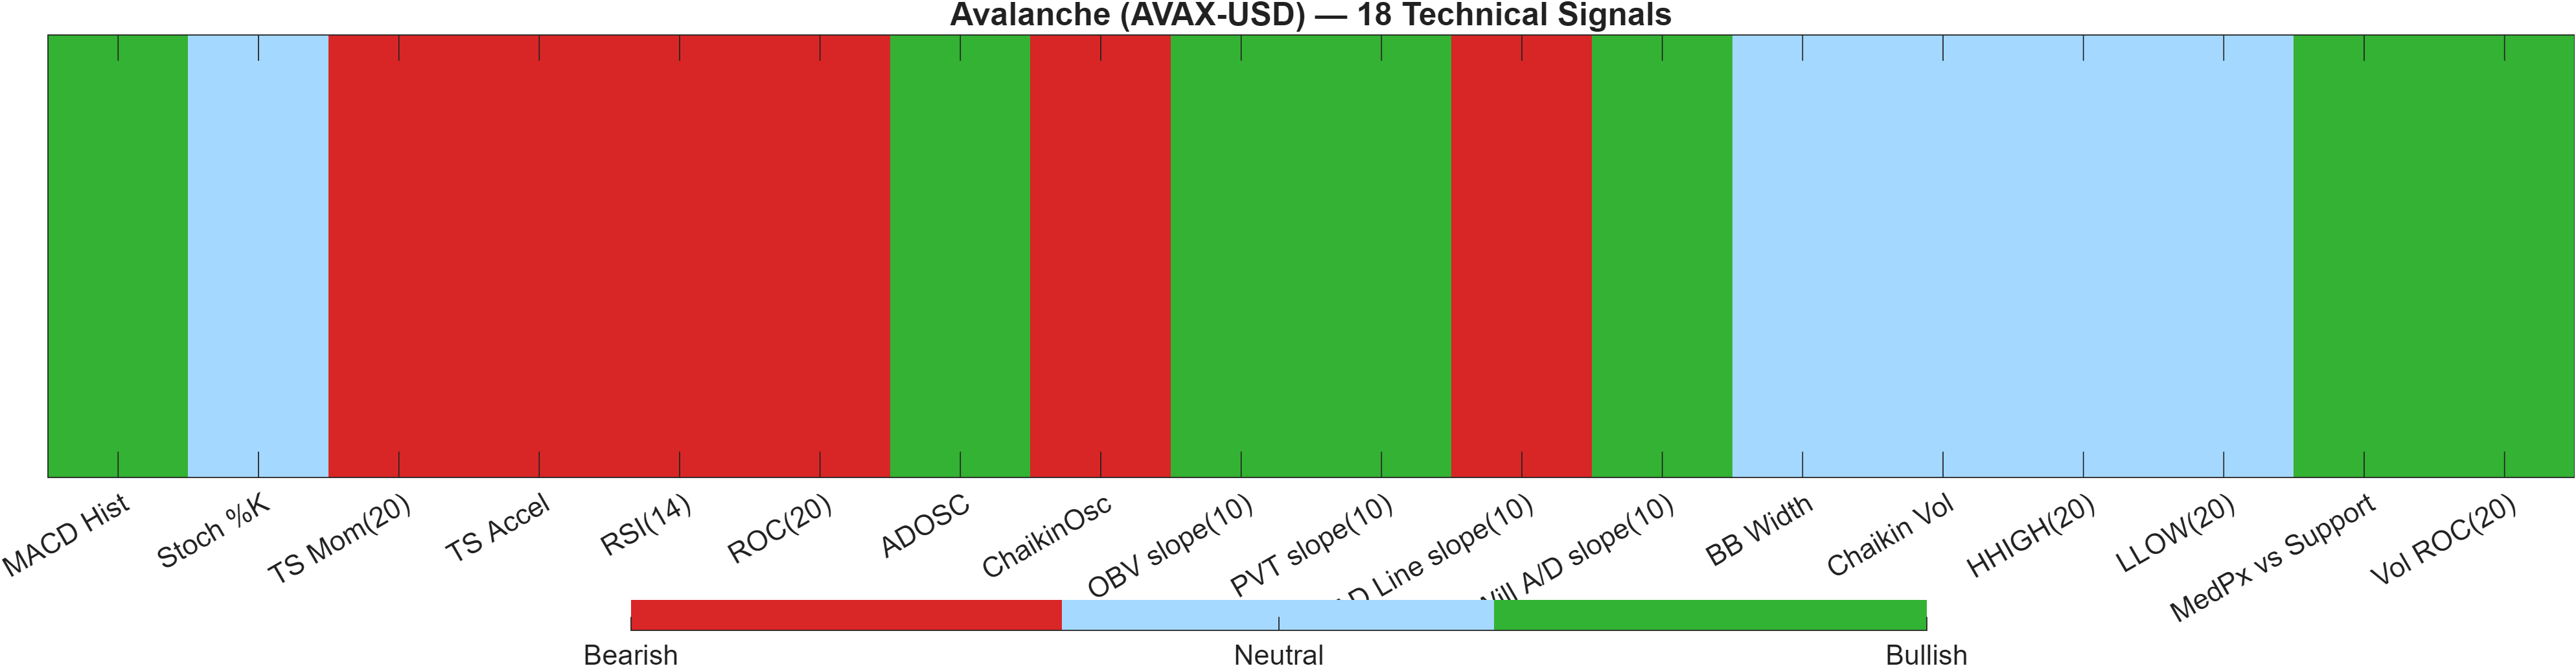
5) Quant Technical Dashboard (18 Signals)
KGNAI AI Technical Analysis Score (Deep Reinforcement Learning): Rank #717 out of 800 (Rank 1 represents the strongest technical positioning and a higher probability of favorable price behavior. As ranks increase toward the maximum, the probability of favorable outcomes weakens and bearish positioning becomes more dominant.) | Label: Bearish | Score: -0.792
18-Signal Technical Confluence Score: 0.056 (Neutral)
Overall Technical Score (18-signal confluence + DRL rank blend): -0.199 (Neutral)
Note: The blended score reflects signal strength weighted against broader AI technical ranking, which may temporarily diverge.
Blended technical score breakdown: -0.199 (Neutral | Bull 7 / Bear 6 / Neutral 5)
Signal alignment: neutral confluence masking a bearish model rank
The dashboard shows a meaningful internal split. The 18-signal confluence score is 0.056 (Neutral) and the blended technical score is -0.199 (Neutral), reflecting a relatively balanced distribution (Bull 7 / Bear 6 / Neutral 5). However, the separate Deep Reinforcement Learning technical rank is #717 with a Bearish label and score -0.792, placing it in the weaker tail of the 800-name universe.
This divergence is analytically important because it suggests the surface-level indicator mix is not strongly directional, yet the model that contextualizes patterns across the broader universe is seeing weaker technical positioning. In such configurations, neutral confluence can sometimes reflect signal cancellation—for example, early stabilization in one oscillator offset by persistent weakness in trend/momentum measures.
Selected indicator implications (without overfitting)
At the indicator level, the MACD histogram is marked bullish with 0.06579, aligning with the earlier momentum stabilization read. Yet the RSI(14) at 38.28 remains bearish, consistent with subdued demand. The volatility component is non-committal: BB Width 0.456 is neutral, implying volatility is present but not delivering a decisive directional edge within the confluence rules.
How to reconcile the blend
When the DRL rank is deeply bearish (#717) while the blended score remains neutral (-0.199), the practical takeaway is not that one is “wrong,” but that the system is detecting transition risk: indicators may be trying to stabilize, but broader technical positioning has not improved enough to classify as constructive. This makes the support/resistance framework—6.5217 and 10.0524—particularly central for validation.
Signal table (Bull/Bear/Neutral)
| Indicator | Value | Signal |
|---|---|---|
| MACD Hist | 0.06579 | Bullish |
| Stoch %K | 58.59 | Neutral |
| TS Mom(20) | -2.208 | Bearish |
| TS Accel | -1.332 | Bearish |
| RSI(14) | 38.28 | Bearish |
| ROC(20) | -29.8 | Bearish |
| ADOSC | 32.08 | Bullish |
| ChaikinOsc | -1.857e+08 | Bearish |
| OBV slope(10) | 4.278e+08 | Bullish |
| PVT slope(10) | 1.206e+06 | Bullish |
| AD Line slope(10) | -4.084e+08 | Bearish |
| Will A/D slope(10) | 0.4231 | Bullish |
| BB Width | 0.456 | Neutral |
| Chaikin Vol | -25.2 | Neutral |
| HHIGH(20) | 9.051 | Neutral |
| LLOW(20) | 6.252 | Neutral |
| MedPx vs Support | 0.3184 | Bullish |
| Vol ROC(20) | 49.73 | Bullish |
Interpretation: Indicator-level signals form the base confluence, which is then adjusted using a separate AI-driven technical ranking model. The final technical score summarizes this combined view.
6) News sentiment + extractive gist
Sentiment score (avg): 0.000 | Positive: 0% | Neutral: 100% | Negative: 0%
KGNAI AI News Sentiment Score (normalized -1 to +1): 0.59 (as of 2025-10-03) | Label: Bullish | Overall news score: 0.57
Positive Developments
Recent coverage across major financial outlets indicates incremental infrastructure and market-access developments around Avalanche-related instruments, with an emphasis on broader participation and product availability. Within the provided sentiment framework, the normalized score of 0.59 carries a Bullish label, which—at minimum—suggests that the language in tracked articles leaned constructive rather than risk-focused at the time of measurement (2025-10-03). In a market where the technical regime still shows a bearish MA stack, constructive news tone can matter most as a catalyst for liquidity and follow-through: it can support attempts to reclaim key levels (notably 10.0524) and reduce the likelihood that rallies fade immediately. That said, the digest distribution remains 100% neutral on the average sentiment breakdown in the provided data, so the “positive” case is better framed as supportive context than a dominant driver.
Neutral / Mixed Developments
The news read is unusually balanced in the provided breakdown: Neutral: 100% with an average sentiment of 0.000. This profile often appears when coverage is descriptive—focused on product introductions, access, or market mechanics—without strongly favoring upside narratives or highlighting acute risk. For AVAX-USD, that neutrality is consistent with the broader analytics: ranks are clustered in the middle of the 800-name universe (daily #251, monthly #301), and the 18-signal confluence is 0.056 (neutral). In that setting, news tends to function as background information rather than a decisive input, unless it coincides with technical validation at key levels.
Negative / Risk Signals
No explicit negative skew appears in the provided sentiment split (Negative: 0%), but risk is still present through market structure. The most immediate vulnerability is technical: the DRL technical rank sits at #717 (bearish), and trend checks show close vs MA50 bearish alongside MA50 vs MA200 bearish. In higher-volatility contexts (bandwidth 0.4560), neutral news flow can quickly become insufficient to cushion price if support is tested. The scenario framework explicitly flags deterioration risk on a close below 6.5217. As a result, “risk” here is less about adverse headlines in the dataset and more about whether the tape fails to confirm stabilization.
What to monitor next
- Whether price acceptance improves above 10.0524 alongside confirmatory volume behavior.
- Whether momentum improves with RSI(14) rising from 38.28 while MACD hist remains positive.
- Whether the market holds above 6.5217 during volatility expansions (bandwidth 0.4560).
Snapshot: AI Rank (Short–Mid–Long): Neutral (Neutral–Neutral–Neutral) · Technical Confluence: Neutral · Key Levels: Support ~6.52 | Resistance ~10.05 · News Sentiment: Neutral
7) Sources
Not available in the provided data.
You may also like: How KGNAI AI ranks instruments across global markets
Disclaimer: KGNAI provides AI-generated analytics and educational market commentary only. This is not financial advice. Markets involve risk. Always do your own research.