TMB (Tamilnad Mercantile Bank Ltd) Technical & Rank Note — 24-Jun-2026 | Weakness Signals Emerge
Tamilnad Mercantile Bank Ltd (TMB) shows a structurally weak cross-sectional posture within KGNAI’s India-ranked universe, with the daily rank at #998, deteriorating further on longer short-to-mid horizons (weekly #1050, monthly #1155) out of 1220 instruments. That relative positioning contrasts with select trend elements that remain constructive on a moving-average basis (close vs MA50 and MA50 vs MA200 are both flagged bullish), creating a rank–trend tension that often appears during late-stage rebounds or distribution phases. Momentum readings are mixed: RSI(14) at 48.95 sits near equilibrium while the MACD histogram at -3.7634 points to weakening impulse. Volatility remains contained (Bollinger bandwidth 0.0919), which can compress realized movement around key levels. From a market-structure perspective, attention centers on whether price can reclaim supply near 786.6917 or instead leaks toward 661.4250 where downside confirmation risk increases.
- Rank stance: Short Bearish (Daily #998); Mid Bearish (Weekly #1050 / Monthly #1155); Long: Not available
- Technical confluence: Neutral (18-signal confluence 0.000; blended score -0.166)
- Key levels: Support ~ 661.4250 | Resistance ~ 786.6917
- News sentiment bias: Neutral (avg -0.016; 12% positive / 63% neutral / 25% negative)
- Confirmation / invalidation: A sustained close below 661.4250 would strengthen deterioration risk; strength is better supported on a break above 786.6917 with volume per the scenario framework.
KGNAI evaluates assets using large cross-sectional datasets built from millions of structured data points. Inputs incorporate fundamental metrics, technical structures, and systematically processed news sentiment. Statistical models, machine learning, and AI frameworks are used to assess relative positioning, signal alignment, and probabilistic behavior across broad universes.
- Ranks are comparative across the tracked universe, not absolute price targets.
- Confluence reflects alignment among independent signal groups.
- Support/resistance levels are probabilistic decision zones, not guarantees.
- Sentiment provides contextual bias within the broader analytical framework.
1) KGNAI AI Analysis
Region: INDIA
Total universe size: 1220 ranked instruments
- Daily rank: #998 out of 1220 — Bearish
- Weekly rank: #1050 out of 1220 — Bearish
- Monthly rank: #1155 out of 1220 — Bearish
- 3-Monthly rank: Not available for this horizon — Not available
- 6-Monthly rank: Not available for this horizon — Not available
- Yearly rank: Not available for this horizon — Not available
Across KGNAI’s 1220-instrument India universe, TMB sits in the lower tail of relative positioning, with ranks clustered near the bottom on daily, weekly, and monthly horizons (#998, #1050, #1155). This clustering matters more than any single point estimate: when multiple horizons align negatively, it suggests the instrument is being consistently outscored by peers across several statistical and pattern-recognition tests. In practical market terms, that profile is often associated with weaker follow-through probability during risk-on rotations, and faster drawdown sensitivity during risk-off pulses.
The notable feature is timeframe consistency. The weekly and monthly ranks are worse than the daily reading, indicating that the cross-sectional weakness is not merely a one-session dislocation; rather, it has persistence across the recent distribution window. That persistence can coexist with short-lived technical rebounds, but it typically raises the bar for any bullish interpretation: price strength needs clearer confirmation from momentum and participation rather than just proximity to moving averages.
Long-horizon ranks (3-month, 6-month, yearly) are not available in the provided data, which limits regime classification beyond the current short-to-mid window. With that constraint, the most defensible stance remains anchored to the available horizons: Short-term Bearish and Mid-term Bearish, with long-term assessment deferred. The key analytical implication is not prediction; it is relative opportunity cost: at ranks near #1000+ in a 1220 universe, TMB currently screens as weaker versus a large majority of tracked instruments.
Term view: Short-term: Bearish. Mid-term: Bearish. Long-term: Not available.
Want the full universe and complete rank tables? Unlock full access on KGNAI: https://www.kgnai.com/pricing
2) Price & trend overview
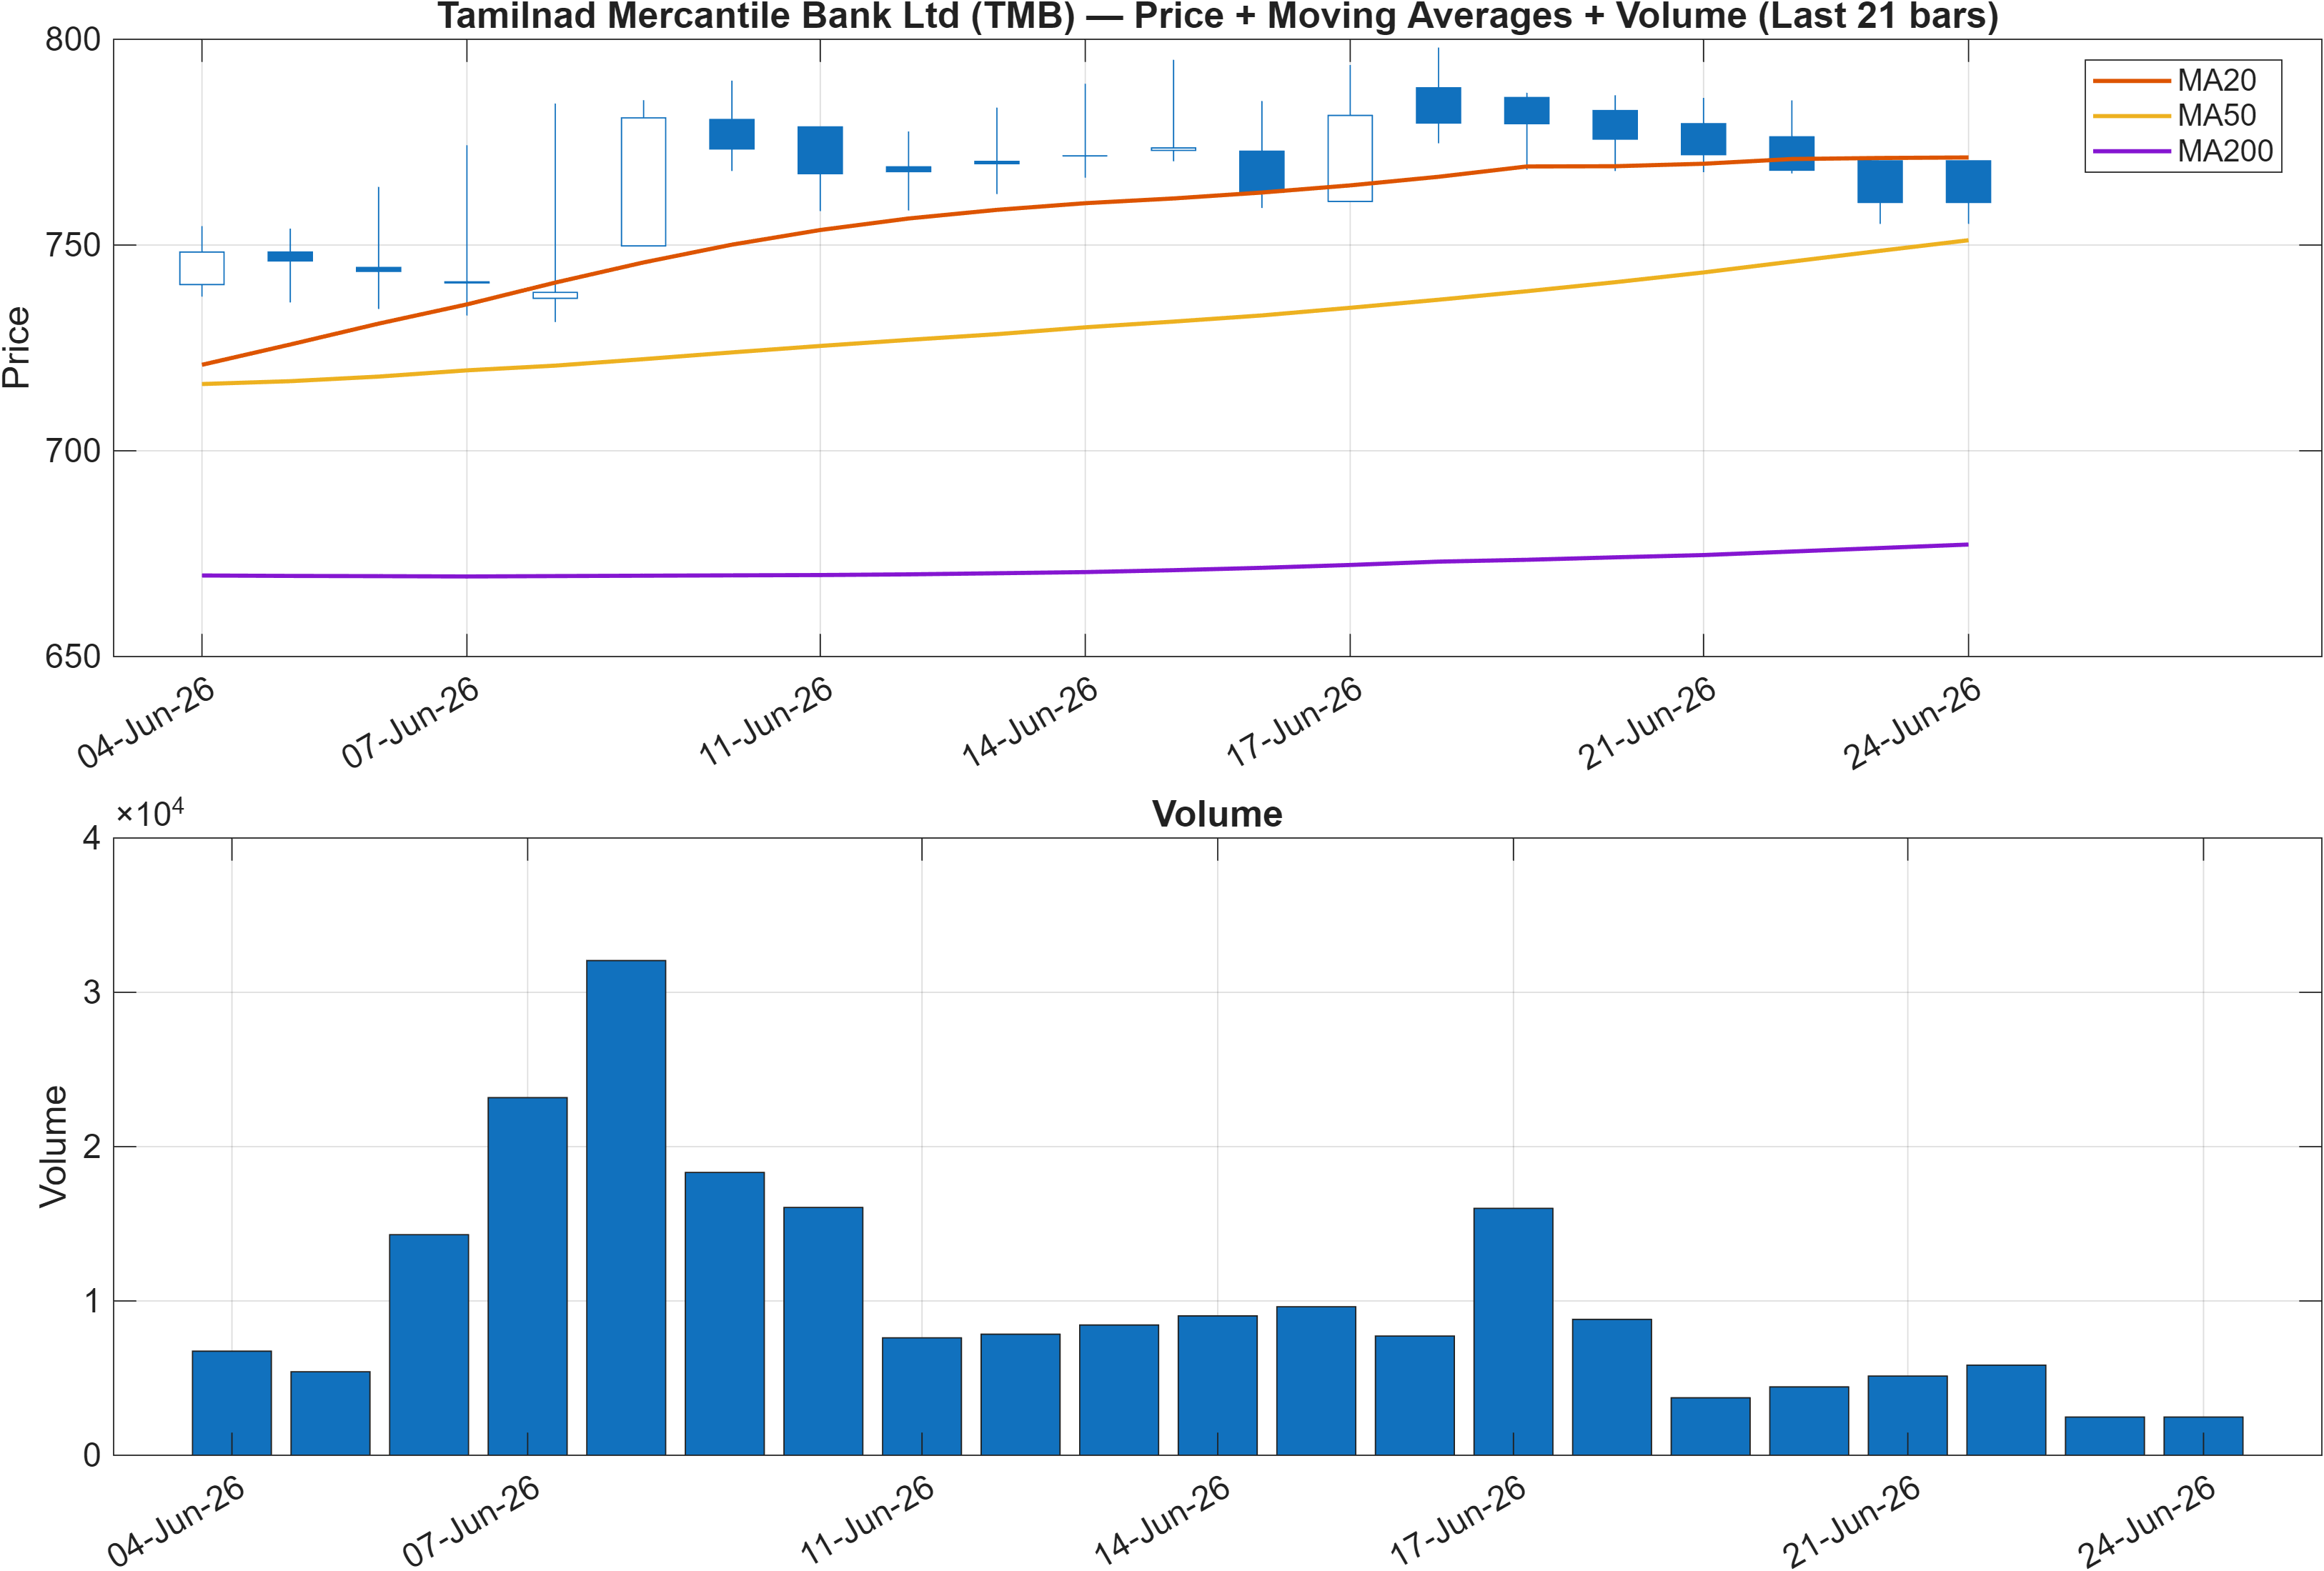
The moving-average lens is currently supportive on two dimensions: close vs MA50 is bullish, and MA50 vs MA200 is also bullish. In isolation, that combination often aligns with a constructive trend state. However, the broader dataset in this report argues for caution: cross-sectional ranks remain deeply bearish (daily #998, weekly #1050, monthly #1155), implying that even if the trend filter reads positive, the instrument’s relative behavior still screens weak against peers.
This is a classic alignment vs divergence setup. When ranks and trend signals disagree, the operational question becomes whether the moving-average structure is an early stabilization that later pulls ranks upward, or whether it reflects a lagging artifact while momentum/participation deteriorates underneath. The momentum section adds context: RSI at 48.95 is neutral rather than supportive, and MACD histogram at -3.7634 indicates negative impulse. Together, that leans toward the interpretation that the moving-average posture may not be sufficiently “confirmed” by acceleration.
Volume confirmation is addressed indirectly via participation-type indicators later in the dashboard (e.g., OBV slope and AD Line slope), both of which are bearish in the signal table. That matters because trend structures tend to fail more readily when participation weakens while price holds above common averages. The market-structure implication is to treat the MA configuration as a conditional support, not a standalone green light.
The near-term map therefore becomes level-driven: resistance at 786.6917 is the area where trend continuation would need to prove itself, while 661.4250 remains the key zone where a breakdown would align the moving-average view with the already-bearish ranks.
3) Momentum & volatility dashboard
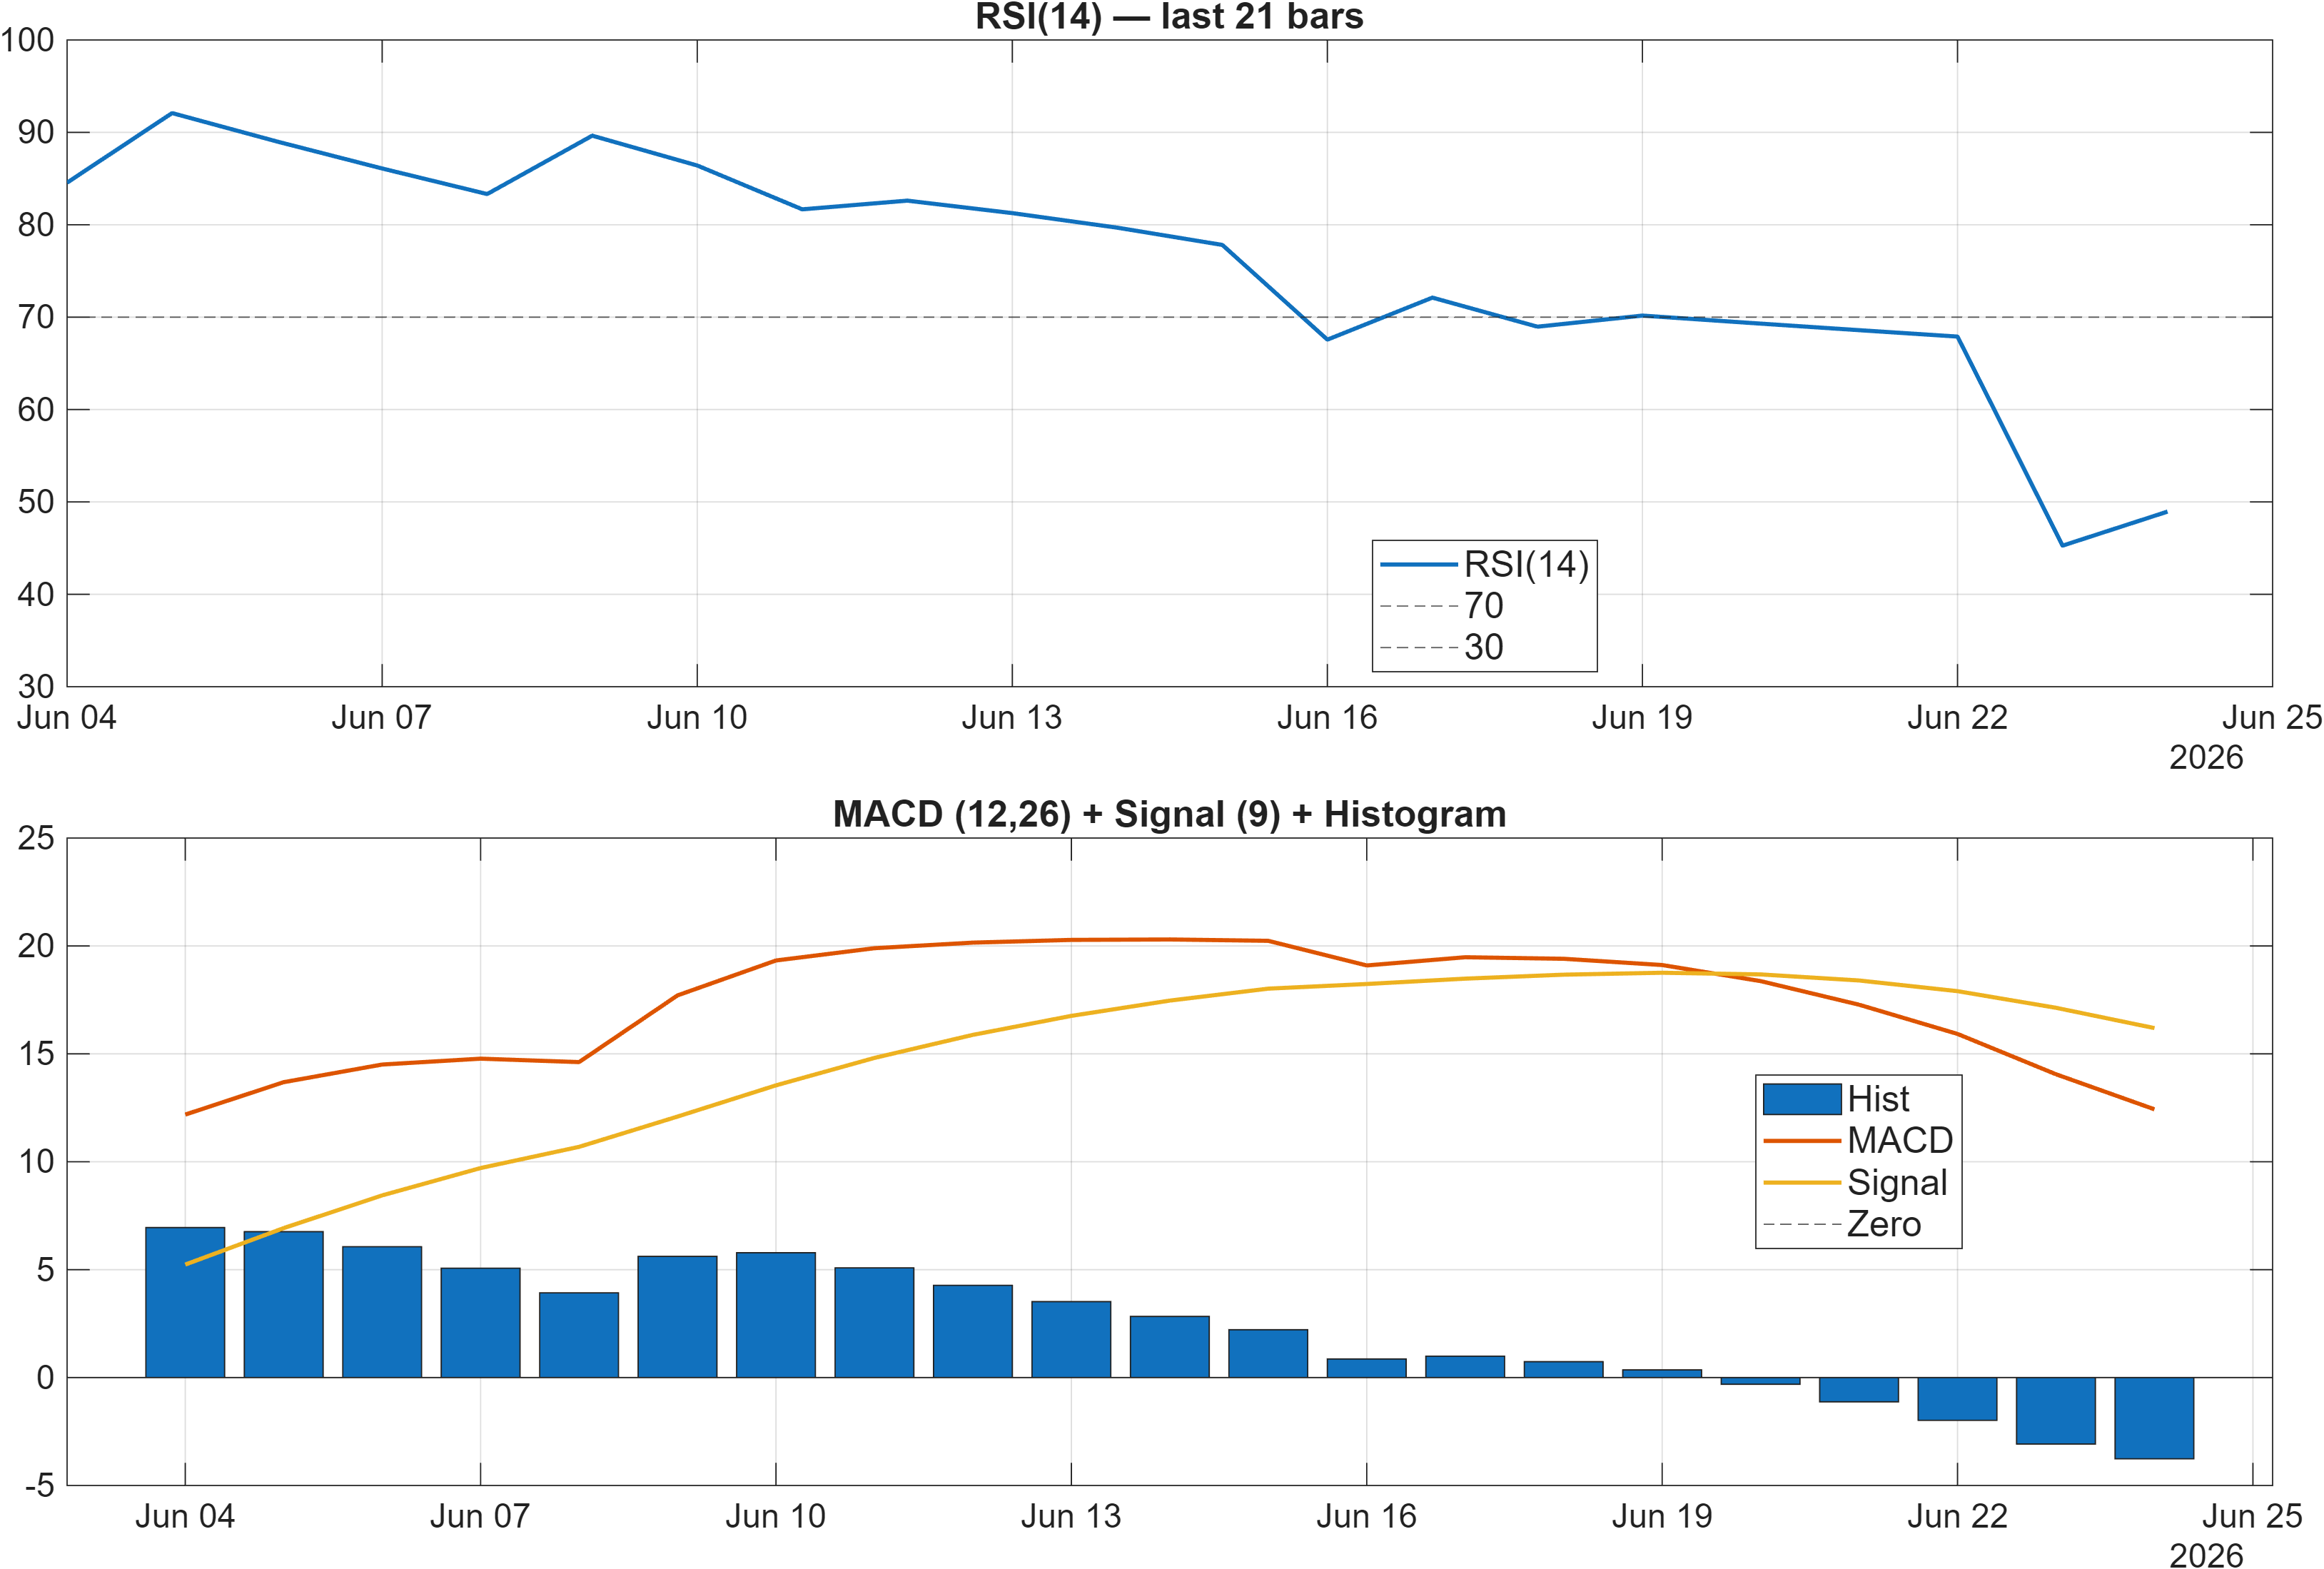
Interpretation: RSI bias = Neutral, MACD hist = -3.7634.
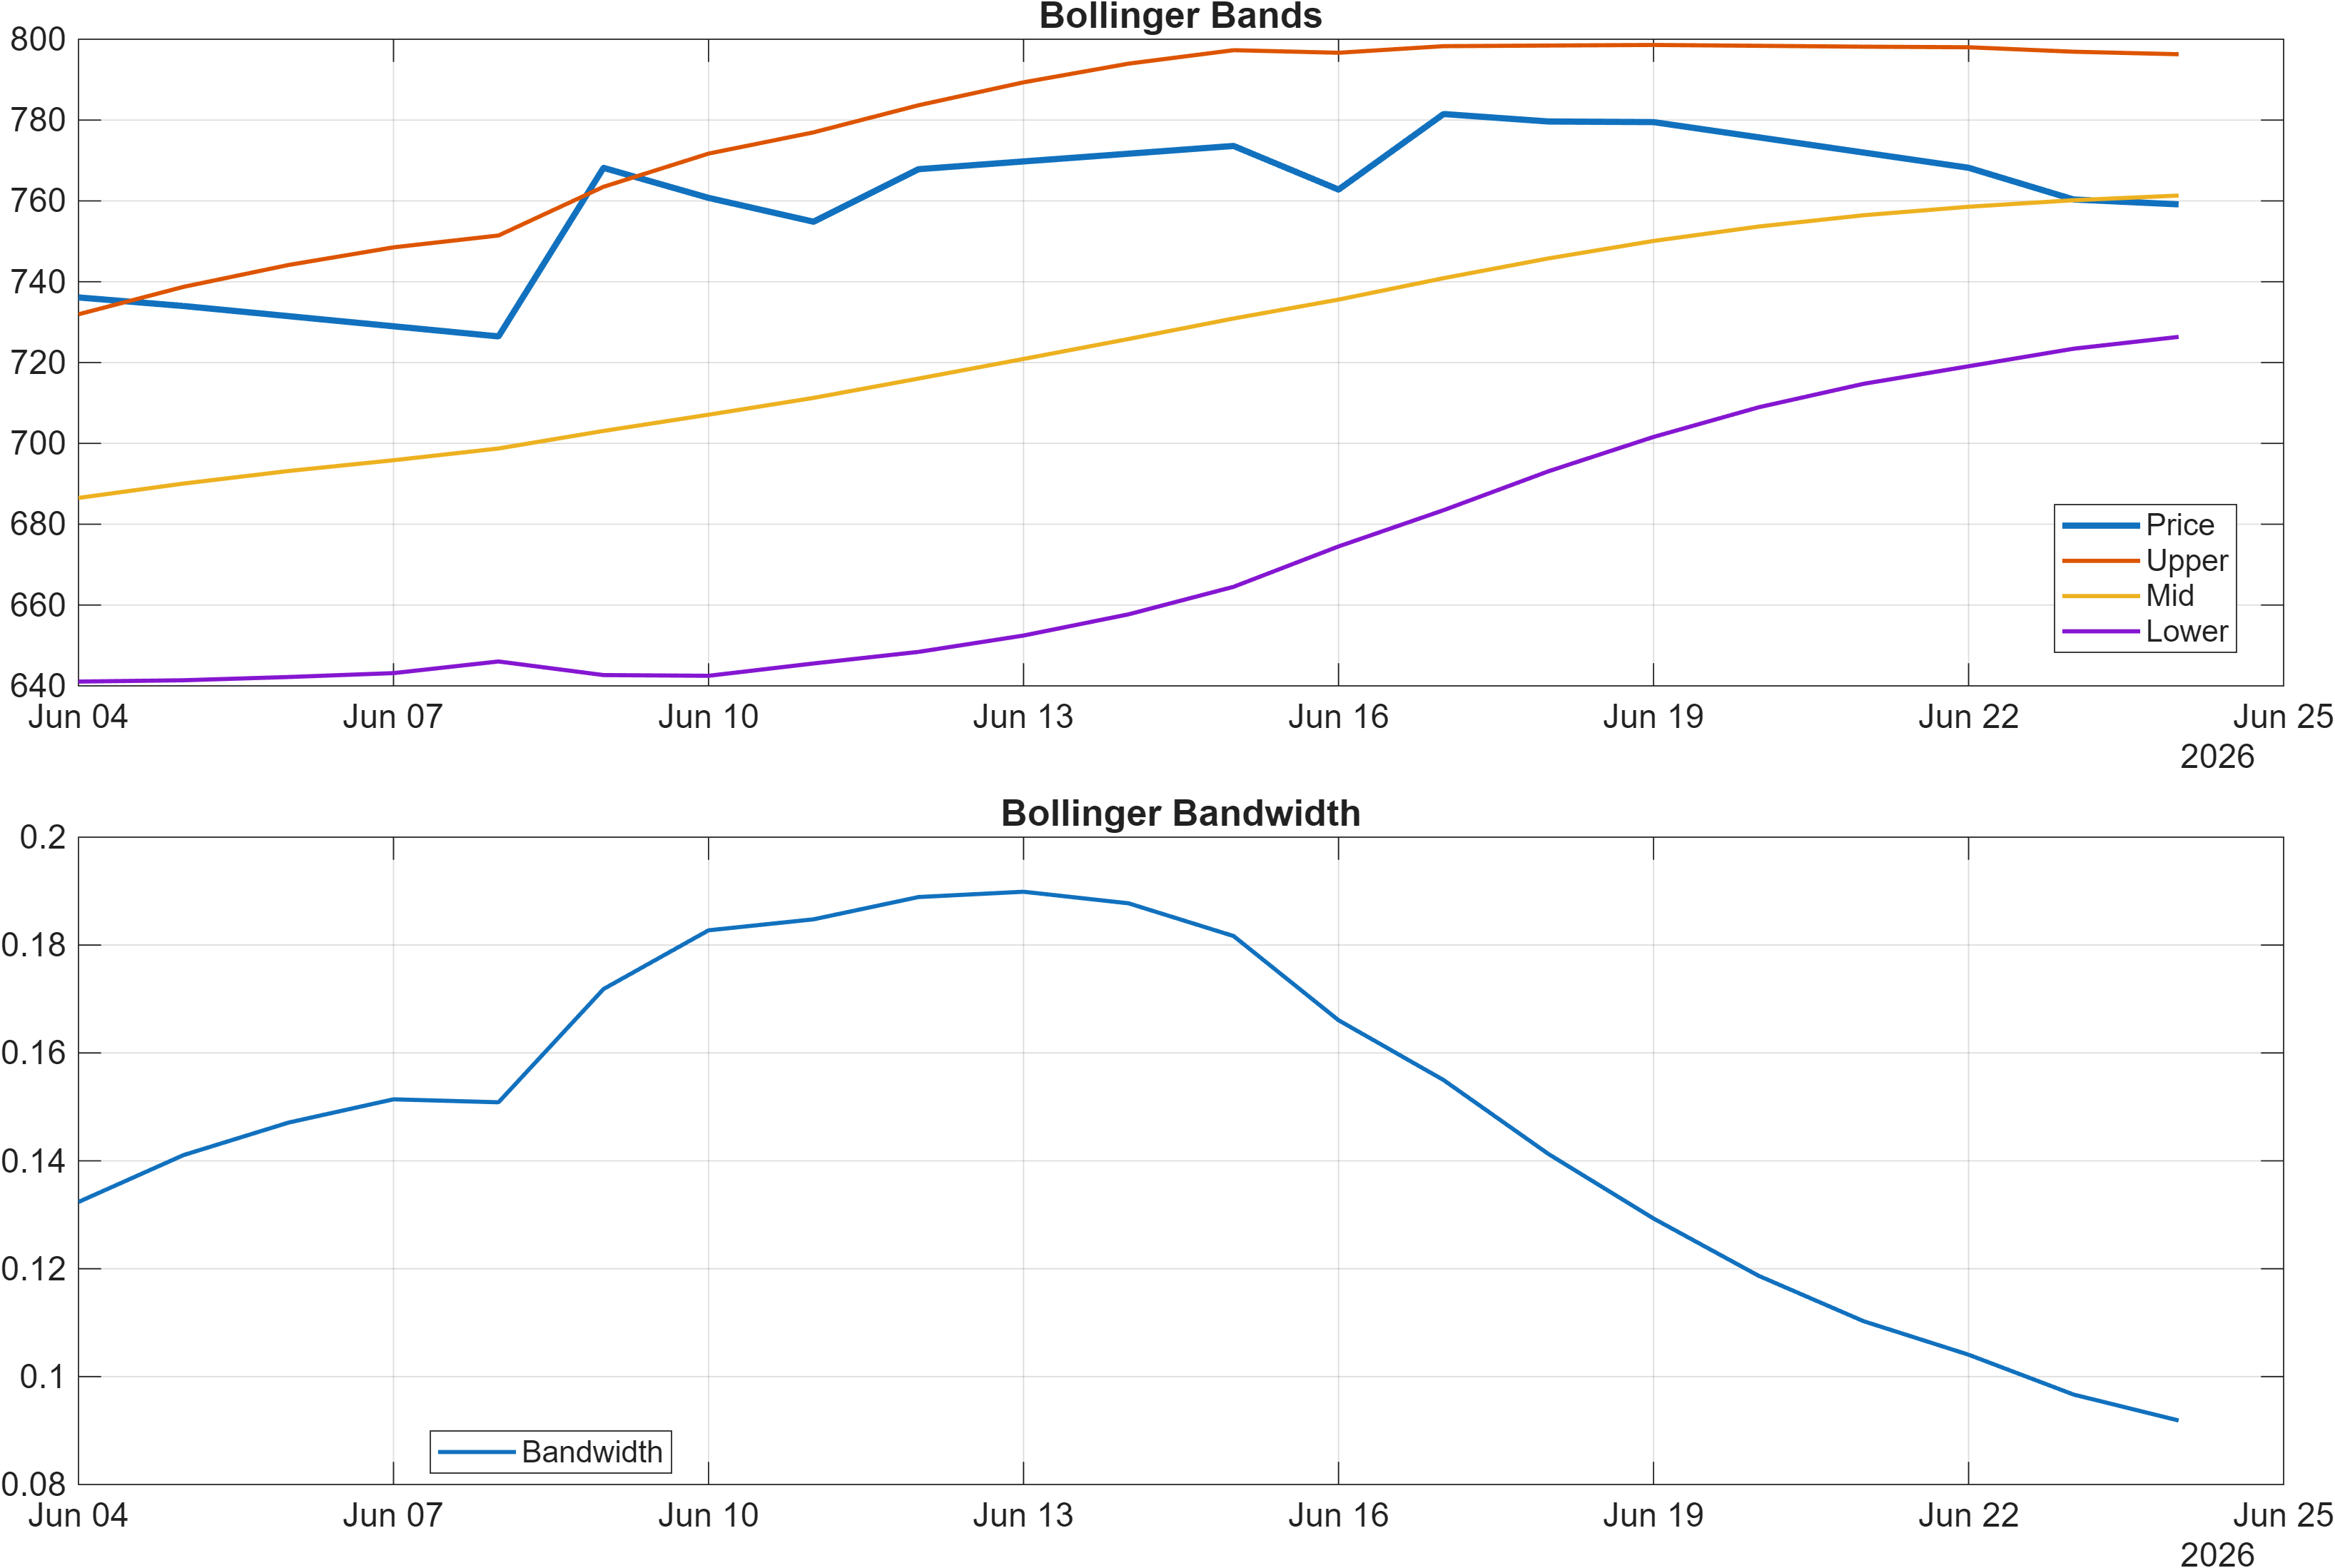
Interpretation: Bandwidth (volatility regime) latest = 0.0919.
Momentum is not providing the kind of synchronized confirmation that typically supports higher-probability trend continuation. RSI(14) at 48.95 sits near the midpoint, consistent with a market in balance rather than one building sustained upside pressure. At the same time, the MACD histogram at -3.7634 points to negative momentum impulse, which is often observed when rebounds lose force or when price advances become less efficient.
The signal table adds nuance by showing Stoch %K at 12.14 as bullish—often interpreted as an oversold-style condition—while trend/momentum measures like TS Accel at -51.57 print bearish. That mixture can occur when a market becomes short-term stretched to the downside but remains in a broader weakening phase. In those regimes, bounces can occur, yet they may struggle to convert into durable trend extension unless MACD and acceleration measures improve.
Volatility is relatively compressed with Bollinger bandwidth at 0.0919. Compression frequently precedes expansion, but direction is not implied. Here, the cross-sectional ranks (daily #998, weekly #1050) and negative MACD impulse lean toward treating any volatility expansion as potentially asymmetric to the downside unless price reclaims resistance. Conversely, if compression breaks upward and holds, it would be one pathway to reconcile the bearish ranks with the still-positive moving-average posture.
Net: the dashboard looks less like a clean trending profile and more like a transition state—neutral RSI, negative MACD impulse, and low-volatility compression—where confirmation should be demanded at key levels rather than assumed from any single indicator.
4) Support / Resistance zones
Support ~ 661.4250 | Resistance ~ 786.6917
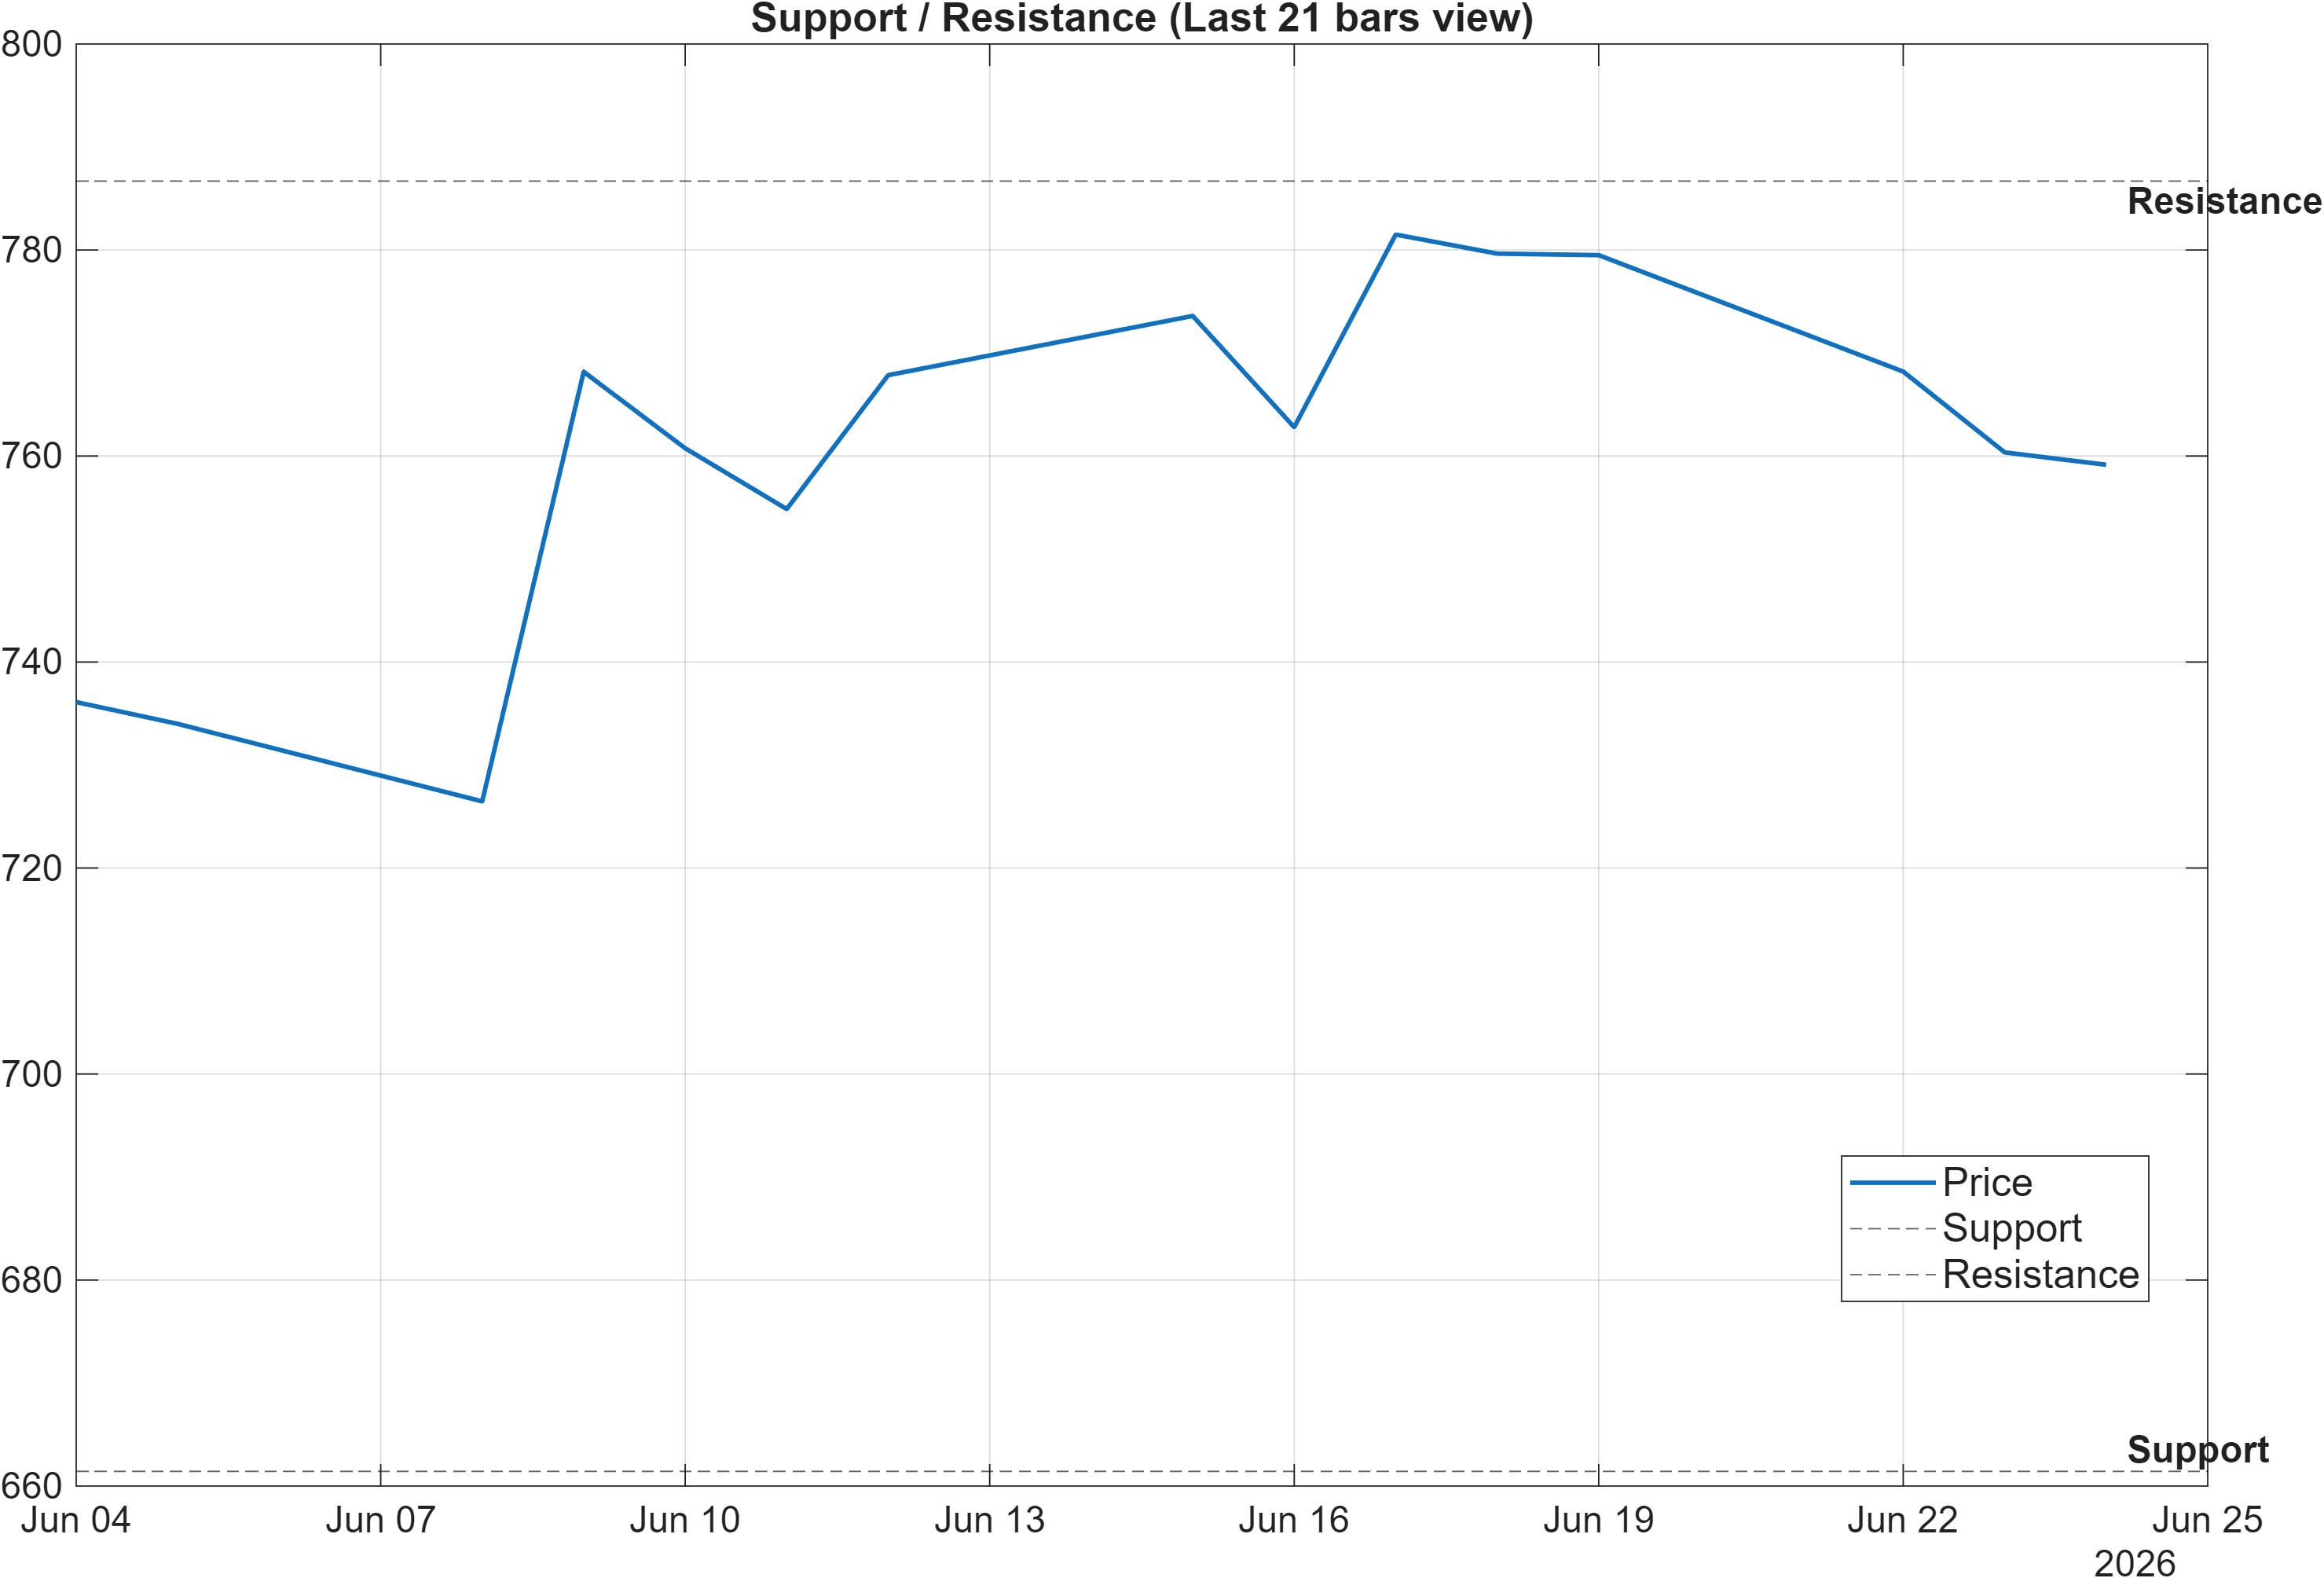
The current technical narrative is most actionable when anchored to the two probabilistic decision zones: 661.4250 as support and 786.6917 as resistance. With ranks deeply bearish (monthly #1155), these levels function less as “targets” and more as validation gates for whether the instrument can escape weak relative positioning.
The report’s scenario framing is explicit: a break above 786.6917 with volume is the continuation condition, while a close below 661.4250 increases deterioration risk. Those conditions interact directly with the momentum state. Because MACD histogram is -3.7634 and RSI is 48.95, the market currently lacks strong internal confirmation; therefore, level breaks deserve more weight than marginal indicator changes.
Volatility compression (bandwidth 0.0919) further increases the importance of these zones. In compressed regimes, price can move from balance to directional expansion quickly, and false breaks are also common. That is where participation signals become relevant: several accumulation/distribution proxies in the dashboard are bearish (e.g., OBV slope and AD Line slope in the signal table), suggesting that upside breaks may require unusually clear volume support to reduce failure risk.
Tactically, the cleanest read is: above resistance, the moving-average posture gains credibility; below support, the bearish rank structure becomes more consistent with a breakdown pathway. Between the two, conditions resemble a range-resolution environment where confirmation is primarily structural rather than narrative.
5) Quant Technical Dashboard (18 Signals)
KGNAI AI Technical Analysis Score (Deep Reinforcement Learning): Rank #947 out of 1220 (Rank 1 represents the strongest technical positioning and a higher probability of favorable price behavior. As ranks increase toward the maximum, the probability of favorable outcomes weakens and bearish positioning becomes more dominant.) | Label: Neutral | Score: -0.552
18-Signal Technical Confluence Score: 0.000 (Neutral)
Overall Technical Score (18-signal confluence + DRL rank blend): -0.166 (Neutral)
Note: The blended score reflects signal strength weighted against broader AI technical ranking, which may temporarily diverge.
Blended technical score breakdown: -0.166 (Neutral | Bull 7 / Bear 7 / Neutral 4)
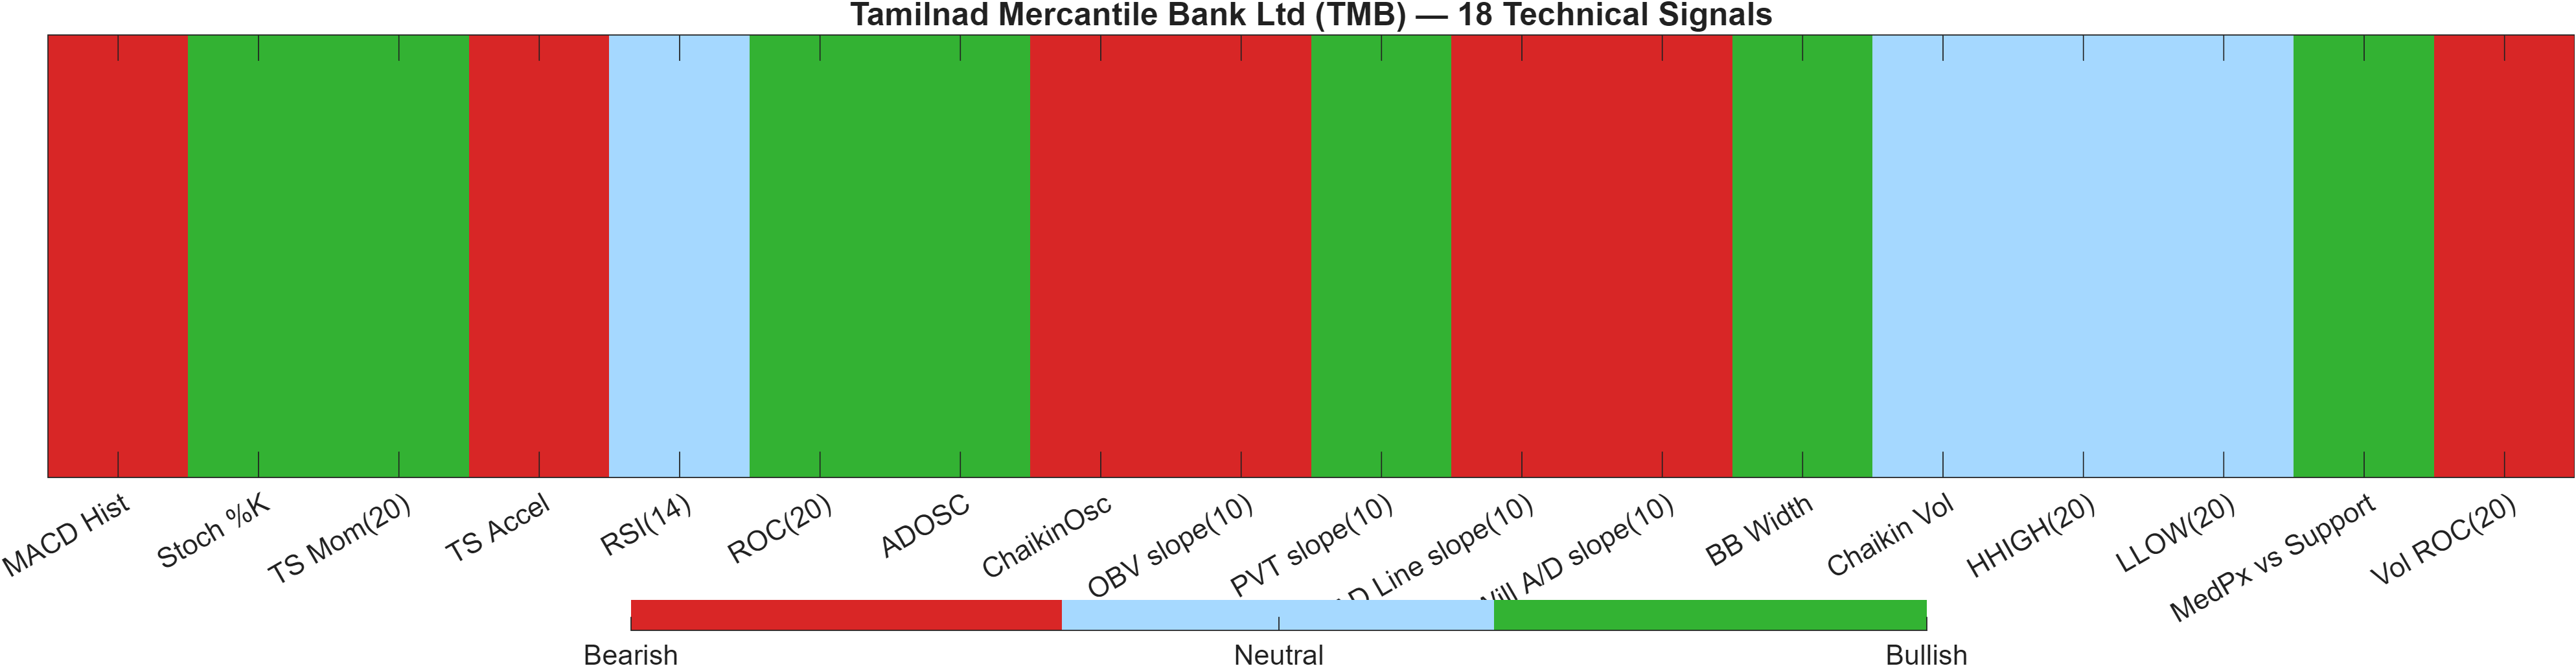
Signal balance: neutral confluence with internal disagreements
The 18-signal layer is mathematically neutral (confluence 0.000) with a balanced split (Bull 7 / Bear 7 / Neutral 4), and the blended outcome remains neutral at -0.166. This “flat” aggregate is useful because it explains why the moving-average view can look constructive while the broader rank posture remains bearish: the technical stack is not delivering a decisive majority signal in either direction.
Under the surface, several signals describe a participation and impulse mismatch. Momentum impulse is weak via MACD Hist -3.763 (bearish) and TS Accel -51.57 (bearish), while shorter-cycle measures such as Stoch %K 12.14 read bullish—often consistent with short-term mean-reversion pressure rather than sustained trend strength. On the participation side, the table flags bearish readings for OBV slope(10) at -1.251e+04 and AD Line slope(10) at -2.305e+04, which can indicate that rallies are not being confirmed by volume-based accumulation proxies.
The DRL technical rank is #947 out of 1220 with a score of -0.552 and a neutral label. That placement is still in the weaker portion of the universe, aligning more closely with the KGNAI cross-sectional ranks (#998 / #1050 / #1155) than with the bullish moving-average interpretation. When a neutral confluence coexists with a weak AI technical rank, the practical takeaway is that neutral does not mean low risk; it often means the system is waiting for a structural resolution—typically around the key levels already defined (661.4250 and 786.6917).
Signal table (Bull/Bear/Neutral)
| Indicator | Value | Signal |
|---|---|---|
| MACD Hist | -3.763 | Bearish |
| Stoch %K | 12.14 | Bullish |
| TS Mom(20) | 14.2 | Bullish |
| TS Accel | -51.57 | Bearish |
| RSI(14) | 48.95 | Neutral |
| ROC(20) | 3.427 | Bullish |
| ADOSC | 16.99 | Bullish |
| ChaikinOsc | -7193 | Bearish |
| OBV slope(10) | -1.251e+04 | Bearish |
| PVT slope(10) | 186.6 | Bullish |
| AD Line slope(10) | -2.305e+04 | Bearish |
| Will A/D slope(10) | -75.4 | Bearish |
| BB Width | 0.09186 | Bullish |
| Chaikin Vol | -23.73 | Neutral |
| HHIGH(20) | 798 | Neutral |
| LLOW(20) | 731.3 | Neutral |
| MedPx vs Support | 101.4 | Bullish |
| Vol ROC(20) | -54.2 | Bearish |
Interpretation: Indicator-level signals form the base confluence, which is then adjusted using a separate AI-driven technical ranking model. The final technical score summarizes this combined view.
6) News sentiment + extractive gist
Note: Instrument-specific news matches were not found, so the digest includes broader market/sector headlines. Links are provided for verification.
Sentiment score (avg): -0.016 | Positive: 12% | Neutral: 63% | Negative: 25%
KGNAI AI News Sentiment Score (normalized -1 to +1): Not available (as of —) | Label: Not available | Overall news score: -0.02
Positive Developments
Recent coverage across major financial outlets indicates a modest constructive undertone centered on funding access and periodic risk appetite in financial markets. The tone is not strongly bullish (positive share is only 12%), but it suggests that pockets of liquidity and investor demand are still present, especially where balance-sheet and funding narratives remain intact. For TMB, this matters indirectly: a supportive backdrop for banking-sector funding and selective appetite can reduce stress at the margin even if the stock’s own technical posture is mixed. In this report, the role of the news layer is primarily contextual, complementing the otherwise bearish rank posture (daily #998, weekly #1050). With the sentiment average at -0.016, the constructive inputs appear more like stabilization signals than a dominant catalyst, implying that technical confirmation at 786.6917 would still be needed to validate a stronger price narrative.
Neutral / Mixed Developments
The prevailing sentiment is dominated by neutral classification (63%), consistent with an information flow that is descriptive rather than directional. Several themes appear to blend market mechanics (rotations, rate expectations, cross-asset positioning) with sector-level observations, producing a mixed signal for risk-taking. That neutrality aligns with the report’s technical state: RSI(14) at 48.95 is neither extended nor trending, and volatility remains compressed (bandwidth 0.0919). In other words, the news flow is not forcing a regime change; it is better treated as background noise that can amplify a breakout or breakdown once price resolves around the defined decision zones. With instrument-specific matches absent, conclusions should remain conservative.
Negative / Risk Signals
Risk-oriented coverage leans toward caution around concentrated market moves and valuation sensitivity, which can influence broader equity tone even when the subject matter is not directly tied to TMB. The negative share is 25% and the overall news score sits at -0.02, indicating a mild headwind rather than a severe risk-off regime. Within this report’s framework, that mild negativity becomes more relevant because the cross-sectional ranks are already bearish (monthly #1155) and momentum impulse is negative (MACD histogram -3.7634). When technical impulse is weak, even moderate risk aversion can matter more at the margin—particularly if price drifts toward 661.4250, where a close below support is explicitly framed as deterioration risk.
- Whether sentiment mix (12% / 63% / 25%) shifts materially as price approaches 661.4250 or 786.6917.
- Any change in momentum confirmation as MACD histogram (-3.7634) and RSI (48.95) respond to level tests.
- Signs that volatility compression (0.0919) transitions into expansion with directional follow-through.
Sources referenced: Reuters, Bloomberg, Yahoo Finance, MarketWatch, Investing.com
Snapshot: AI Rank (Short–Mid–Long): Bearish (Bearish–Bearish–Not available) · Technical Confluence: Neutral · Key Levels: Support ~661.42 | Resistance ~786.69 · News Sentiment: Neutral
7) Sources
Not available in the provided data.
You may also like: How KGNAI AI ranks instruments across global markets
Disclaimer: KGNAI provides AI-generated analytics and educational market commentary only. This is not financial advice. Markets involve risk. Always do your own research.