OG Fan Token (OG-USD) Technical & Rank Review (14-Jun-2026) — Neutral short-term, bullish mid-to-long bias
OG Fan Token (OG-USD) enters 14-Jun-2026 with a mixed regime: cross-sectional ranks tilt constructive over longer horizons while near-term positioning remains more balanced. In KGNAI’s 800-instrument crypto universe, the monthly rank #15 and 3-month rank #77 point to upper-tier relative behavior, yet the daily rank #206 and weekly rank #287 are neutral, consistent with a market that is still working through shorter-term structure. On the chart-based layer, moving-average relationships flag bearish trend alignment (close vs MA50 and MA50 vs MA200 both bearish), while the momentum dashboard is less directional with RSI(14) at 46.3 and a modestly positive MACD histogram (0.0169). Volatility sits in a workable zone with Bollinger bandwidth at 0.2061, framing the nearby decision levels at support ~2.6353 and resistance ~3.4554.
- Rank stance: Short-term Neutral (daily #206, weekly #287) | Mid-term Bullish (monthly #15) | Long-term Bullish (3-month #77)
- Technical confluence label: Neutral (18-signal confluence 0.222; blended technical score 0.120; DRL rank #447)
- Key levels: Support ~ 2.6353 | Resistance ~ 3.4554
- News sentiment bias: Neutral on average (sentiment avg 0.047), with a higher normalized news score reading 0.61 (Bullish label)
- Confirmation / invalidation: A break above 3.4554 with volume supports continuation; a close below 2.6353 raises deterioration risk.
KGNAI evaluates assets using large cross-sectional datasets built from millions of structured data points. Inputs incorporate fundamental metrics, technical structures, and systematically processed news sentiment. Statistical models, machine learning, and AI frameworks are used to assess relative positioning, signal alignment, and probabilistic behavior across broad universes.
- Ranks are comparative across the tracked universe, not absolute price targets.
- Confluence reflects alignment among independent signal groups.
- Support/resistance levels are probabilistic decision zones, not guarantees.
- Sentiment provides contextual bias within the broader analytical framework.
1) KGNAI AI Analysis
Region: CRYPTO
Total universe size: 800 ranked instruments
- Daily rank: #206 out of 800 — Neutral
- Weekly rank: #287 out of 800 — Neutral
- Monthly rank: #15 out of 800 — Bullish
- 3-Monthly rank: #77 out of 800 — Bullish
The rank curve shows a horizon split: near-term placement is neutral (daily #206, weekly #287), while the longer sampling windows compress into stronger relative territory (monthly #15, 3-month #77). In cross-sectional terms, the monthly rank sits in the top decile of the 800-instrument universe, indicating that—over that horizon—OG-USD has exhibited more favorable return/volatility behavior than most peers in the tracked crypto set.
This divergence is analytically useful because it separates timing from regime. A neutral daily/weekly rank suggests the market is not consistently rewarding short-term setups right now, even as longer-horizon measurements remain constructive. That combination often appears when price is transitioning from a pullback into stabilization, or when participation is uneven across sessions.
KGNAI’s ranking statement remains symmetric: lower rank implies stronger probability of favorable behavior, higher rank implies weaker probability and more bearish positioning. With the longer horizons supportive but short-term mixed, the practical read is to treat new strength as needing confirmation from price/volume structure rather than assuming persistence from the monthly signal alone. Alignment back toward the monthly regime would typically be reflected by improvement in the daily/weekly ranks from the current neutral zone.
Term view: Short-term: Neutral. Mid-term: Bullish. Long-term: Bullish.
Want the full universe and complete rank tables? Unlock full access on KGNAI: https://www.kgnai.com/pricing
2) Price & trend overview
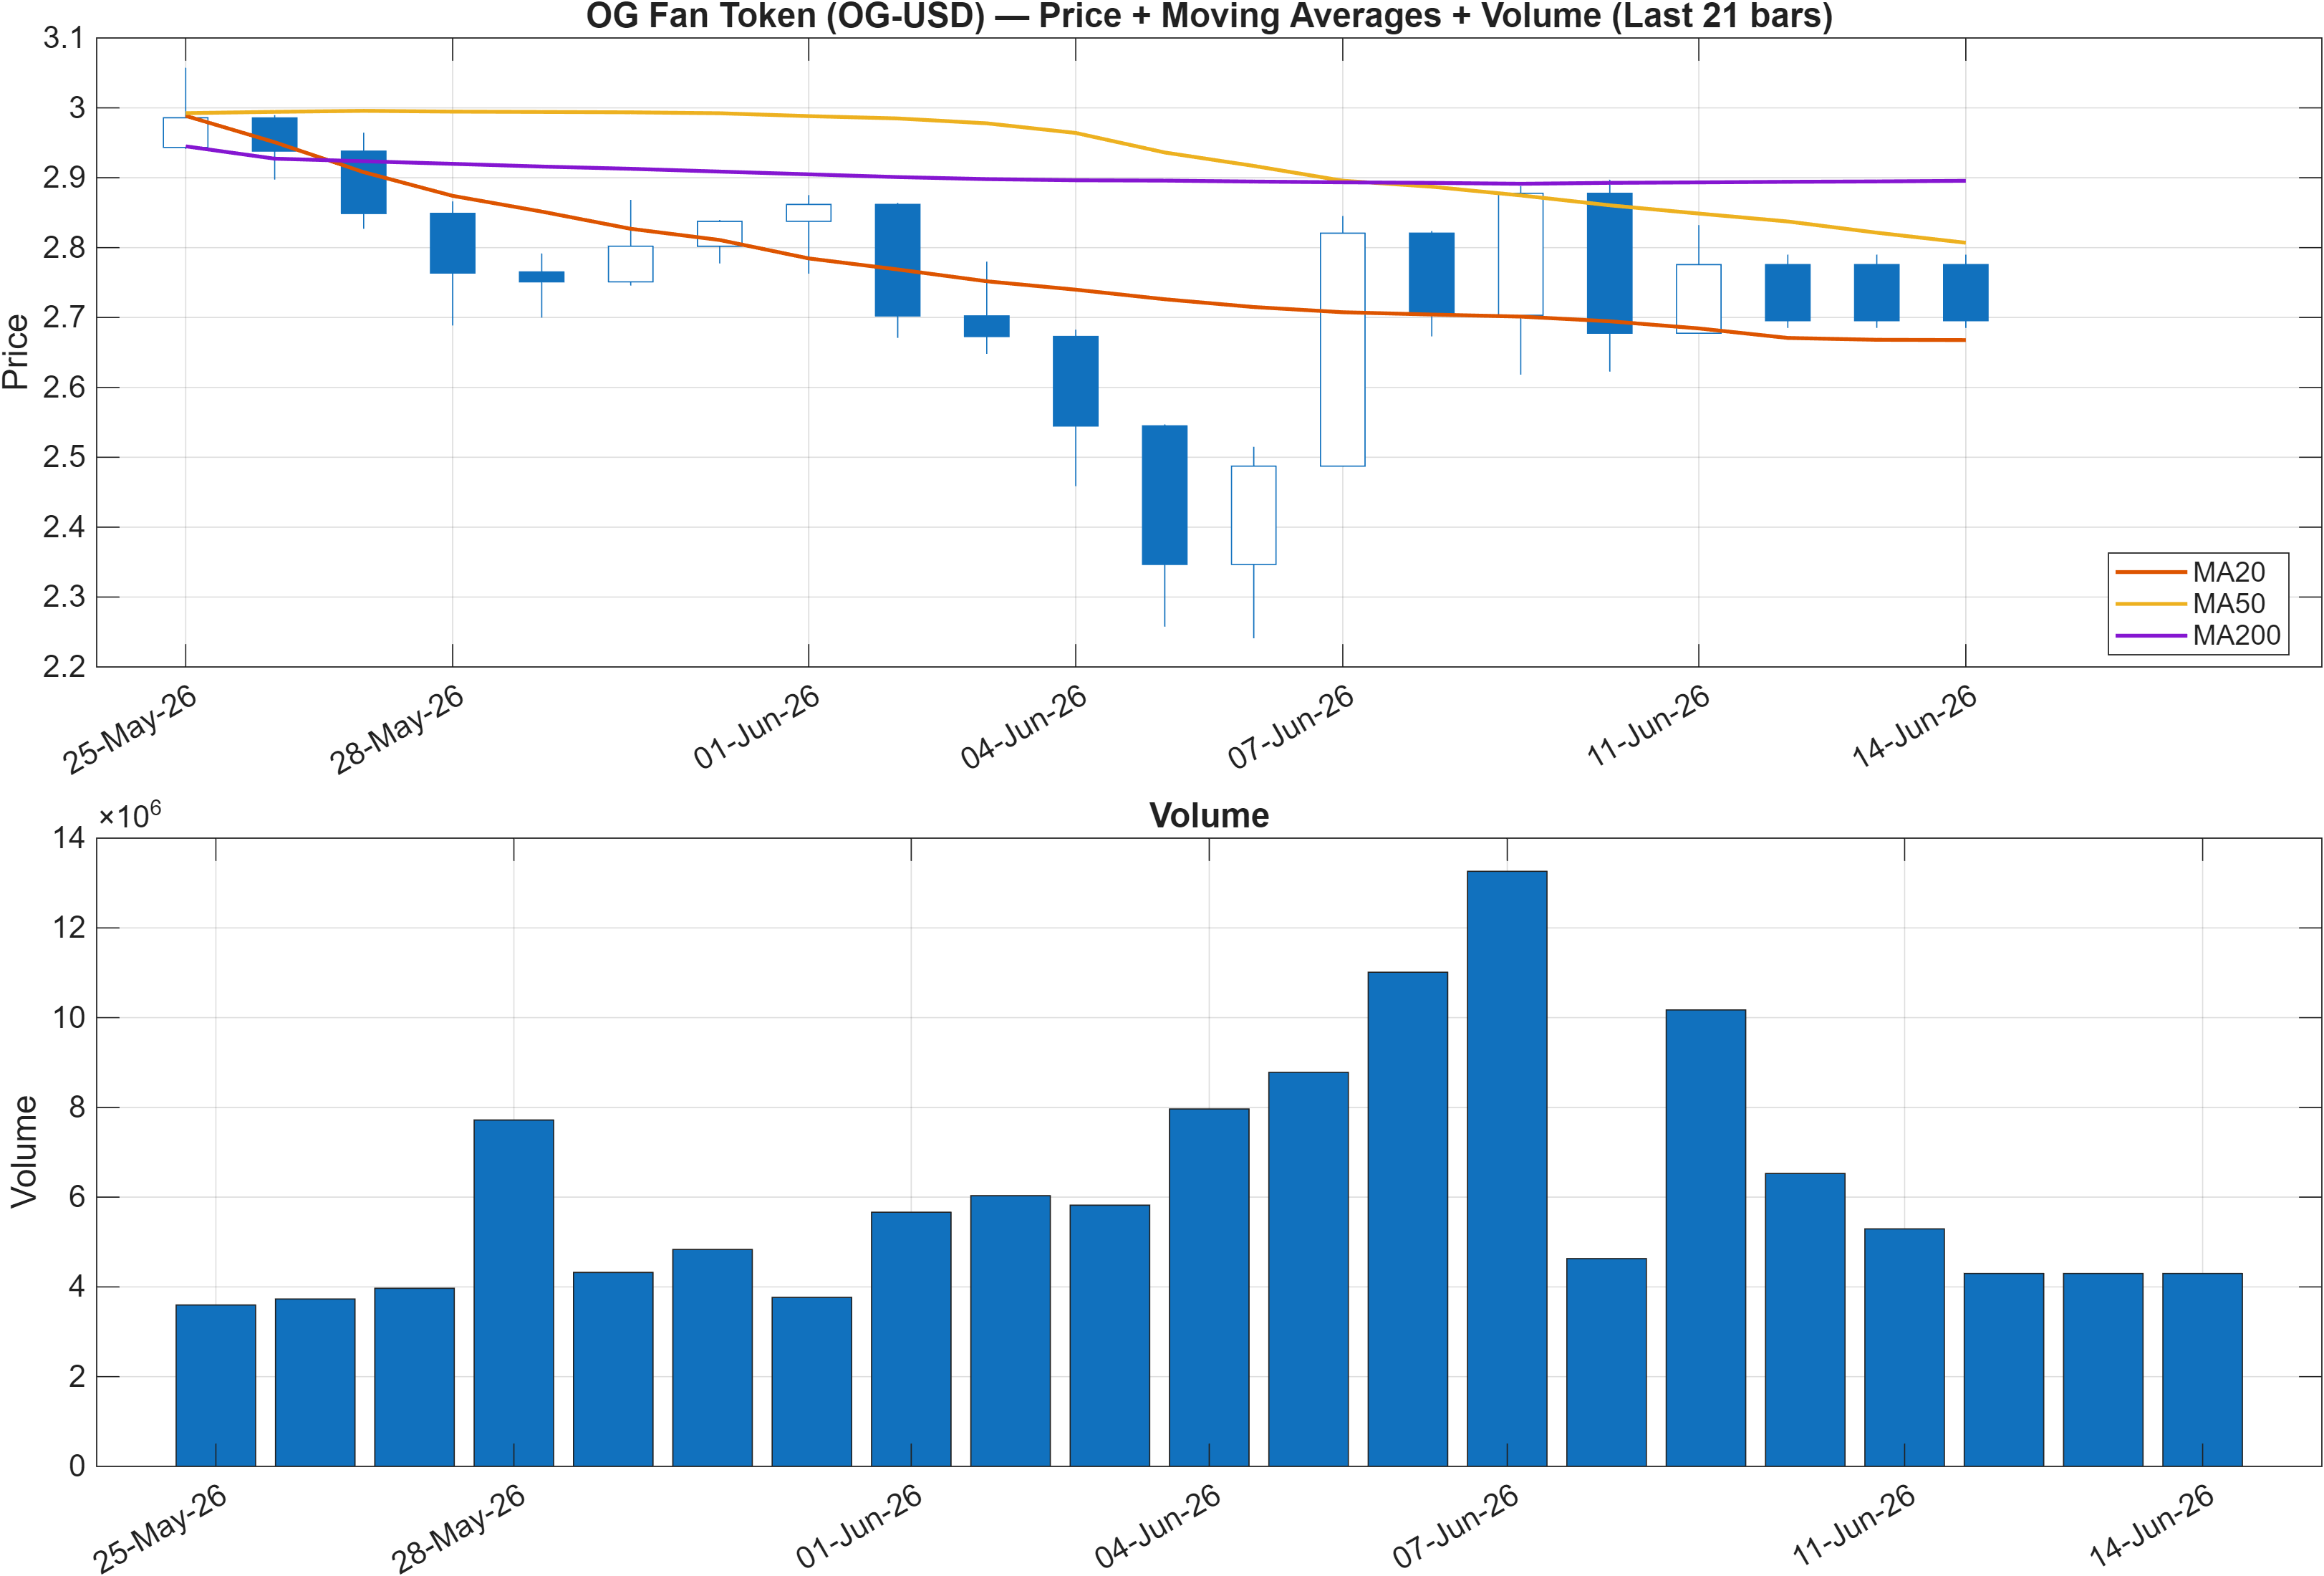
Interpretation: Close vs MA50 = Bearish, MA50 vs MA200 = Bearish.
Trend state: longer-horizon rank strength vs bearish moving-average geometry
The trend layer is currently defined by a bearish moving-average stack: the close is below the MA50, and the MA50 is below the MA200. That configuration typically implies the market is still repairing prior downside structure, even if shorter rallies occur. This is the key counterweight to the constructive longer-horizon ranks (monthly #15; 3-month #77): the cross-sectional profile has improved, but the classical trend template has not fully flipped.
In this context, the most important analytical question is whether price is in a transition (base-building while ranks improve) or merely in a counter-trend rebound. The answer is rarely provided by a single signal; instead, it emerges from how momentum and participation behave into resistance. The report’s nearby decision levels—support ~2.6353 and resistance ~3.4554—become the operational reference points for this regime test.
The bearish MA relationships also help explain why the short-term ranks remain neutral (daily #206; weekly #287): when the medium trend is still downward, short-term opportunities can be less repeatable and more sensitive to volatility bursts. Confirmation of a more durable trend repair would be more consistent with a move that holds above key levels while the momentum dashboard sustains improvement rather than briefly spikes.
3) Momentum & volatility dashboard
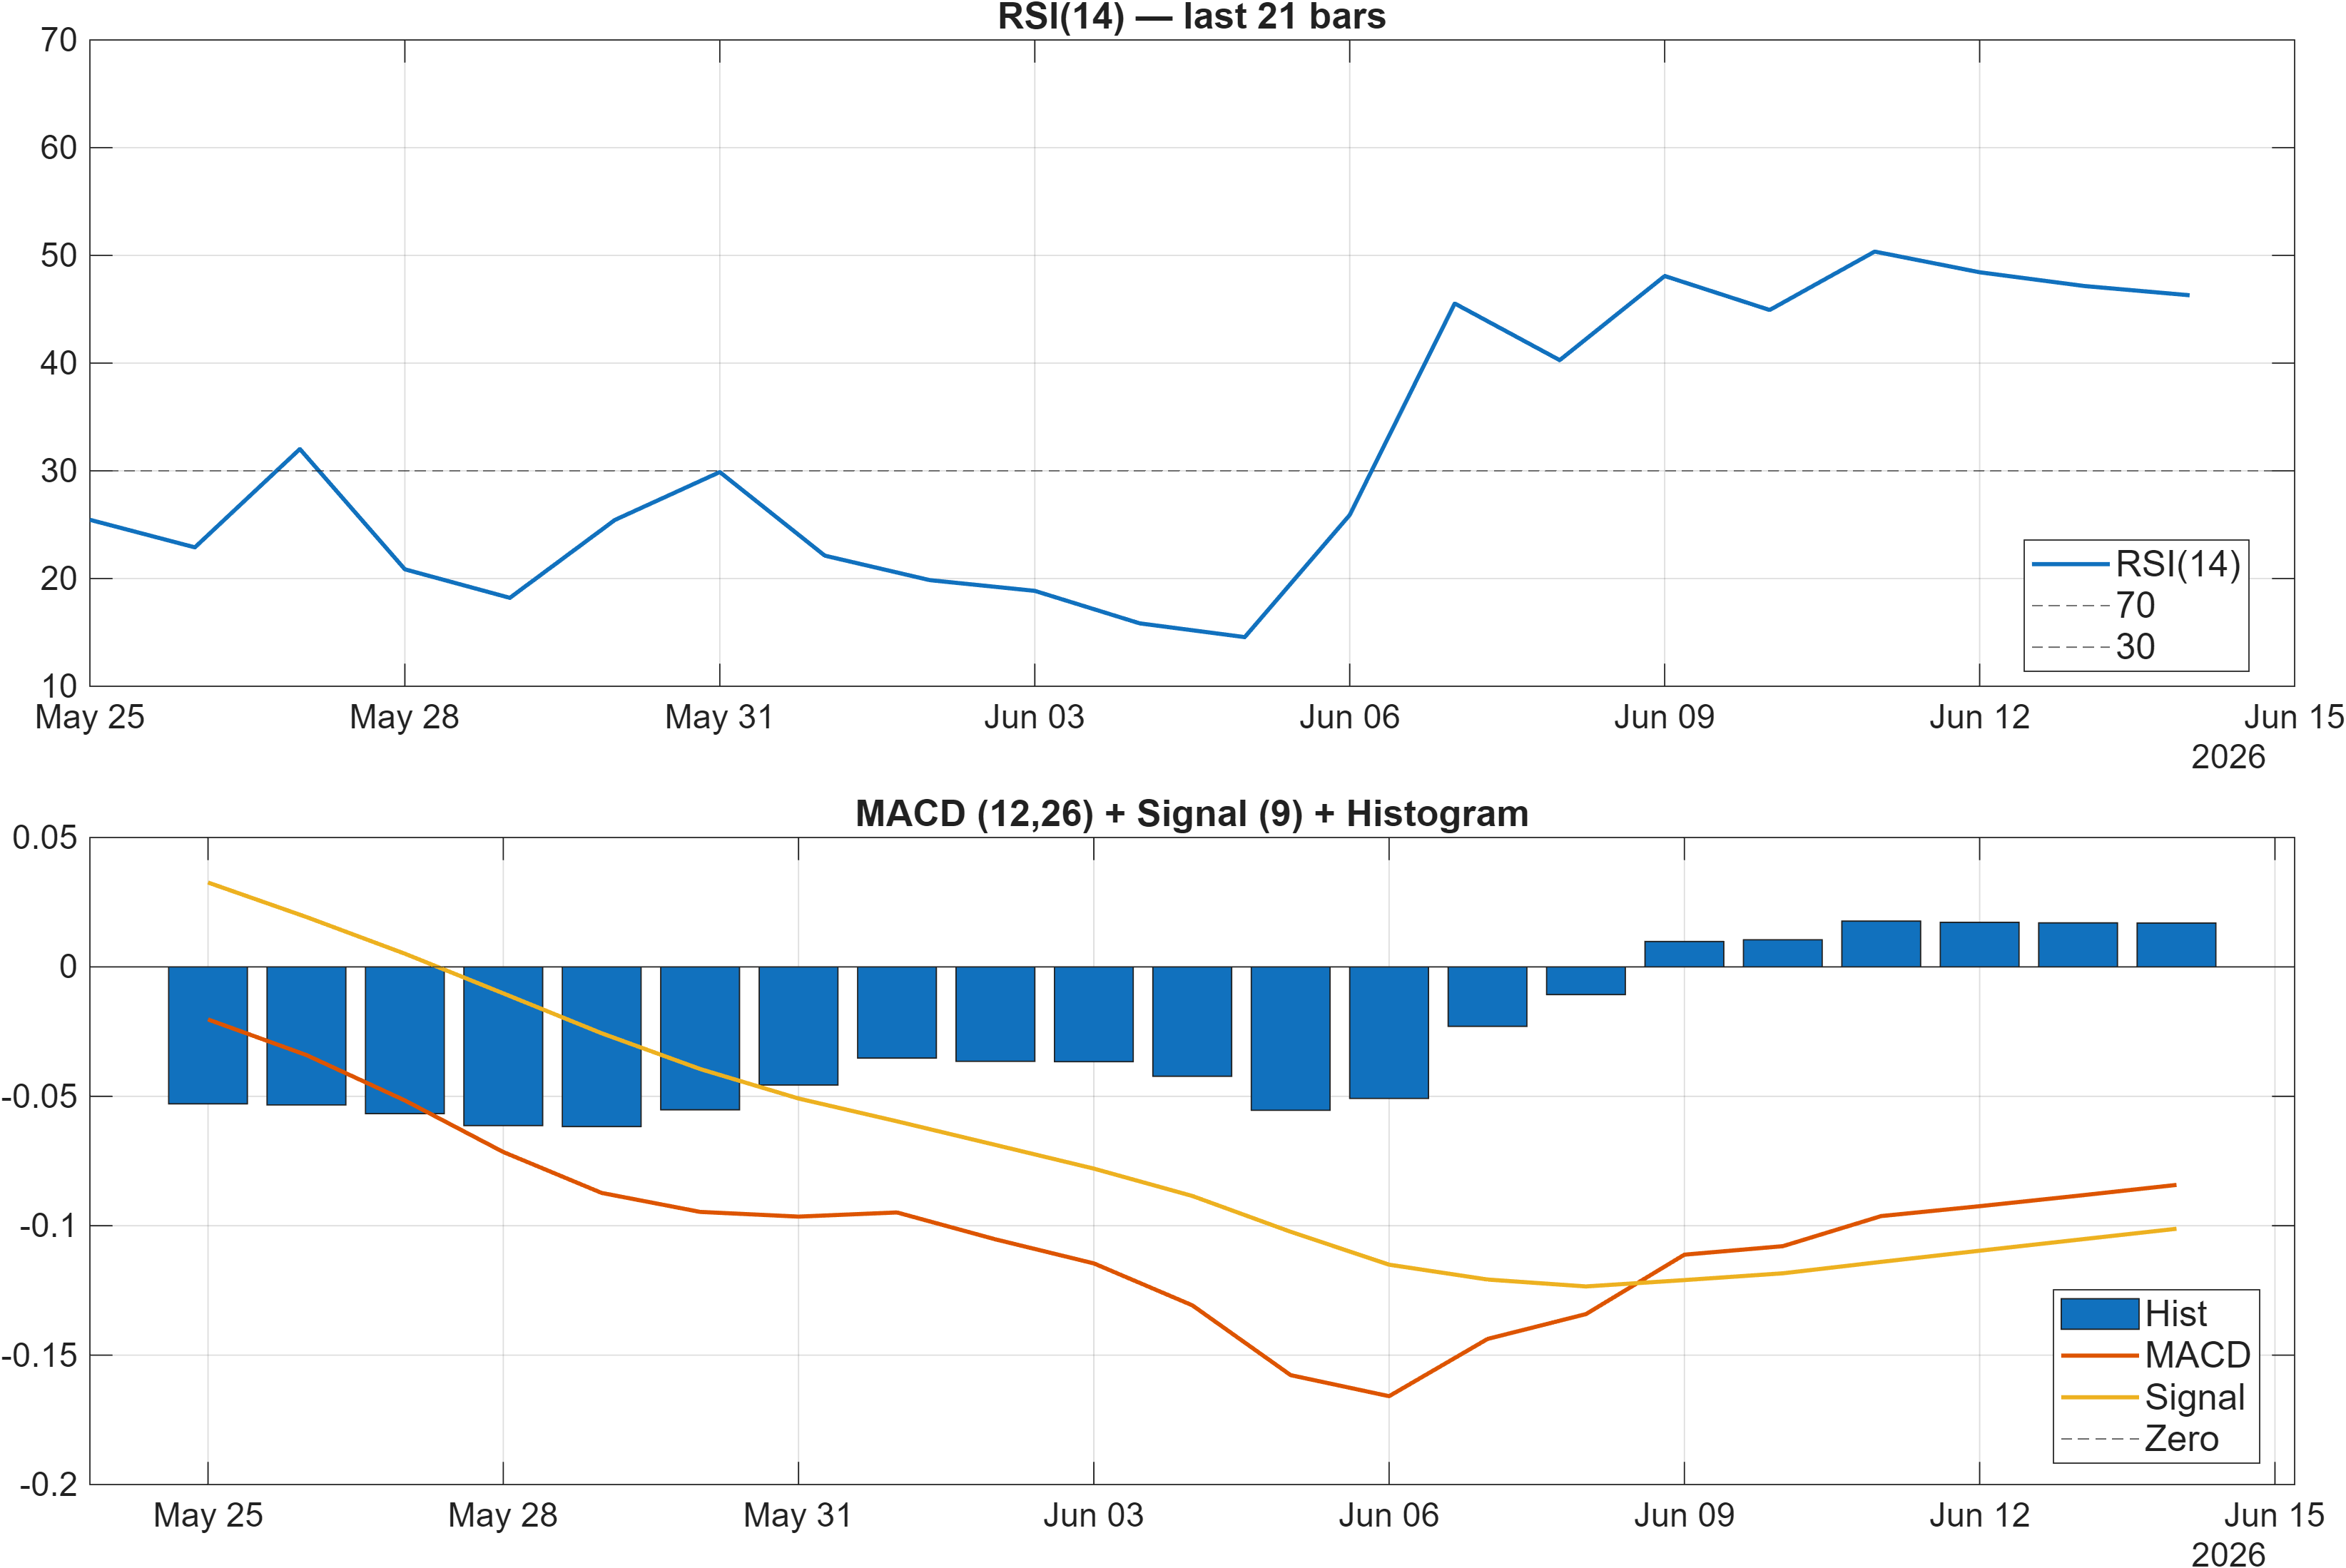
Interpretation: RSI bias = Neutral, MACD hist = 0.0169.
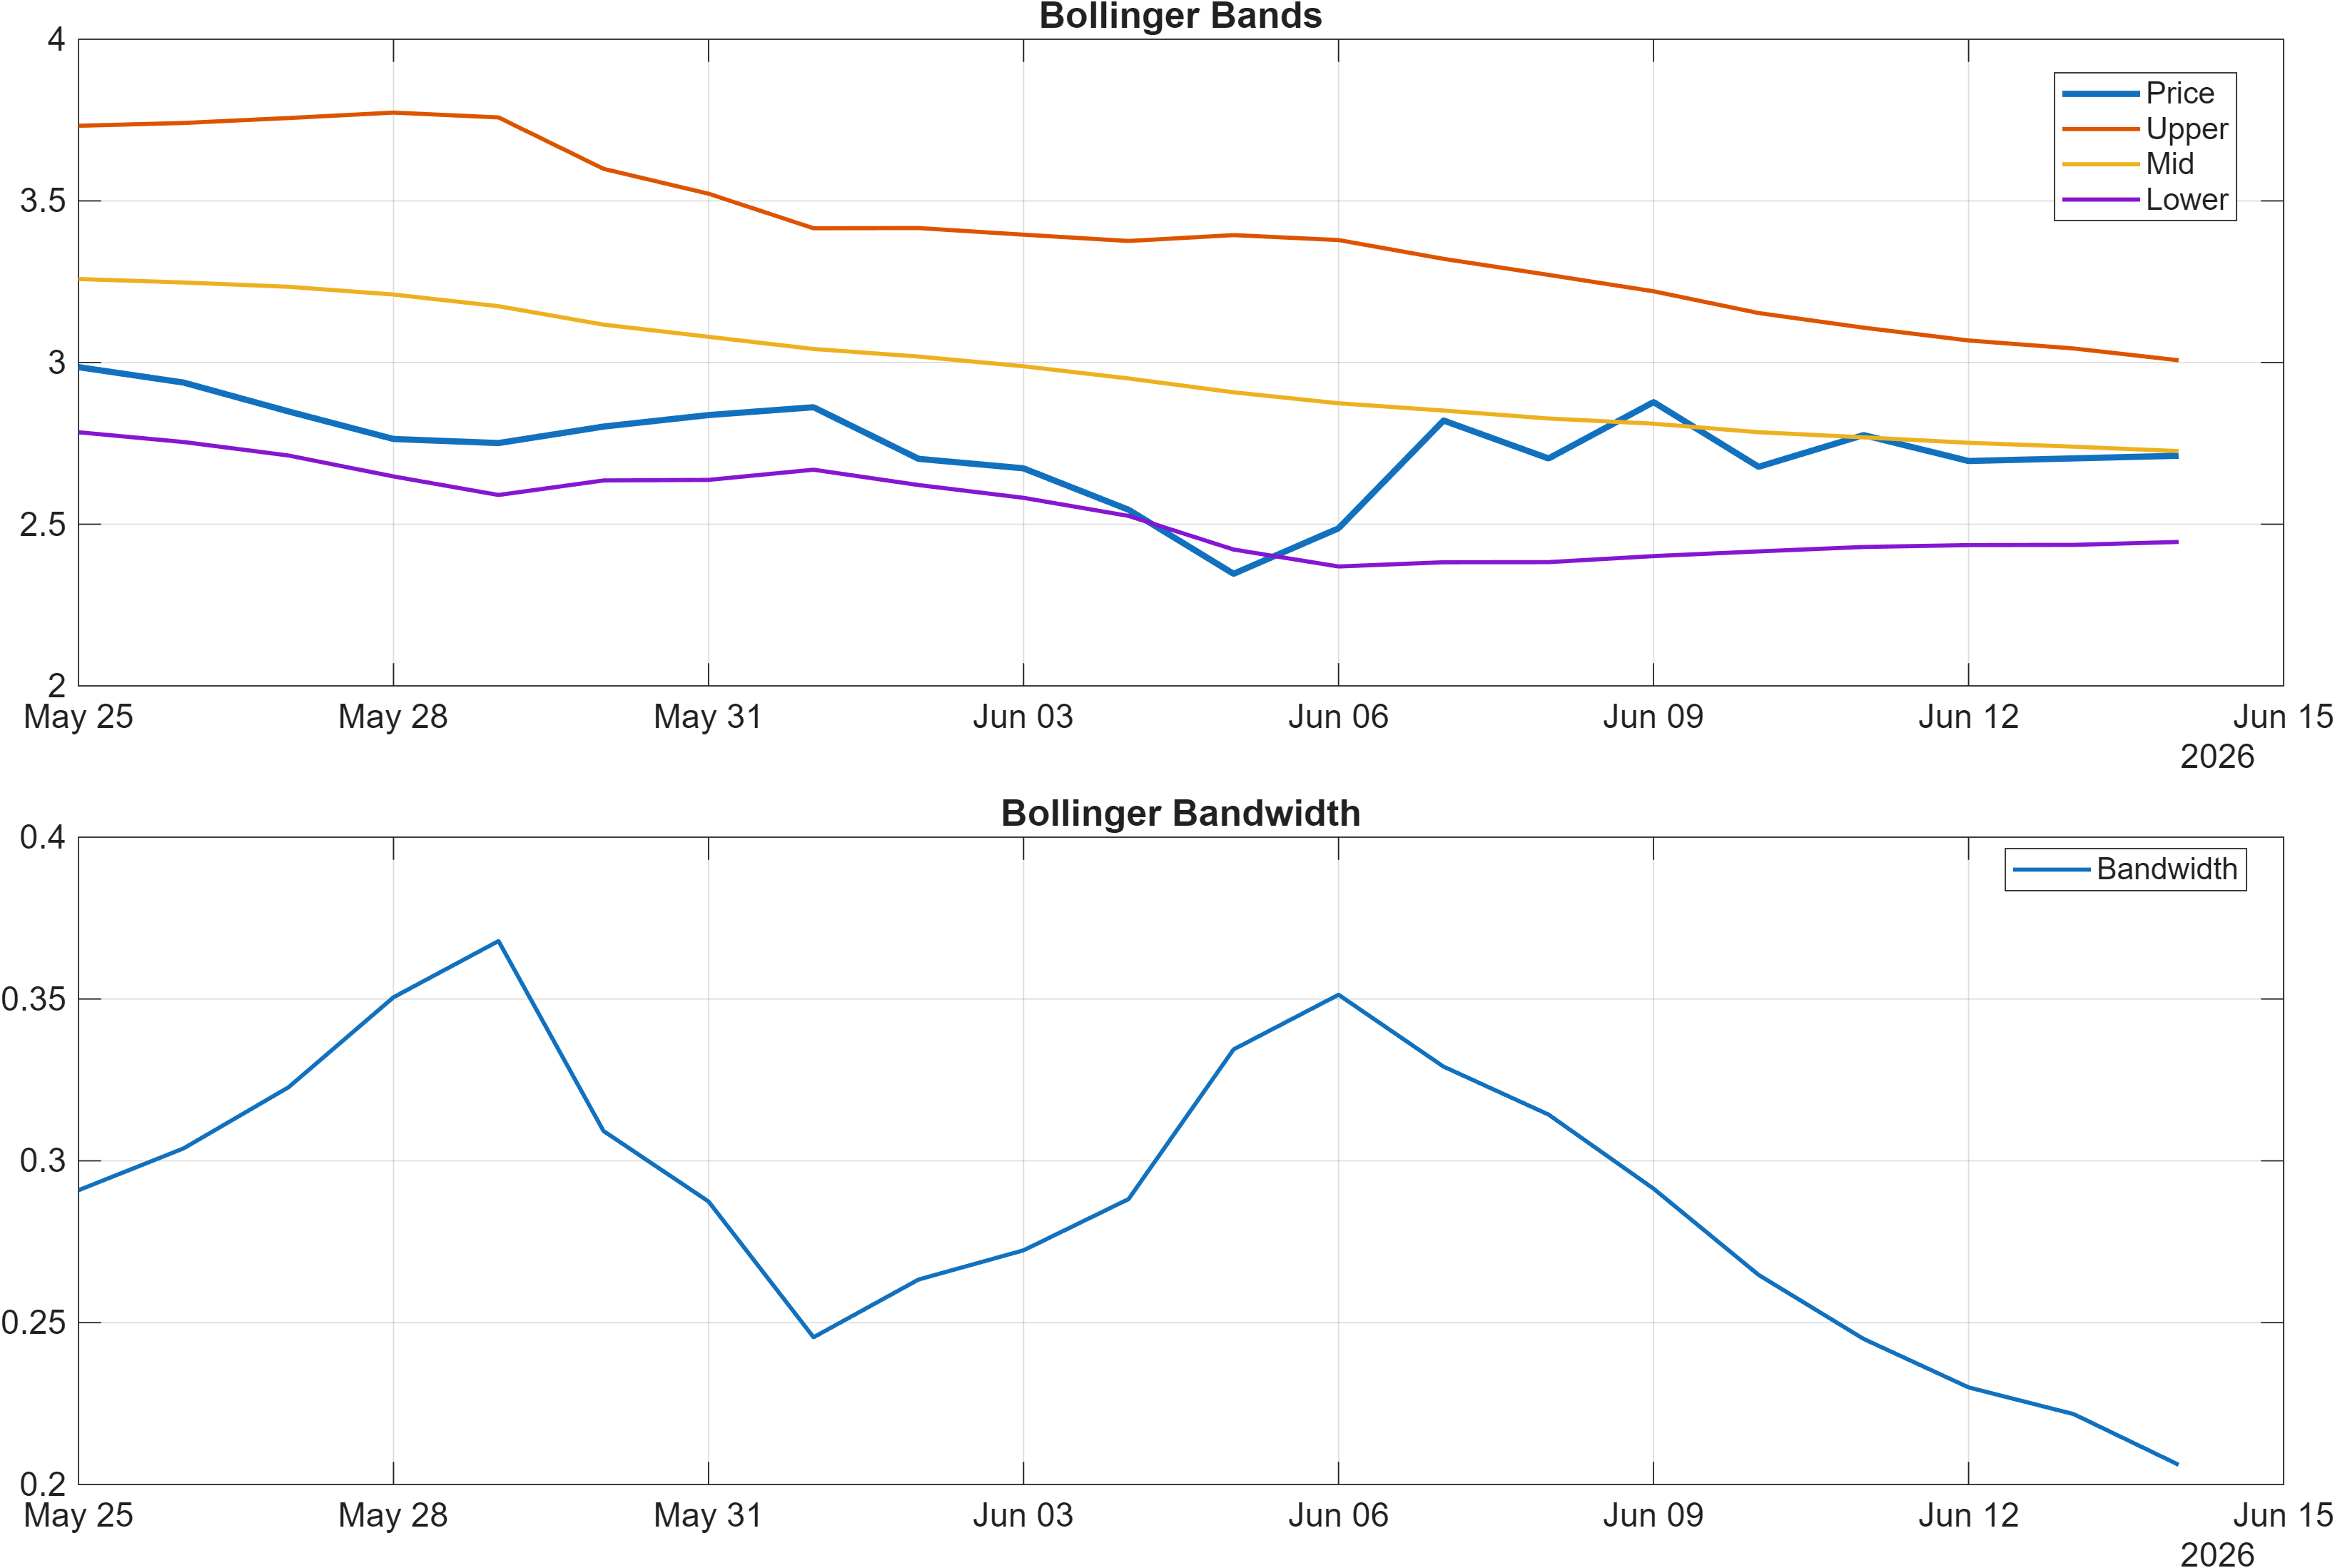
Interpretation: Bandwidth (volatility regime) latest = 0.2061.
Momentum: improving impulse, but not yet a strong thrust regime
The momentum cluster reads as stabilizing rather than accelerating. RSI is neutral with RSI(14) at 46.3, a level that often corresponds to range trade behavior rather than sustained trend pressure. At the same time, the MACD histogram at 0.0169 is positive, which can indicate that downside momentum is fading and short-term impulse is attempting to rotate upward.
The internal 18-signal table reinforces this mixed momentum message: TS Mom(20) at -0.2427 and ROC(20) at -7.706 are bearish, while MACD hist remains bullish. This combination is consistent with a market that may be recovering from a weaker 20-day window but is showing early signs of improvement in more responsive trend measures.
Volatility regime: bandwidth suggests room for directional expansion
Volatility is not extreme: BB Width at 0.2061 sits in a moderate zone, which can support either continuation moves or reversals depending on where expansion occurs relative to the defined levels. Practically, bandwidth that is not overly compressed reduces the likelihood that a breakout must be immediate; instead, it allows for a sequence where price tests 3.4554 while momentum confirms (or fails) and the short-term ranks attempt to improve from neutral.
4) Support / Resistance zones
Support ~ 2.6353 | Resistance ~ 3.4554
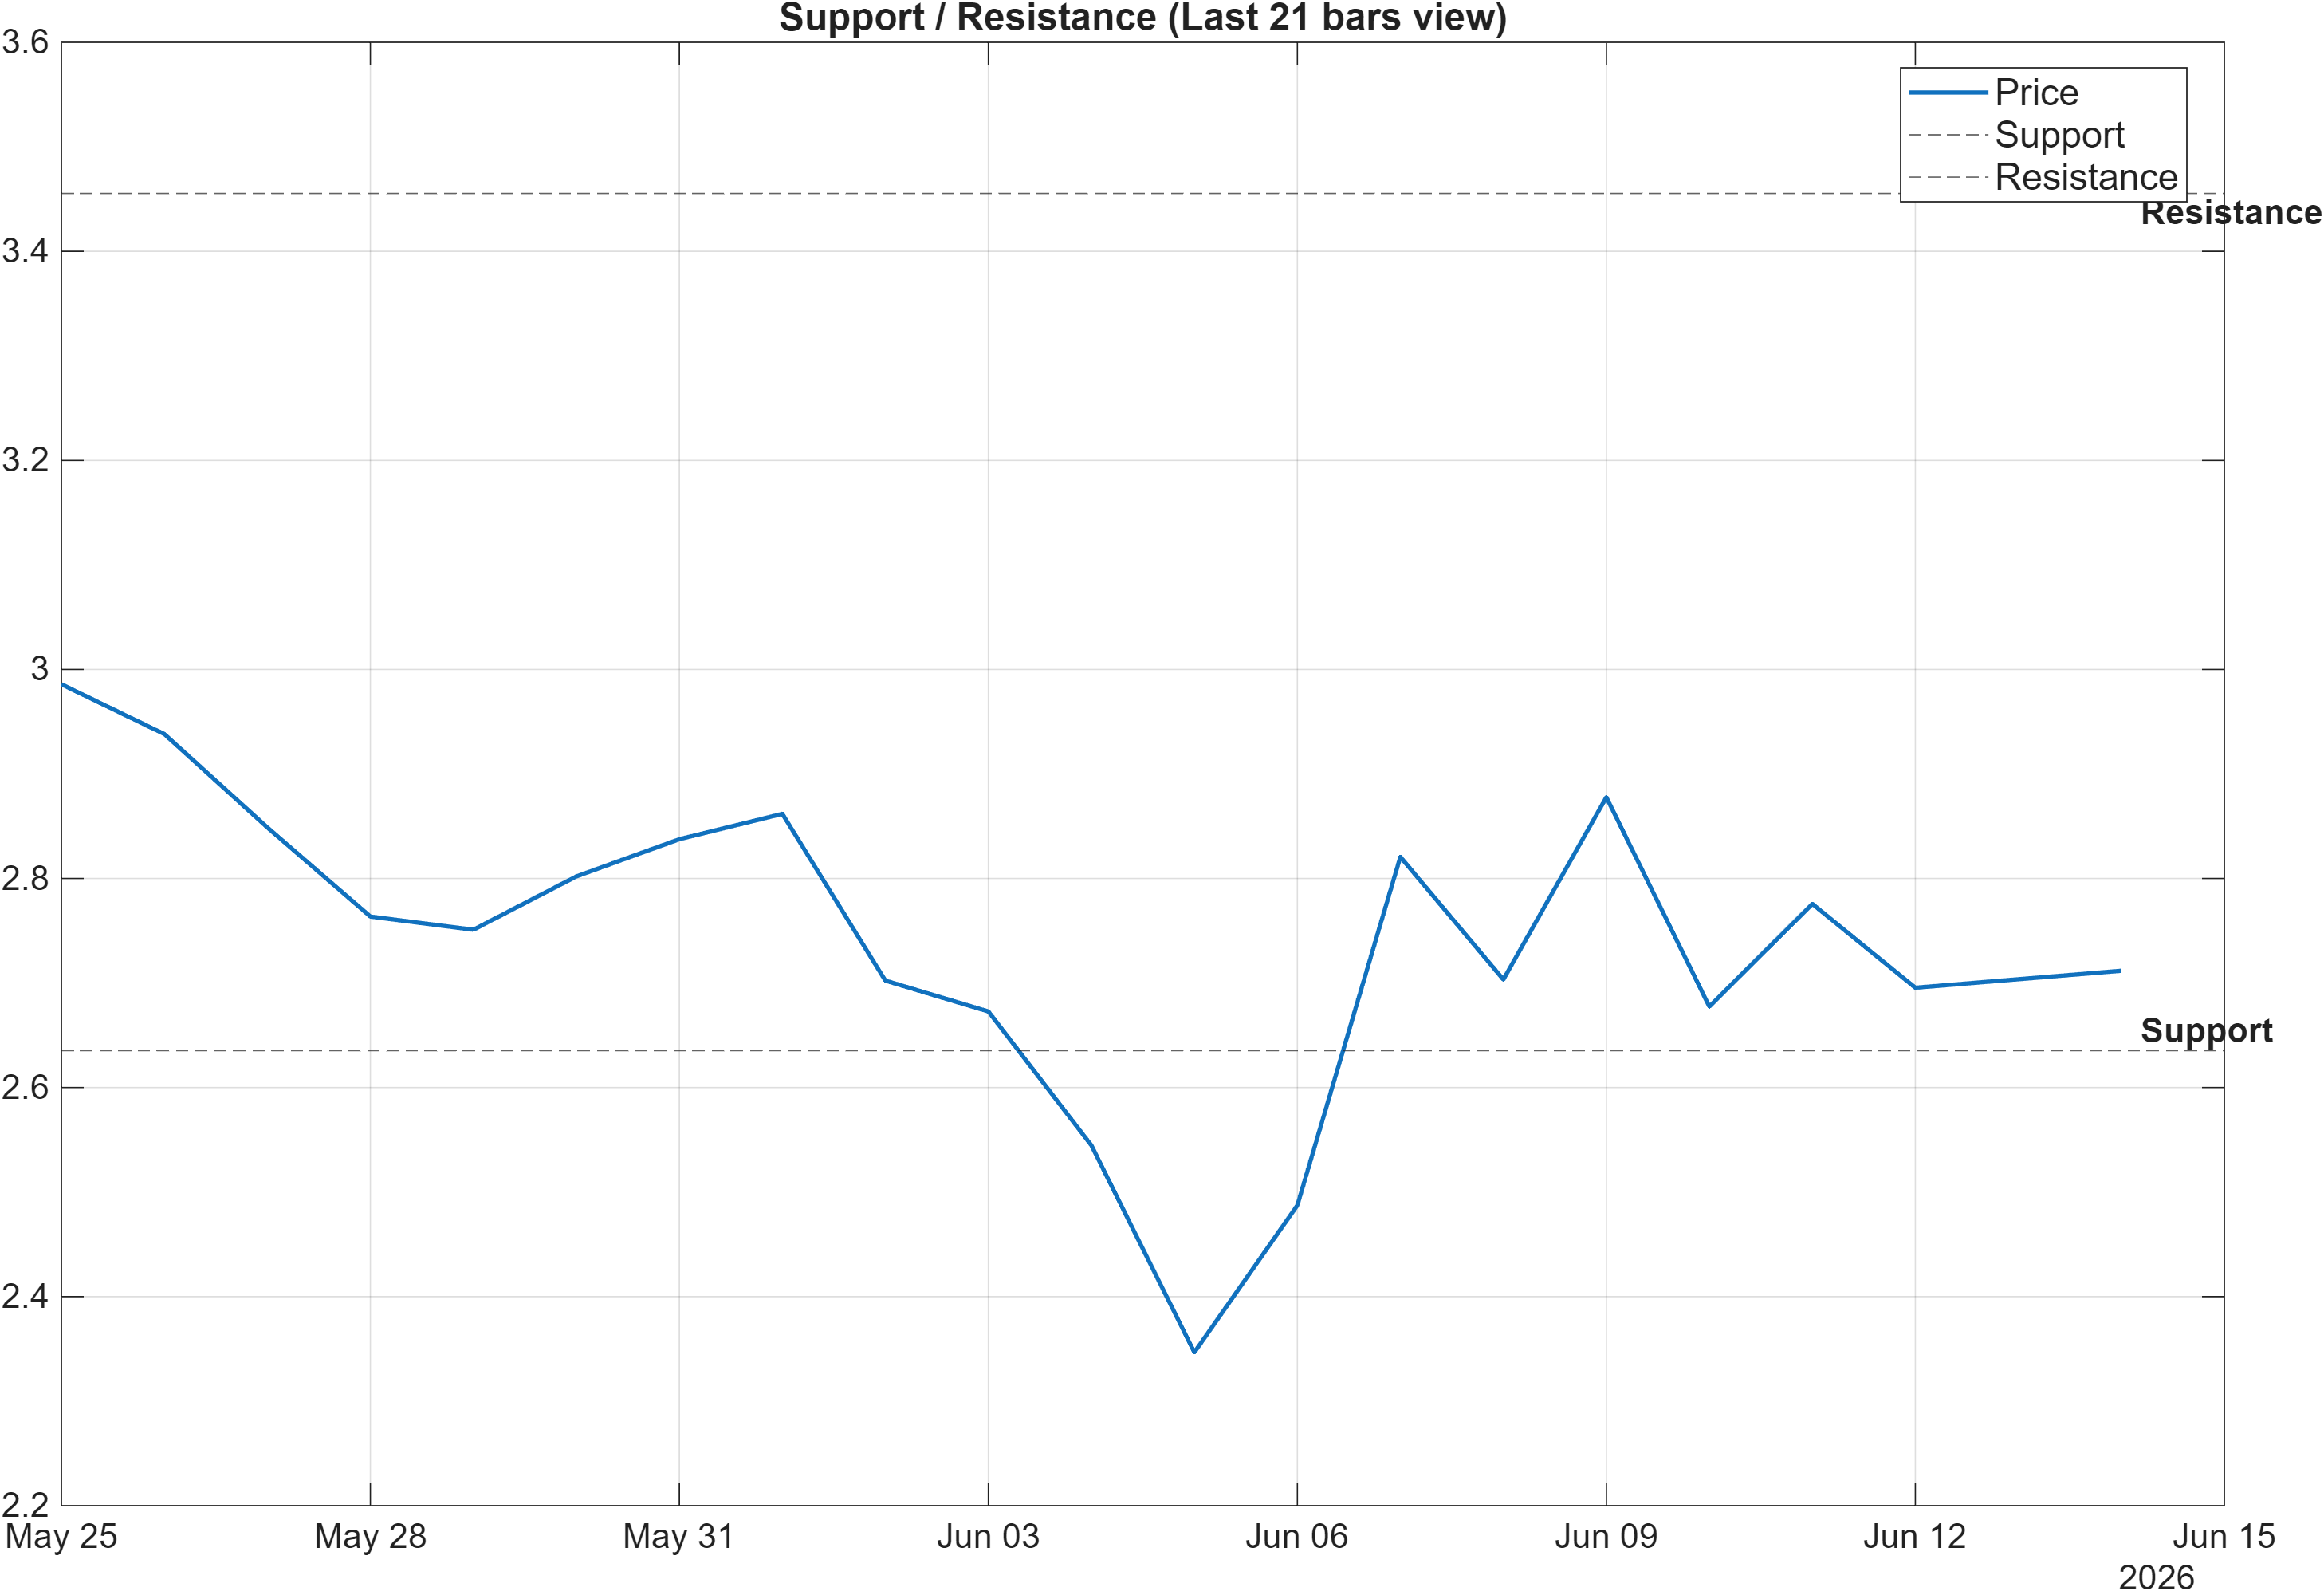
Scenario view: Break above resistance with volume → continuation. Close below support → signal deterioration risk.
Decision zones: mapping regime continuation vs deterioration
With the moving-average structure still bearish, the support/resistance framework becomes the primary way to separate repair from rejection. The support zone near 2.6353 functions as the market’s nearest “must-hold” area for preserving stabilization. A close below that level is explicitly flagged as deterioration risk, and would be consistent with short-term ranks remaining neutral or weakening.
Conversely, resistance near 3.4554 is the level that can force the market into a clearer directional choice. The scenario language emphasizes break above resistance with volume as a continuation condition. This matters because several participation-oriented signals inside the technical dashboard lean constructive (for example, ADOSC at 11.73 is bullish and Vol ROC(20) at 15.24 is bullish), suggesting that when price advances, there are signs of engagement—though not uniformly across all volume/flow measures.
The most informative behavior typically occurs during retests: if price approaches 3.4554 and momentum remains stable (RSI staying near or above the current neutral band around 46.3) while the MACD histogram stays positive near 0.0169, that would be more consistent with a transition toward the stronger monthly regime (rank #15). If resistance rejects and price drifts back toward 2.6353 without supportive participation, the longer-horizon ranks can remain bullish while the tradable path becomes more range-bound and less persistent.
5) Quant Technical Dashboard (18 Signals)
KGNAI AI Technical Analysis Score (Deep Reinforcement Learning): Rank #447 out of 800 (Rank 1 represents the strongest technical positioning and a higher probability of favorable price behavior. As ranks increase toward the maximum, the probability of favorable outcomes weakens and bearish positioning becomes more dominant.) | Label: Neutral | Score: -0.117
18-Signal Technical Confluence Score: 0.222 (Neutral)
Overall Technical Score (18-signal confluence + DRL rank blend): 0.120 (Neutral)
Note: The blended score reflects signal strength weighted against broader AI technical ranking, which may temporarily diverge.
Blended technical score breakdown: 0.120 (Neutral | Bull 8 / Bear 4 / Neutral 6)
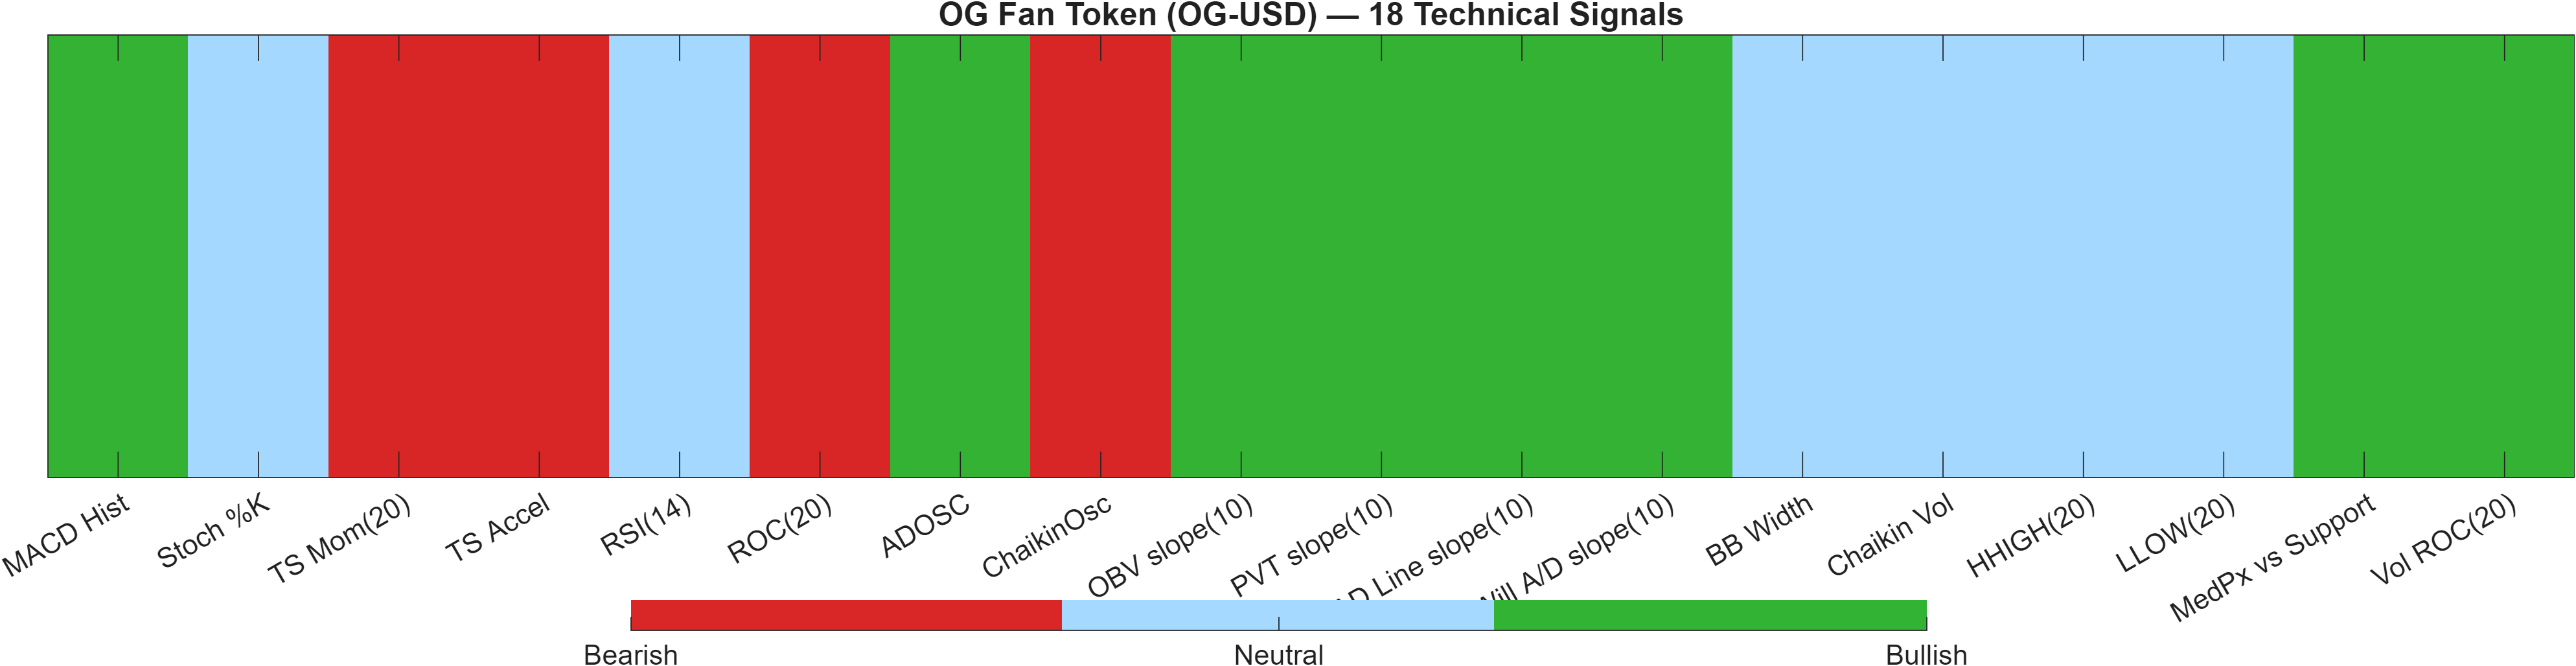
Signal composition: participation strength vs time-series drag
| Indicator | Value | Signal |
|---|---|---|
| MACD Hist | 0.01694 | Bullish |
| Stoch %K | 69.26 | Neutral |
| TS Mom(20) | -0.2427 | Bearish |
| TS Accel | -0.06702 | Bearish |
| RSI(14) | 46.3 | Neutral |
| ROC(20) | -7.706 | Bearish |
| ADOSC | 11.73 | Bullish |
| ChaikinOsc | -7.499e+04 | Bearish |
| OBV slope(10) | 1.55e+07 | Bullish |
| PVT slope(10) | 1.833e+06 | Bullish |
| AD Line slope(10) | 1.064e+07 | Bullish |
| Will A/D slope(10) | 0.3037 | Bullish |
| BB Width | 0.2061 | Neutral |
| Chaikin Vol | -5.689 | Neutral |
| HHIGH(20) | 2.99 | Neutral |
| LLOW(20) | 2.241 | Neutral |
| MedPx vs Support | 0.1021 | Bullish |
| Vol ROC(20) | 15.24 | Bullish |
The dashboard’s headline is neutral confluence: the 18-signal confluence score is 0.222 (Neutral) and the blended overall technical score is 0.120 (Neutral). The composition matters: 8 bullish vs 4 bearish signals suggests a mild positive skew, but the blend is tempered by the AI technical rank at #447 (score -0.117), which sits closer to the middle-lower portion of the universe.
The signal mix highlights a classic flow vs momentum tension. Several accumulation/participation proxies are bullish (e.g., OBV slope(10) 1.55e+07 and AD Line slope(10) 1.064e+07), while the time-series momentum complex remains a drag (TS Accel -0.06702, ROC(20) -7.706). When this occurs, price often requires a clean structural trigger—typically a break of a well-defined resistance—before the momentum indicators converge with the participation signals.
Volatility and range components are mostly neutral (BB Width 0.2061; HHIGH(20) 2.99; LLOW(20) 2.241), consistent with a market that is not yet in a strong trend phase. The key analytical test is whether bullish participation remains present as price interacts with 3.4554, which would help reconcile the longer-horizon bullish ranks with currently neutral technical confluence.
Interpretation: Indicator-level signals form the base confluence, which is then adjusted using a separate AI-driven technical ranking model. The final technical score summarizes this combined view.
6) News sentiment + extractive gist
Note: Some headlines were matched using a looser (title-only) rule to avoid missing relevant coverage.
Sentiment score (avg): 0.047 | Positive: 12% | Neutral: 88% | Negative: 0%
KGNAI AI News Sentiment Score (normalized -1 to +1): 0.61 (as of 2026-01-03) | Label: Bullish | Overall news score: 0.43
Positive Developments
Recent coverage across major financial outlets indicates a constructive informational backdrop for crypto broadly, with the sentiment distribution showing 12% positive and 0% negative in the captured set, while the average sentiment reading remains close to flat at 0.047. The normalized KGNAI news signal reads 0.61 with a bullish label (dated 2026-01-03), which can be interpreted as a higher-level contextual tailwind rather than a trade trigger. Importantly, this supportive framing aligns better with OG-USD’s longer-horizon ranks (monthly #15; 3-month #77) than with the bearish moving-average geometry, suggesting the information environment is not, by itself, the constraint. If price begins to press resistance near 3.4554, a non-adverse news tone can reduce headline-driven whipsaw risk, allowing technical confirmation (momentum and volume) to dominate.
Neutral / Mixed Developments
The dominant characteristic of the news sample is neutrality: 88% neutral and an average score close to zero. This matters because a largely informational news flow often leads price to respond more to positioning and liquidity than to narrative shocks. In such environments, technical levels—support ~2.6353 and resistance ~3.4554—tend to act as clearer decision points. The “overall news score” of 0.43 sits between the near-flat average sentiment and the higher normalized score, reinforcing that the news input is supportive but not decisive. For OG-USD, that mixed-but-stable context fits a market where RSI remains neutral (46.3) and volatility is moderate (0.2061 bandwidth).
Negative / Risk Signals
While the captured dataset shows 0% negative, the risk signal is better framed as non-directional headline sensitivity rather than explicitly negative tone. Coverage themes touching on security, scams, and AI-enabled threats—common across the crypto ecosystem—can change intraday liquidity conditions even if aggregate sentiment scoring stays neutral-to-positive. That risk is most relevant when the technical picture is not fully aligned: OG-USD’s moving-average stance is bearish, and several time-series momentum measures remain negative (e.g., ROC(20) -7.706). In practice, this means that adverse surprise headlines are more likely to matter when price is near 2.6353, where a close below support is already defined as a deterioration condition, than when price is consolidating mid-range.
- Whether the normalized news score (0.61) remains supportive as price tests 3.4554.
- Any shift in the sentiment mix away from 88% neutral toward a more polarized distribution.
- Whether headline-driven volatility coincides with a loss of 2.6353 support.
Snapshot: AI Rank (Short–Mid–Long): Mixed (Bullish tilt) (Neutral–Bullish–Bullish) · Technical Confluence: Neutral · Key Levels: Support ~2.64 | Resistance ~3.46 · News Sentiment: Neutral
Sources referenced: Reuters, Bloomberg, Yahoo Finance, MarketWatch, Investing.com
7) Sources
Not available in the provided data.
You may also like: How KGNAI AI ranks instruments across global markets
Disclaimer: KGNAI provides AI-generated analytics and educational market commentary only. This is not financial advice. Markets involve risk. Always do your own research.