FB2-USD (Fenerbahçe Token USD) — 24-Jun-2026 Technical & Rank Review with Neutral Stance and Bearish Signal Tilt
Fenerbahçe Token USD (FB2-USD) screens as neutral on KGNAI’s cross-sectional ranks while showing a bearish-leaning technical mix at the indicator level. In the ranked universe of 800 crypto instruments, FB2-USD sits in the lower half across daily and weekly horizons, with the monthly and 3‑month readings improving modestly but still not reaching an upper-quartile posture. On charts, the moving-average structure remains soft (close vs MA50 and MA50 vs MA200 both flagged bearish), and momentum gauges reinforce that bias with RSI(14) at 17.2 and MACD histogram at -0.0012. Volatility conditions appear measurable rather than extreme, with Bollinger Bandwidth at 0.1538. From a market-structure perspective, attention concentrates around the probabilistic decision zones of support ~0.2894 and resistance ~0.3531, where confirmation and invalidation conditions become more actionable than any single indicator reading.
- Rank stance (Short / Mid / Long): Neutral / Neutral / Neutral (daily #571, weekly #564; longer horizons near #487–#482 out of 800).
- Technical confluence label: 18-signal confluence Bearish (-0.389) while blended overall technical score is Neutral (-0.292).
- Key levels: Support ~0.2894 | Resistance ~0.3531.
- News sentiment bias: Neutral (avg sentiment 0.000; 88% neutral mix).
- Confirmation / invalidation condition: A sustained move above 0.3531 with volume supports continuation; a close below 0.2894 elevates deterioration risk.
KGNAI evaluates assets using large cross-sectional datasets built from millions of structured data points. Inputs incorporate fundamental metrics, technical structures, and systematically processed news sentiment. Statistical models, machine learning, and AI frameworks are used to assess relative positioning, signal alignment, and probabilistic behavior across broad universes.
- Ranks are comparative across the tracked universe, not absolute price targets.
- Confluence reflects alignment among independent signal groups.
- Support/resistance levels are probabilistic decision zones, not guarantees.
- Sentiment provides contextual bias within the broader analytical framework.
1) KGNAI AI Analysis
Region: CRYPTO
Total universe size: 800 ranked instruments
- Daily rank: #571 out of 800 — Neutral
- Weekly rank: #564 out of 800 — Neutral
- Monthly rank: #487 out of 800 — Neutral
- 3-Monthly rank: #482 out of 800 — Neutral
FB2-USD’s placement indicates a middle-to-lower tier posture versus the 800-instrument universe rather than a crowded “top decile” configuration. The daily and weekly ranks (both in the #560–#570 range) suggest the near-term probability profile has not yet shifted into a consistently favorable regime. At the same time, the monthly (#487) and 3‑month (#482) readings are modestly better than the shortest horizons, hinting at a slight stabilization in longer-window relative behavior without a decisive trend reversal signal.
The key analytical tension is rank neutrality versus technical stress. Ranks are designed to absorb broad, cross-sectional behavior; when indicator-level measures weaken while ranks hold neutral, it often implies the instrument is under pressure but not uniquely weak relative to its peer set. That distinction matters: a weak technical print can still coexist with a neutral relative standing if the broader crypto tape is similarly constrained.
Term labels remain Neutral across short-, mid-, and long-term views, aligning with the idea that FB2-USD is not currently screening as an outlier on either tail of the distribution. In practice, that places greater weight on confirmation around decision levels and the internal consistency of trend/momentum signals rather than on the rank state alone.
2) Price & trend overview
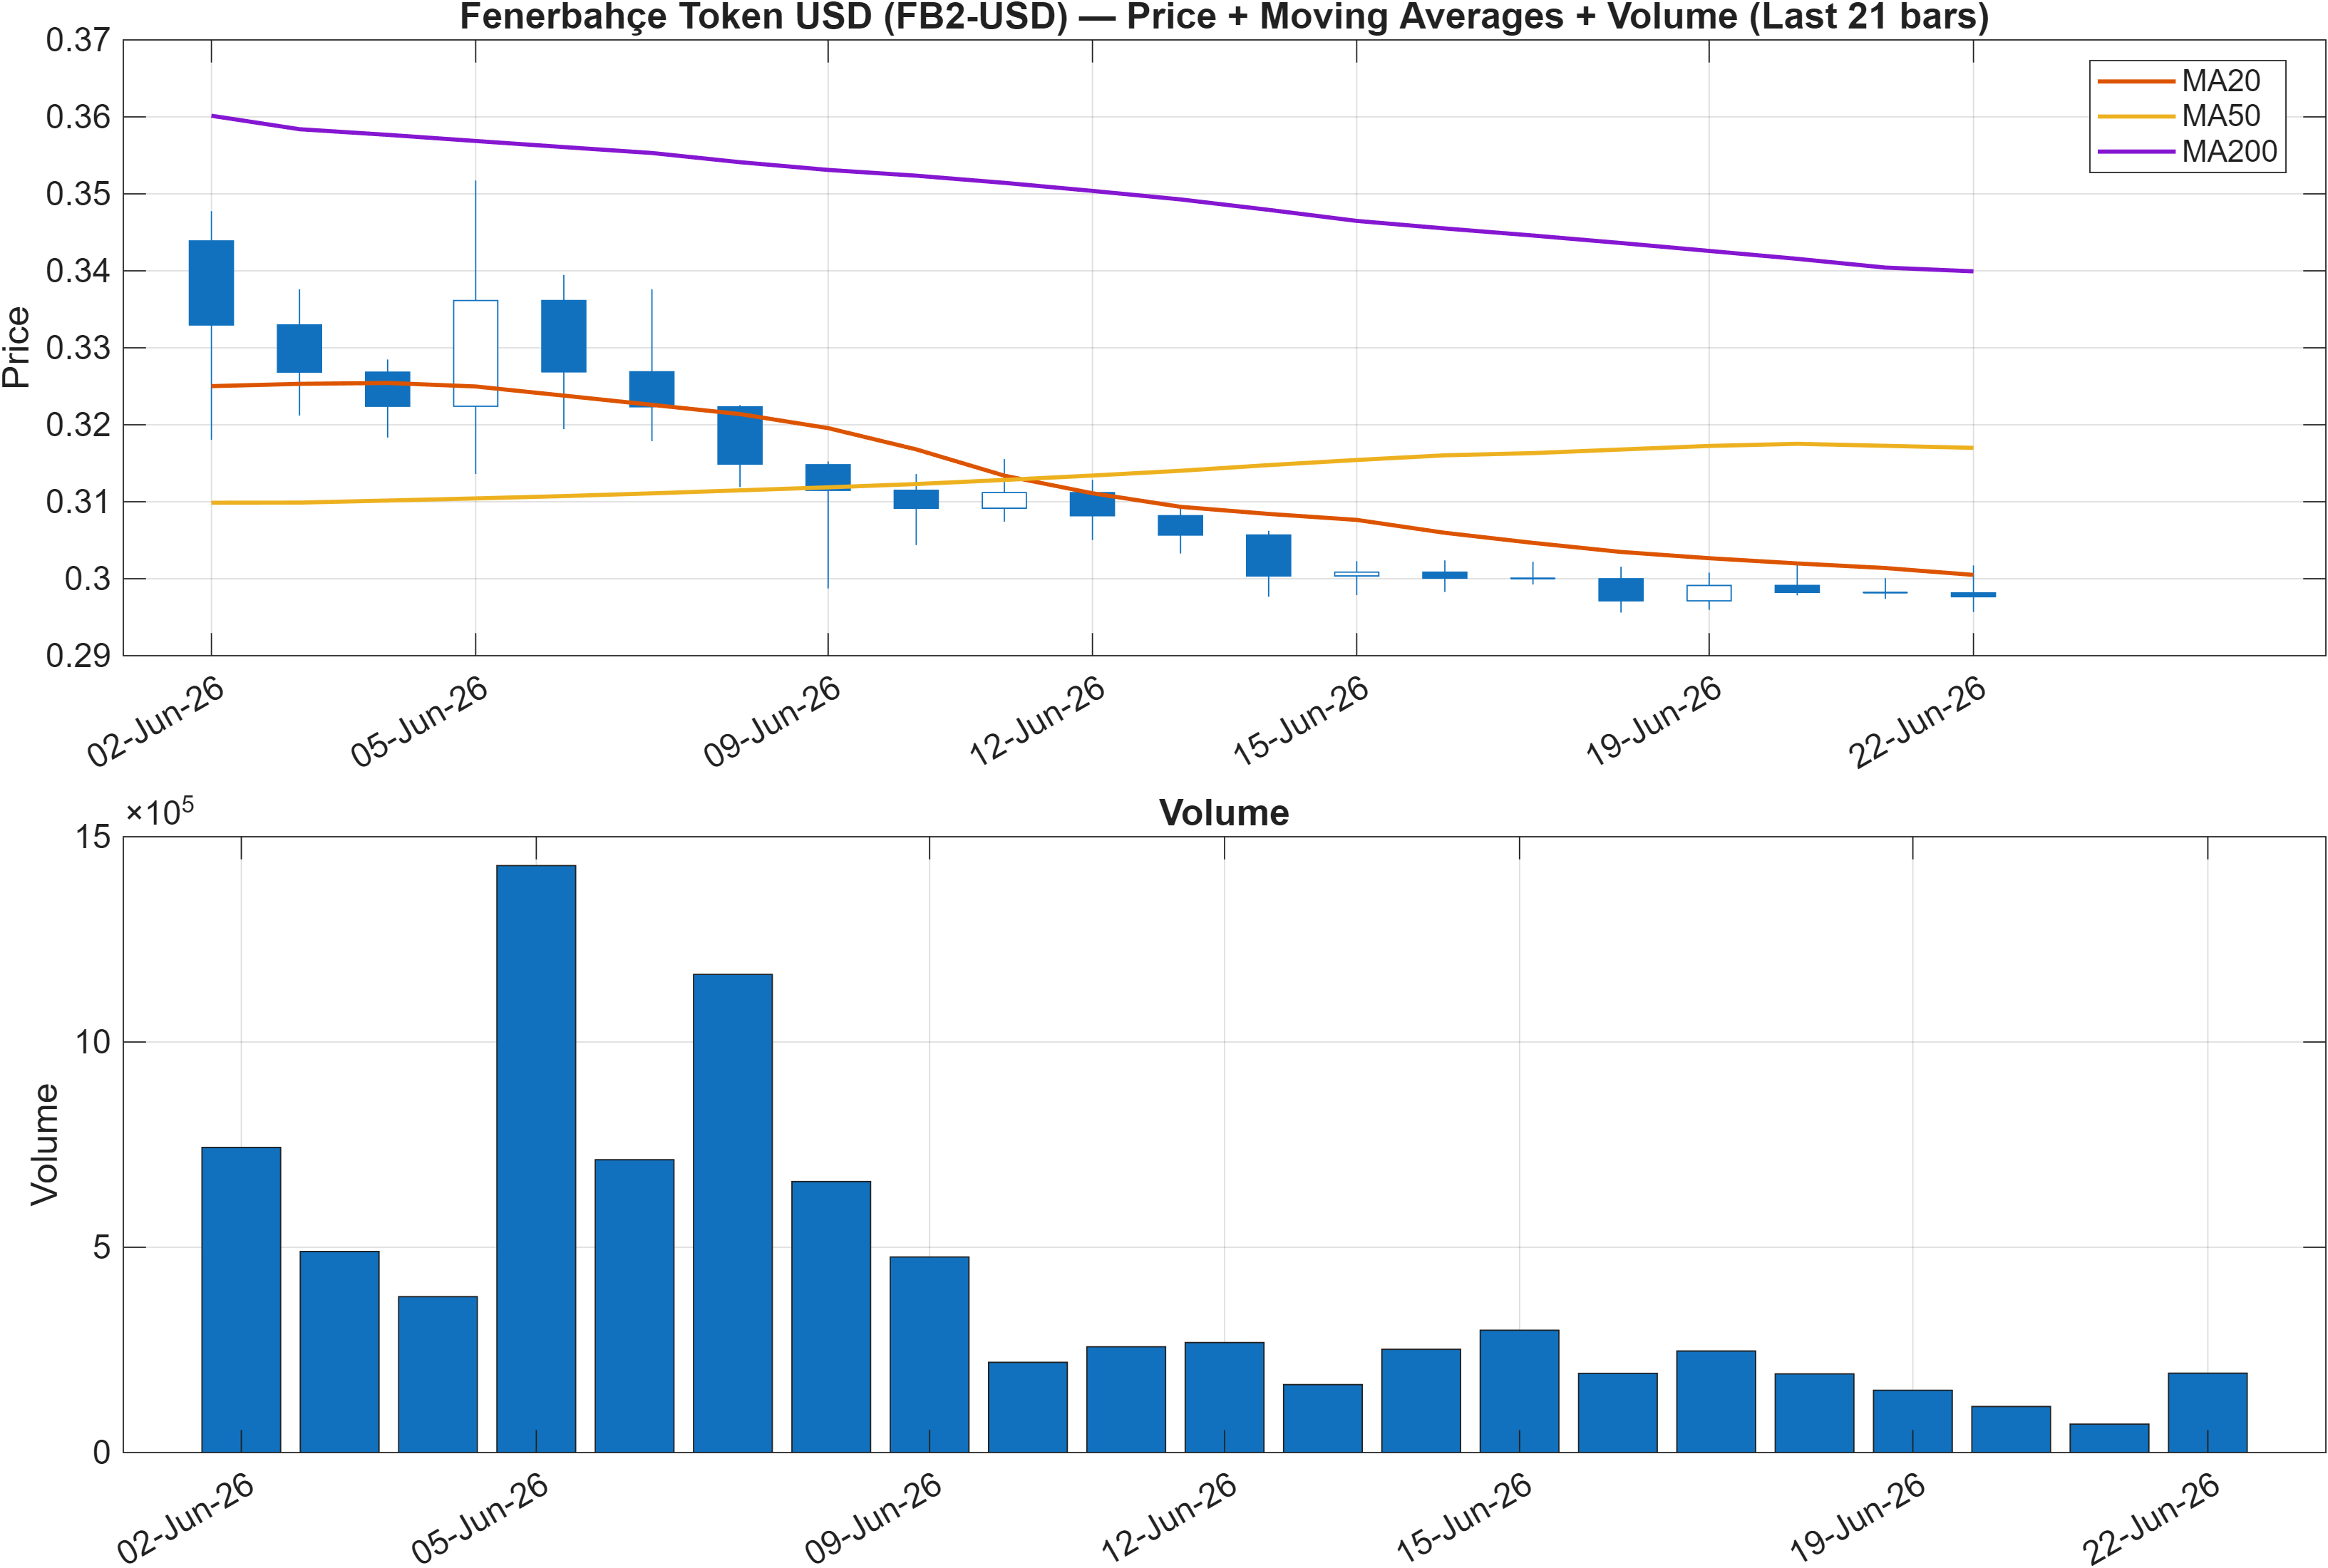
Trend structure remains pressured based on the moving-average relationships: the close is flagged bearish versus the MA50, and the MA50 is bearish versus the MA200. This combination typically corresponds to a market that is below intermediate trend and also below longer-cycle trend, a configuration that often increases the burden of proof on any bounce attempt.
Alignment vs divergence in the trend stack
The trend stack is directionally consistent with the negative momentum readings elsewhere in the report, including TS Mom(20) at -0.02918 and ROC(20) at -8.927. When price is below the MA50 while momentum is negative, rallies tend to behave more like mean-reversion tests until the close can reclaim the intermediate average and hold.
Volume/participation nuance
Participation signals are mixed rather than uniformly confirming the bearish trend. The 18-signal set includes ADOSC at 45.81 (bullish) but also multiple bearish “slope” measures such as OBV slope(10) at -9.736e+05 and AD Line slope(10) at -4.031e+05. That split commonly appears when short bursts of accumulation occur inside a broader downtrend that has not yet repaired its longer-horizon volume structure.
With trend conditions leaning bearish but ranks staying neutral, the more investable question is whether price can transition from “below trend” to “trend repair” near the resistance band referenced later (0.3531), rather than relying on a single-day rebound.
3) Momentum & volatility dashboard
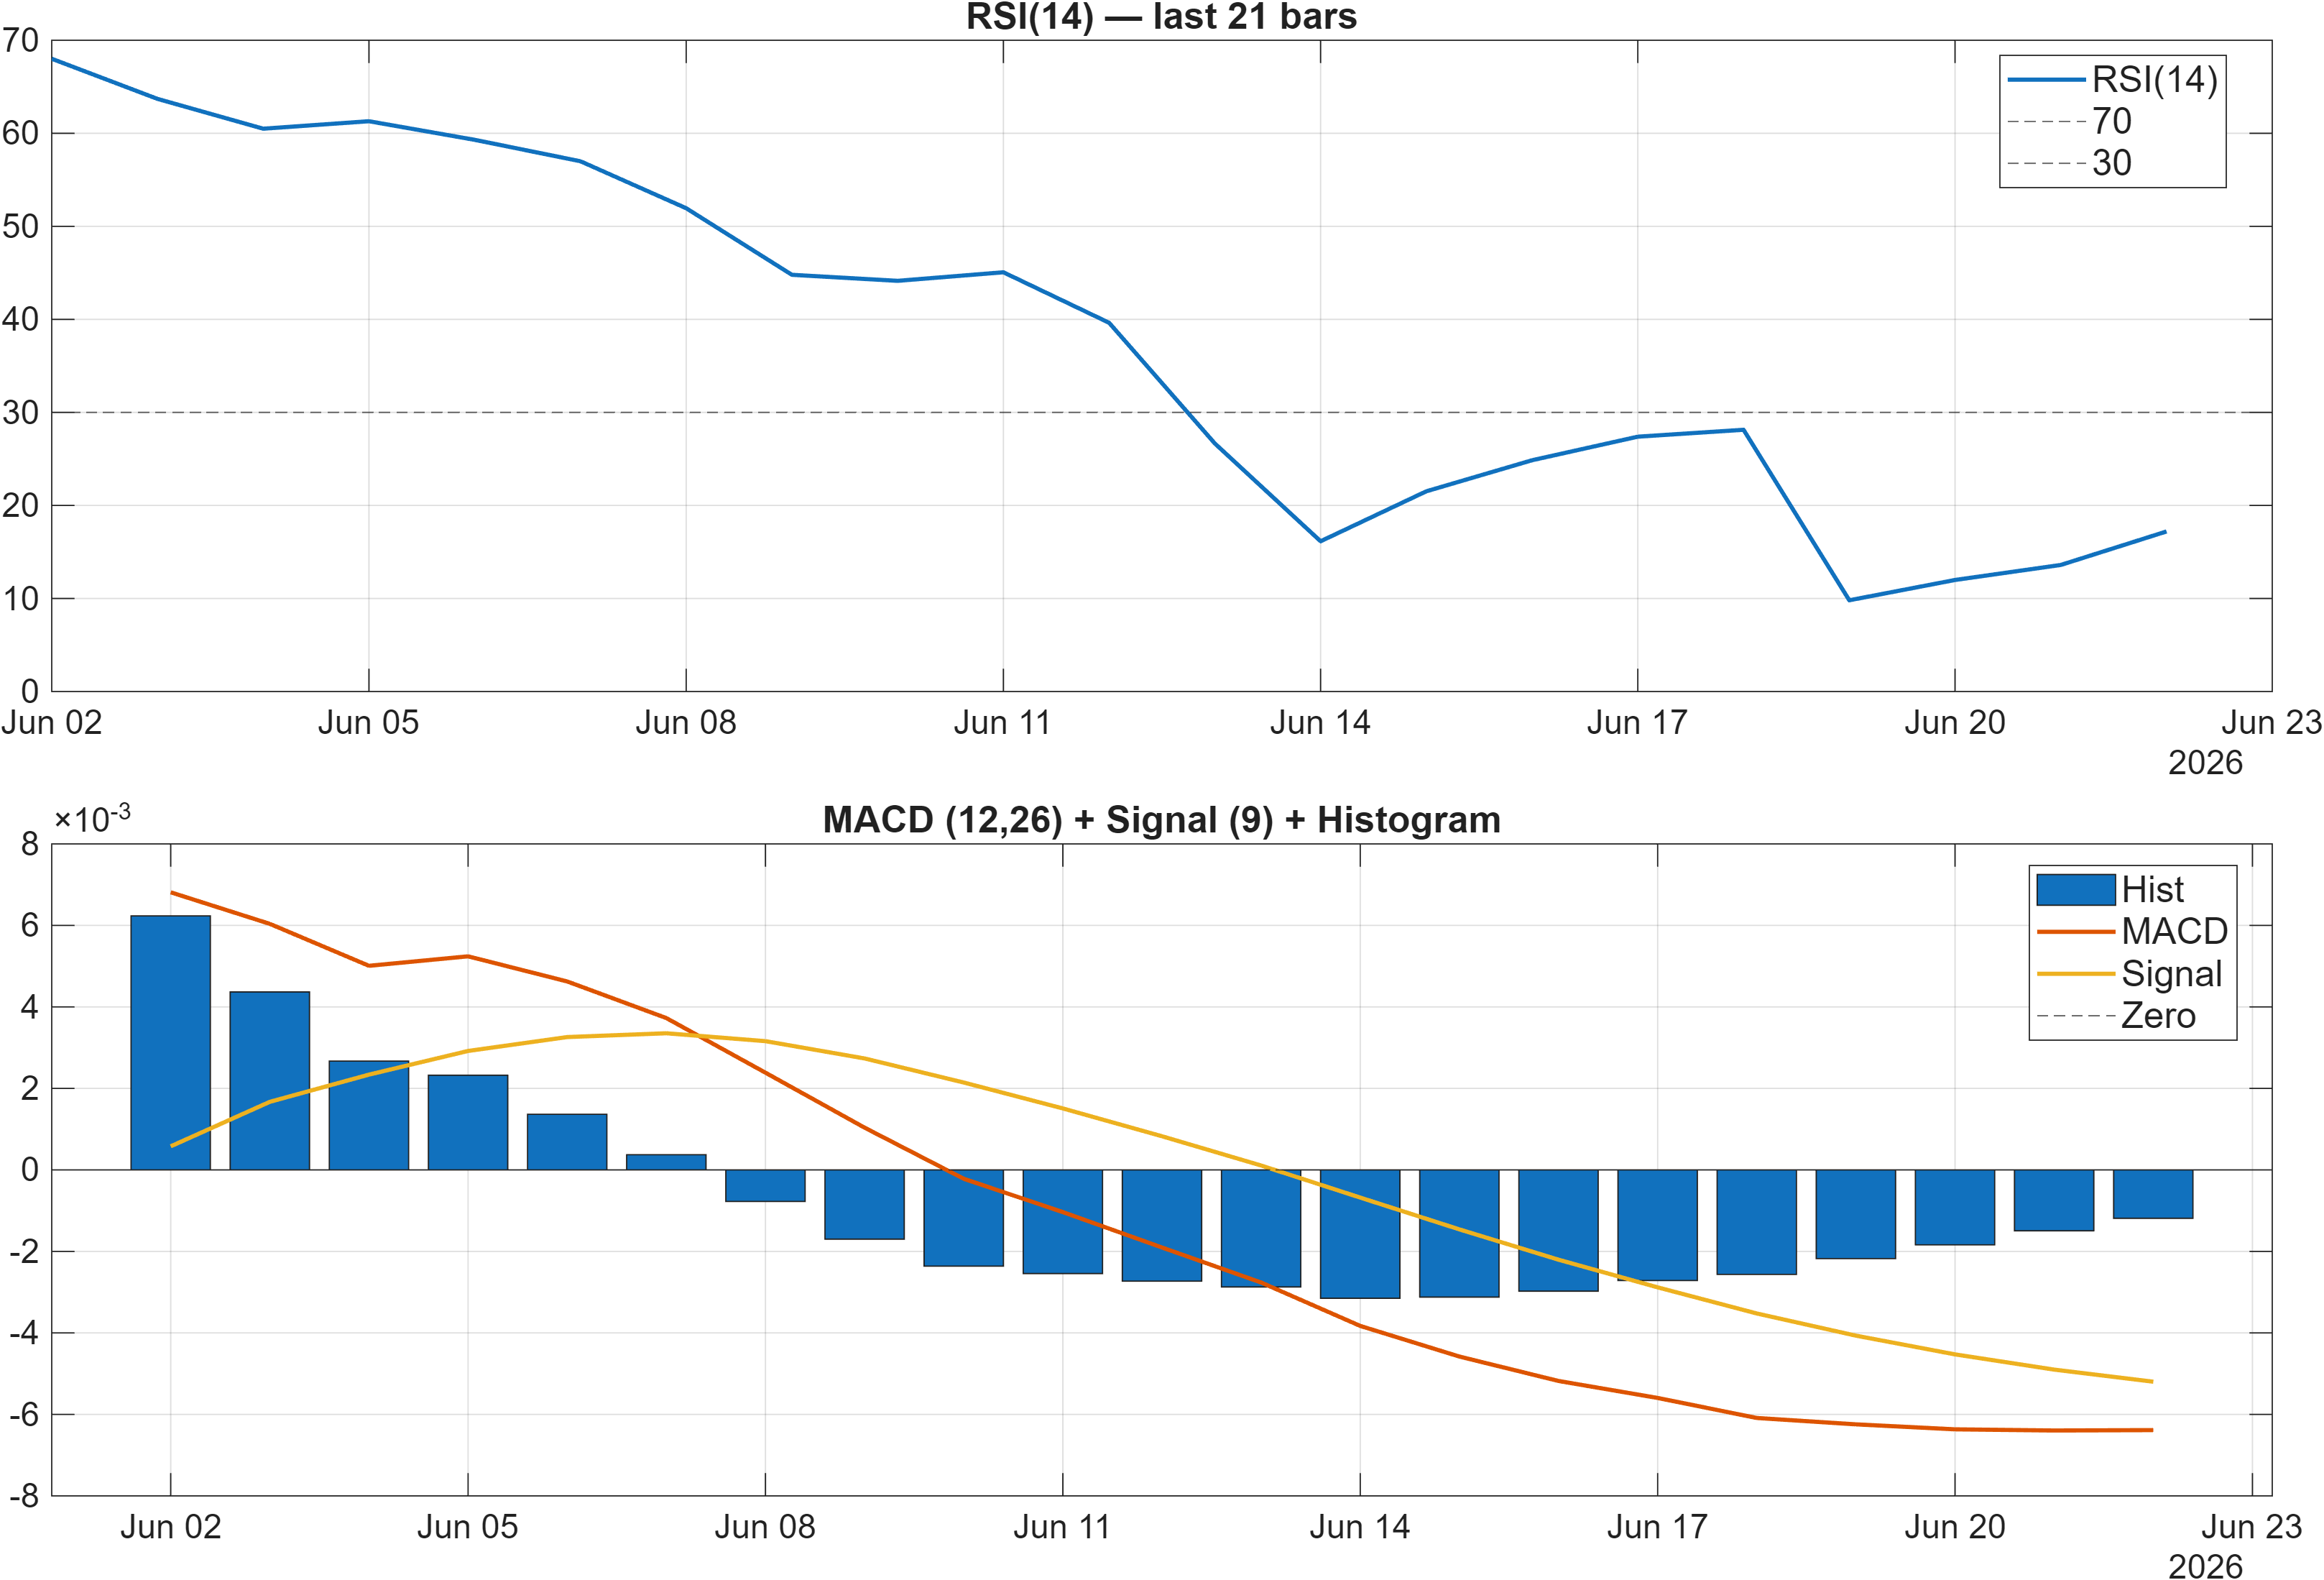
Momentum is skewed to the downside. The report flags RSI bias as bearish, with RSI(14) at 17.2—a compressed reading that typically reflects heavy downside persistence rather than balanced two-way trade. The MACD histogram at -0.0012 keeps the short-term impulse in negative territory, consistent with the bearish MA stack described earlier.
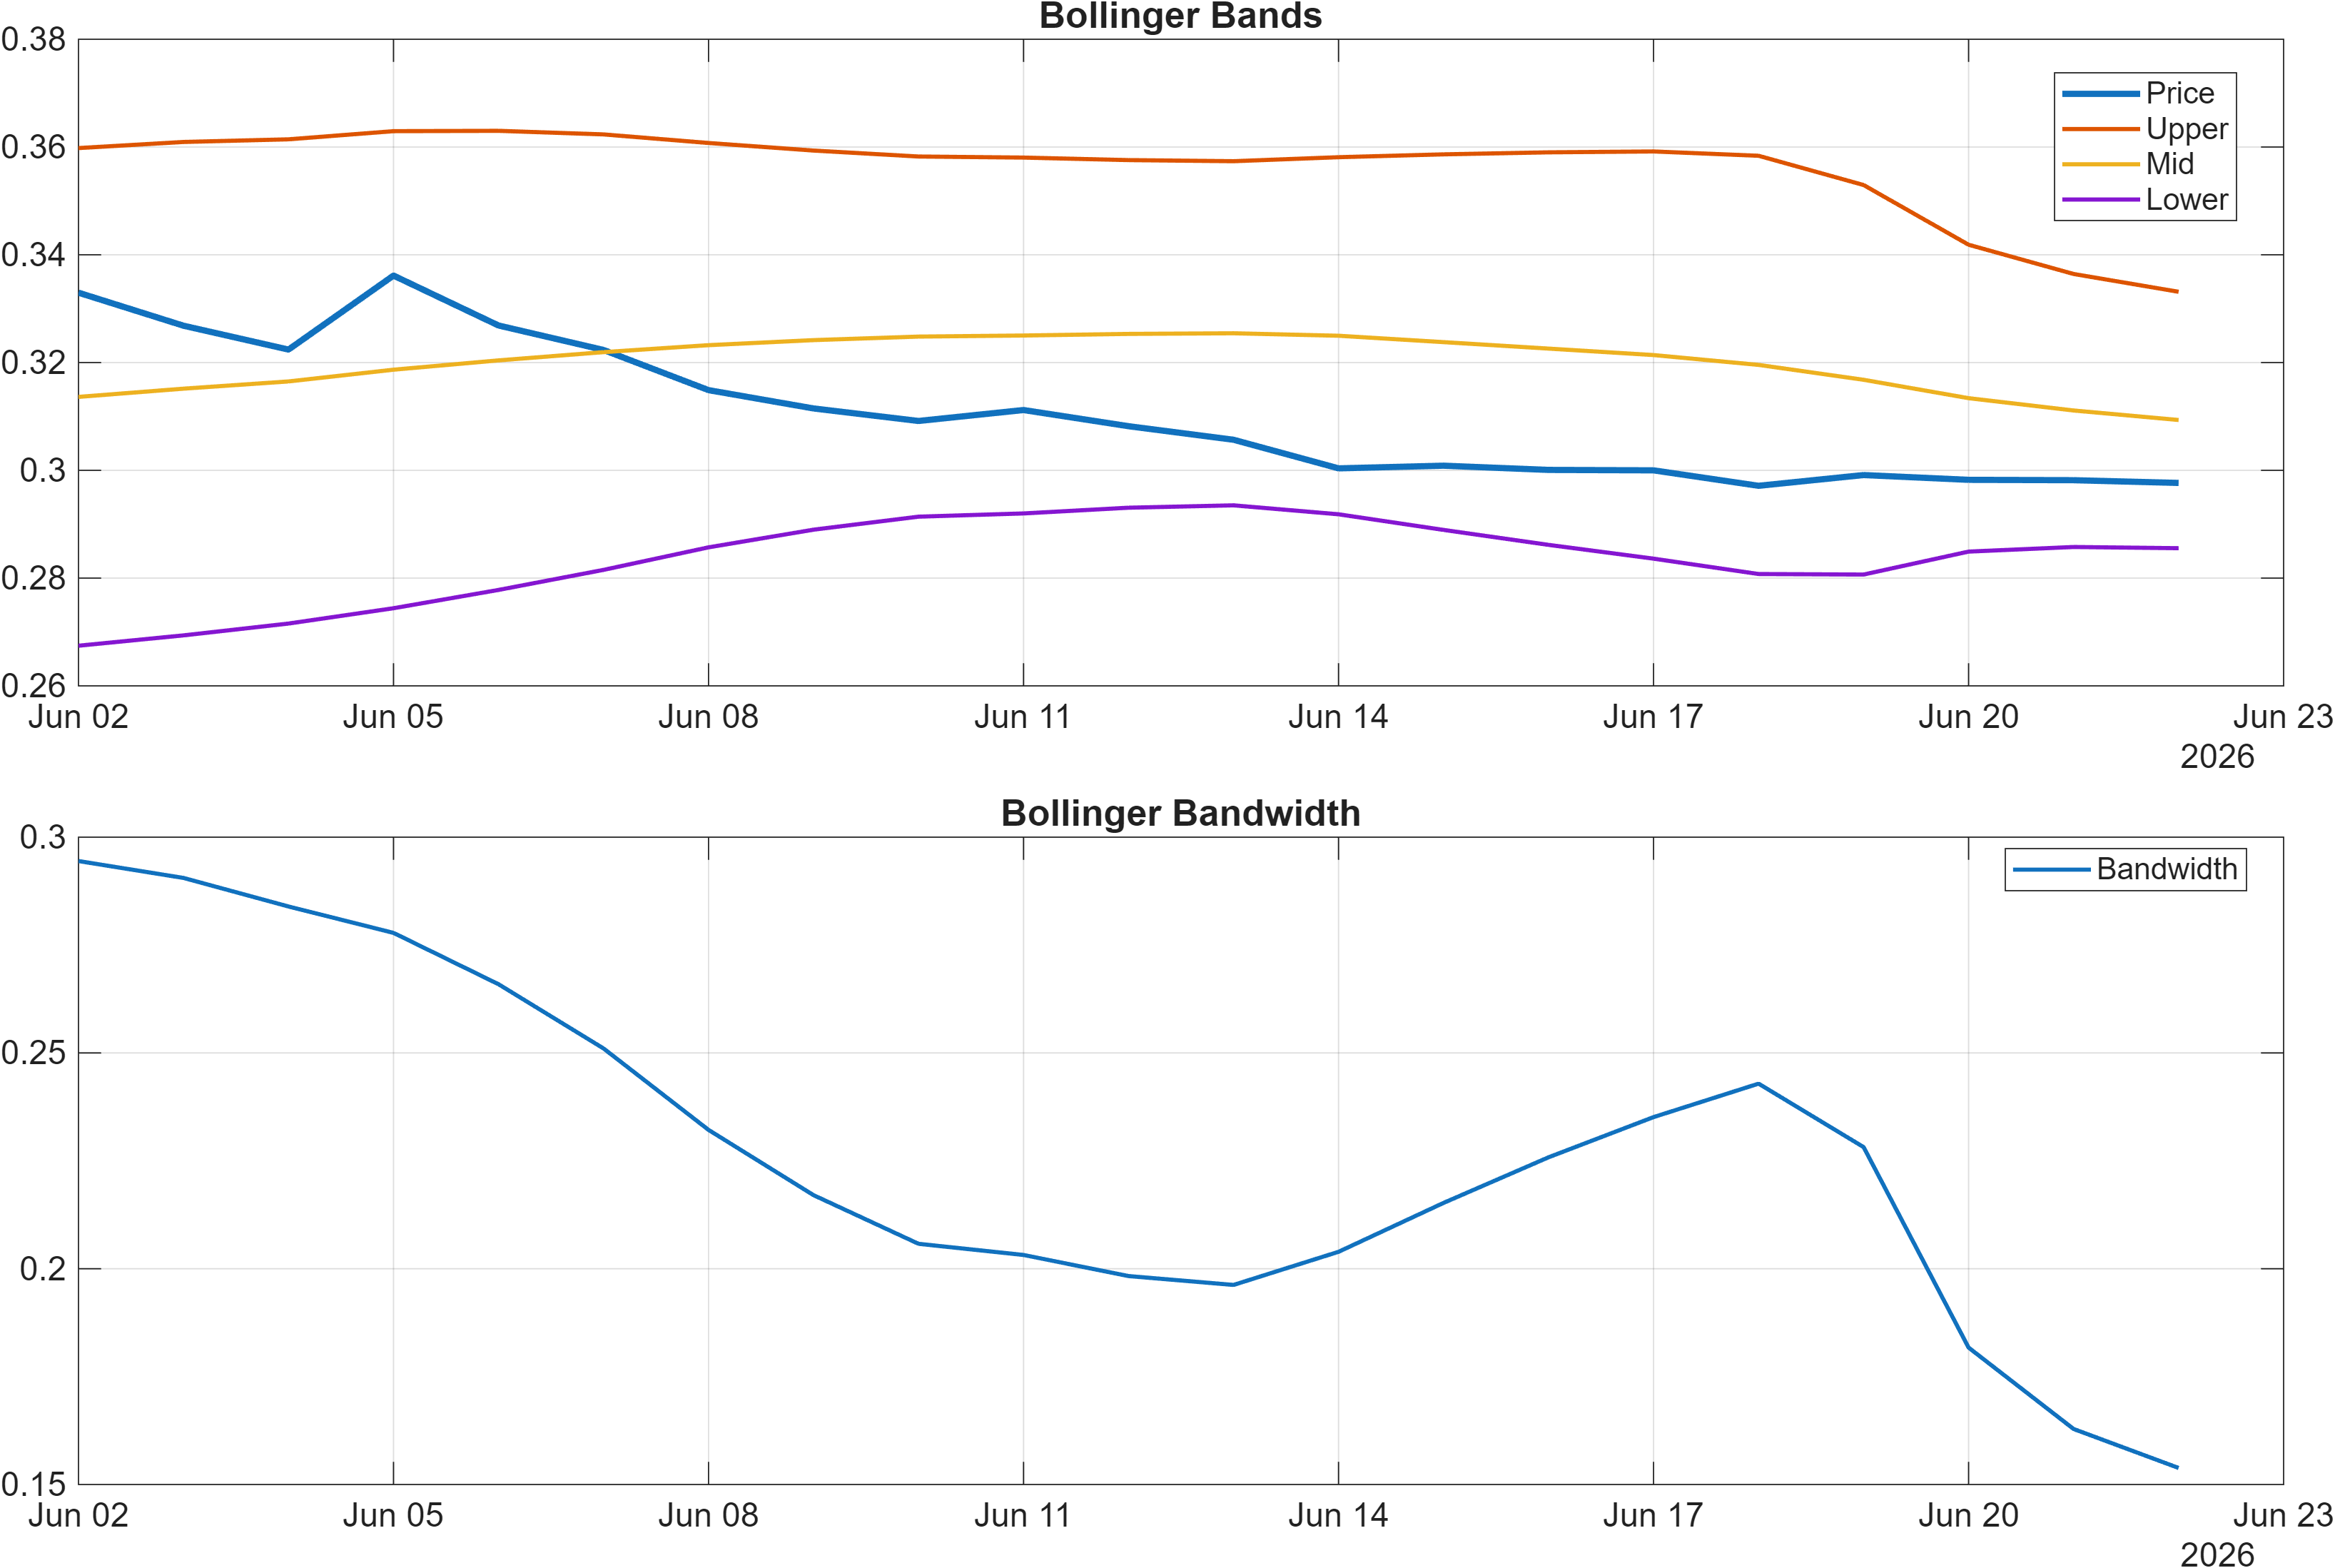
Volatility is measurable without signaling an extreme “blow-off” condition: Bollinger Bandwidth is 0.1538. In many crypto micro-caps and fan tokens, volatility regimes can shift abruptly; bandwidth at this level suggests the market is not in its tightest compression, but it is also not displaying the widest expansion typical of disorderly liquidation phases.
Compression vs expansion: what matters here
The combination of low RSI (17.2) with a defined bandwidth level (0.1538) can be read as momentum weakness inside a tradable volatility envelope. That increases the importance of monitoring whether downside impulse fades (MACD histogram lifting from -0.0012 toward zero) before concluding that the market is shifting regimes.
Oscillator disagreement
Not all oscillators are aligned: Stoch %K at 14.85 is labeled bullish even while RSI remains bearish. This divergence often appears when price is attempting to base after a sharp decline—early oscillator stabilization without full confirmation from broader momentum measures. In those cases, follow-through tends to be validated at key levels rather than by oscillators alone.
4) Support / Resistance zones
Support ~ 0.2894 | Resistance ~ 0.3531
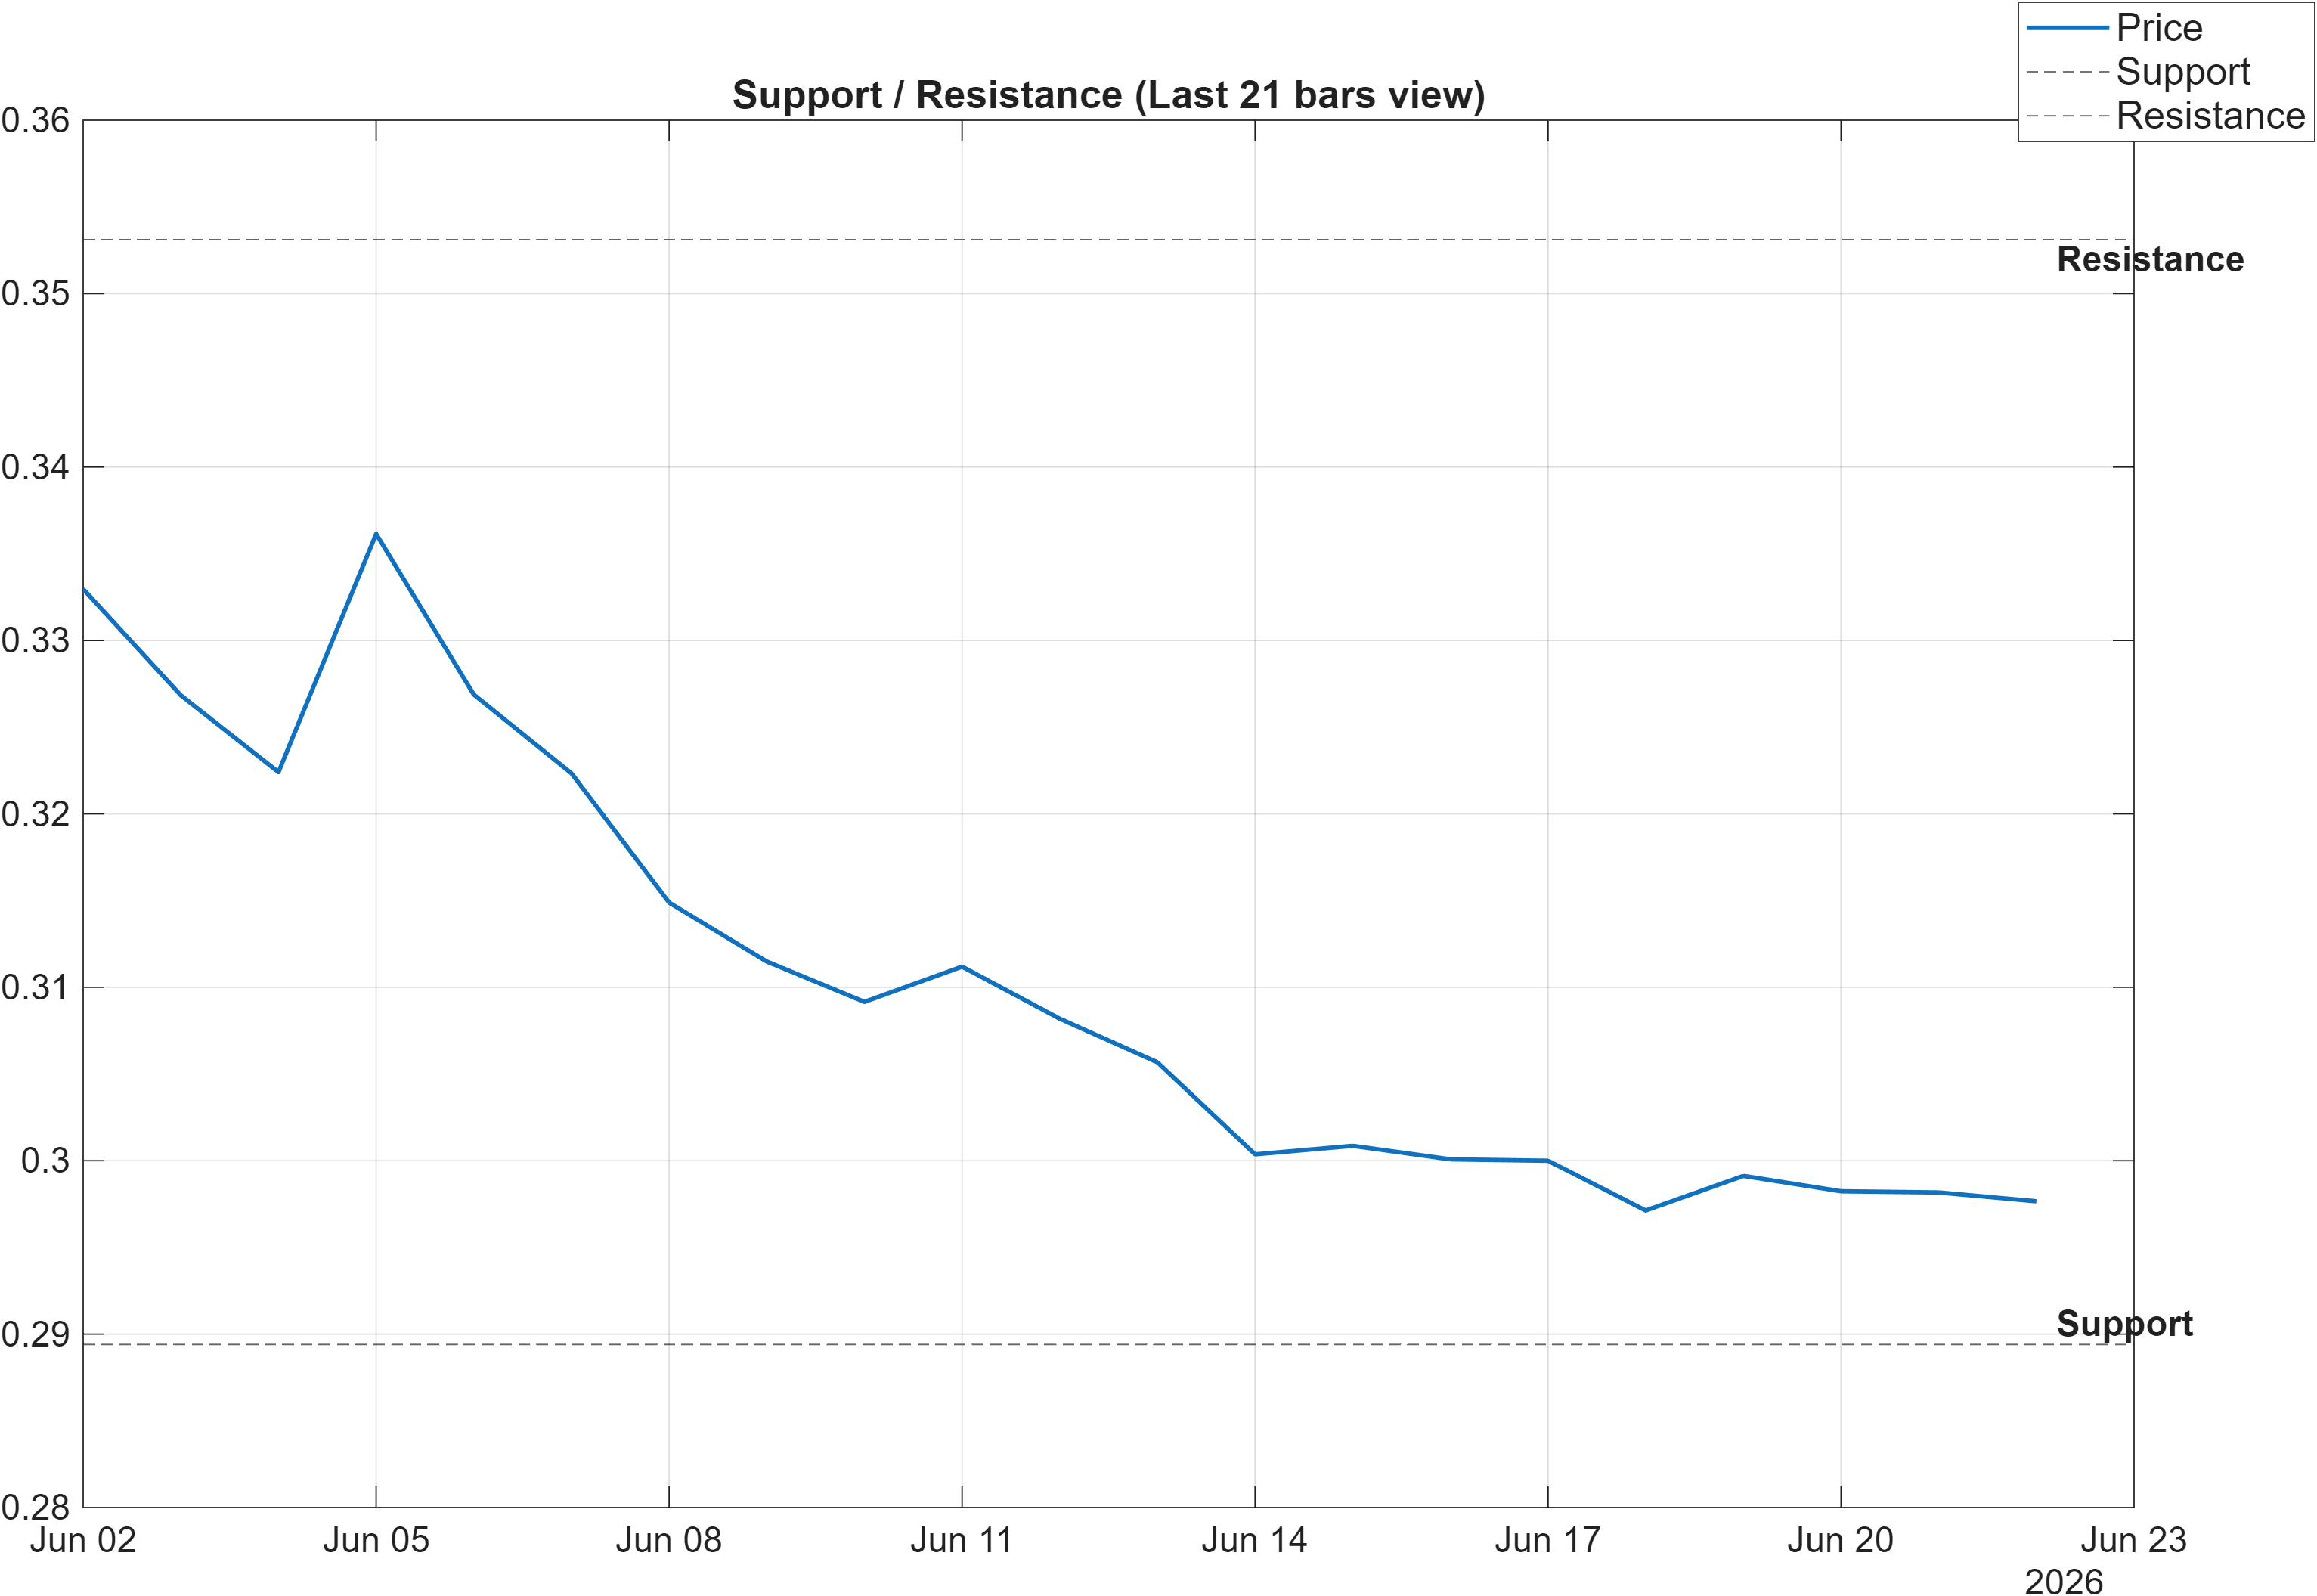
FB2-USD is framed by a relatively tight decision corridor: 0.2894 as support and 0.3531 as resistance. With ranks neutral (daily #571, weekly #564) and momentum bearish (RSI 17.2), these levels matter because they convert “weakness” into observable market-structure outcomes: holds, breakdowns, or reclaim attempts.
Regime continuation vs transition
A close below 0.2894 would represent deterioration risk consistent with the broader bearish indicator mix (e.g., ROC(20) at -8.927 and bearish trend stack). In that scenario, the neutral rank may begin to drift further into weaker territory as relative behavior degrades against peers.
Conversely, a break above 0.3531 with volume is the specific continuation condition provided. Technically, that move would also be the first step toward repairing the bearish MA configuration by forcing price into a region where reclaiming the MA50 becomes more plausible. Given the current oscillator disagreement (Stoch improving while RSI remains weak), the resistance zone can act as a validation gate for whether a bounce is structural or merely reactive.
Nearest context from the signal set
The 18-signal table includes HHIGH(20) at 0.3517 (neutral) and LLOW(20) at 0.2956 (neutral), which bracket price action near the same neighborhood as the stated resistance/support zones. That clustering increases the likelihood that reactions near ~0.29 and ~0.35 are watched by multiple technical frameworks simultaneously.
5) Quant Technical Dashboard (18 Signals)
KGNAI AI Technical Analysis Score (Deep Reinforcement Learning): Rank #426 out of 800 (Rank 1 represents the strongest technical positioning and a higher probability of favorable price behavior. As ranks increase toward the maximum, the probability of favorable outcomes weakens and bearish positioning becomes more dominant.) | Label: Neutral | Score: -0.065
18-Signal Technical Confluence Score: -0.389 (Bearish)
Overall Technical Score (18-signal confluence + DRL rank blend): -0.292 (Neutral)
Note: The blended score reflects signal strength weighted against broader AI technical ranking, which may temporarily diverge.
Blended technical score breakdown: -0.292 (Neutral | Bull 4 / Bear 11 / Neutral 3)
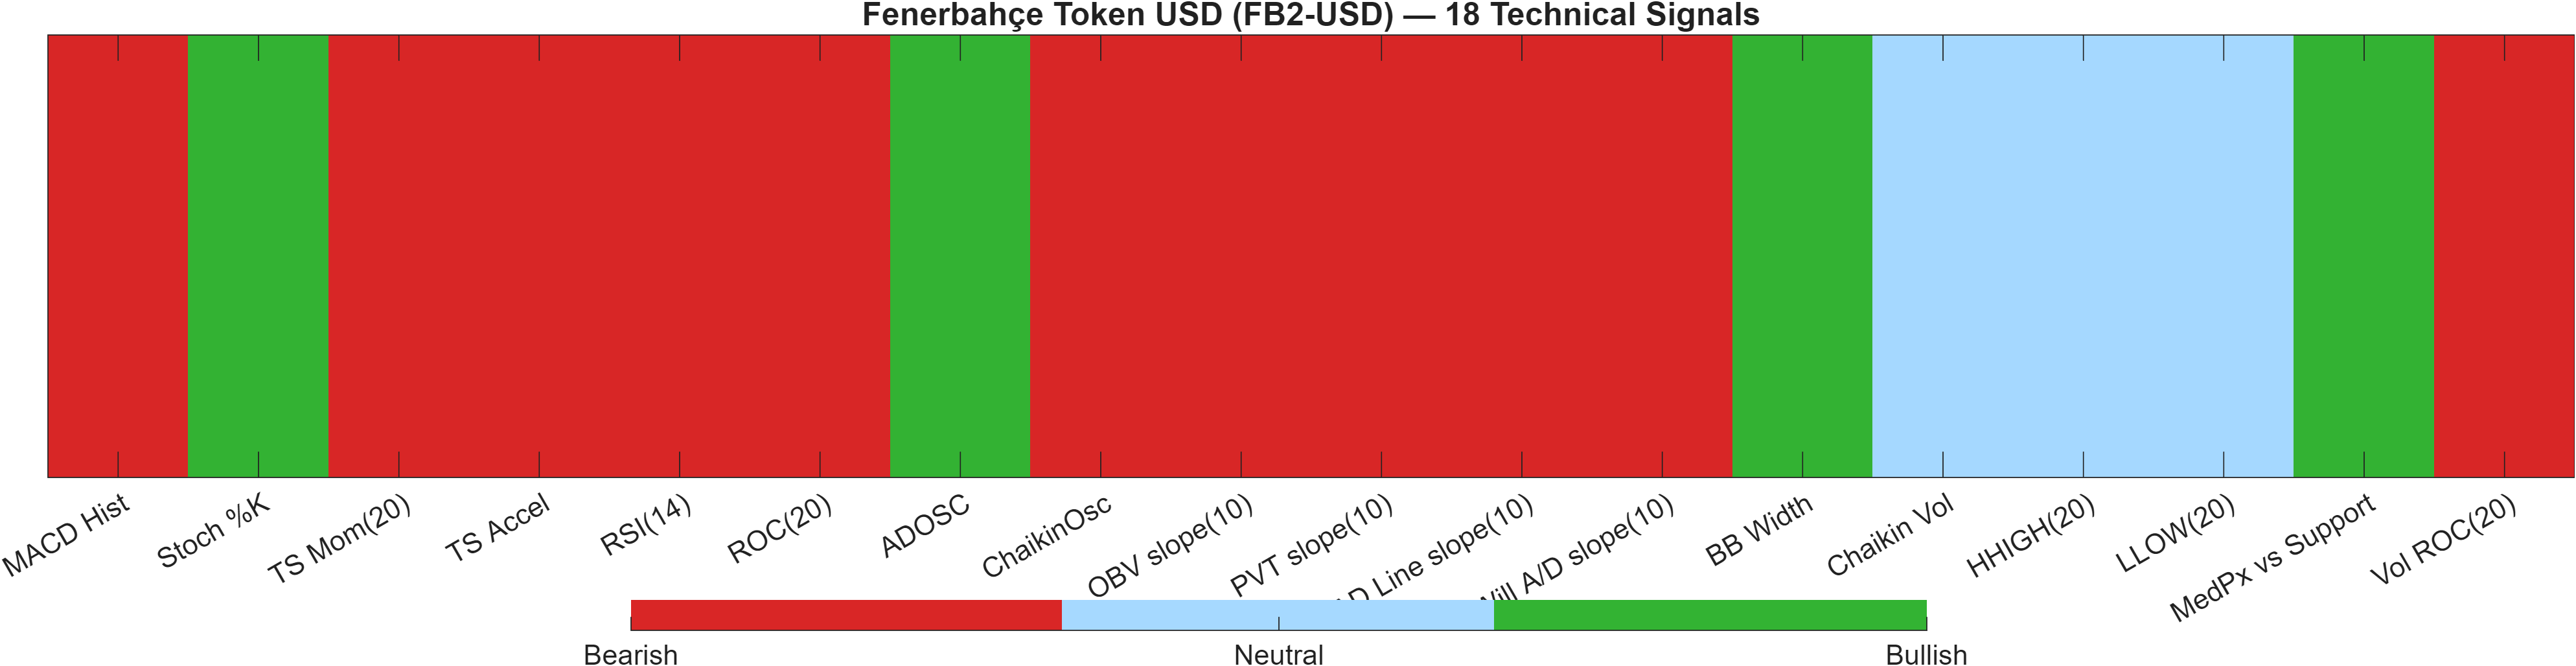
Signal table (Bull/Bear/Neutral)
| Indicator | Value | Signal |
|---|---|---|
| MACD Hist | -0.001188 | Bearish |
| Stoch %K | 14.85 | Bullish |
| TS Mom(20) | -0.02918 | Bearish |
| TS Accel | -0.06045 | Bearish |
| RSI(14) | 17.2 | Bearish |
| ROC(20) | -8.927 | Bearish |
| ADOSC | 45.81 | Bullish |
| ChaikinOsc | -1.477e+05 | Bearish |
| OBV slope(10) | -9.736e+05 | Bearish |
| PVT slope(10) | -7285 | Bearish |
| AD Line slope(10) | -4.031e+05 | Bearish |
| Will A/D slope(10) | -0.02207 | Bearish |
| BB Width | 0.1538 | Bullish |
| Chaikin Vol | -53.54 | Neutral |
| HHIGH(20) | 0.3517 | Neutral |
| LLOW(20) | 0.2956 | Neutral |
| MedPx vs Support | 0.009293 | Bullish |
| Vol ROC(20) | -60.54 | Bearish |
The dashboard shows a two-layer outcome: raw confluence is bearish (-0.389), yet the blended overall technical score is neutral (-0.292) because the DRL technical rank is itself neutral at #426 (score -0.065). This is a classic “signal disagreement” case where indicator breadth leans negative (Bear 11 vs Bull 4), but the broader AI technical ranking does not classify the setup as deeply unfavorable relative to peers.
Where bearish pressure concentrates
The heaviest clustering appears in momentum and participation slopes: TS Accel at -0.06045, Will A/D slope(10) at -0.02207, and Vol ROC(20) at -60.54 collectively depict a market where downside action has been accompanied by weakening volume dynamics. This tends to reduce the reliability of single-oscillator rebounds unless paired with structural reclaim signals.
Where stabilization signals appear
The bullish subset is narrow but informative: Stoch %K 14.85, ADOSC 45.81, and MedPx vs Support 0.009293 point to attempts at basing near the support region. The presence of BB Width 0.1538 as bullish indicates volatility conditions may allow a directional move once price resolves the support/resistance corridor rather than remaining range-bound.
Interpretation: Indicator-level signals form the base confluence, which is then adjusted using a separate AI-driven technical ranking model. The final technical score summarizes this combined view.
6) News sentiment + extractive gist
Note: Instrument-specific news matches were not found, so the digest includes broader market/sector headlines. Links are provided for verification.
Sentiment score (avg): 0.000 | Positive: 6% | Neutral: 88% | Negative: 6%
KGNAI AI News Sentiment Score (normalized -1 to +1): Not available (as of —) | Label: Not available | Overall news score: 0.00
Positive Developments
Recent coverage across major financial outlets indicates a modestly constructive backdrop primarily driven by broader crypto narratives rather than FB2-USD-specific catalysts. The positive tone is less about directional conviction and more about infrastructure and ecosystem themes that can affect risk appetite across digital assets. In that context, “constructive” reads as incremental: when sector attention rises around security, protocol development debates, or institutional framing, liquidity and participation can improve even in smaller tokens. However, with the sentiment mix still dominated by neutrality (88%), any supportive effect is better treated as a contextual tailwind rather than an independent driver. For FB2-USD, the practical implication is that a constructive macro-crypto narrative may help price respond at technical decision points—especially near 0.3531—but it does not offset the current bearish momentum profile (e.g., RSI 17.2) on its own.
Neutral / Mixed Developments
The prevailing news tone remains predominantly informational, consistent with the reported average sentiment of 0.000. Mixed coverage often coincides with markets digesting volatility, liquidation activity, and ongoing protocol-policy discussions without a single dominant “risk-on” or “risk-off” headline set. This aligns with the report’s broader configuration: FB2-USD ranks are neutral (daily #571, monthly #487), while the technical stack shows stress but not a unified capitulation signature. For readers, neutral coverage is less about direction and more about timing risk: shifts in liquidity conditions can quickly change how price behaves around support (~0.2894) and resistance (~0.3531), even when no token-specific news is present.
Negative / Risk Signals
Risk signals in recent crypto coverage cluster around market fragility themes—such as liquidation pressure, regulatory uncertainty, and debate-driven volatility—which can raise the probability of sharp intraday moves. That matters for an instrument already showing bearish momentum measures (e.g., MACD histogram -0.0012, ROC(20) -8.927) and a bearish 18-signal confluence (-0.389). When sector headlines emphasize risk, smaller tokens can experience asymmetric downside if liquidity thins, making the support zone near 0.2894 more than a chart annotation—it becomes the key line separating stabilization from further deterioration. With instrument-specific news not available in the provided data, the appropriate use of this section is to treat “negative” as macro sensitivity, not as a claim about FB2-USD fundamentals.
- Whether sentiment remains dominated by neutral prints (88%) or shifts meaningfully toward either tail.
- Any liquidity-driven volatility expansion that changes how price behaves near 0.2894 and 0.3531.
- Whether broader crypto risk-off coverage coincides with a technical break below support.
Sources referenced: Reuters, Bloomberg, Yahoo Finance, MarketWatch, Investing.com
Snapshot: AI Rank (Short–Mid–Long): Neutral (Neutral–Neutral–Neutral) · Technical Confluence: Bearish · Key Levels: Support ~0.29 | Resistance ~0.35 · News Sentiment: Neutral
7) Sources
- Ethereum’s much-hated staking 'tax' may already be obsolete — https://cointelegraph.com/features/ethereums-funding-scare-why-a-hated-staking-tax-may-already-be-obsolete?utm_source=rss&utm_medium=rss&utm_campaign=rss
- $170M Ether longs liquidated as crypto market tumbles: Is ETH doomed? — https://cointelegraph.com/markets/170m-ether-positions-liquidated-as-crypto-market-tumbles-is-eth-doomed?utm_source=rss&utm_medium=rss&utm_campaign=rss
- Starmer steps down: What Andy Burnham means for crypto in the UK — https://cointelegraph.com/features/starmer-steps-down-what-andy-burnham-means-for-crypto-in-the-uk?utm_source=rss&utm_medium=rss&utm_campaign=rss
- Mark Zuckerberg ordered Meta staff to develop moneyless prediction market: NYT — https://cointelegraph.com/news/mark-zuckerberg-meta-prediction-markets?utm_source=rss&utm_medium=rss&utm_campaign=rss
- Here’s what happened in crypto today — https://cointelegraph.com/news/what-happened-in-crypto-today?utm_source=rss&utm_medium=rss&utm_campaign=rss
- Crypto isn't the problem with the US economy, says senator — https://cointelegraph.com/news/digital-chamber-overlooked-senate-affordability-hearing?utm_source=rss&utm_medium=rss&utm_campaign=rss
- Multi-year Bitcoin holder selling falls to 19-month low as halving model flags new market bottom date — https://cointelegraph.com/markets/og-bitcoin-selling-hits-19-month-low-as-halving-model-flags-new-bottom-date-analyst?utm_source=rss&utm_medium=rss&utm_campaign=rss
- Zcash miner Fortitude gets Nasdaq listing via HeartSciences merger — https://cointelegraph.com/news/zcash-miner-fortitude-go-public-heartsciences-merger?utm_source=rss&utm_medium=rss&utm_campaign=rss
You may also like: How KGNAI AI ranks instruments across global markets
Disclaimer: KGNAI provides AI-generated analytics and educational market commentary only. This is not financial advice. Markets involve risk. Always do your own research.