601869 — Yangtze Optical Fibre and Cable Joint Stock Ltd Co (24-Jun-2026) | Consolidation With Bullish Technical Confluence, Mixed Ranks
Yangtze Optical Fibre and Cable Joint Stock Ltd Co (601869) is presenting a bifurcated profile: very strong short-horizon rank behavior alongside weaker mid-horizon positioning, while the technical stack remains broadly constructive. In the KGNAI universe of 1292 China-listed instruments, the daily rank of #6 signals strong near-term relative behavior, but the monthly rank of #1211 sits in the lower tail, indicating that the medium-horizon probability structure has not fully repaired. Price structure versus moving averages remains supportive (Close vs MA50 bullish; MA50 vs MA200 bullish), and momentum readings are elevated, with MACD histogram at 10.1273 and an RSI(14) at 87.43. Volatility conditions are not extreme but are not compressed either, with Bollinger Bandwidth at 0.3487. Key decision zones remain support ~351.0592 and resistance ~493.3062, framing the near-term confirmation/invalidation map.
Key Takeaways
- Short / Mid / Long stance: Mixed (Neutral short-term; Bearish mid-term; Neutral long-term per term view).
- Technical confluence label: Bullish (18-signal confluence 0.722; overall technical score 0.671).
- Key levels: Support ~ 351.0592 | Resistance ~ 493.3062.
- News sentiment bias: Slightly positive/neutral backdrop (avg sentiment 0.013; distribution 19% positive / 69% neutral / 12% negative; normalized score 1.00 labeled bullish).
- Confirmation / invalidation: Sustained strength is better supported on a break above 493.3062 with volume; a close below 351.0592 increases deterioration risk per scenario framing.
What KGNAI Measures
KGNAI evaluates assets using large cross-sectional datasets built from millions of structured data points. Inputs incorporate fundamental metrics, technical structures, and systematically processed news sentiment. Statistical models, machine learning, and AI frameworks are used to assess relative positioning, signal alignment, and probabilistic behavior across broad universes.
How to Read This Report
- Ranks are comparative across the tracked universe, not absolute price targets.
- Confluence reflects alignment among independent signal groups.
- Support/resistance levels are probabilistic decision zones, not guarantees.
- Sentiment provides contextual bias within the broader analytical framework.
1) KGNAI AI Analysis
Region: CHINA
Total universe size: 1292 ranked instruments
- Daily rank: #6 out of 1292 — Bullish
- Weekly rank: #876 out of 1292 — Neutral
- Monthly rank: #1211 out of 1292 — Bearish
- 3-Monthly rank: #1028 out of 1292 — Neutral
- 6-Monthly rank: #975 out of 1292 — Neutral
- Yearly rank: #922 out of 1292 — Neutral
The rank surface shows time-horizon divergence rather than uniform strength. The daily rank (#6) places 601869 in the extreme upper tier on the shortest horizon, which often occurs when price/volume behavior accelerates faster than peers. However, the weekly rank (#876) and yearly rank (#922) sit closer to the middle-to-lower half of the universe, implying the recent improvement has not yet propagated through longer windows. The monthly rank (#1211) is notably weaker, anchoring the mid-horizon stance as bearish despite short-term uplift.
This configuration is consistent with a market transitioning from underperformance into an early-stage repair, where short-run behavior improves first while longer windows remain burdened by prior drawdowns or extended sideways regimes. In practical portfolio terms, the main analytical question becomes whether the daily strength can persist long enough to pull intermediate ranks (3-monthly #1028, 6-monthly #975) into a more favorable zone, or whether it represents a short-lived relative spike.
The stated term view summarizes that tension: Short-term: Neutral, Mid-term: Bearish, Long-term: Neutral. With ranks, the edge comes from consistency; at present, the Bullish daily reading coexists with broader neutrality. That mix typically elevates the importance of confirmation through price structure (trend) and key levels (support/resistance) rather than relying on a single horizon.
KGNAI ranks each instrument across large universes using multiple proprietary AI tests and statistical models (millions of data points). Lower ranks generally indicate stronger probability of favorable performance behavior, while higher ranks indicate weaker probability and more bearish positioning.
Term view: Short-term: Neutral. Mid-term: Bearish. Long-term: Neutral.
Want the full universe and complete rank tables? Unlock full access on KGNAI: https://www.kgnai.com/pricing
2) Price & trend overview
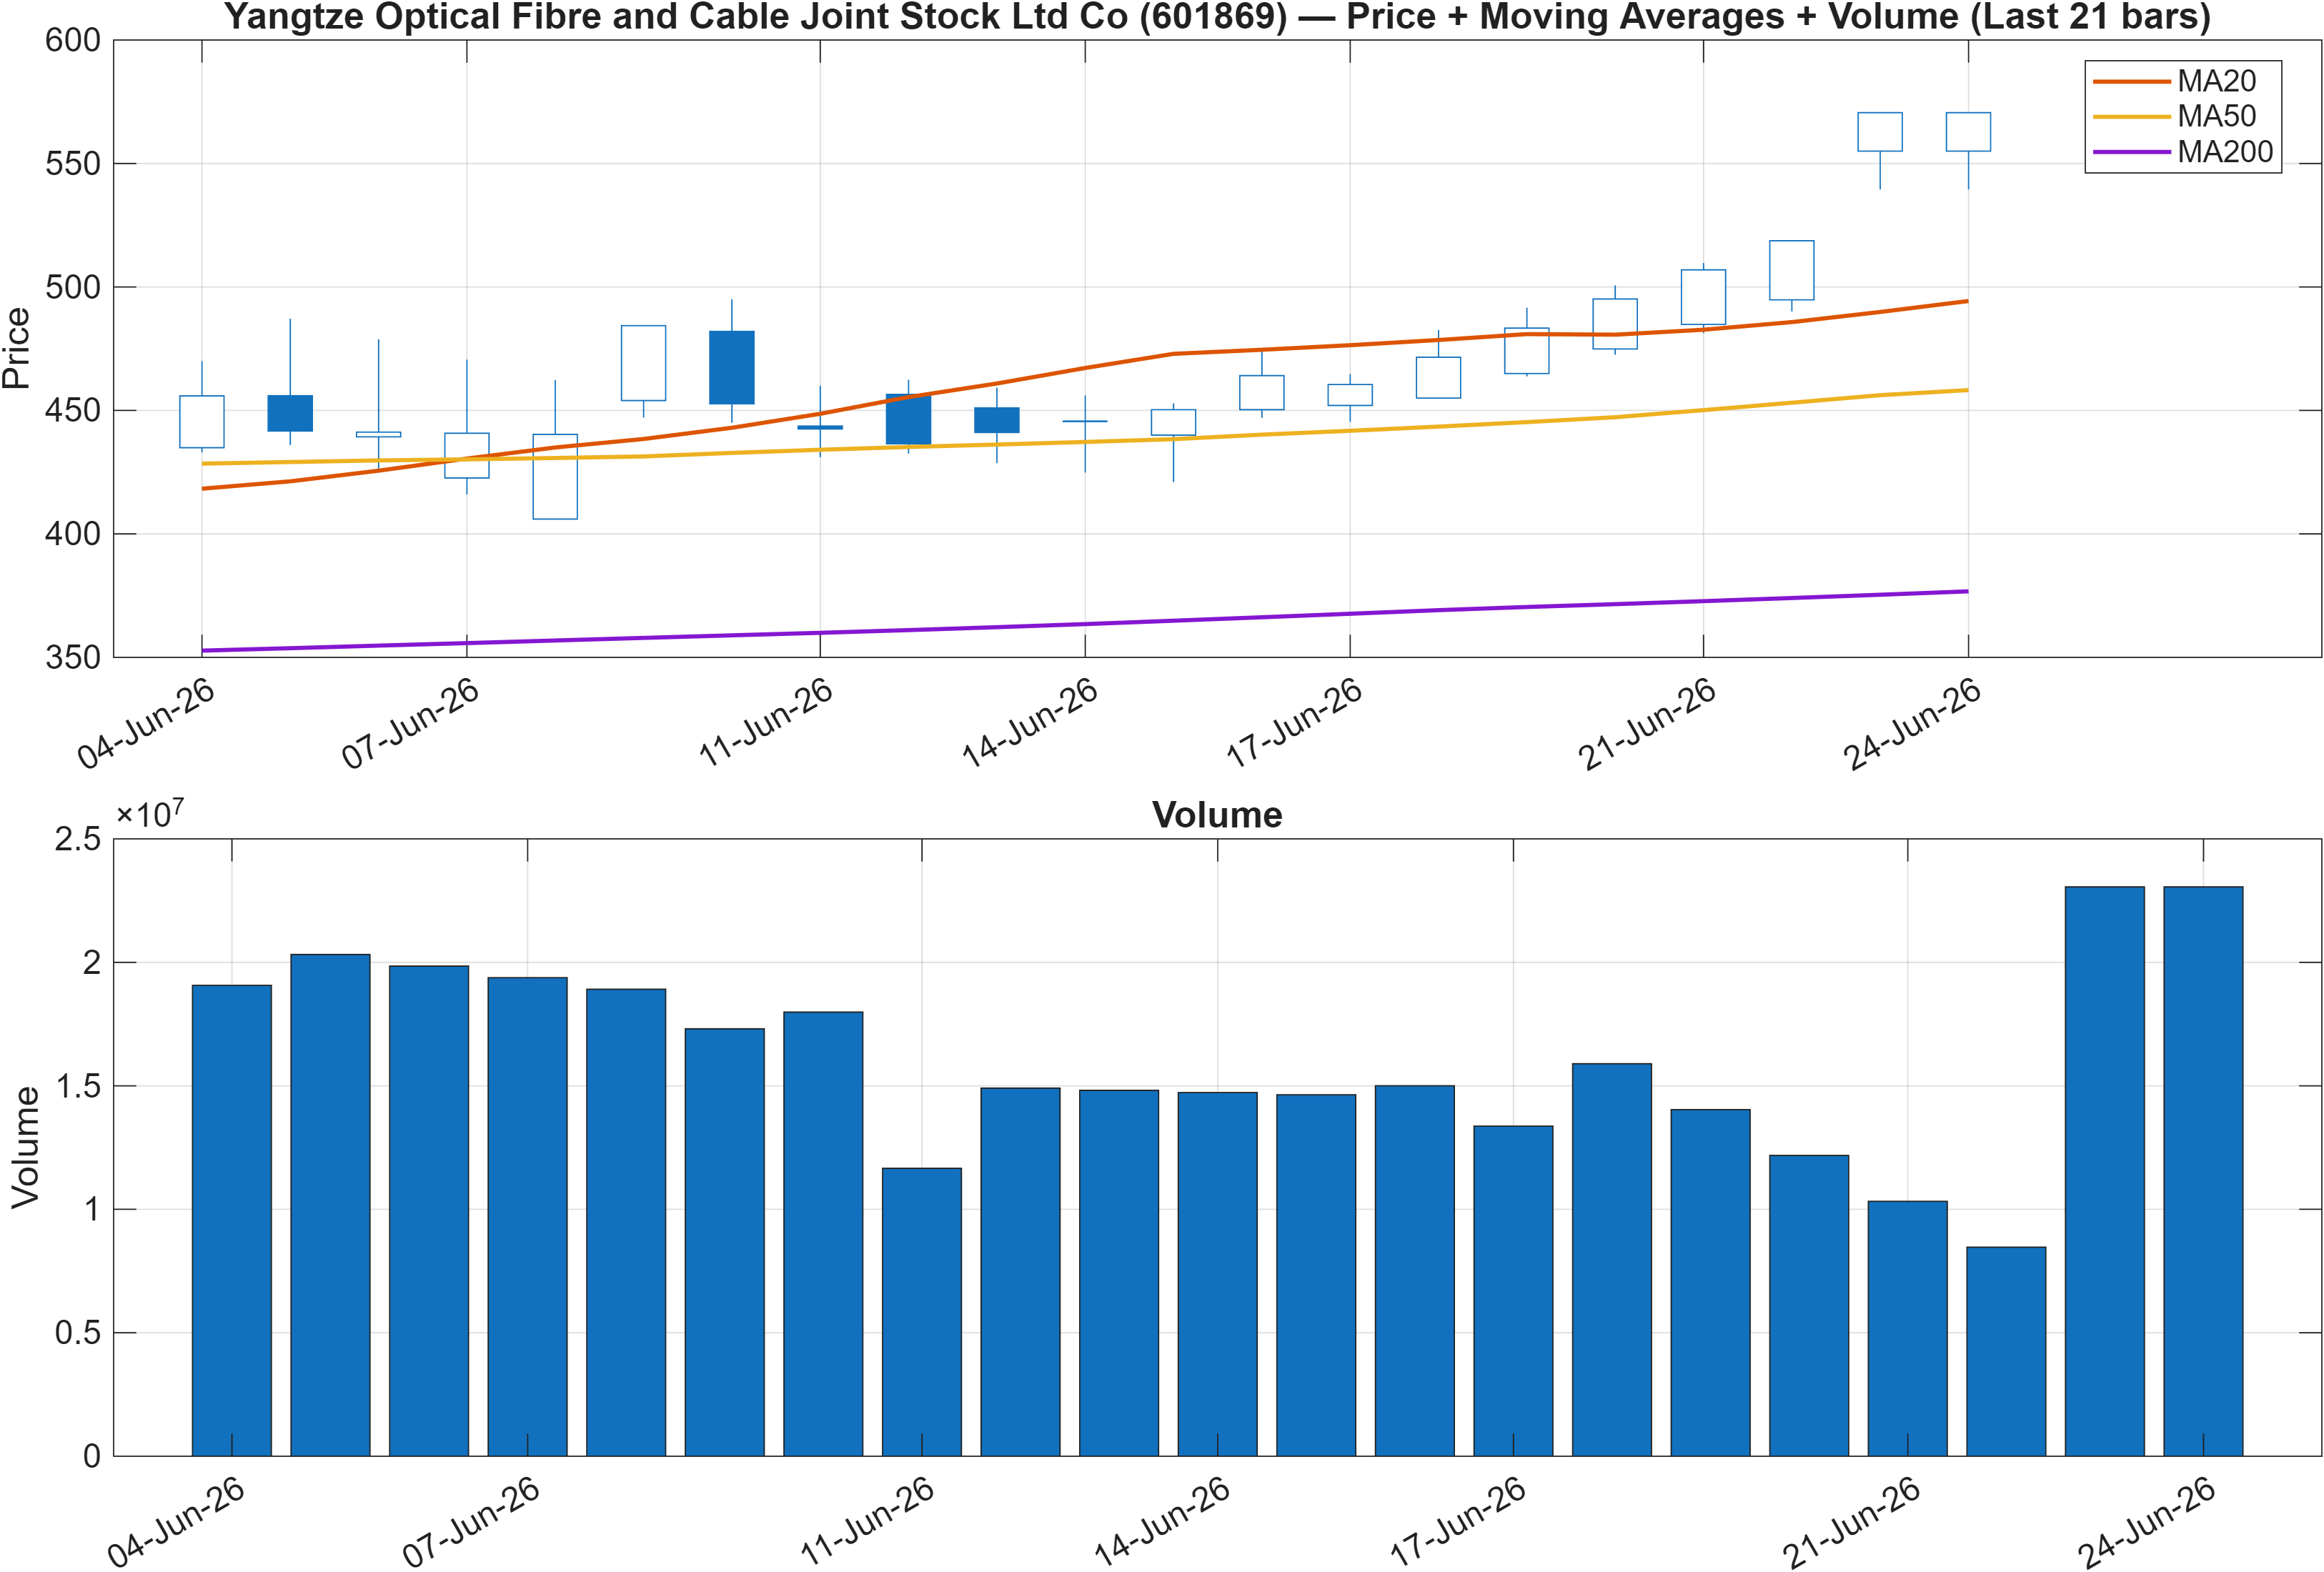
Interpretation: Close vs MA50 = Bullish, MA50 vs MA200 = Bullish.
Trend structure is currently defined by moving-average confirmation rather than an outright breakout regime. With Close vs MA50 bullish and MA50 vs MA200 bullish, the baseline read is constructive: shorter-term price action is above the intermediate trend, and the intermediate trend sits above the longer-term trend. That configuration generally supports trend persistence, but it does not, by itself, resolve the rank divergence where the monthly rank (#1211) remains weak.
The label in the title—“consolidation phase holds”—fits a market where the dominant trend metrics are positive while the instrument still needs follow-through to shift the intermediate probability profile. In these conditions, the key analytical distinction is whether consolidation is accumulation within an uptrend (support holding as pullbacks are absorbed) or distribution into resistance (rallies stalling and failing to attract incremental demand).
The nearest structural frame for that distinction comes from the level map in Section 4: support ~351.0592 and resistance ~493.3062. With bullish moving-average alignment, reactions into the support zone carry more informational content than minor dips: a stable base above ~351.0592 supports the interpretation that the MA structure is being defended. Conversely, failure beneath that zone would not only challenge the “bullish trend” read, but also align with the weaker intermediate ranks by signaling that the short-run strength was not durable.
From a market-structure perspective, volume confirmation matters most around resistance. The provided scenario framing—break above resistance with volume—acts as the cleanest trend continuation checkpoint, especially given that the daily rank is exceptionally strong (#6) but longer ranks are not yet supportive.
3) Momentum & volatility dashboard
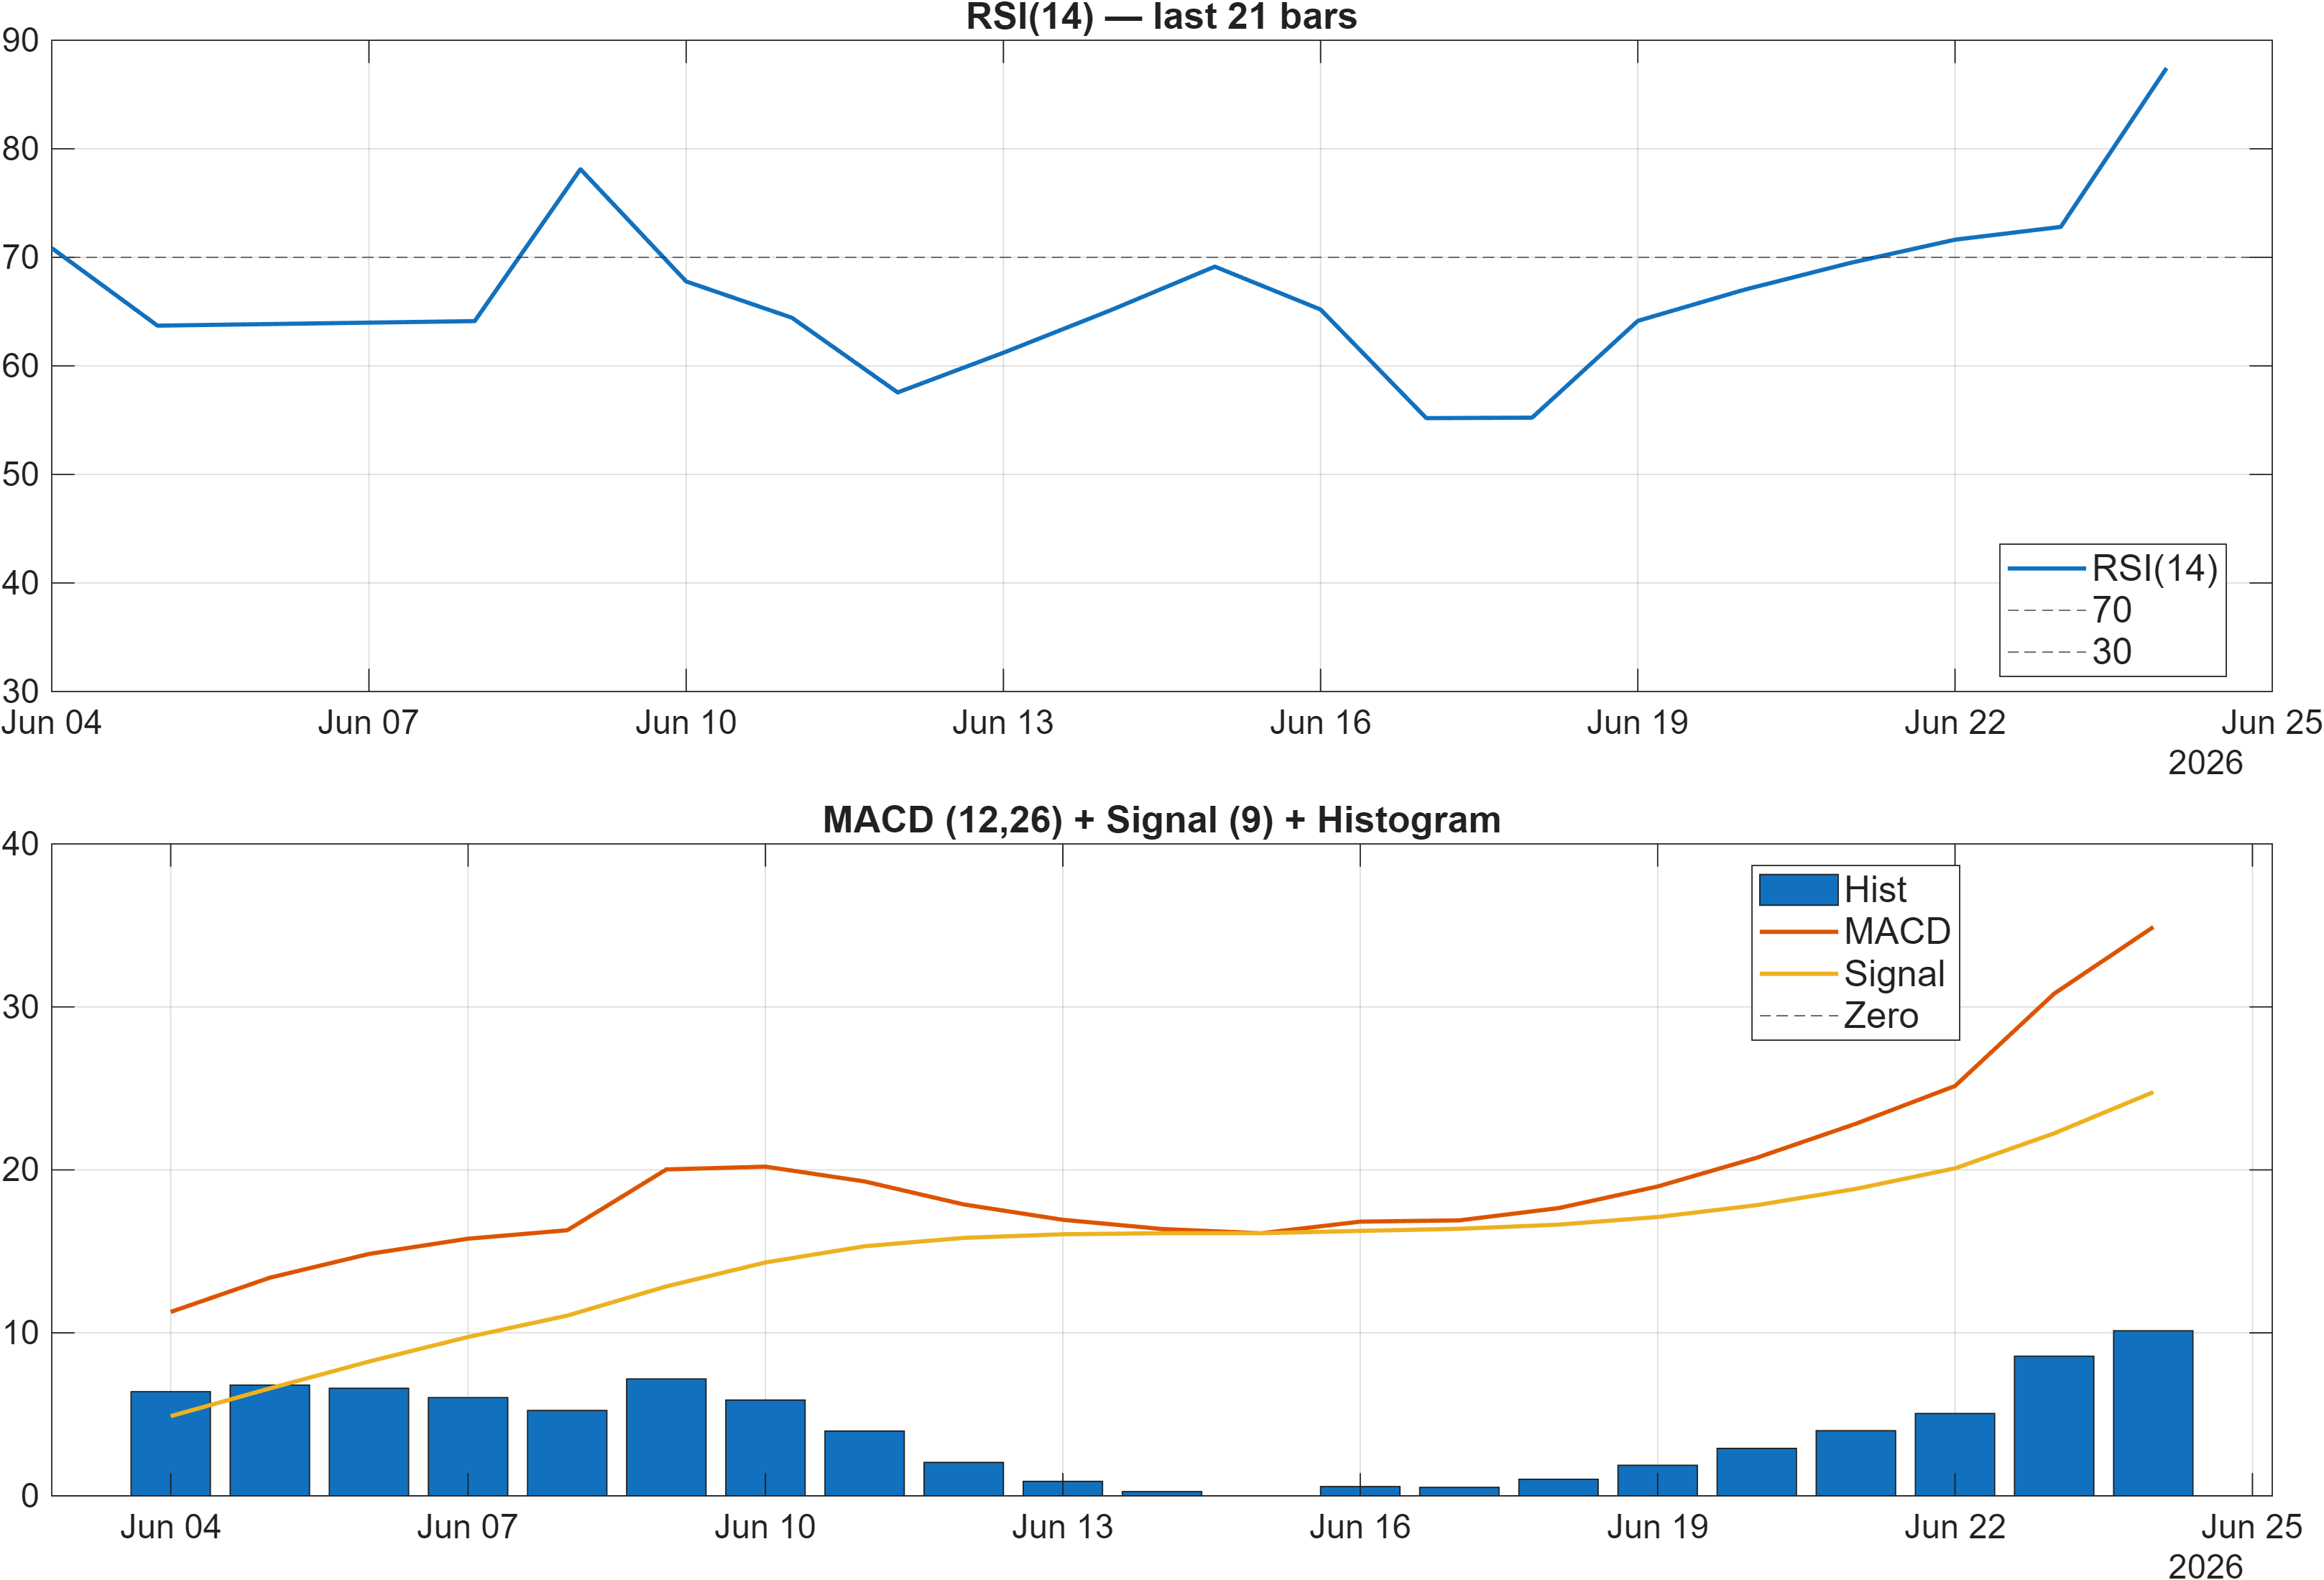
Interpretation: RSI bias = Bullish, MACD hist = 10.1273.
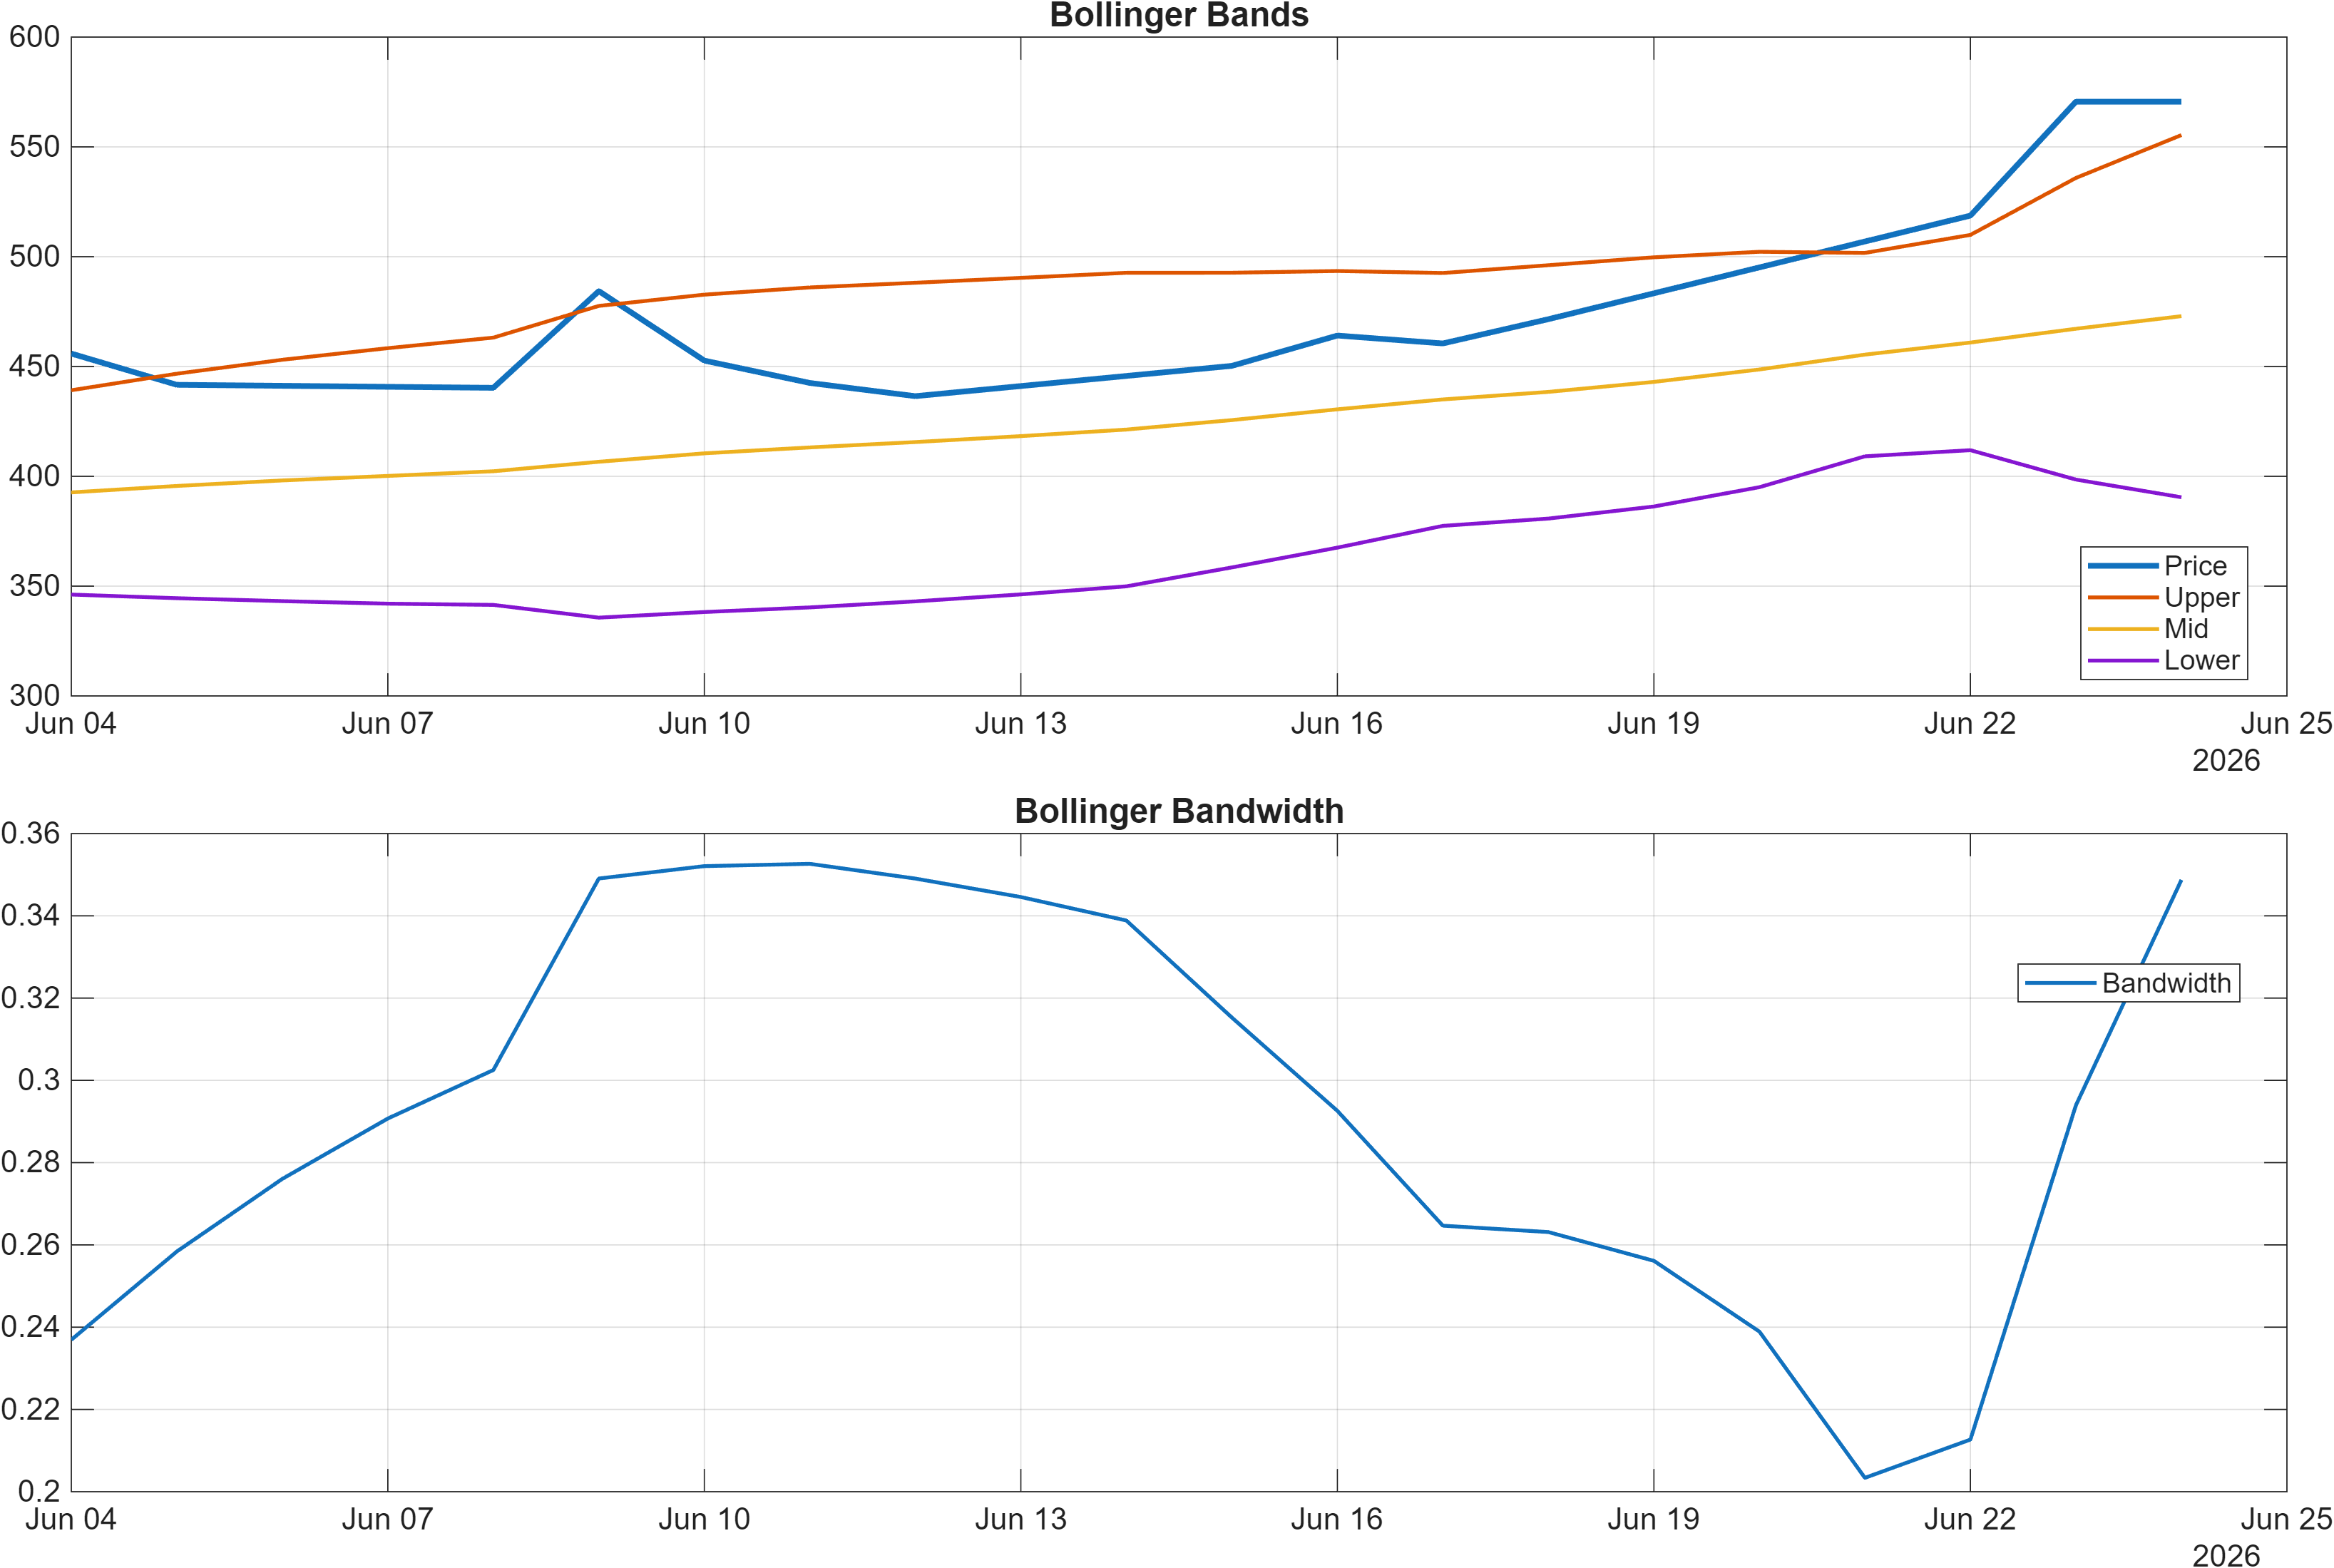
Interpretation: Bandwidth (volatility regime) latest = 0.3487.
Momentum is emphatically positive, but the strength-versus-exhaustion question is now central. The dashboard flags RSI bias as bullish and shows a MACD histogram of 10.1273, consistent with positive impulse. In the signal set (Section 5), RSI(14) at 87.43 and Stoch %K at 100 coexist—one bullish, one bearish—creating a useful internal check: the move has strong momentum, yet at least one oscillator is registering stretched conditions.
Volatility context helps interpret that stretch. Bollinger Bandwidth at 0.3487 indicates volatility is present rather than tightly compressed; this often accompanies trending behavior, but it can also amplify the consequences of reversals if the market shifts from expansion to mean reversion. Importantly, BB Width is tagged Neutral in the heatmap table, suggesting volatility is not the primary driver of the bullish score—momentum and participation signals are.
The best-read synthesis is that 601869 is in a momentum-forward state with limited immediate confirmation of exhaustion, but with oscillators sufficiently elevated that follow-through needs to be orderly. If momentum remains positive while price respects the level structure (support ~351.0592), the elevated RSI can simply reflect trend strength. If momentum softens while volatility stays elevated, the risk shifts toward sharper pullbacks that may pressure intermediate ranks, which are already weak on a monthly basis (#1211).
4) Support / Resistance zones
Support ~ 351.0592 | Resistance ~ 493.3062
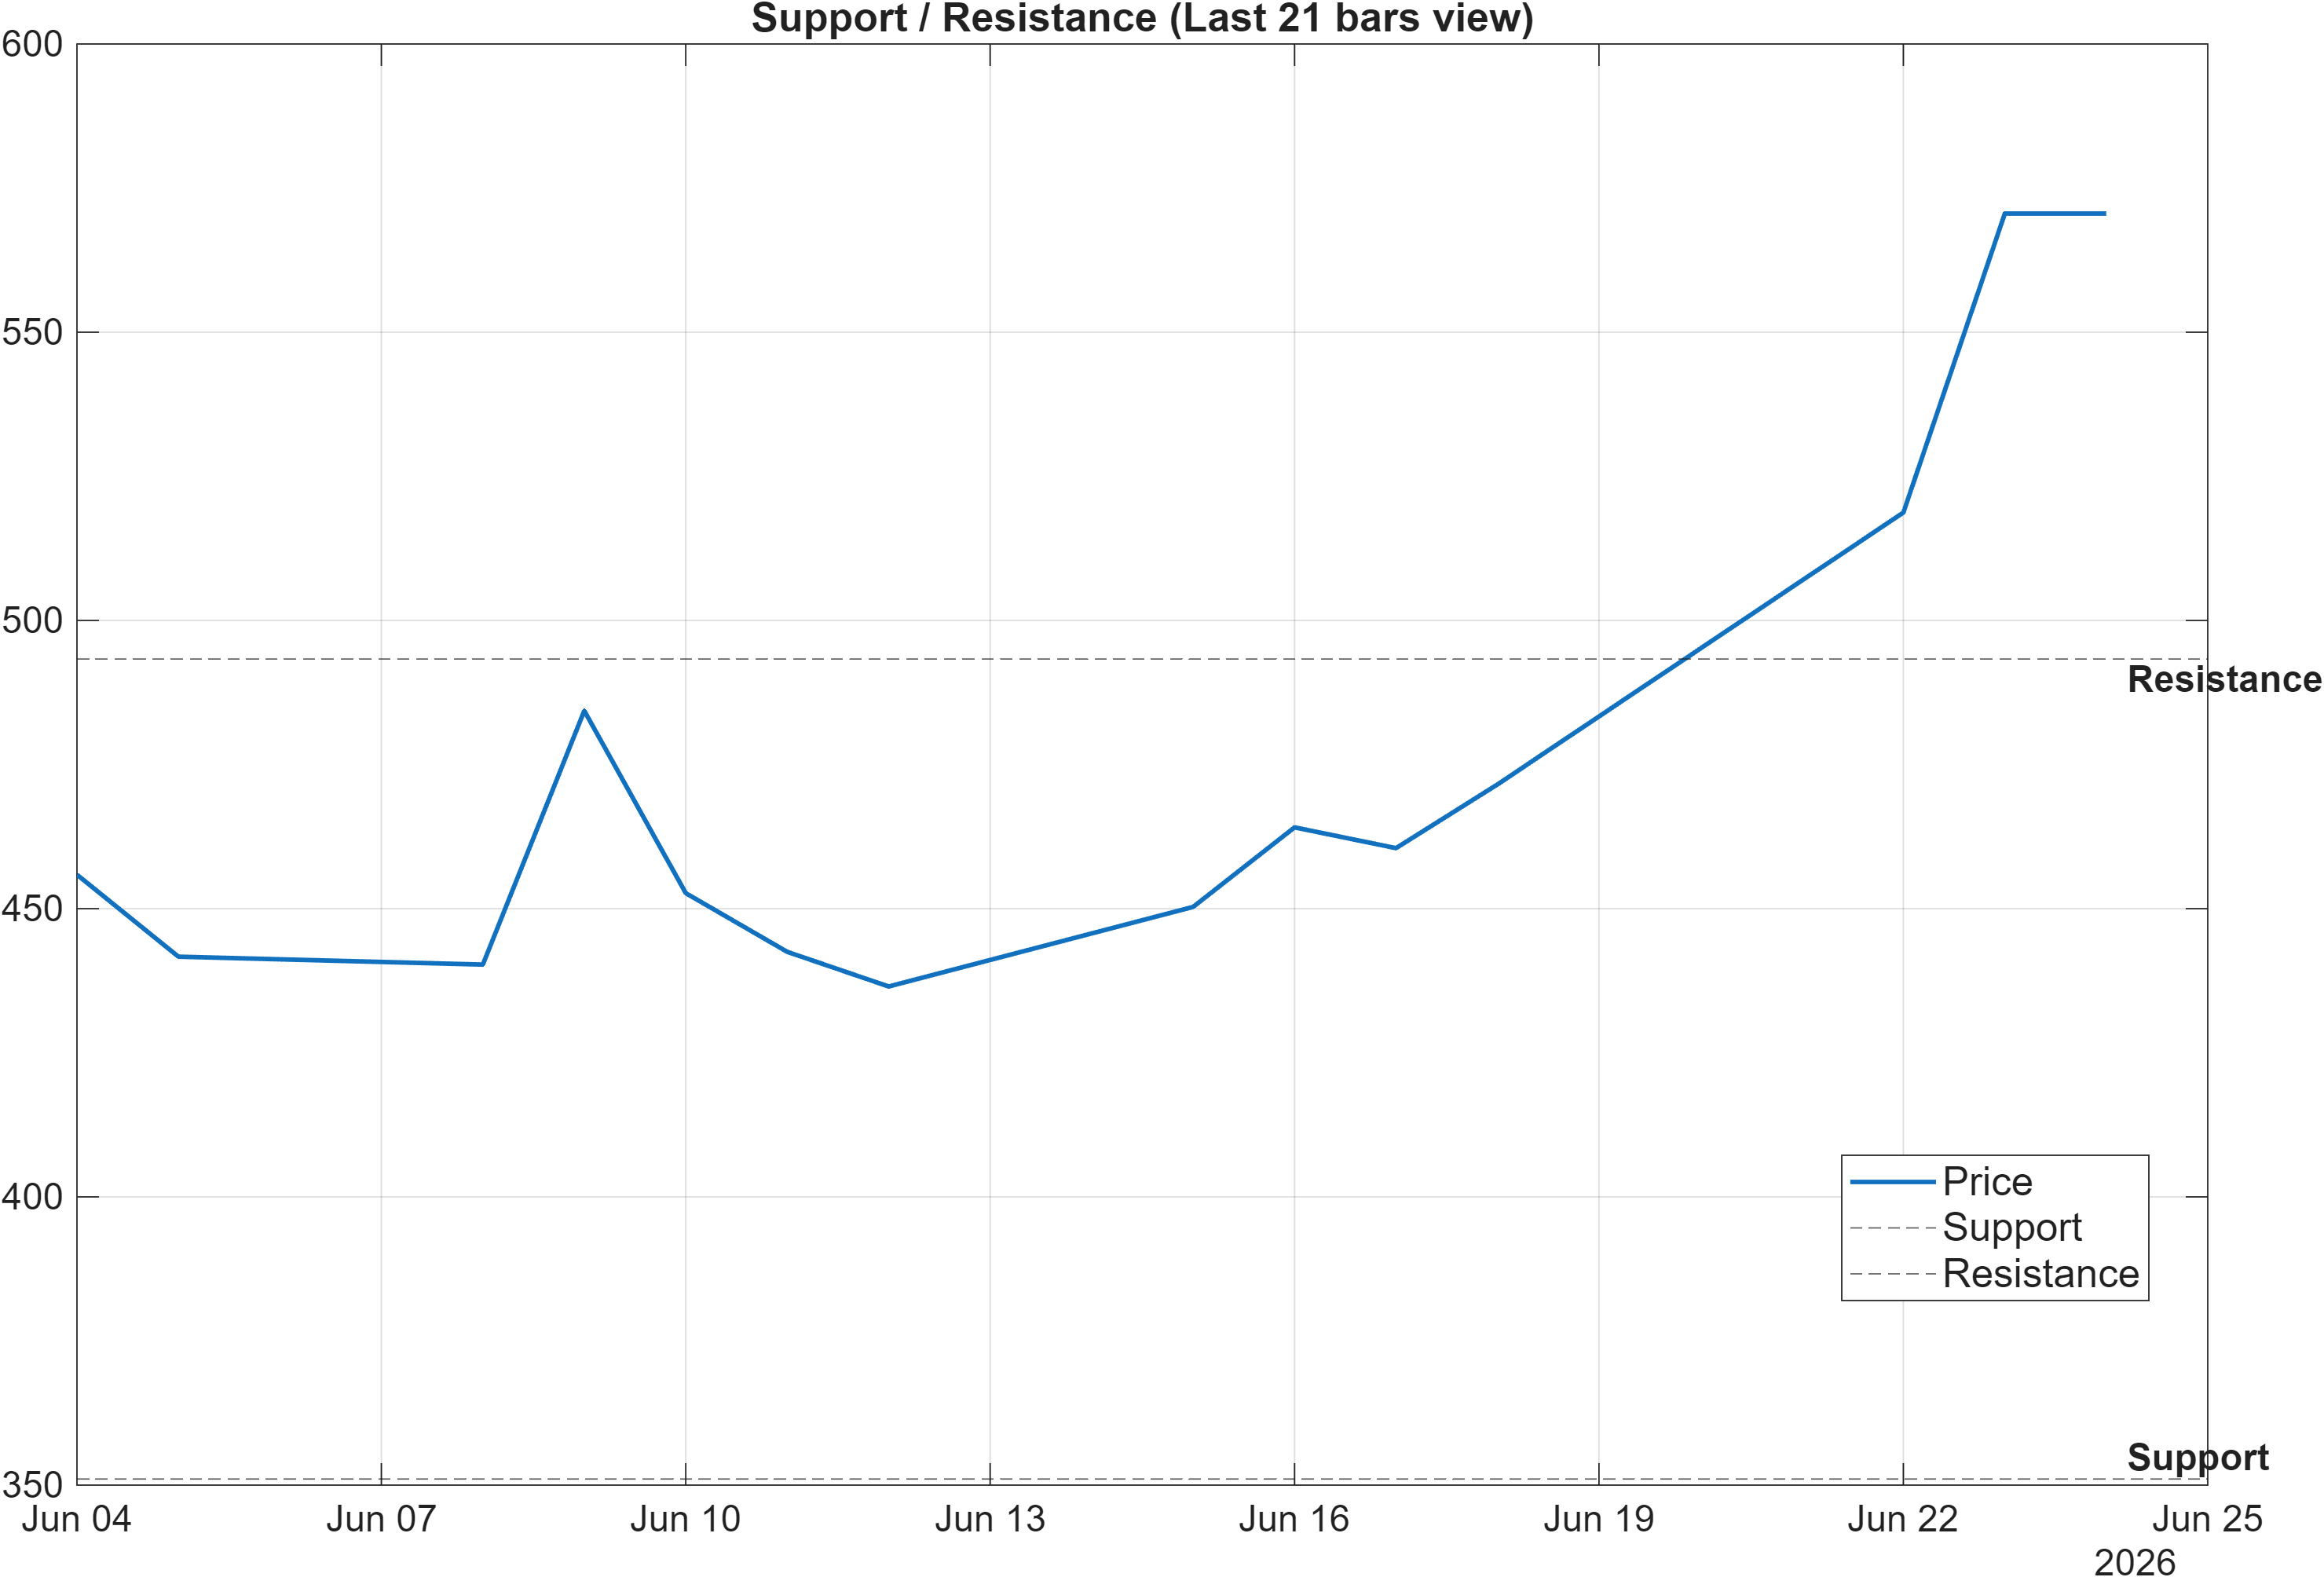
Scenario view: Break above resistance with volume → continuation. Close below support → signal deterioration risk.
The current market map is clean: support ~351.0592 and resistance ~493.3062. In a regime where moving averages are bullish (Close vs MA50 bullish; MA50 vs MA200 bullish) and confluence is bullish (overall technical score 0.671), these zones become decision points for validating the bullish stack rather than mere reference lines.
The resistance zone (~493.3062) is the more consequential threshold for reconciling the horizon mismatch in ranks. With the daily rank at #6, the instrument is already behaving well relative to peers in the very short run; a sustained push through resistance, especially with volume as specified in the scenario view, would provide a higher-quality bridge between short-term strength and the weaker intermediate profile (monthly #1211, 3-monthly #1028). Without that breakout confirmation, the bullish technical posture can still persist, but it is more likely to express as consolidation and rotation rather than trending continuation.
On the downside, a close below 351.0592 has asymmetric importance because it would directly contradict multiple supportive signals at once: it would challenge bullish trend alignment, undermine the “consolidation holds” framing, and likely erode the breadth/volume signals that are currently supportive (e.g., positive AD/OBV slopes in the dashboard). In that case, the weaker longer-window ranks would no longer look like lagging indicators—they would look like early warnings.
Practically, markets often probe these zones before choosing direction. The key is whether tests of resistance are accompanied by expanding participation, and whether pullbacks into support remain controlled enough to preserve the bullish technical blend.
5) Quant Technical Dashboard (18 Signals)
KGNAI AI Technical Analysis Score (Deep Reinforcement Learning): Rank #289 out of 1292 (Rank 1 represents the strongest technical positioning and a higher probability of favorable price behavior. As ranks increase toward the maximum, the probability of favorable outcomes weakens and bearish positioning becomes more dominant.) | Label: Neutral | Score: 0.553
18-Signal Technical Confluence Score: 0.722 (Bullish)
Overall Technical Score (18-signal confluence + DRL rank blend): 0.671 (Bullish)
Note: The blended score reflects signal strength weighted against broader AI technical ranking, which may temporarily diverge.
Blended technical score breakdown: 0.671 (Bullish | Bull 14 / Bear 1 / Neutral 3)
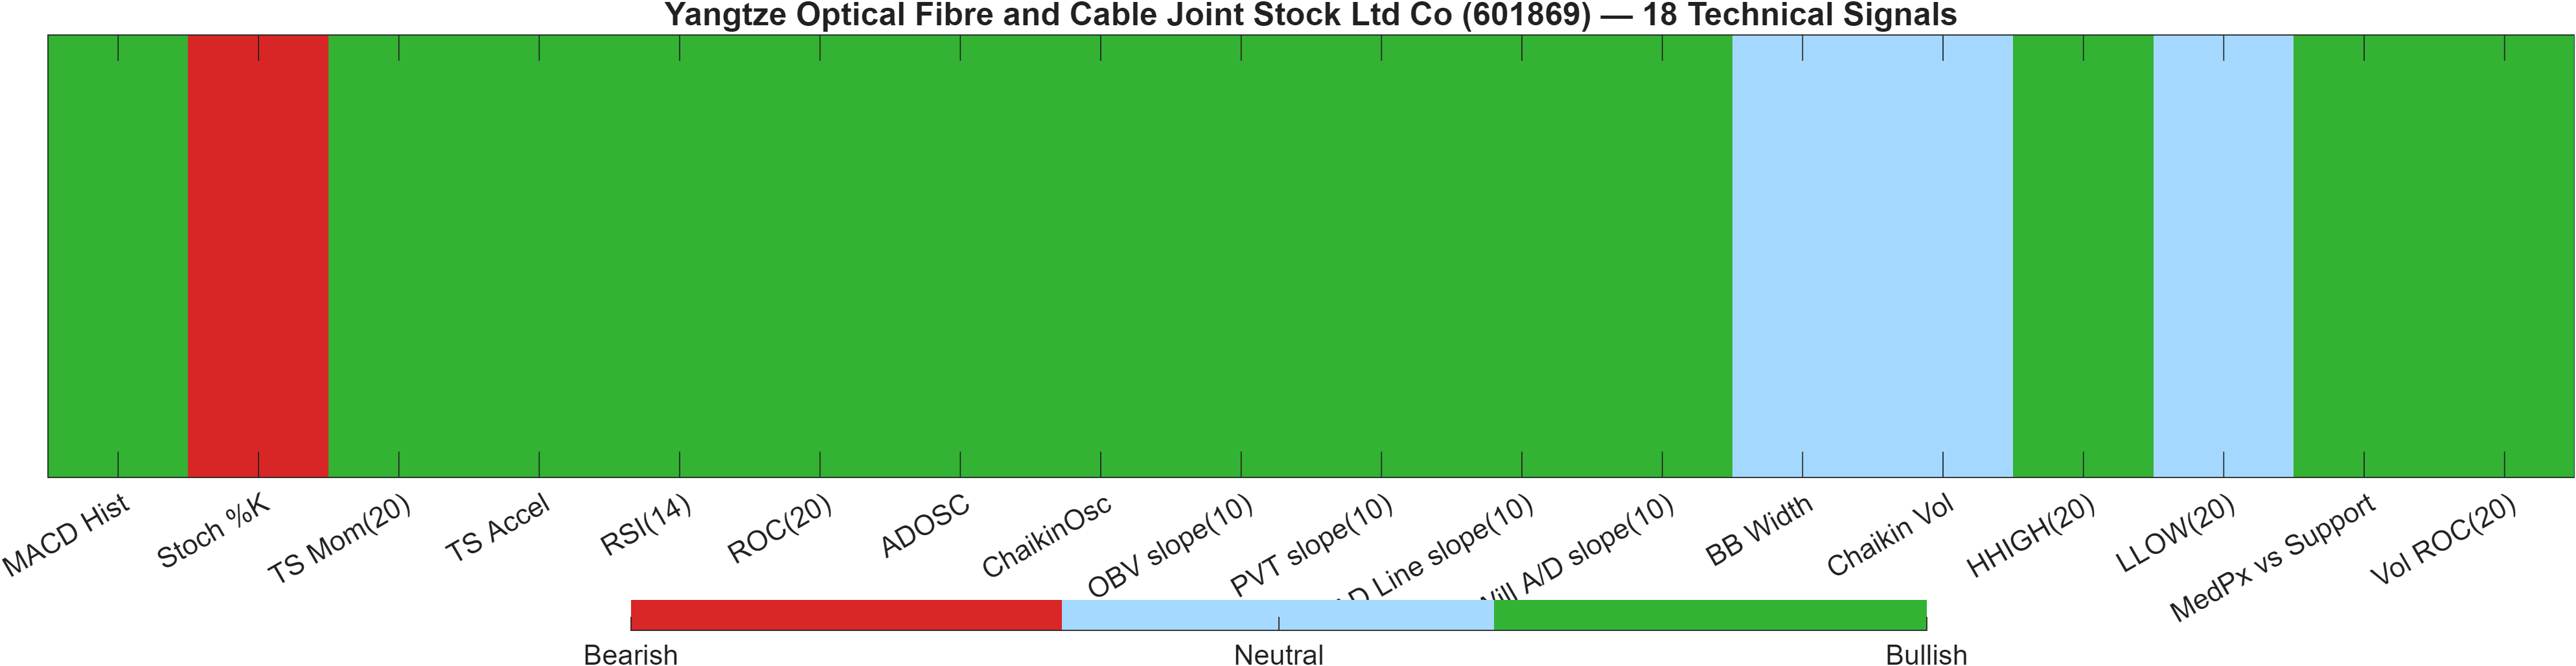
The technical layer is best described as confluence-led bullishness with a model-level caveat. The 18-signal system posts a confluence score of 0.722 with a Bullish label, and the blended overall technical score remains bullish at 0.671. Internally, that bullishness is broad-based (Bull 14 / Bear 1 / Neutral 3), which typically increases robustness versus “single-indicator” rallies.
The caveat comes from the independent DRL technical rank: #289 out of 1292 with a Neutral label and score 0.553. That gap is analytically meaningful: it suggests that while classical/quant indicators are strongly aligned, the broader pattern library used by the DRL model is less convinced that the current structure is among the strongest in the universe. This sort of divergence often appears during transitions—either early improvements that still need confirmation, or late-stage runs where oscillators stay strong but structural quality is average.
Looking through the signal mix, momentum and participation dominate the bullish side: MACD Hist (10.13) is bullish, and RSI(14) (87.43) is bullish, while volume/breadth proxies (e.g., AD/OBV/PVT slopes) also skew bullish. The lone bearish signal is Stoch %K (100), consistent with the earlier observation that the move is stretched. Meanwhile, BB Width (0.3487) and Chaikin Vol (-15.98) sit neutral, implying the bullish score is not simply a volatility artifact.
Signal table (Bull/Bear/Neutral)
| Indicator | Value | Signal |
|---|---|---|
| MACD Hist | 10.13 | Bullish |
| Stoch %K | 100 | Bearish |
| TS Mom(20) | 128.9 | Bullish |
| TS Accel | 78.38 | Bullish |
| RSI(14) | 87.43 | Bullish |
| ROC(20) | 29.19 | Bullish |
| ADOSC | 75.03 | Bullish |
| ChaikinOsc | 3.186e+07 | Bullish |
| OBV slope(10) | 1.002e+08 | Bullish |
| PVT slope(10) | 4.285e+06 | Bullish |
| AD Line slope(10) | 1.023e+08 | Bullish |
| Will A/D slope(10) | 207 | Bullish |
| BB Width | 0.3487 | Neutral |
| Chaikin Vol | -15.98 | Neutral |
| HHIGH(20) | 570.6 | Bullish |
| LLOW(20) | 406 | Neutral |
| MedPx vs Support | 204 | Bullish |
| Vol ROC(20) | 13.48 | Bullish |
Interpretation: Indicator-level signals form the base confluence, which is then adjusted using a separate AI-driven technical ranking model. The final technical score summarizes this combined view.
6) News sentiment + extractive gist
Note: Instrument-specific news matches were not found, so the digest includes broader market/sector headlines. Links are provided for verification.
Sentiment score (avg): 0.013 | Positive: 19% | Neutral: 69% | Negative: 12%
KGNAI AI News Sentiment Score (normalized -1 to +1): 1.00 (as of 2026-06-12) | Label: Bullish | Overall news score: 1.00
Positive Developments
Recent coverage across major financial outlets indicates a cautiously constructive backdrop for parts of the broader China tech/industrial ecosystem, with several items skewing toward innovation capacity and capital formation. Developments tied to high-performance computing leadership and continued investment narratives can act as a soft tailwind for risk appetite in adjacent technology supply chains, particularly when markets are already exhibiting strong technical posture. In this report, that matters because 601869’s technical layer is already aligned bullishly (overall technical score 0.671; confluence 0.722), so even modestly supportive sector tone can help maintain participation through consolidation. The distribution of coverage is predominantly non-negative (69% neutral, 19% positive), which is consistent with a market environment where incremental positive themes can influence positioning without needing a single catalyst. The normalized sentiment reading of 1.00 (labeled bullish) suggests the model is detecting a favorable directional tilt in the aggregated text stream despite the modest average sentiment (0.013).
Neutral / Mixed Developments
The digest also reflects a heavy share of informational macro and geopolitical narratives rather than company-specific catalysts, which typically translates into headline noise for single names. With instrument-specific matches not available in the provided data, the neutral majority (69%) should be treated as contextual background rather than a direct driver for 601869. In such conditions, price tends to lean more on internal market mechanics—trend positioning (Close vs MA50 bullish; MA50 vs MA200 bullish), momentum (MACD histogram 10.1273), and the level framework (support ~351.0592, resistance ~493.3062). The practical implication is that news flow is less likely to resolve the current rank divergence (daily #6 vs monthly #1211) on its own; instead, confirmation is more likely to come from technical follow-through and participation metrics.
Negative / Risk Signals
Negative items within the broader feed appear more event-driven than sector- or company-specific, but they still matter as potential triggers for volatility spikes. Even with only 12% of the coverage scoring negative, risk-off shocks can have outsized effects when momentum is elevated—here, evidenced by RSI(14) at 87.43 and a stretched oscillator signal (Stoch %K at 100, bearish). When markets carry “strong but stretched” technical conditions, adverse headlines can accelerate mean reversion and test support zones more quickly than usual. That is why the invalidation marker (close below 351.0592) is analytically central: it is the point at which a volatility-driven drawdown would begin to contradict the otherwise bullish technical confluence. With Bollinger Bandwidth at 0.3487, volatility is not fully compressed, so downside moves can travel further before stabilizing if risk sentiment deteriorates.
What to monitor next:
- Price behavior and volume response near 493.3062 (breakout confirmation vs repeated rejection).
- Whether pullbacks remain above 351.0592 as momentum oscillators stay elevated (RSI(14) 87.43).
- Any shift in sentiment distribution away from the current 69% neutral baseline toward a more risk-off mix.
Sources referenced: Reuters, Bloomberg, Yahoo Finance, MarketWatch, Investing.com
7) Sources
Not available in the provided data.
You may also like: How KGNAI AI ranks instruments across global markets
Disclaimer: KGNAI provides AI-generated analytics and educational market commentary only. This is not financial advice. Markets involve risk. Always do your own research.