UNO-USD (Unobtanium) — 12-Jun-2026 Technical & Rank Review with Neutral Multi-Horizon Stance
UNO-USD sits in a mixed configuration where cross-sectional rank strength is highly time-dependent while price structure and signal confluence point in different directions. Within KGNAI’s 800-instrument crypto universe, the Daily rank is #1, but the Weekly (#351), Monthly (#272), and 3-Monthly (#258) readings remain neutral—suggesting a short-horizon burst that has not yet translated into broader relative leadership. Technically, the blended dashboard is Bullish (overall technical score 0.371) even as the moving-average read is Bearish (close vs MA50 and MA50 vs MA200 both bearish). Momentum is not extreme (RSI(14) 50.35), while MACD hist 0.2167 supports improving impulse. Key decision zones are defined by support ~1.3004 and resistance ~3.2817, with news sentiment broadly Neutral (avg 0.000; 88% neutral).
- Short / Mid / Long rank stance: Neutral / Neutral / Neutral, despite a Daily rank #1 burst within the 800-asset universe.
- Technical confluence label: Bullish (overall technical score 0.371), while the moving-average structure remains Bearish.
- Key levels: Support near 1.3004; resistance near 3.2817 (probabilistic zones, not fixed outcomes).
- News sentiment bias: Neutral (avg 0.000; 6% positive / 88% neutral / 6% negative).
- Confirmation / invalidation: A volume-backed break above 3.2817 is the primary confirmation condition; a close below 1.3004 increases deterioration risk.
KGNAI evaluates assets using large cross-sectional datasets built from millions of structured data points. Inputs incorporate fundamental metrics, technical structures, and systematically processed news sentiment. Statistical models, machine learning, and AI frameworks are used to assess relative positioning, signal alignment, and probabilistic behavior across broad universes.
- Ranks are comparative across the tracked universe, not absolute price targets.
- Confluence reflects alignment among independent signal groups.
- Support/resistance levels are probabilistic decision zones, not guarantees.
- Sentiment provides contextual bias within the broader analytical framework.
1) KGNAI AI Analysis
Region: CRYPTO
Total universe size: 800 ranked instruments
- Daily rank: #1 out of 800 — Bullish
- Weekly rank: #351 out of 800 — Neutral
- Monthly rank: #272 out of 800 — Neutral
- 3-Monthly rank: #258 out of 800 — Neutral
The rank panel signals a time-horizon asymmetry. UNO-USD’s Daily rank (#1) places it at the very top of the cross-section for near-term behavior, but the Weekly rank (#351) sits in the lower half of the universe, and the Monthly (#272) and 3-Monthly (#258) remain closer to the middle. This configuration often appears when an instrument experiences a short-lived impulse—strong enough to dominate the day-over-day distribution—without yet reshaping the higher-timeframe relative profile.
KGNAI’s stated term view is Neutral across short-, mid-, and long-term horizons. Taken alongside the rank dispersion, that neutrality is better read as “await confirmation” rather than indecision: the daily strength suggests participation is present, but the broader relative position has not re-anchored. In practical portfolio terms, the risk is that the daily spike reflects mean reversion within a still-neutral medium-term regime rather than a durable trend shift.
The rank methodology is probabilistic: lower ranks represent stronger positioning against peers, not certainty. For UNO-USD, the analytical focus becomes whether follow-through can pull the weekly/monthly readings away from the mid-pack and toward the upper quartile. Until that happens, signals that look “strong” on a one-day basis should be weighed against the still-neutral multi-horizon profile.
Term view: Short-term: Neutral. Mid-term: Neutral. Long-term: Neutral.
Want the full universe and complete rank tables? Unlock full access on KGNAI: https://www.kgnai.com/pricing
2) Price & trend overview
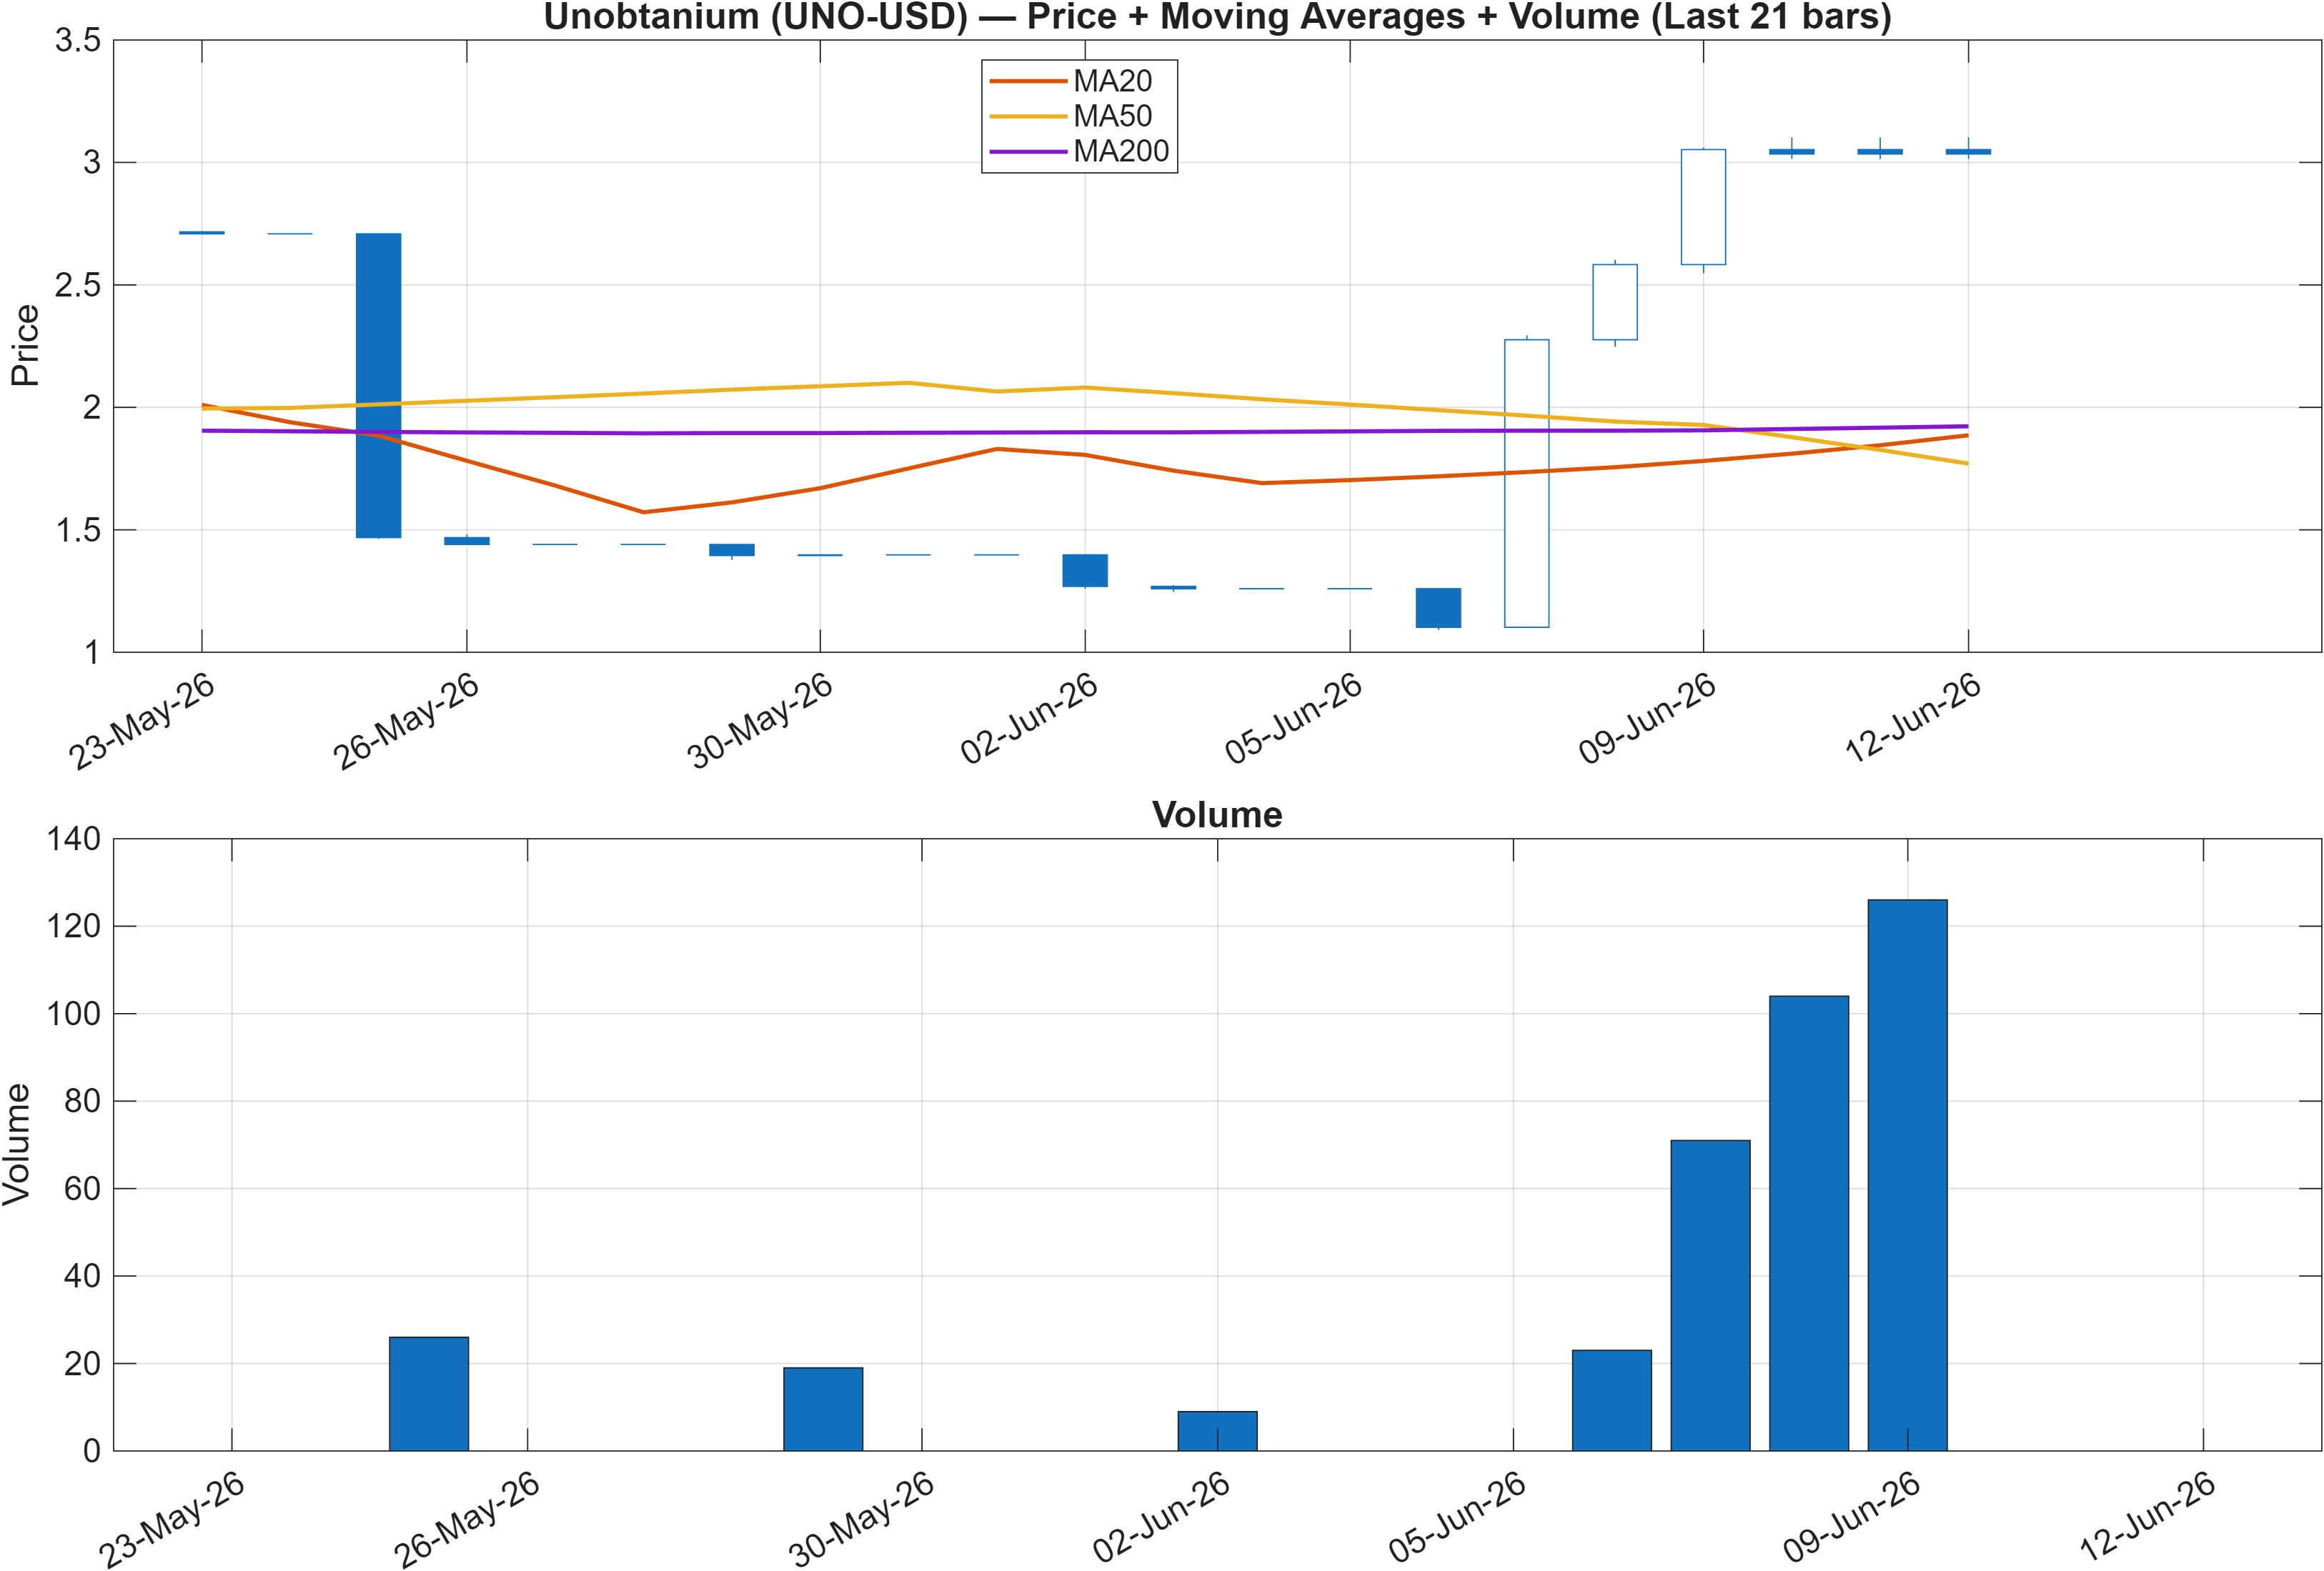
The moving-average structure remains a clear headwind. With close vs MA50 = Bearish and MA50 vs MA200 = Bearish, the setup resembles a market still working through a broader downtrend or post-downtrend repair process. When both relationships are bearish, rallies often face overhead supply as price approaches the intermediate trend filter (MA50), while the long-term filter (MA200) signals that the prevailing longer-cycle bias has not yet flipped.
That trend framework is particularly relevant given the rank dispersion: a Daily rank #1 can occur during counter-trend rebounds, especially when liquidity and positioning shift quickly. The question is not whether a bounce can occur, but whether the rebound has enough persistence to change the trend regime implied by the moving averages. A sustained transition typically requires repeated closes that reduce the distance to the MA50 and eventually challenge the MA200 relationship; none of that is implied by the bearish MA read alone.
For UNO-USD specifically, the trend read should be treated as the primary context setter for interpreting faster signals (RSI, MACD, and the 18-signal heatmap). In bearish MA regimes, bullish short-term indicators can be valid, but they tend to be more fragile and more sensitive to failure at nearby resistance—here, the key reference level is 3.2817, which sits well above the support ~1.3004 risk boundary.
Interpretation: Close vs MA50 = Bearish, MA50 vs MA200 = Bearish.
3) Momentum & volatility dashboard
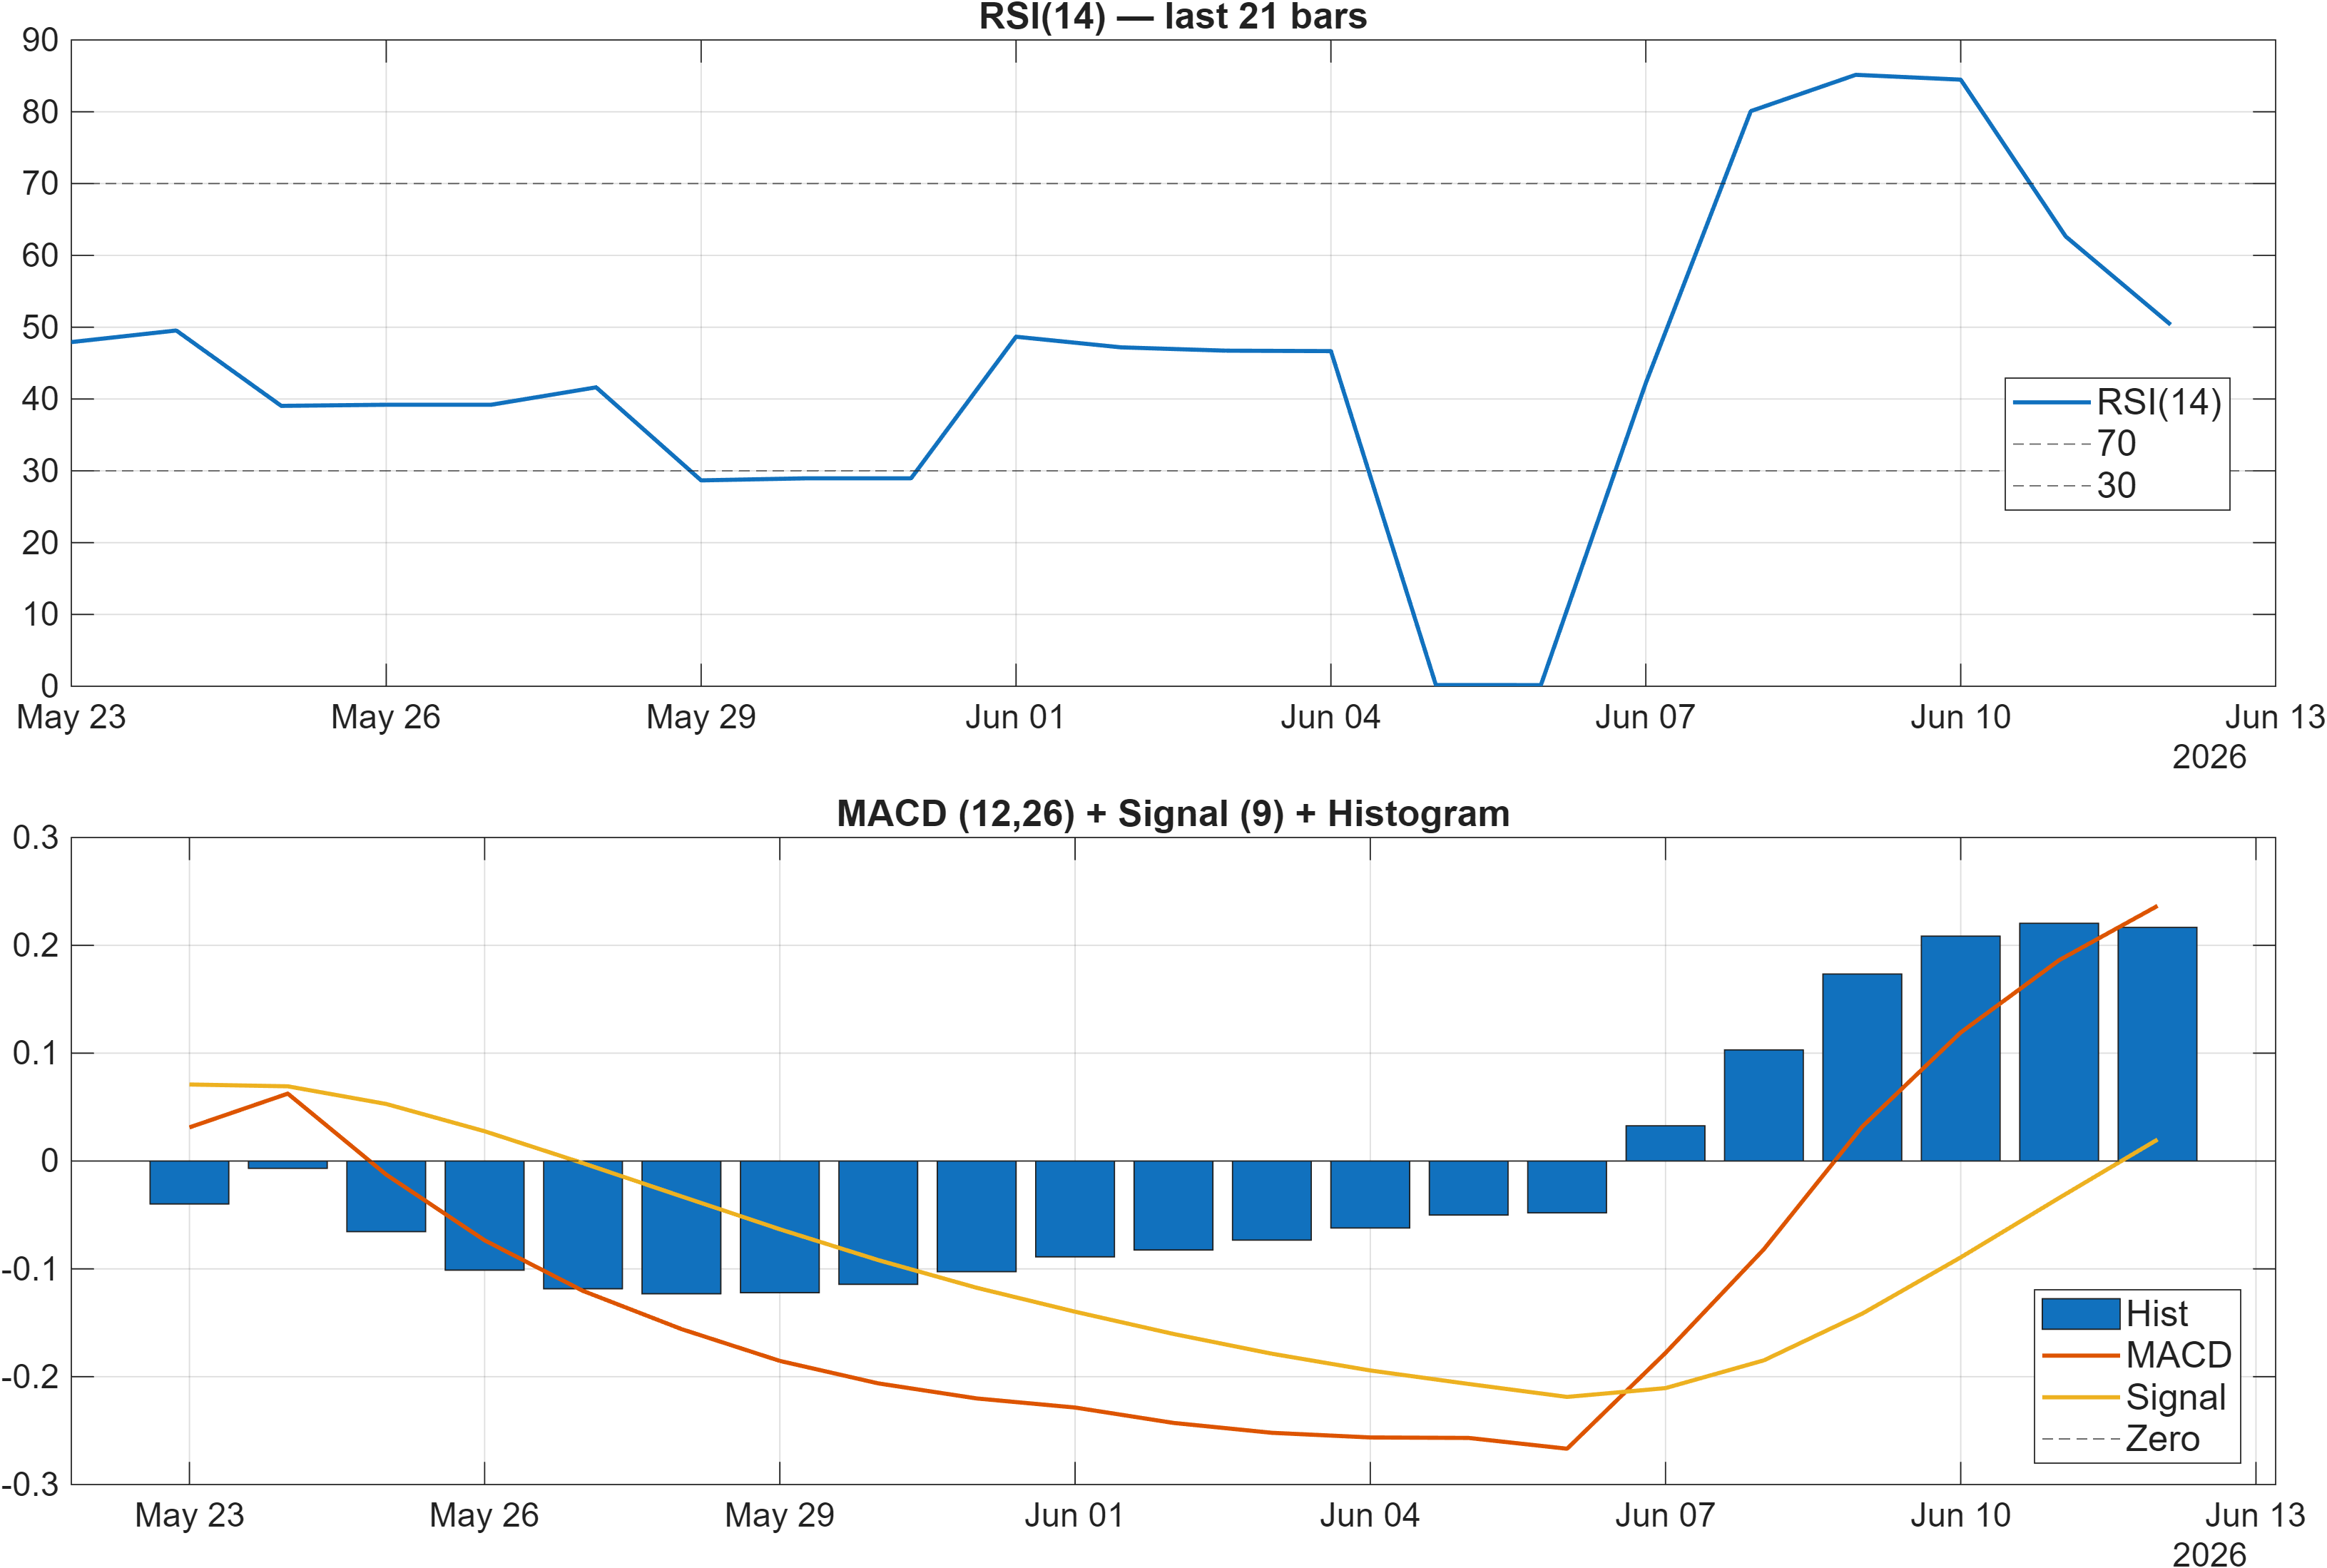
Momentum indicators are leaning toward stabilization rather than extension. The RSI bias is Neutral and RSI(14) is 50.35, which is consistent with a market that is neither overbought nor oversold on this lookback. In bearish moving-average regimes, a neutral RSI can be interpreted two ways: either a market is basing and absorbing supply, or momentum is failing to build enough pressure to overcome trend resistance.
MACD is more supportive of a rebound narrative. The MACD histogram at 0.2167 indicates positive impulse relative to its signal line, aligning with the daily rank strength and several bullish components in the technical dashboard. Still, MACD-positive conditions can persist during bear-market rallies; the higher-level validation tends to come from how price behaves near resistance and whether subsequent pullbacks hold above prior structure (with 1.3004 as the clearly defined lower boundary in this report).
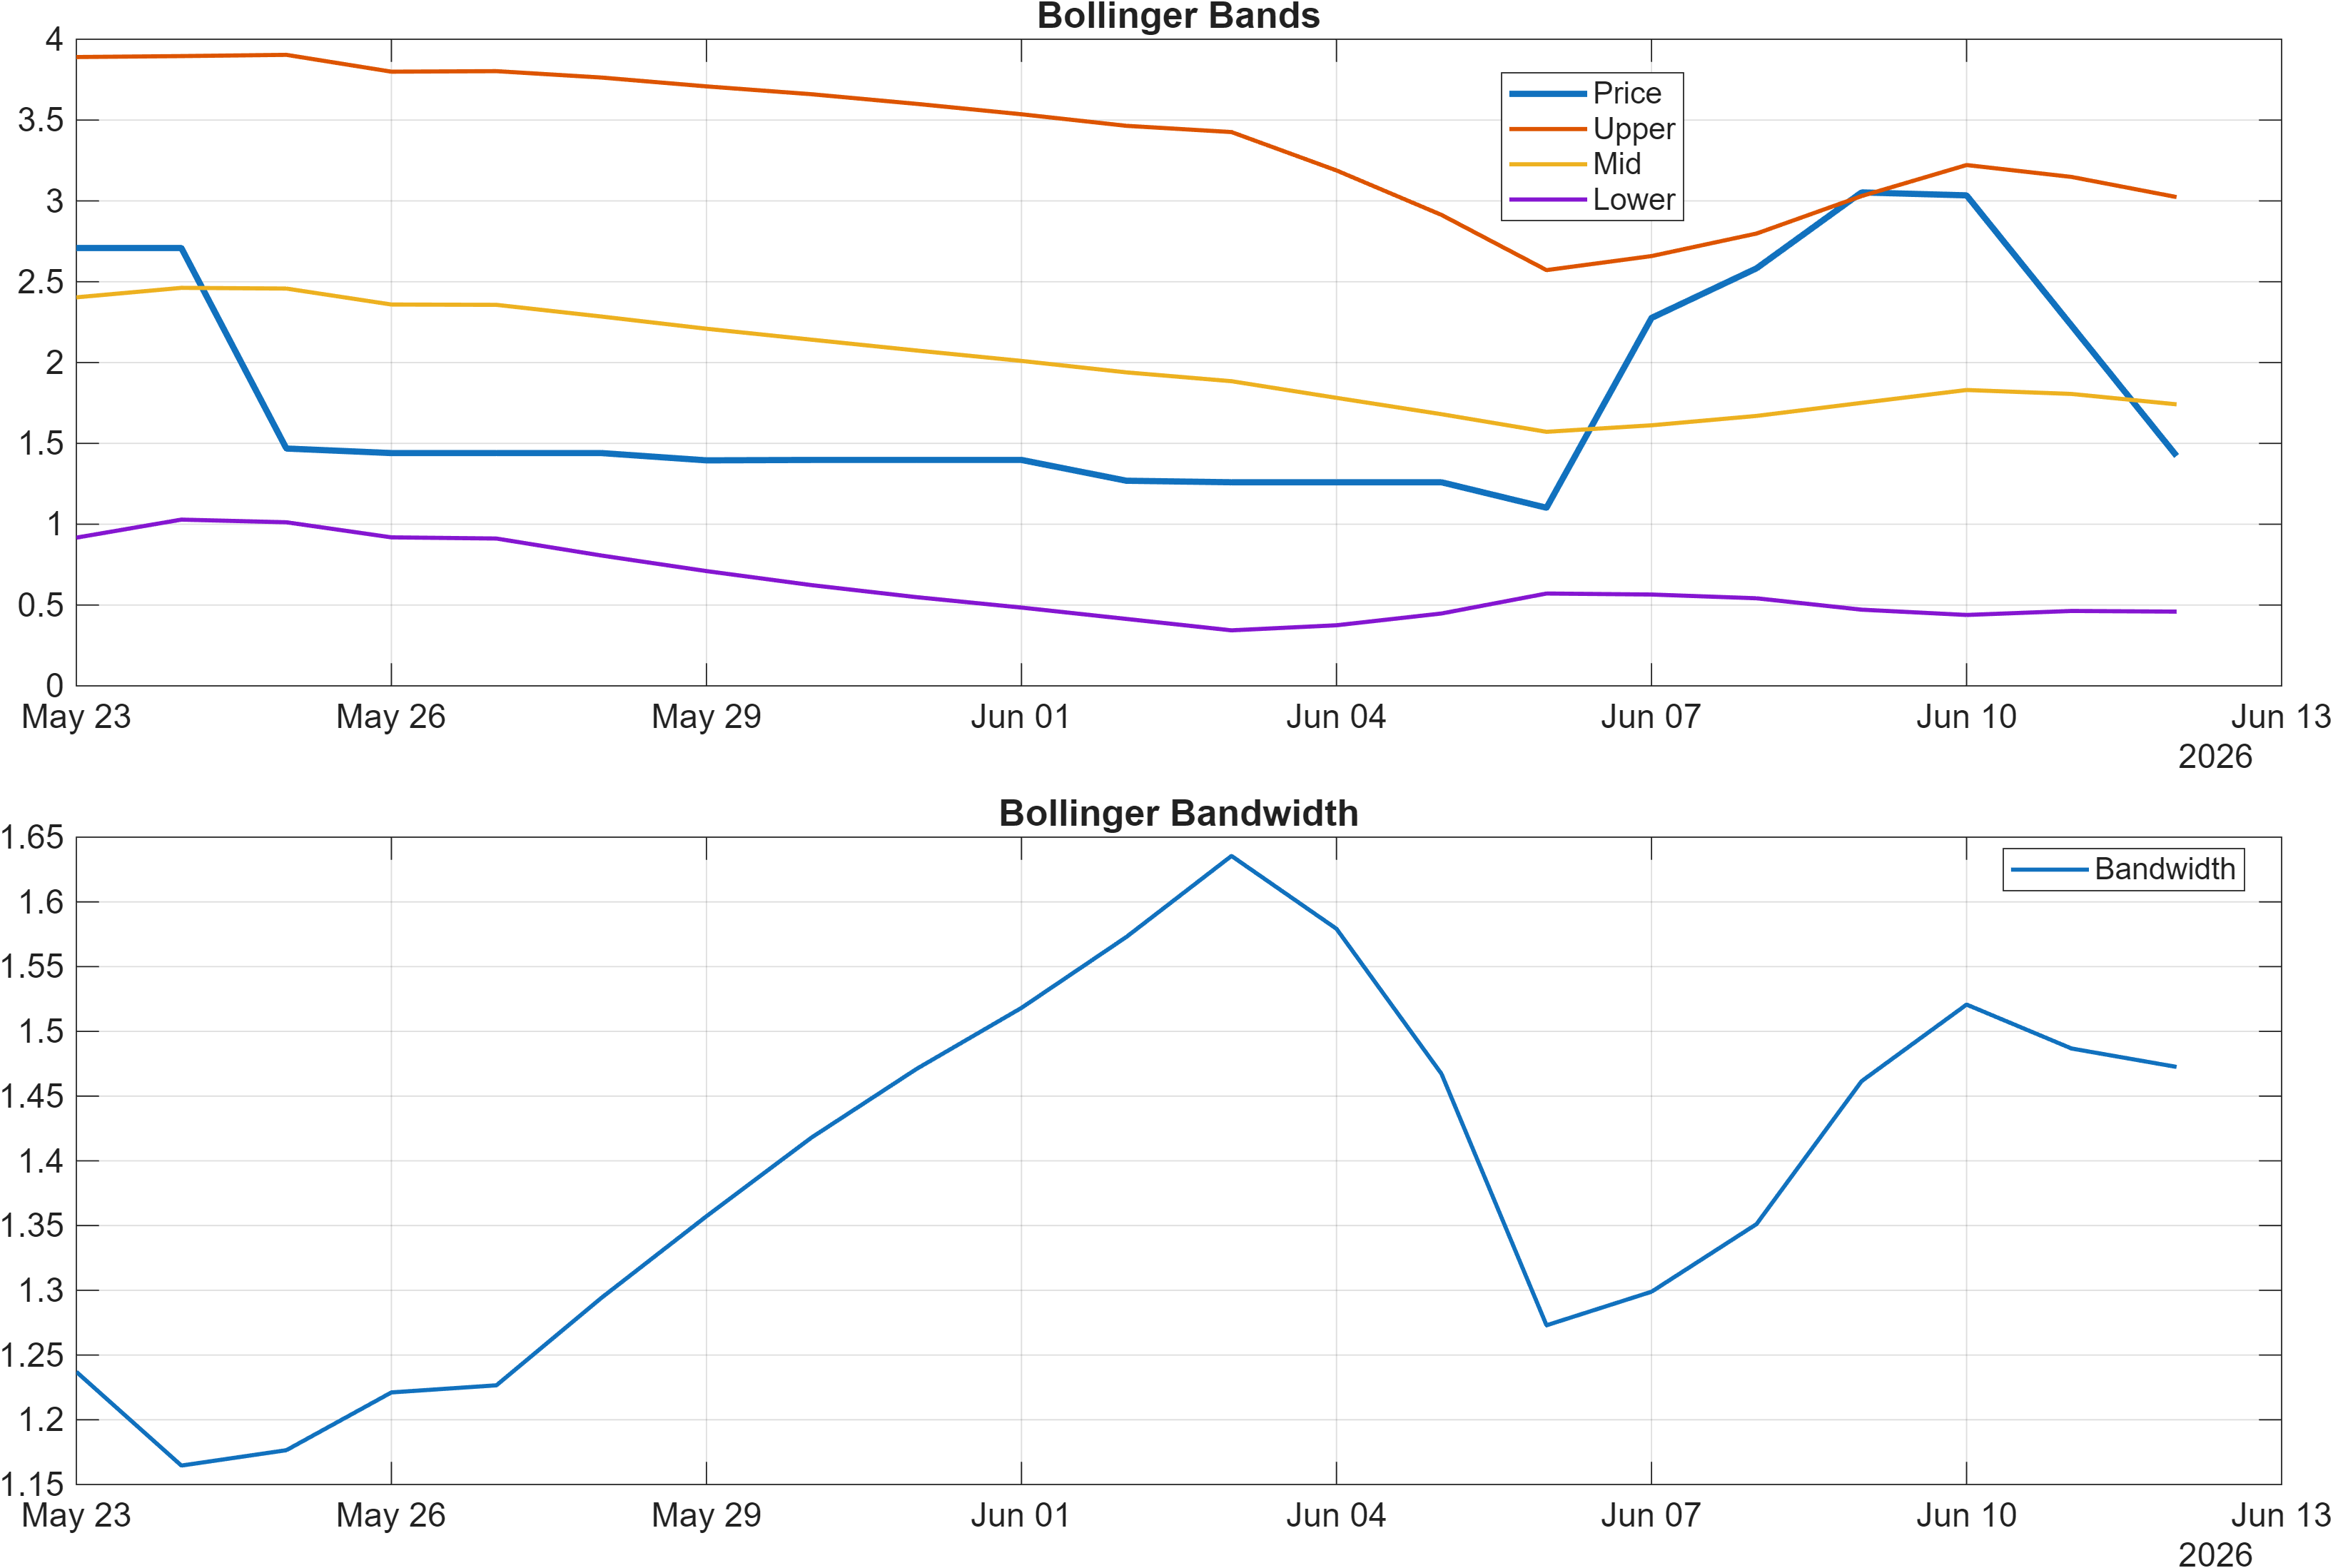
Volatility is an additional constraint on signal reliability. Bollinger bandwidth’s latest reading is 1.4725, which frames the current regime as one where moves can expand meaningfully, but do not necessarily trend cleanly. In higher-volatility environments, “correct” momentum signals can arrive earlier, but they also experience more frequent whipsaws. That makes level-based confirmation (resistance breaks and support holds) more informative than any single oscillator print.
Interpretation: RSI bias = Neutral, MACD hist = 0.2167.
Interpretation: Bandwidth (volatility regime) latest = 1.4725.
4) Support / Resistance zones
Support ~ 1.3004 | Resistance ~ 3.2817
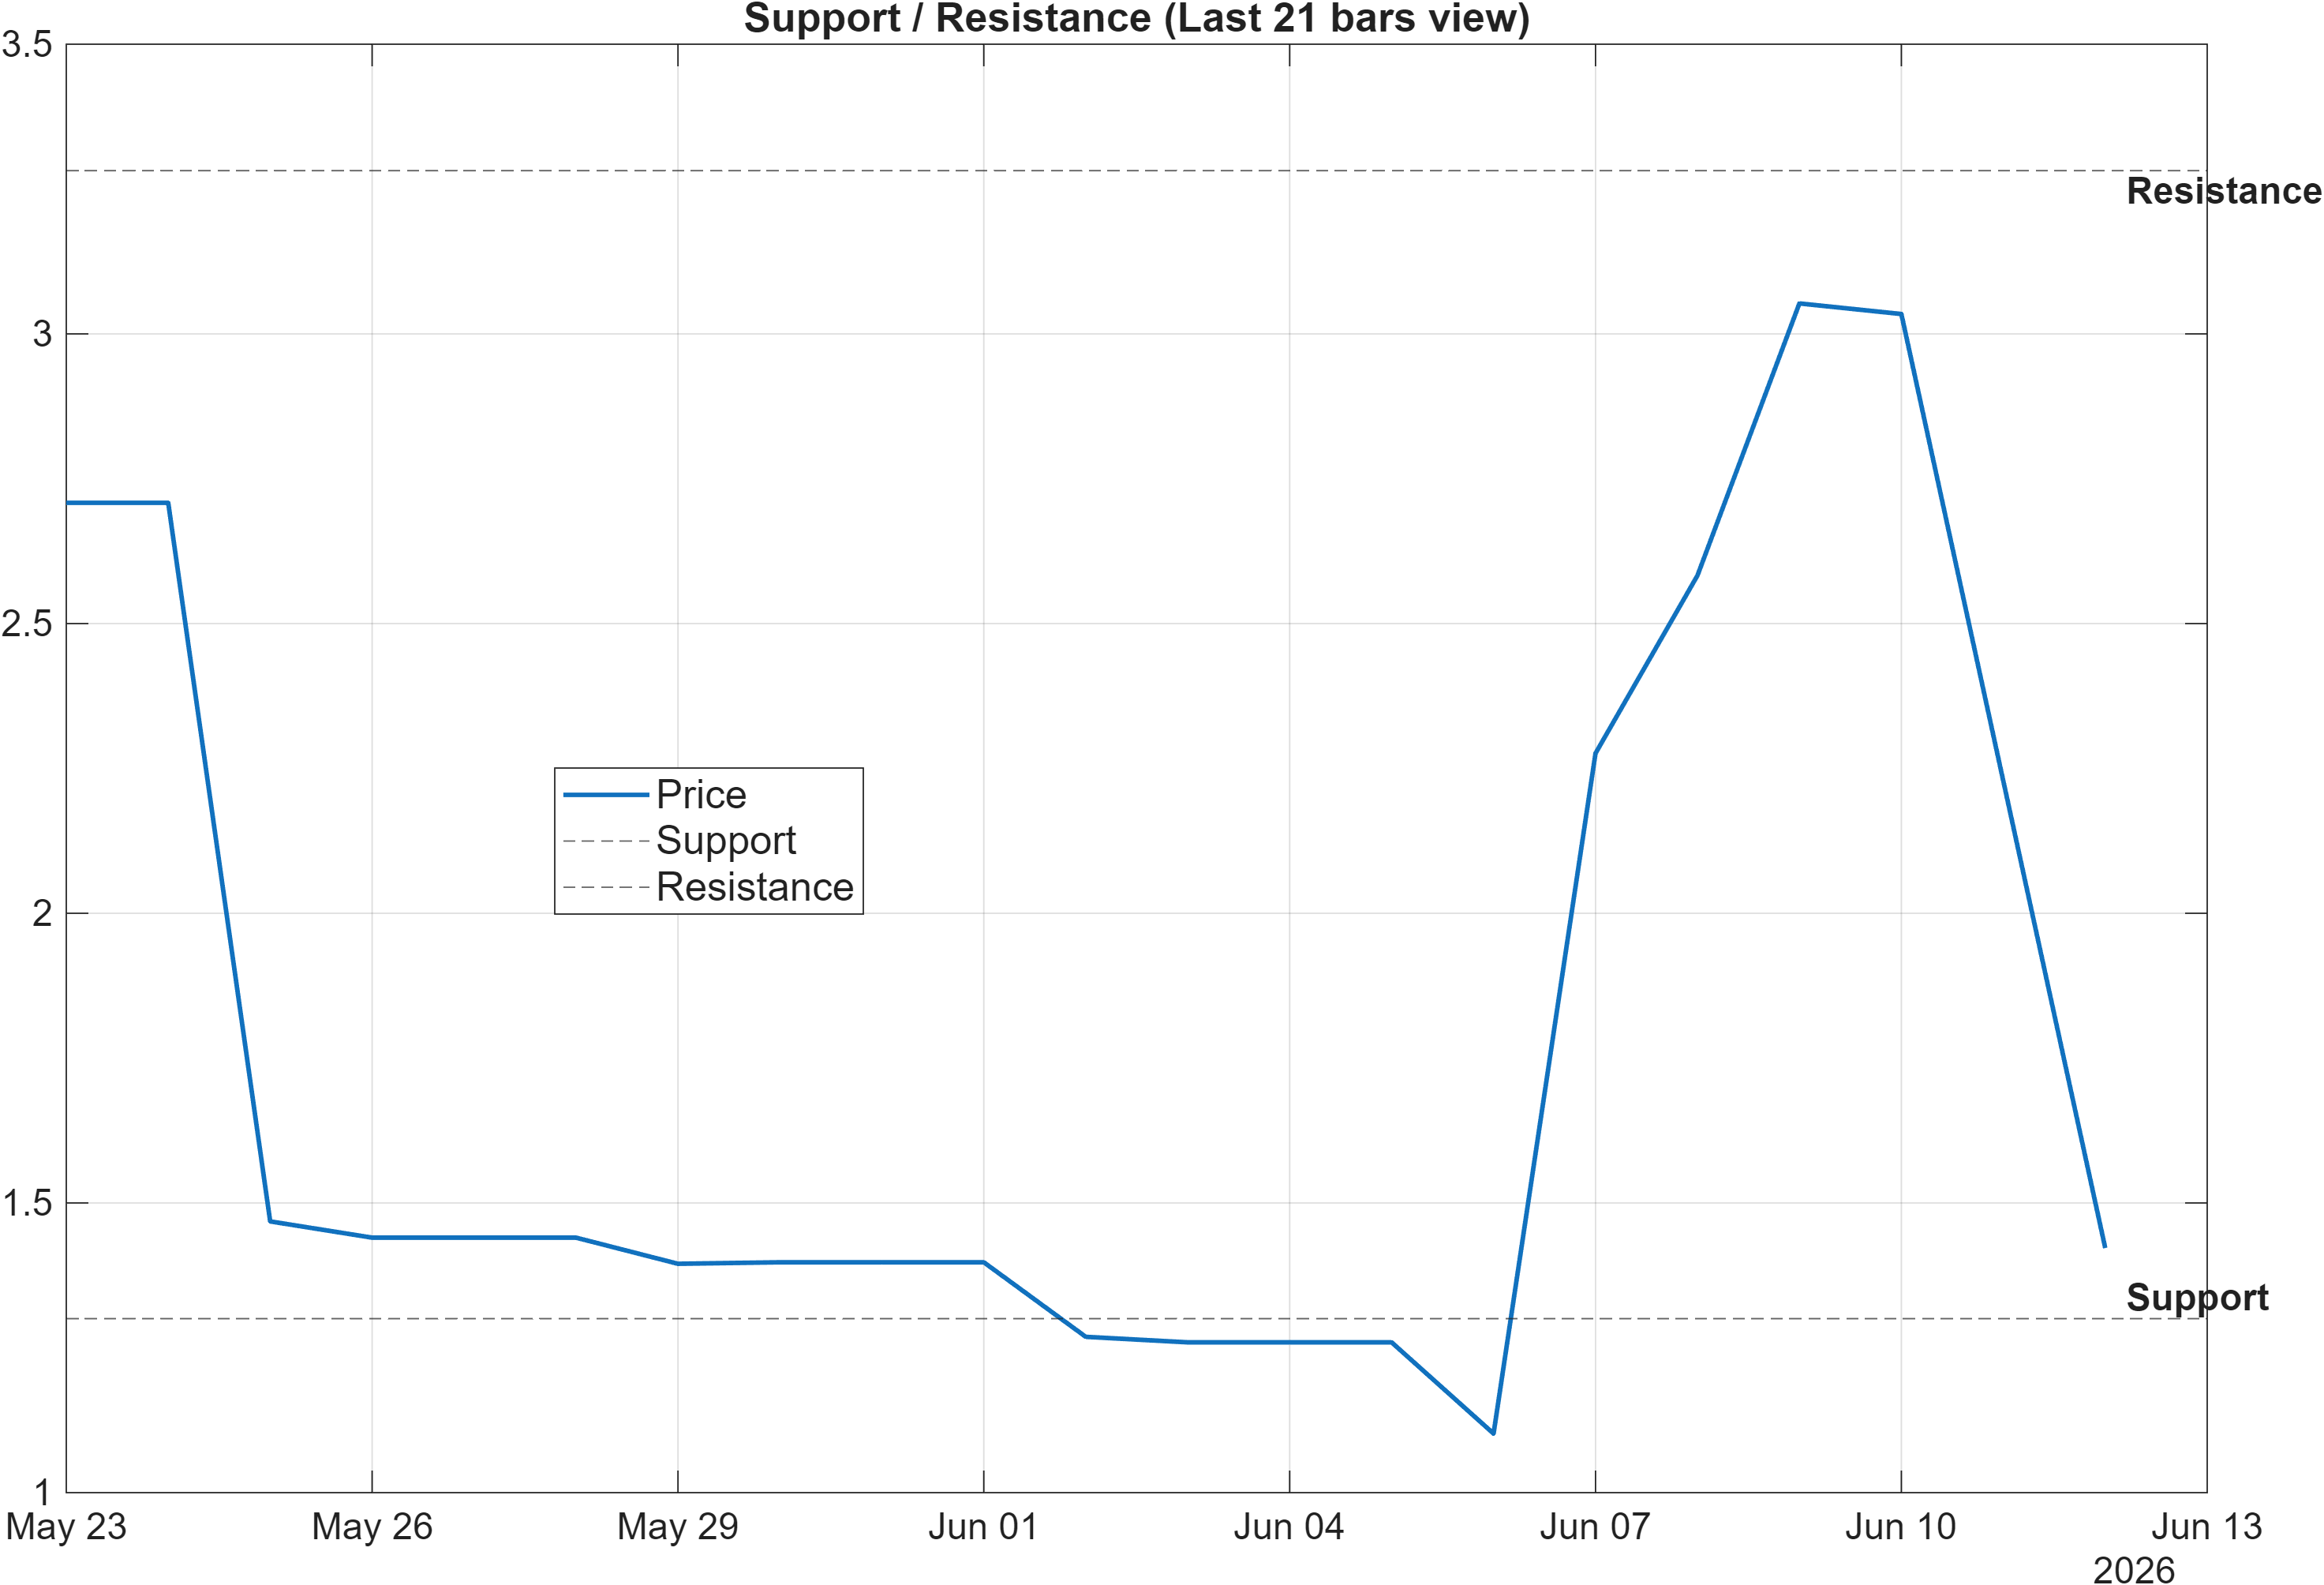
The level map creates a wide corridor between 1.3004 support and 3.2817 resistance, implying that the market has room to oscillate without resolving directionally. In this kind of structure, outcomes are often determined by whether price can convert resistance into acceptance (sustained trading above the level) rather than merely tagging it intraday.
The scenario framing provided—break above resistance with volume → continuation, close below support → deterioration risk—is especially important given the mixed signals elsewhere. Bearish moving averages suggest that rallies may be “tested” quickly by supply; bullish confluence suggests the market may have the internal momentum to attempt those tests. The trade-off is that failures from resistance can unwind quickly when volatility is non-trivial (bandwidth 1.4725).
For confirmation, a volume-backed move through 3.2817 would align multiple layers at once: it would validate bullish momentum (MACD hist 0.2167), reduce the probability that the daily rank surge is fleeting, and potentially begin to challenge the bearish moving-average context. Conversely, a close below 1.3004 would undermine the bullish elements of the confluence stack and increase the likelihood that the neutral multi-horizon ranks are accurately describing a market still stuck in a broader repair phase.
Scenario view: Break above resistance with volume → continuation. Close below support → signal deterioration risk.
5) Quant Technical Dashboard (18 Signals)
KGNAI AI Technical Analysis Score (Deep Reinforcement Learning): Rank #216 out of 800 (Rank 1 represents the strongest technical positioning and a higher probability of favorable price behavior. As ranks increase toward the maximum, the probability of favorable outcomes weakens and bearish positioning becomes more dominant.) | Label: Neutral | Score: 0.460
18-Signal Technical Confluence Score: 0.333 (Bullish)
Overall Technical Score (18-signal confluence + DRL rank blend): 0.371 (Bullish)
Note: The blended score reflects signal strength weighted against broader AI technical ranking, which may temporarily diverge.
Blended technical score breakdown: 0.371 (Bullish | Bull 10 / Bear 4 / Neutral 4)
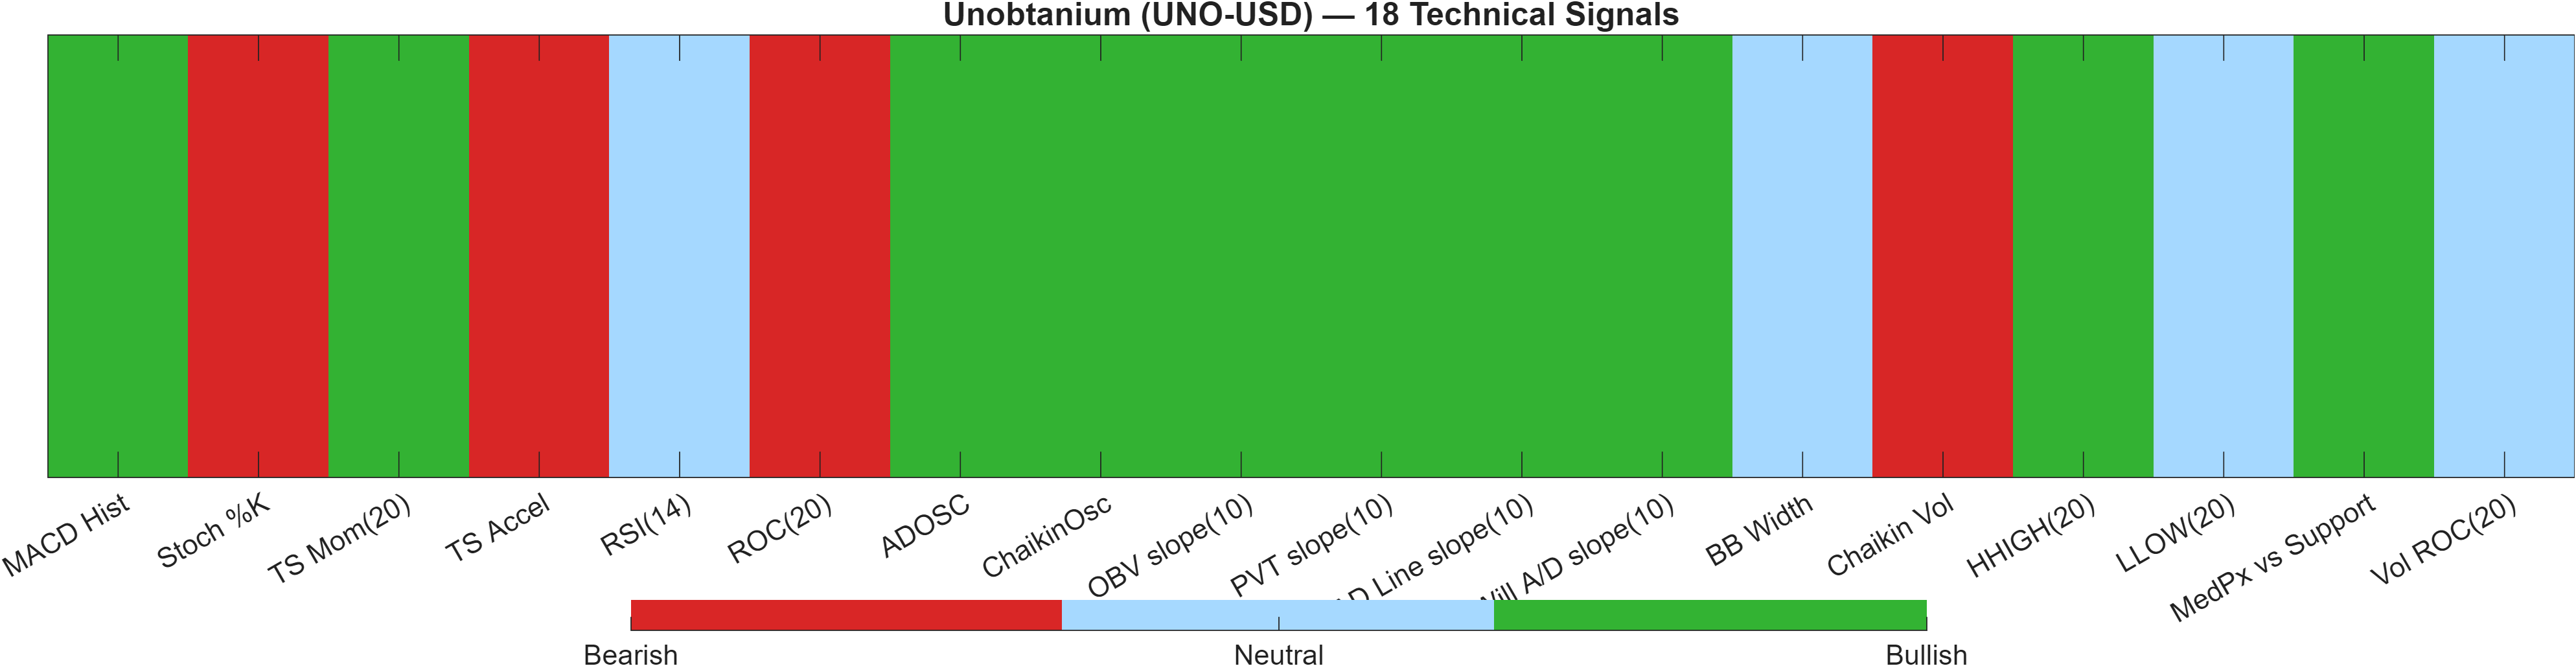
The technical dashboard is defined by a bullish breadth read that is not fully confirmed by the separate AI technical ranking model. The 18-signal confluence is 0.333 (Bullish) and the blended overall technical score rises to 0.371 (Bullish), with the breakdown showing Bull 10 / Bear 4 / Neutral 4. However, the Deep Reinforcement Learning technical rank is #216 with a Neutral label and a score of 0.460—a reminder that, relative to the wider universe, the setup is not in the very strongest cohort.
The composition of signals suggests accumulation-like behavior alongside pockets of late-cycle momentum risk. For example, MACD hist 0.2167 is bullish and aligns with a positive impulse, while RSI(14) 50.35 remains neutral—often seen when momentum is improving but not yet dominant. At the same time, Stoch %K 96.61 is bearish, which can flag short-term overextension even inside a broader bounce attempt.
Divergences inside the signal set matter. A bearish ROC(20) of -47.49 and bearish TS Accel -0.8275 indicate that longer-lookback rate-of-change and acceleration are not yet consistent with a stable trend transition. Meanwhile, the BB Width ~1.473 is neutral, consistent with a regime where expansion is possible but directional follow-through is not guaranteed. In aggregate, the dashboard supports a cautious bullish bias that still depends on level confirmation—particularly behavior near 3.2817 and protection of 1.3004.
Signal table (Bull/Bear/Neutral)
| Indicator | Value | Signal |
|---|---|---|
| MACD Hist | 0.2167 | Bullish |
| Stoch %K | 96.61 | Bearish |
| TS Mom(20) | 0.3258 | Bullish |
| TS Accel | -0.8275 | Bearish |
| RSI(14) | 50.35 | Neutral |
| ROC(20) | -47.49 | Bearish |
| ADOSC | 39.67 | Bullish |
| ChaikinOsc | 92.09 | Bullish |
| OBV slope(10) | 278 | Bullish |
| PVT slope(10) | 109.7 | Bullish |
| AD Line slope(10) | 263.6 | Bullish |
| Will A/D slope(10) | 1.777 | Bullish |
| BB Width | 1.473 | Neutral |
| Chaikin Vol | 88.47 | Bearish |
| HHIGH(20) | 3.103 | Bullish |
| LLOW(20) | 1.091 | Neutral |
| MedPx vs Support | 1.758 | Bullish |
| Vol ROC(20) | — | Neutral |
Interpretation: Indicator-level signals form the base confluence, which is then adjusted using a separate AI-driven technical ranking model. The final technical score summarizes this combined view.
6) News sentiment + extractive gist
Note: Instrument-specific news matches were not found, so the digest includes broader market/sector headlines. Links are provided for verification.
Sentiment score (avg): 0.000 | Positive: 6% | Neutral: 88% | Negative: 6%
KGNAI AI News Sentiment Score (normalized -1 to +1): Not available (as of —) | Label: Not available | Overall news score: 0.00
Positive Developments
Recent coverage across major financial outlets indicates a constructive undertone around tokenization, stablecoin payment rails, and broader institutional experimentation with blockchain-linked infrastructure. That backdrop can indirectly support smaller crypto assets by improving the sector’s narrative around real-world implementation and on-ramps, even when an instrument like UNO-USD has no direct headlines in the provided data. In this report, the sentiment mix still prints as mostly Neutral (88%), but the existence of a measurable 6% positive share suggests the news tape is not overtly risk-off. For a technically mixed setup—bearish moving averages but a bullish blended technical score (0.371)—a steadier macro-crypto narrative can help determine whether momentum signals (e.g., MACD hist 0.2167) translate into sustained participation rather than a one-session spike.
Neutral / Mixed Developments
The dominant feature of the digest is informational, market-wide content rather than instrument-specific drivers. That aligns with the report’s own limitation: “Instrument-specific news matches were not found,” and the KGNAI AI News Sentiment Score is Not available. In these conditions, the practical use of sentiment is as context rather than a signal. With an average sentiment score of 0.000, the news layer does not meaningfully tilt the analysis away from the primary decision framework, which remains technical and level-based: support ~1.3004 and resistance ~3.2817. The neutrality also fits the rank profile—extreme strength in the daily rank but neutral across weekly and beyond—where regime confirmation typically comes from price behavior, not headlines.
Negative / Risk Signals
Recent coverage across major financial outlets also reflects pockets of risk sensitivity tied to broader crypto conditions, including volatility around major assets and changing flows, which can spill over into lower-liquidity instruments. Even with the digest reading as mostly neutral, the presence of 6% negative sentiment highlights that downside narratives remain active. For UNO-USD, the risk channel is straightforward: a bearish moving-average configuration can amplify the impact of adverse tape when momentum is not firmly established (RSI remains neutral at 50.35). In that context, the most actionable risk control is structural rather than narrative: a close below 1.3004 would represent deterioration risk per the scenario framework, potentially overpowering the bullish confluence components. Conversely, risk headlines have less analytical weight if price can validate strength through 3.2817 on volume.
- Whether price can break and hold above 3.2817 with visible participation (volume confirmation).
- Whether pullbacks remain contained above 1.3004, preserving the defined risk boundary.
- Whether momentum stays constructive (e.g., MACD hist 0.2167) while RSI remains stable near neutral rather than rolling over.
Sources referenced: Reuters, Bloomberg, Yahoo Finance, MarketWatch, Investing.com
7) Sources
Specific source URLs are not reproduced here. The News section is a compressed, aggregated digest derived from the provided dataset and summarized according to KGNAI editorial rules.
You may also like: How KGNAI AI ranks instruments across global markets
Disclaimer: KGNAI provides AI-generated analytics and educational market commentary only. This is not financial advice. Markets involve risk. Always do your own research.