MA (Mastercard Inc) Technical & Rank Outlook — 21-Jun-2026 | Bullish Ranks With Mixed Trend Structure
Mastercard Inc (MA) screens as broadly constructive on KGNAI’s cross-sectional rankings, with bullish positioning across multiple horizons inside a 2042-instrument universe. The rank profile is strongest in the intermediate windows (notably the 3-Monthly and 6-Monthly views), while the chart-based trend layer is less synchronized: the moving-average read shows Close vs MA50 = Bearish and MA50 vs MA200 = Bearish. Momentum and participation metrics lean more supportive than price/MA structure, with a neutral RSI bias and a positive MACD histogram at 0.3672. Volatility conditions appear comparatively contained, with Bollinger bandwidth at 0.0504, which can amplify the relevance of nearby decision levels. Key zones are defined at support ~483.8500 and resistance ~509.0250, framing confirmation and invalidation points for the current regime.
Key Takeaways
- Rank stance: Short / Mid / Long = Bullish (Daily #57, Weekly #39, Yearly #71 out of 2042; intermediate ranks include 3-Monthly #21 and 6-Monthly #32).
- Technical confluence label: Bullish (18-signal confluence 0.611; overall technical score 0.339) while DRL technical rank remains Neutral (#1322).
- Key levels: Support 483.8500 | Resistance 509.0250.
- News sentiment bias: Bullish (avg sentiment 0.192; KGNAI news score 0.99; overall news score 0.95; negatives 0%).
- Confirmation / invalidation: A break above 509.0250 with volume supports continuation; a close below 483.8500 increases deterioration risk.
What KGNAI Measures
KGNAI evaluates assets using large cross-sectional datasets built from millions of structured data points. Inputs incorporate fundamental metrics, technical structures, and systematically processed news sentiment. Statistical models, machine learning, and AI frameworks are used to assess relative positioning, signal alignment, and probabilistic behavior across broad universes.
How to Read This Report
- Ranks are comparative across the tracked universe, not absolute price targets.
- Confluence reflects alignment among independent signal groups.
- Support/resistance levels are probabilistic decision zones, not guarantees.
- Sentiment provides contextual bias within the broader analytical framework.
1) KGNAI AI Analysis
Region: USA
Total universe size: 2042 ranked instruments
- Daily rank: #57 out of 2042 — Bullish
- Weekly rank: #39 out of 2042 — Bullish
- Monthly rank: #119 out of 2042 — Bullish
- 3-Monthly rank: #21 out of 2042 — Bullish
- 6-Monthly rank: #32 out of 2042 — Bullish
- Yearly rank: #71 out of 2042 — Bullish
The rank stack places MA consistently in the upper tier of the tracked universe across all horizons shown, with the strongest concentration in the intermediate windows (3-Monthly #21 and 6-Monthly #32). That shape often aligns with a market that is rewarding sustained, multi-week behavior more than very short-lived price effects. The Daily (#57) and Weekly (#39) ranks reinforce that the nearer-term profile is still supportive rather than transitional.
A key nuance is that these ranks are cross-sectional rather than chart-only: they reflect relative behavior versus 2042 instruments, not a single-instrument trend label. In MA’s case, the consistently Bullish term view (Short-term, Mid-term, Long-term) implies that model outputs are not flagging a regime break across horizons—yet later sections show that some price-structure signals (moving averages) are not perfectly aligned with that ranking strength.
From an analytical discipline standpoint, the most actionable read is the stability of the rank regime: Monthly (#119) remains bullish even as it is weaker than Weekly and 3-Monthly, suggesting the longer swing window has not fully caught up to the intermediate strength. When rank leadership is led by 3–6 month windows, confirmation tends to come from follow-through in trend structure (see the MA50/MA200 relationship) and behavior around the defined support/resistance envelope (483.8500 / 509.0250).
2) Price & trend overview
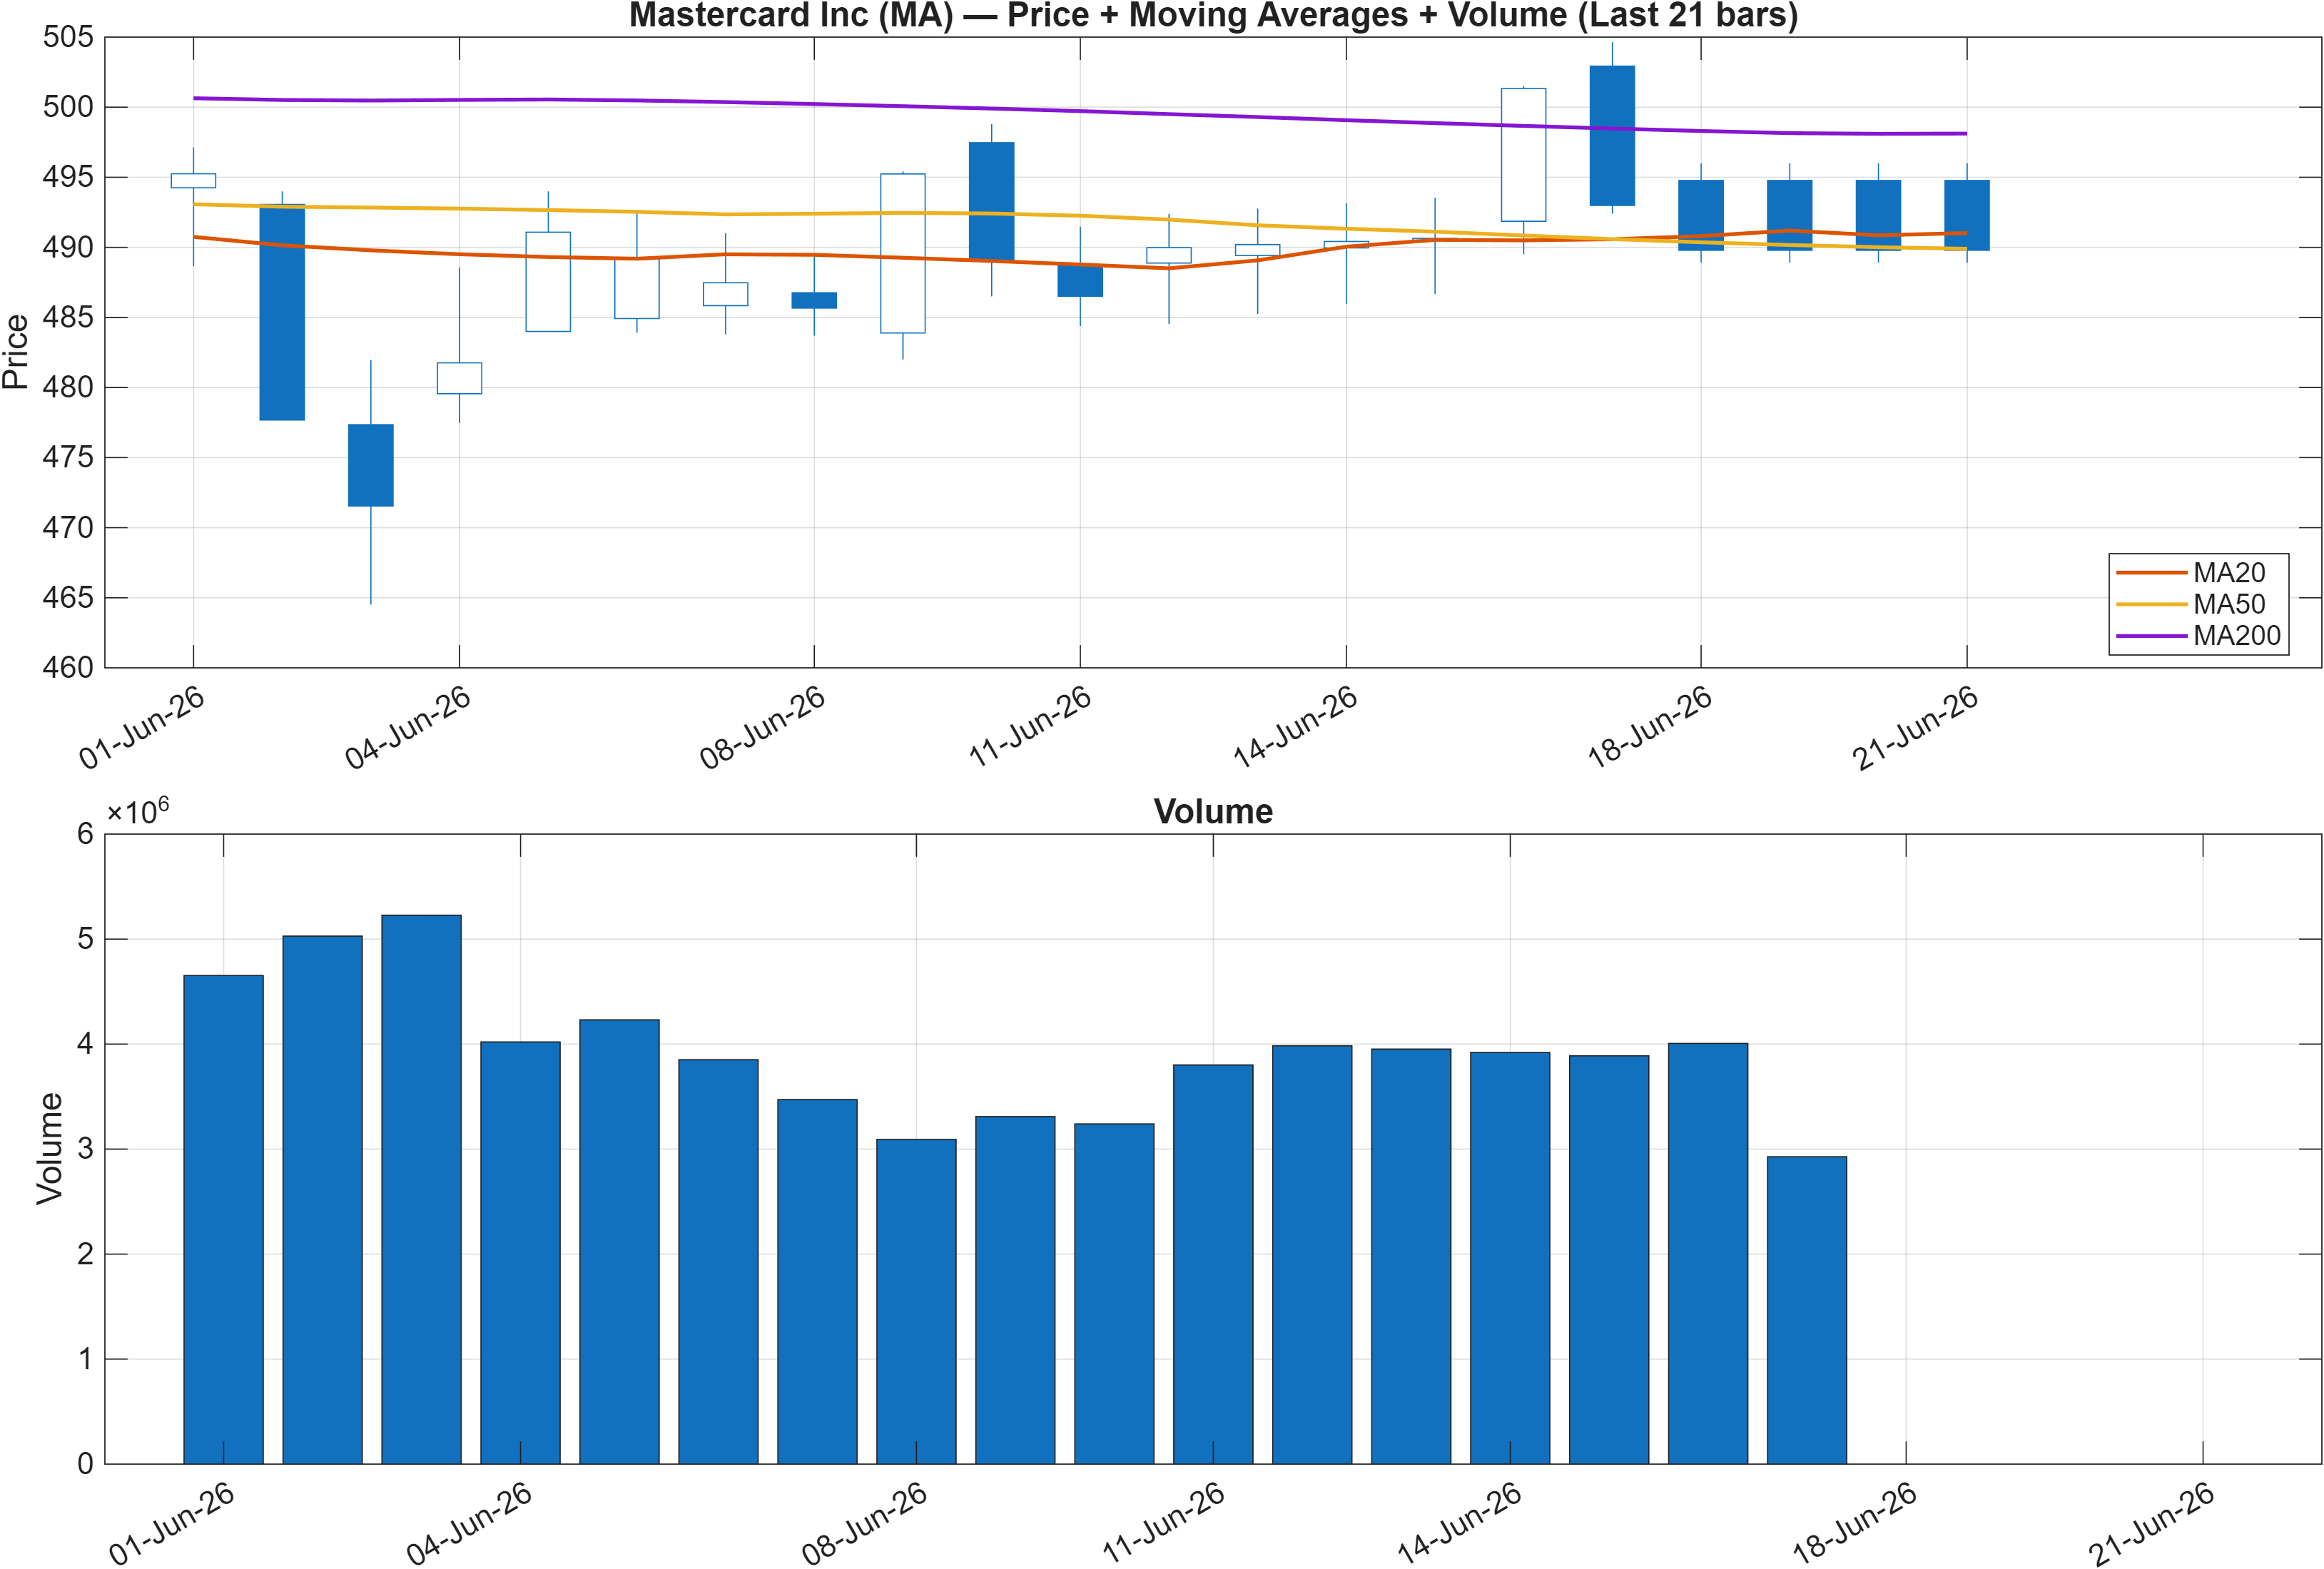
Interpretation: Close vs MA50 = Bearish, MA50 vs MA200 = Bearish.
The trend layer is currently defined by a dual bearish moving-average configuration: price below the MA50 and the MA50 below the MA200. In isolation, that combination typically signals a market still working through a prior downshift rather than a fully re-established uptrend. The analytical question is whether this is a lagging trend read (common after a stabilization phase) or an accurate reflection of ongoing weakness.
The broader KGNAI rank profile—Daily #57 and Weekly #39—argues that relative behavior has improved compared with much of the 2042-instrument universe. That creates a potential alignment gap: cross-sectional strength versus slower-moving trend filters. These gaps are not inherently bullish or bearish; they are better treated as a regime under negotiation, where confirmation should come from price reclaiming key references (MA50 and resistance at 509.0250) and holding above structural support (483.8500).
Volume context matters here because the scenario framework explicitly conditions continuation on a break above resistance with volume. When moving averages remain bearish, upside attempts that occur on muted participation often fail to change the regime. Conversely, if price action begins to hold above the MA50 while the intermediate ranks stay strong (3-Monthly #21; 6-Monthly #32), the bearish MA50/MA200 relationship can become a trailing artifact rather than a forward constraint.
Net: MA’s trend read is cautious, but it is not contradictory to a constructive medium-term rank stance; it simply elevates the importance of level-based validation around 483.8500 and 509.0250.
3) Momentum & volatility dashboard
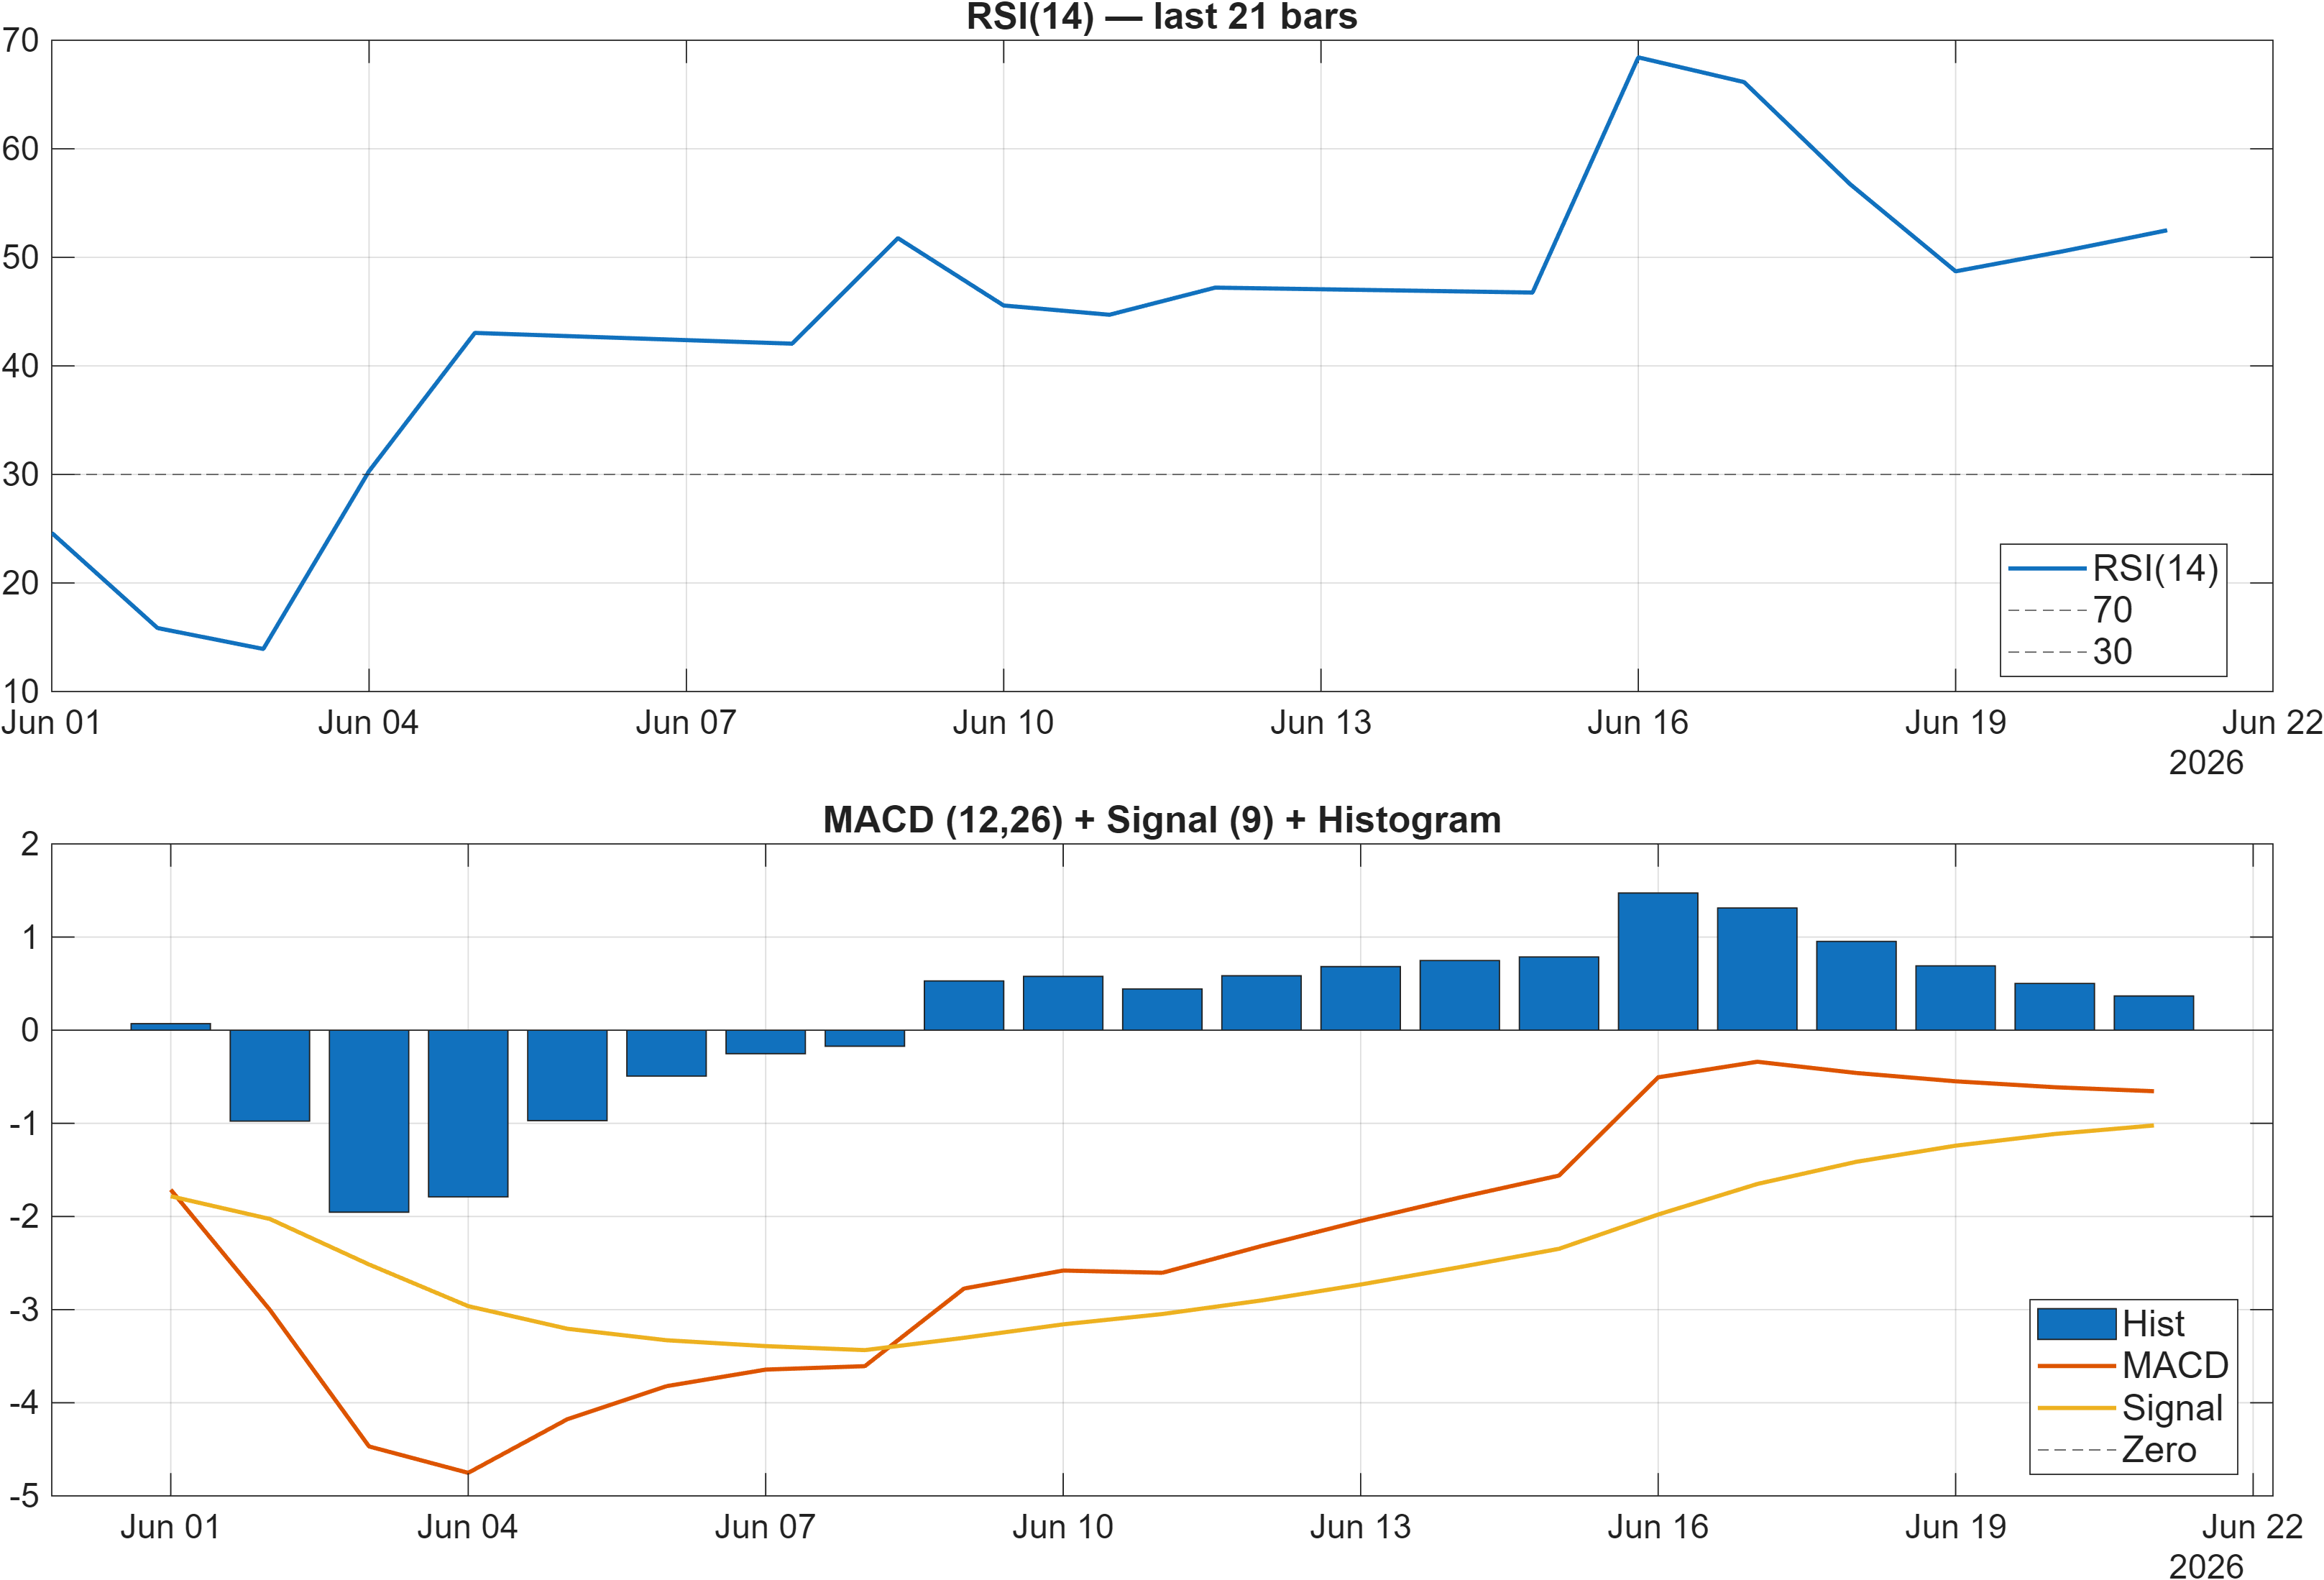
Interpretation: RSI bias = Neutral, MACD hist = 0.3672.
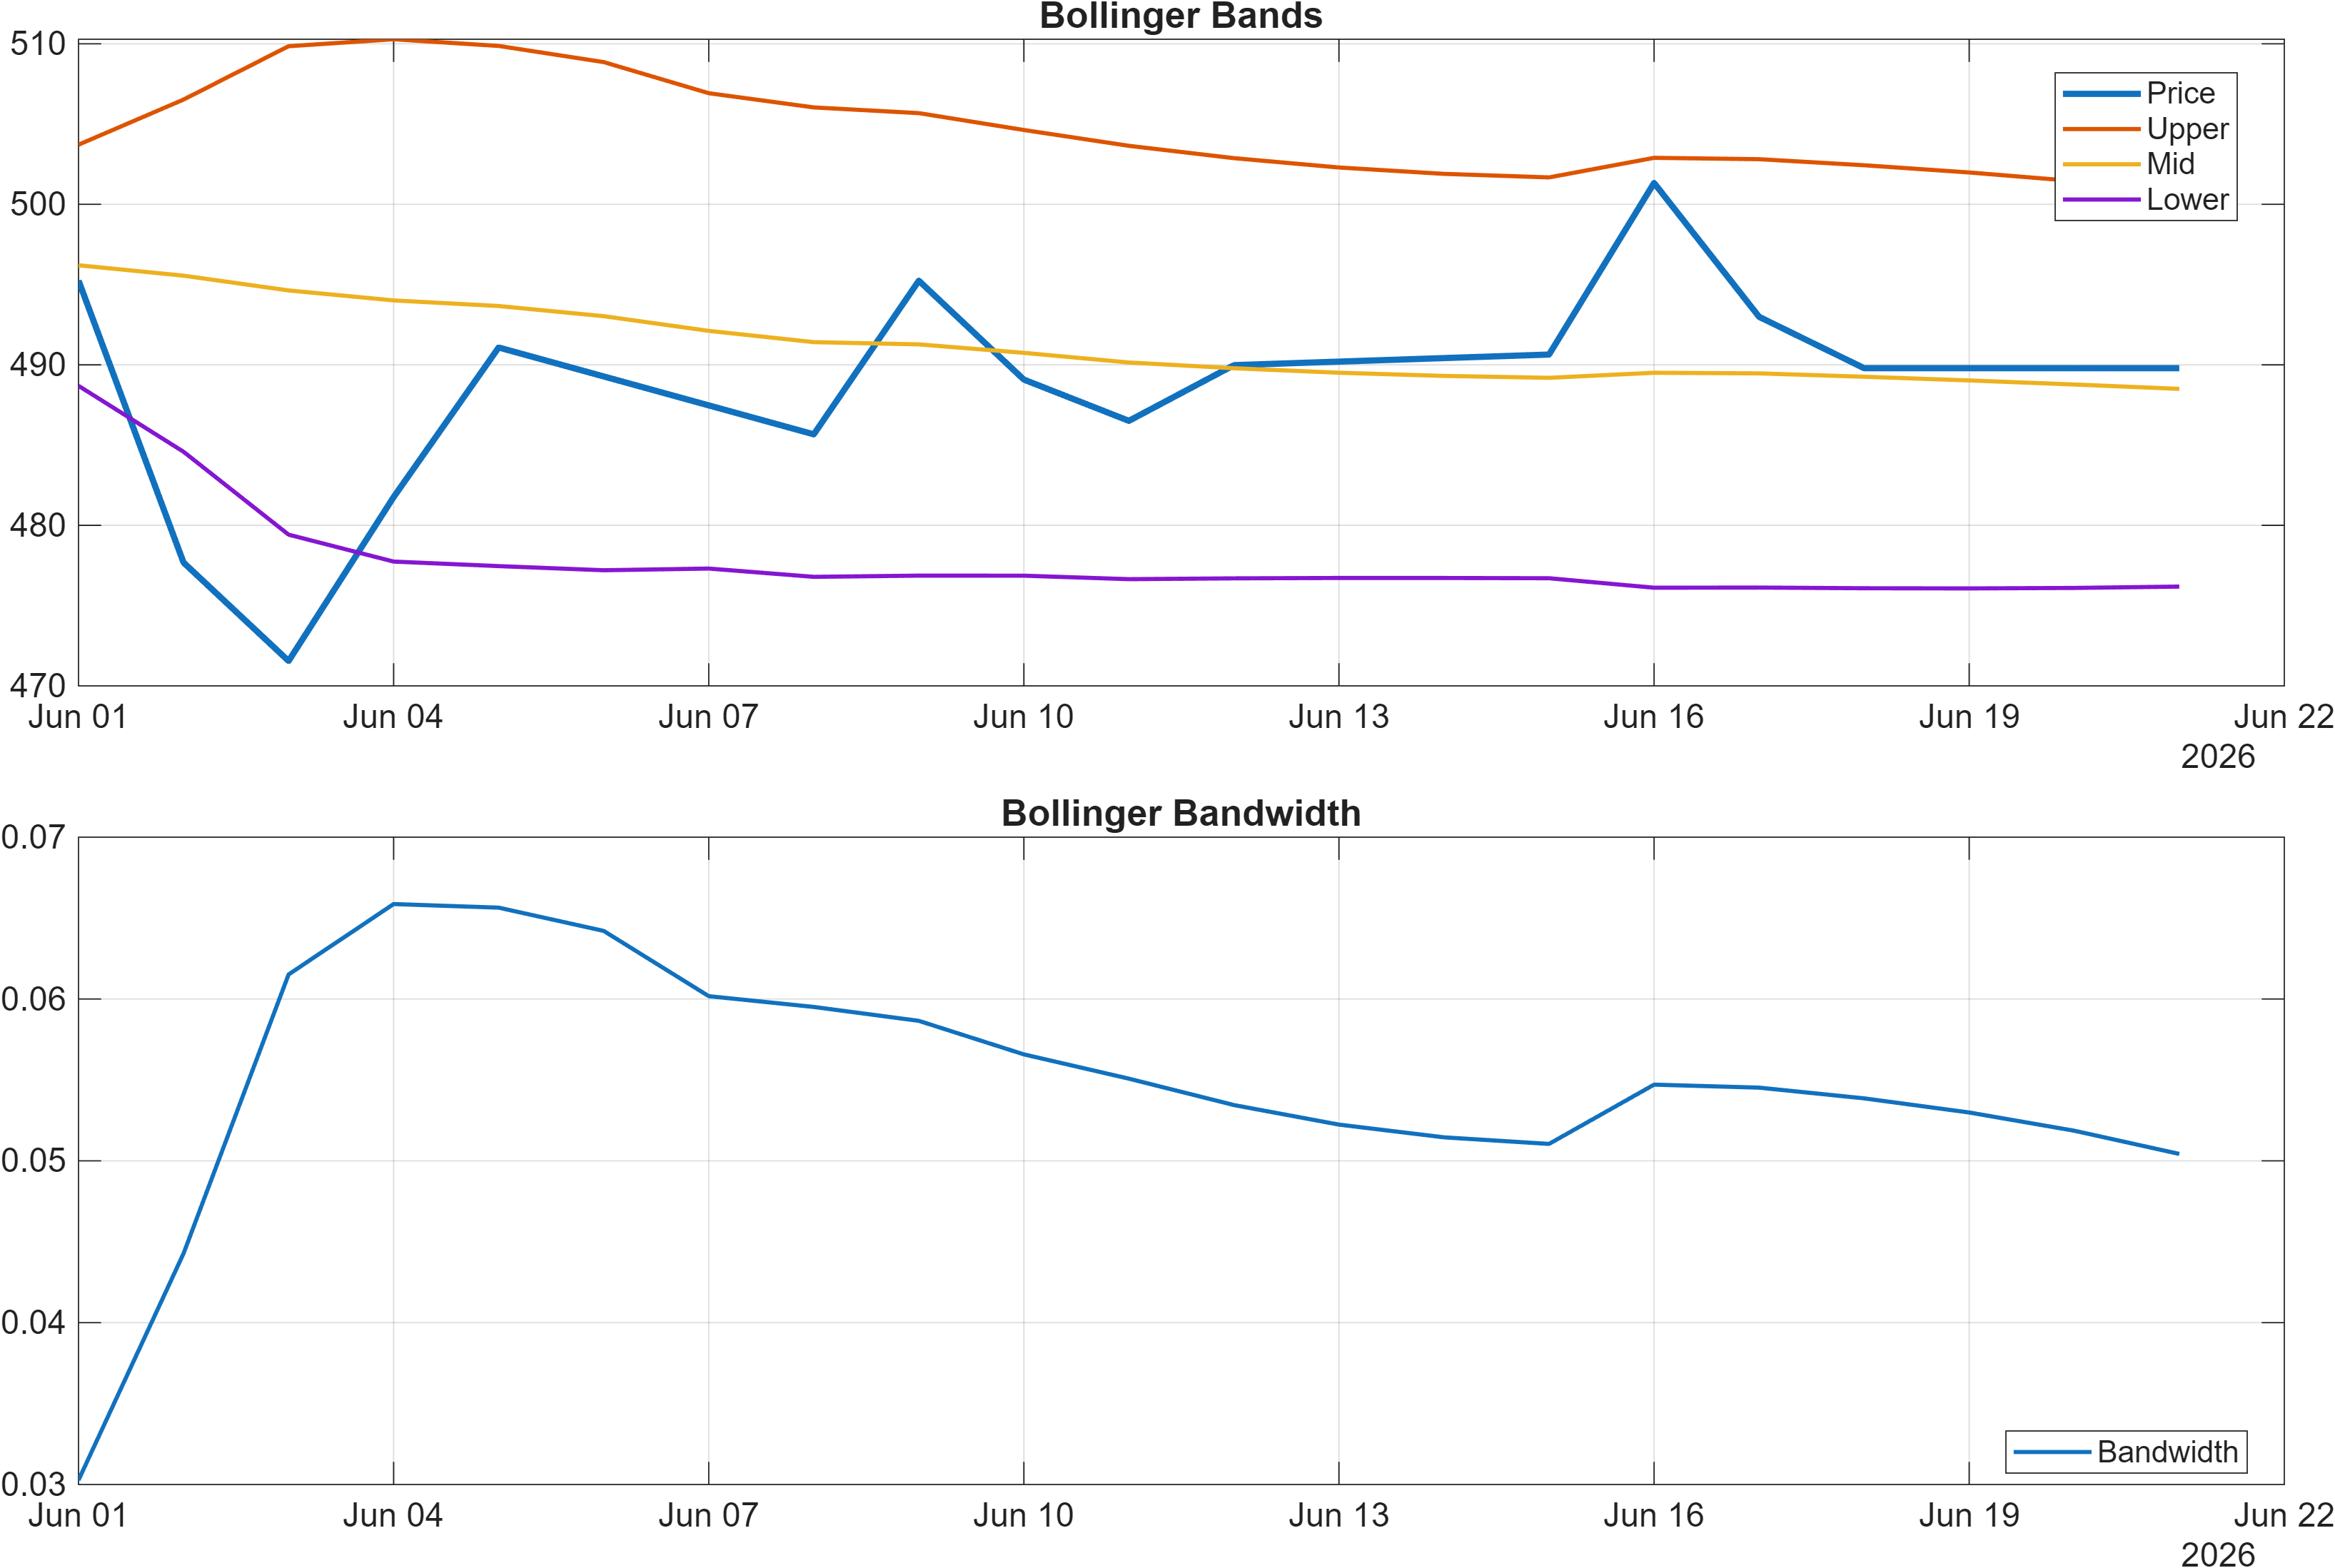
Interpretation: Bandwidth (volatility regime) latest = 0.0504.
Momentum signals are more balanced than the moving-average trend read, which is often where regime transitions first appear. RSI(14) sits at 52.49 with a neutral bias, implying neither overbought pressure nor capitulation dynamics are dominating. In that context, the positive MACD histogram at 0.3672 is notable: it points to improving momentum on a smoothed basis even if longer trend filters remain bearish.
Volatility conditions add another layer. Bollinger bandwidth at 0.0504 indicates a relatively contained range environment versus higher-vol regimes, which can be interpreted as compression rather than expansion. Compression tends to shift analytical focus toward level interaction: small moves around resistance (509.0250) or support (483.8500) can carry outsized informational value when volatility is subdued.
The internal dashboard reinforces this “constructive but not exuberant” profile. For example, while RSI remains neutral, other momentum and rate-of-change signals in the technical stack are supportive (e.g., ROC(20) at 2.535 is bullish), suggesting incremental improvement rather than late-cycle extension. This blend is consistent with an asset that may be attempting to rebuild trend integrity after a weaker phase signaled by MA relationships.
The practical risk is that neutral RSI paired with low bandwidth can also precede false breakouts if participation does not confirm. That is why the report’s volume-conditioned breakout framework and the later volume signal (Vol ROC(20) = -100) should be treated as central when assessing whether momentum improvement is durable.
4) Support / Resistance zones
Support ~ 483.8500 | Resistance ~ 509.0250
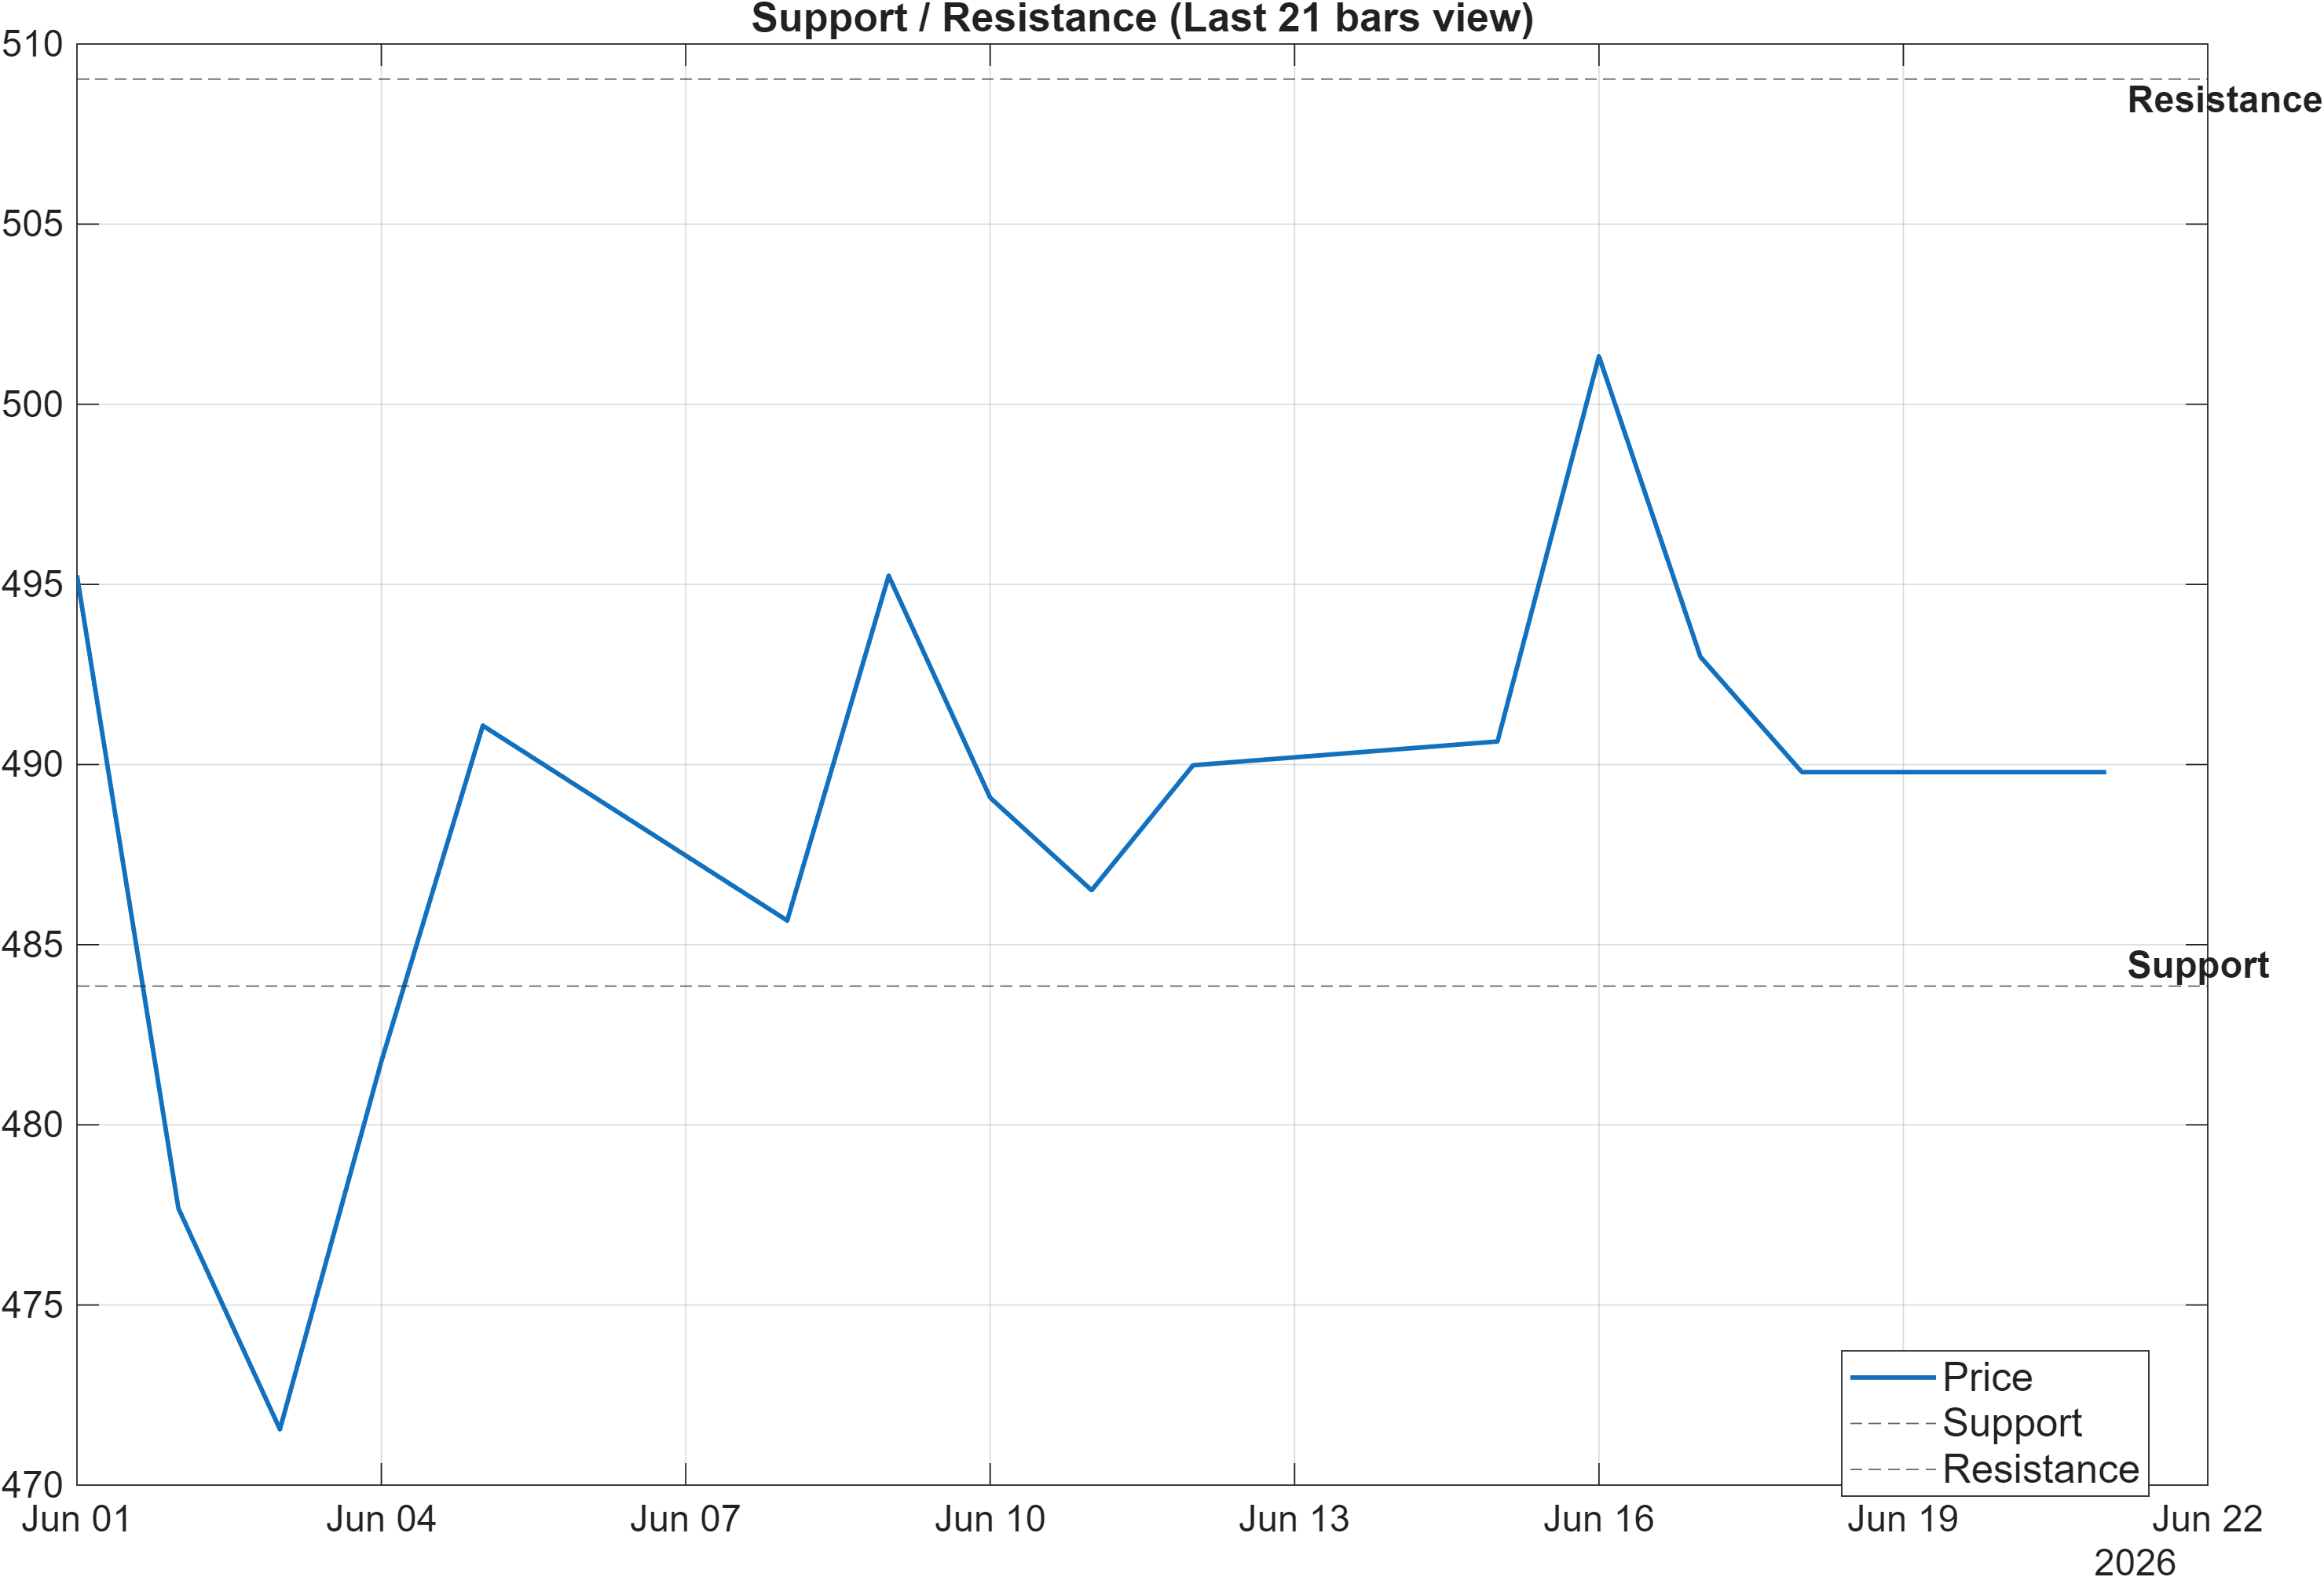
Scenario view: Break above resistance with volume → continuation. Close below support → signal deterioration risk.
With volatility relatively tight (bandwidth 0.0504) and trend filters still bearish (Close vs MA50 and MA50 vs MA200 both bearish), the support/resistance band becomes the primary decision map. The spread between 483.8500 and 509.0250 frames a range where confirmation is less about indicator readings and more about how price behaves at boundaries.
The bullish rank regime (Weekly #39; 3-Monthly #21) suggests that MA’s relative performance characteristics are resilient enough that a resistance test is analytically plausible without requiring overbought momentum. In that setting, the report’s conditional language is important: a break above 509.0250 with volume is treated as continuation evidence, not merely an intraday probe. Without volume confirmation, a breakout attempt can become a liquidity event rather than a regime shift.
On the downside, a close below 483.8500 is explicitly defined as deterioration risk. This is a higher-quality risk marker than a single indicator flip because it anchors to a structural price zone. It also aligns with the idea that divergence between bullish confluence (overall technical score 0.339) and bearish moving averages needs a clear invalidation point; support provides that reference.
The asymmetric takeaway: resistance is a confirmation level (especially given the volume condition), while support is a regime integrity level. As long as price remains above 483.8500, the bullish ranks retain a stronger claim than the bearish MA configuration; below it, the moving-average caution gains analytical weight.
5) Quant Technical Dashboard (18 Signals)
KGNAI AI Technical Analysis Score (Deep Reinforcement Learning): Rank #1322 out of 2042 (Rank 1 represents the strongest technical positioning and a higher probability of favorable price behavior. As ranks increase toward the maximum, the probability of favorable outcomes weakens and bearish positioning becomes more dominant.) | Label: Neutral | Score: -0.295
18-Signal Technical Confluence Score: 0.611 (Bullish)
Overall Technical Score (18-signal confluence + DRL rank blend): 0.339 (Bullish)
Note: The blended score reflects signal strength weighted against broader AI technical ranking, which may temporarily diverge.
Blended technical score breakdown: 0.339 (Bullish | Bull 12 / Bear 1 / Neutral 5)
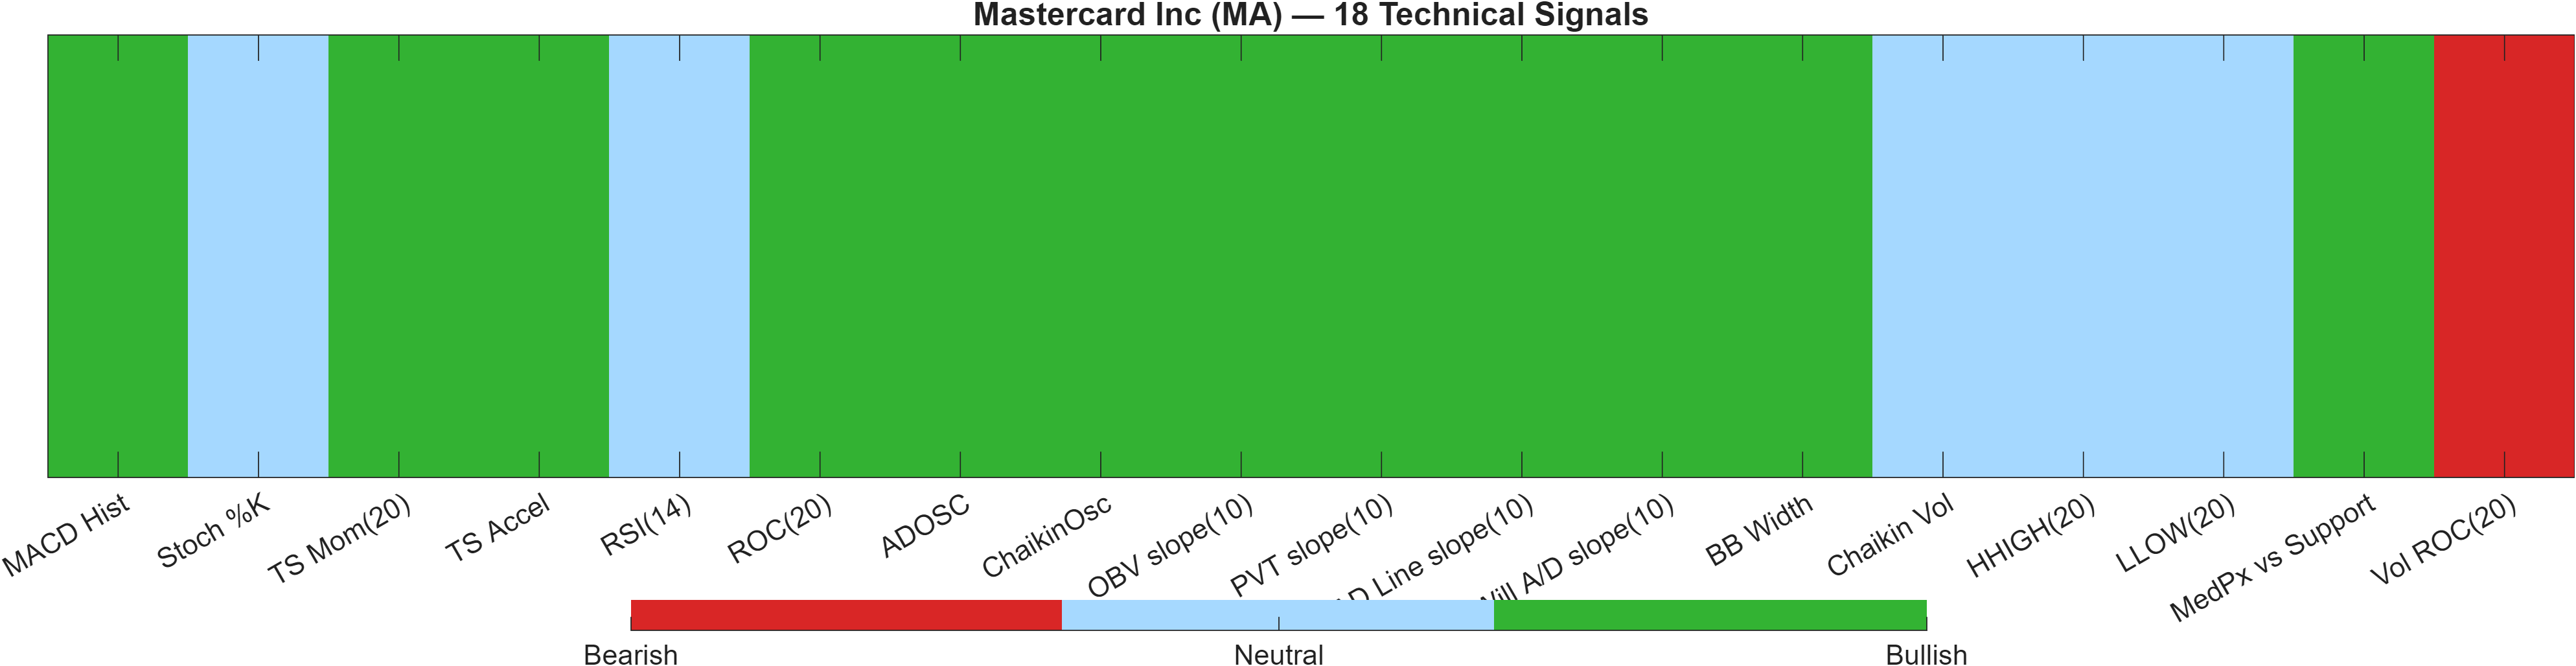
Signal table (Bull/Bear/Neutral)
| Indicator | Value | Signal |
|---|---|---|
| MACD Hist | 0.3672 | Bullish |
| Stoch %K | 26.13 | Neutral |
| TS Mom(20) | 12.11 | Bullish |
| TS Accel | 24.37 | Bullish |
| RSI(14) | 52.49 | Neutral |
| ROC(20) | 2.535 | Bullish |
| ADOSC | 14.83 | Bullish |
| ChaikinOsc | 7.726e+05 | Bullish |
| OBV slope(10) | 1.682e+07 | Bullish |
| PVT slope(10) | 7.228e+04 | Bullish |
| AD Line slope(10) | 5.608e+06 | Bullish |
| Will A/D slope(10) | 12.81 | Bullish |
| BB Width | 0.05043 | Bullish |
| Chaikin Vol | -12.32 | Neutral |
| HHIGH(20) | 504.6 | Neutral |
| LLOW(20) | 464.5 | Neutral |
| MedPx vs Support | 8.6 | Bullish |
| Vol ROC(20) | -100 | Bearish |
Interpretation: Indicator-level signals form the base confluence, which is then adjusted using a separate AI-driven technical ranking model. The final technical score summarizes this combined view.
The technical dashboard is best read as a two-layer system: (1) a broad 18-signal confluence that currently prints bullish (0.611), and (2) a reinforcement-learning technical rank that is Neutral at #1322 with a score of -0.295. The blend remains bullish (overall technical score 0.339), but the internal divergence argues for a more conditional interpretation than the headline confluence alone.
Breadth within the 18-signal stack is supportive—Bull 12 / Bear 1 / Neutral 5—and several momentum/accumulation measures align with a constructive bias (e.g., MACD histogram 0.3672 bullish; ROC(20) 2.535 bullish). At the same time, the presence of a single explicit bearish flag—Vol ROC(20) = -100—raises the probability that bullish signals may be occurring in a lower-participation environment.
That combination often produces a “good signals, incomplete confirmation” setup: price can drift higher on improving internals, but trend confirmation tends to be more reliable when volume behavior stops detracting. The neutral readings (RSI(14) 52.49; Stoch %K 26.13) further reinforce that this is not an overheated tape—more consistent with a rebuilding phase that still needs boundary confirmation at 509.0250 and defense of 483.8500.
6) News sentiment + extractive gist
Sentiment score (avg): 0.192 | Positive: 61% | Neutral: 39% | Negative: 0%
KGNAI AI News Sentiment Score (normalized -1 to +1): 0.99 (as of 2026-06-19) | Label: Bullish | Overall news score: 0.95
Positive Developments
Recent coverage across major financial outlets indicates a generally constructive narrative around Mastercard’s strategic positioning in digital payments infrastructure. The news mix skews favorable in aggregate (Positive 61%, Negative 0%), which is consistent with the strongly positive KGNAI news sentiment score (0.99) and overall news score (0.95). Themes emphasized in the current cycle include product and partnership activity tied to next-generation payment flows and the broader commercialization of AI-enabled commerce experiences. From a market-structure perspective, sustained positive sentiment can reinforce intermediate-term rank strength (e.g., 3-Monthly #21) when it coincides with improving momentum readings such as the positive MACD histogram (0.3672). However, sentiment should be treated as contextual bias rather than confirmation, particularly while trend filters (Close vs MA50; MA50 vs MA200) remain bearish.
Neutral / Mixed Developments
A meaningful share of the flow is informational rather than catalytic (Neutral 39%), centered on competitive framing and industry-level adoption dynamics rather than single-point corporate events. This type of coverage can keep attention on the sector without necessarily translating into immediate price discovery, which aligns with MA’s relatively contained volatility regime (Bollinger bandwidth 0.0504). Mixed narratives also fit with the report’s broader signal profile: a bullish 18-signal confluence (0.611) paired with a neutral DRL technical rank (#1322). The implication is that the information backdrop is supportive but not decisive; price still needs to resolve around the defined range boundaries (support 483.8500, resistance 509.0250) to convert “interest” into a clearer trend state.
Negative / Risk Signals
Even with 0% classified negative sentiment in the provided distribution, risk still exists in the form of execution sensitivity and expectation-setting. When narratives focus on innovation cycles, the market can become more reactive to confirmation signals such as adoption traction and sustained participation—particularly relevant given the bearish Vol ROC(20) = -100 signal in the technical stack. Another risk is analytical complacency: highly positive aggregate sentiment (avg 0.192 with a normalized score of 0.99) can coexist with less favorable trend structure, as currently indicated by bearish moving-average relationships. For positioning, the cleanest risk control remains structural: a close below 483.8500 would represent a defined deterioration condition regardless of sentiment tone.
- What to monitor next: Whether price can clear 509.0250 with volume rather than briefly tagging the level.
- What to monitor next: Any improvement in participation indicators that would reduce the drag implied by Vol ROC(20) = -100.
- What to monitor next: Whether momentum can stay constructive (MACD hist 0.3672) while RSI remains stable around the low-50s (52.49).
Sources referenced: Reuters, Bloomberg, Yahoo Finance, MarketWatch, Investing.com
7) Sources
Not available in the provided data.
You may also like: How KGNAI AI ranks instruments across global markets
Disclaimer: KGNAI provides AI-generated analytics and educational market commentary only. This is not financial advice. Markets involve risk. Always do your own research.