PI (PINETWORK-USD) — Pi Network Technical Stance Remains Range-Biased (10-Jun-2026)
PI (PINETWORK-USD) is currently characterized by neutral cross-sectional ranking within KGNAI’s 800-instrument crypto universe, while the indicator-level technical mix skews bearish and is partially offset by a neutral blended technical score. The daily rank sits at #363, with the weekly and monthly ranks at #196 and #205, suggesting the asset is neither in a leadership cohort nor in the weakest tail on a relative basis. Technically, moving-average structure remains negative (close vs MA50 and MA50 vs MA200 both bearish), and momentum gauges lean defensive with RSI(14) at 29.66 and a MACD histogram of -0.0007. Key decision zones are defined by support near 0.1365 and resistance near 0.1859, framing a probabilistic range where confirmation/invalidation matters more than point forecasts. News sentiment is broadly neutral with a slight negative bias (avg -0.013), reflecting sector-level risk tone rather than PI-specific catalysts.
- Rank stance (Short / Mid / Long): Neutral (Daily #363) / Neutral (Weekly #196) / Neutral (3-Month #461)
- Technical confluence: Bearish on 18-signal score (-0.444), but blended overall is Neutral (-0.199)
- Key levels: Support ~ 0.1365 | Resistance ~ 0.1859
- News sentiment bias: Neutral (avg -0.013; 81% neutral)
- Confirmation / invalidation condition: A break above 0.1859 with volume supports continuation; a close below 0.1365 elevates deterioration risk
KGNAI evaluates assets using large cross-sectional datasets built from millions of structured data points. Inputs incorporate fundamental metrics, technical structures, and systematically processed news sentiment. Statistical models, machine learning, and AI frameworks are used to assess relative positioning, signal alignment, and probabilistic behavior across broad universes.
- Ranks are comparative across the tracked universe, not absolute price targets.
- Confluence reflects alignment among independent signal groups.
- Support/resistance levels are probabilistic decision zones, not guarantees.
- Sentiment provides contextual bias within the broader analytical framework.
1) KGNAI AI Analysis
Region: CRYPTO
Total universe size: 800 ranked instruments
- Daily rank: #363 out of 800 — Neutral
- Weekly rank: #196 out of 800 — Neutral
- Monthly rank: #205 out of 800 — Neutral
- 3-Monthly rank: #461 out of 800 — Neutral
PI’s rank profile is best read as middling-to-upper-middle positioning rather than directional conviction. The weekly rank at #196 places PI closer to the upper quartile than the lower half, while the daily rank at #363 signals weaker near-term relative behavior versus peers. The #205 monthly rank reinforces that the asset is not currently behaving like a persistent leader, and the #461 3-month rank points to longer-horizon underperformance versus a broader crypto basket.
This cross-horizon pattern implies a timeframe inconsistency: mid-term ranking is steadier than the short-term tape, while the long-term cohort position remains softer. In practical market-structure terms, this often coincides with episodic rebounds that fail to transition into durable leadership—particularly when momentum and trend indicators do not confirm.
The stated term view is Neutral across short-, mid-, and long-term horizons, aligning with the idea that ranks are describing relative probability shifts rather than a one-way thesis. A meaningful improvement would typically be reflected first in the daily/weekly ranks compressing toward stronger deciles, while deterioration would usually show as sustained slippage of the weekly rank away from the current #196 area.
Term view: Short-term: Neutral. Mid-term: Neutral. Long-term: Neutral.
2) Price & trend overview
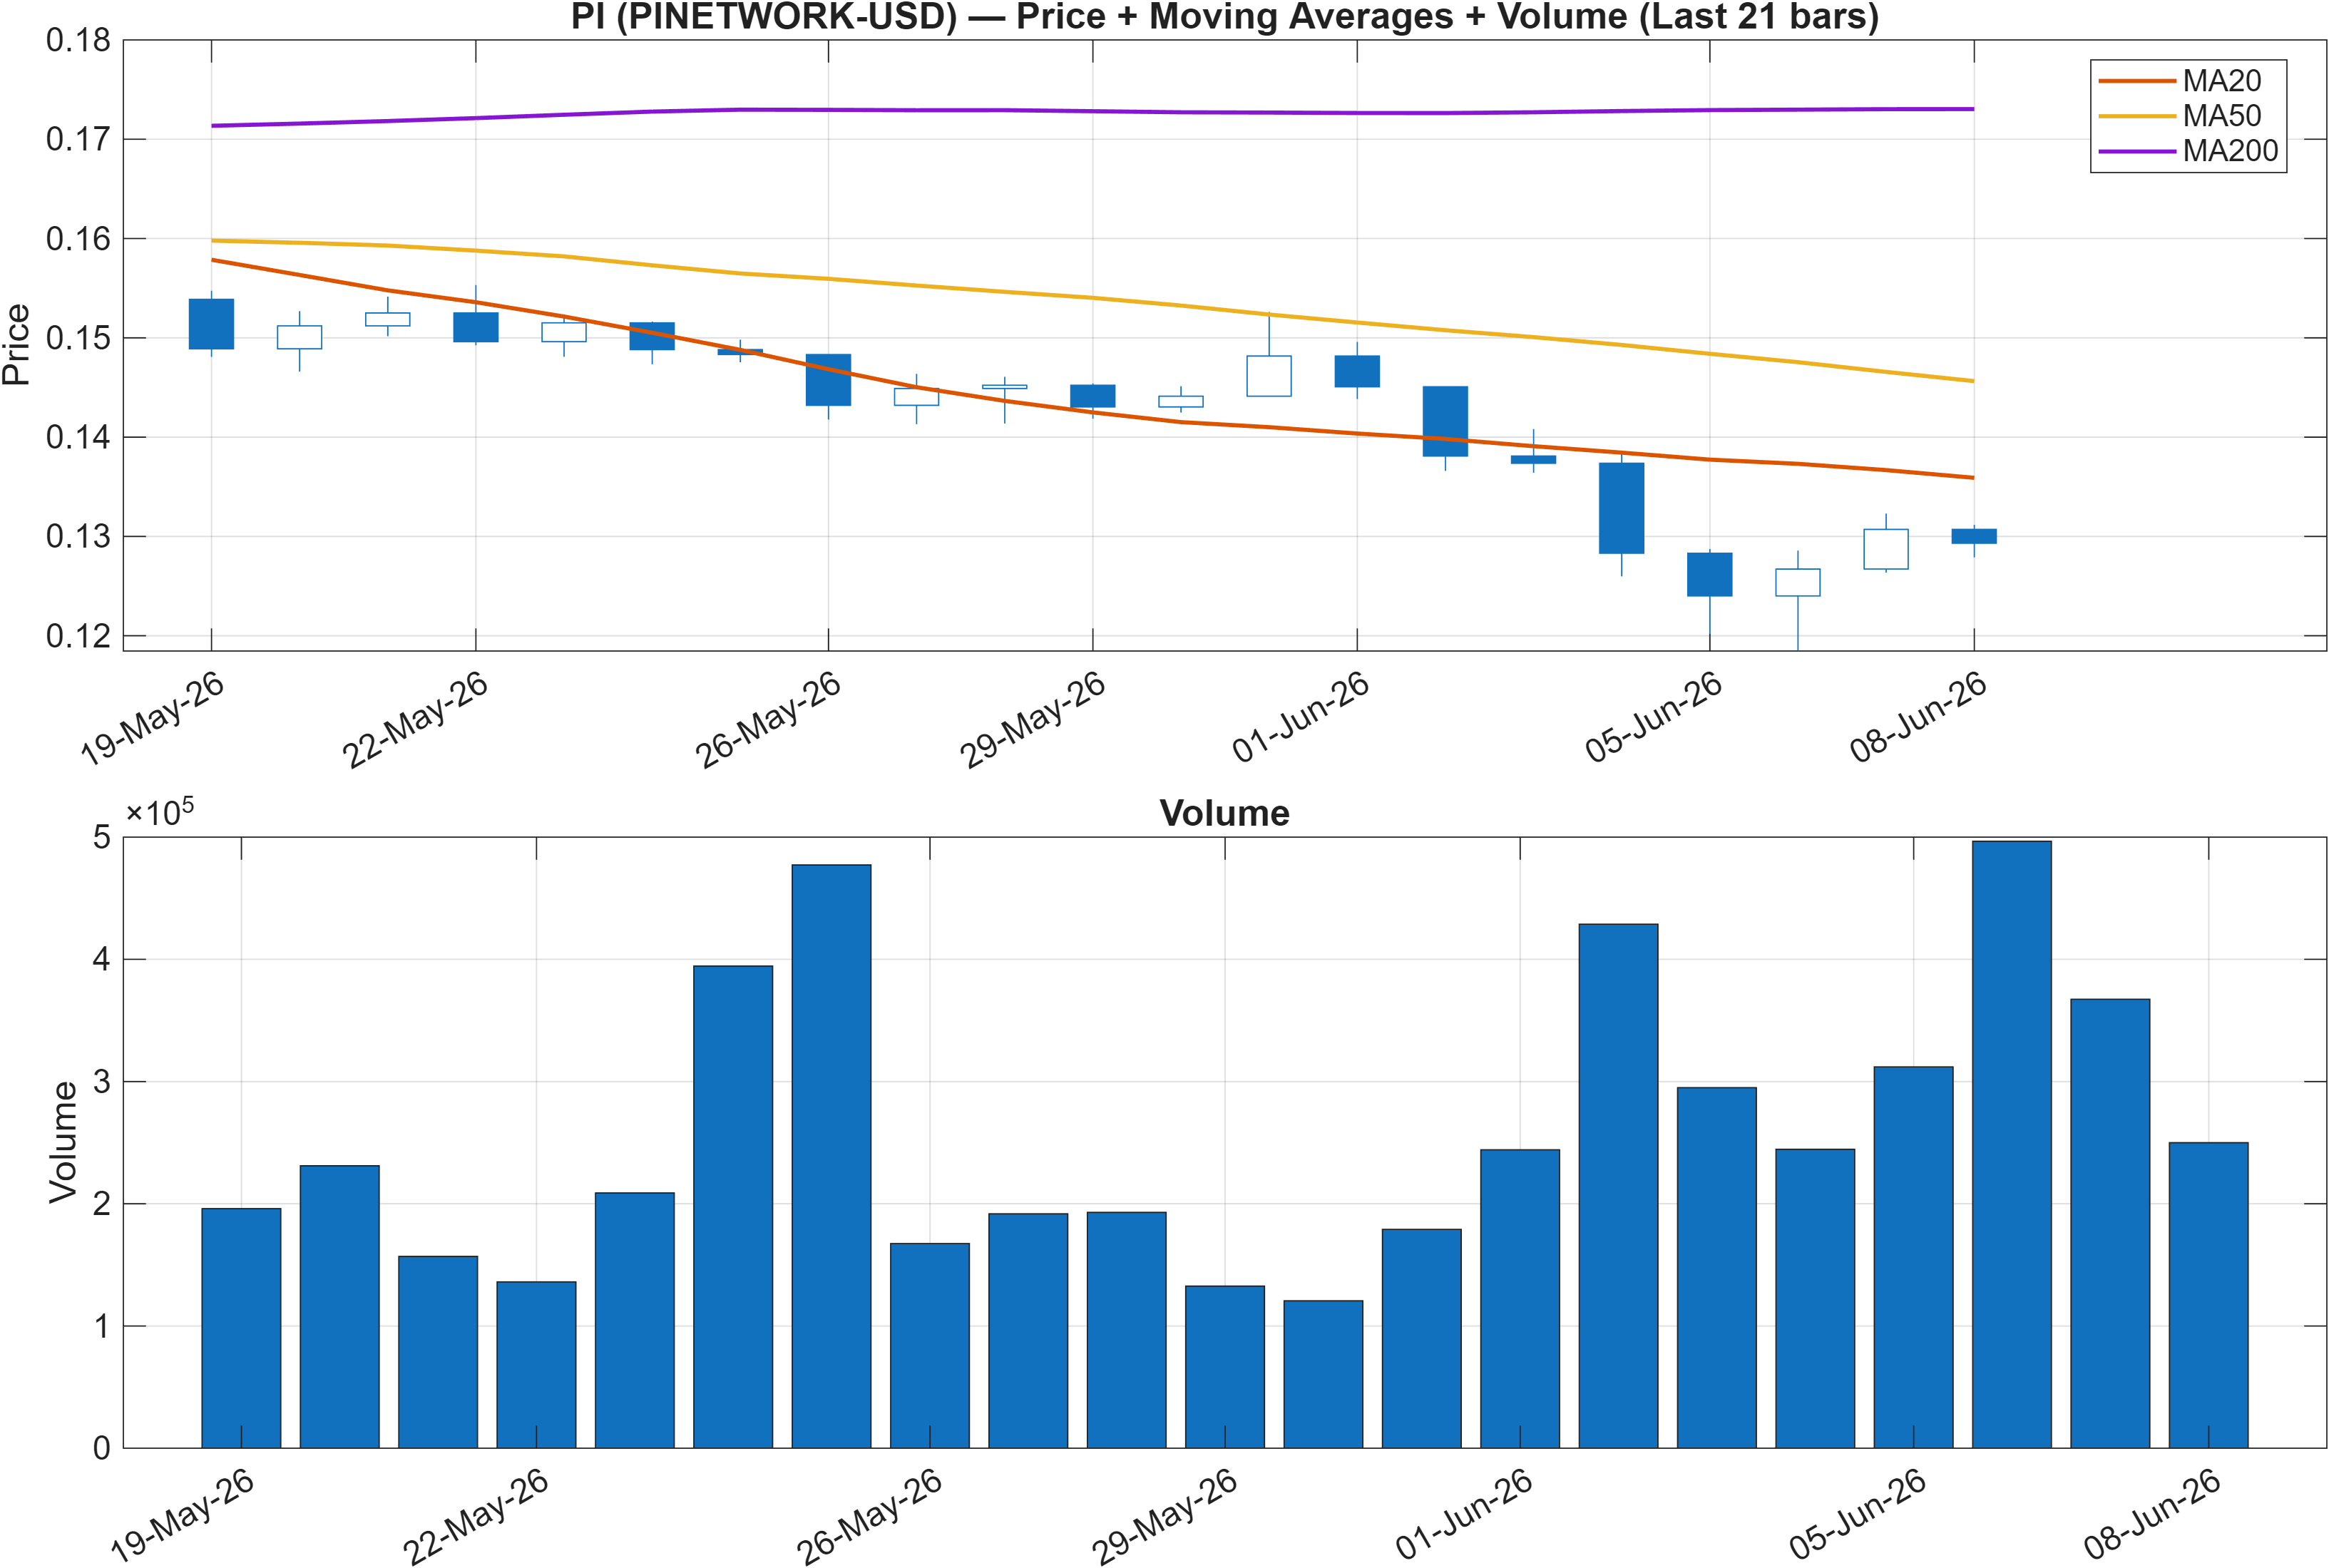
The moving-average configuration is uniformly defensive: close vs MA50 is bearish and MA50 vs MA200 is bearish. That combination typically describes a market where trend participants are still positioned for mean reversion rather than trend continuation, with rallies more likely to encounter supply until the shorter average begins to recover versus the longer one.
The trend picture also helps contextualize why ranks remain neutral rather than strongly negative. Despite bearish moving-average structure, PI is not screening as an extreme downside outlier in the broader 800-instrument universe (daily #363). That tends to occur when the asset’s drawdown is not accelerating relative to peers or when volatility is not expanding in a disorderly way.
Range conditions are reinforced by the report’s defined decision zones: support ~0.1365 and resistance ~0.1859. Until price can reclaim levels consistent with breaking the resistance zone, the moving-average stack argues for treating strength as repair rather than trend reversal. Conversely, a decisive break below support would align trend, momentum, and structure in the same direction, raising the probability that the longer-horizon rank (currently #461) remains a drag.
Interpretation: Close vs MA50 = Bearish, MA50 vs MA200 = Bearish.
3) Momentum & volatility dashboard
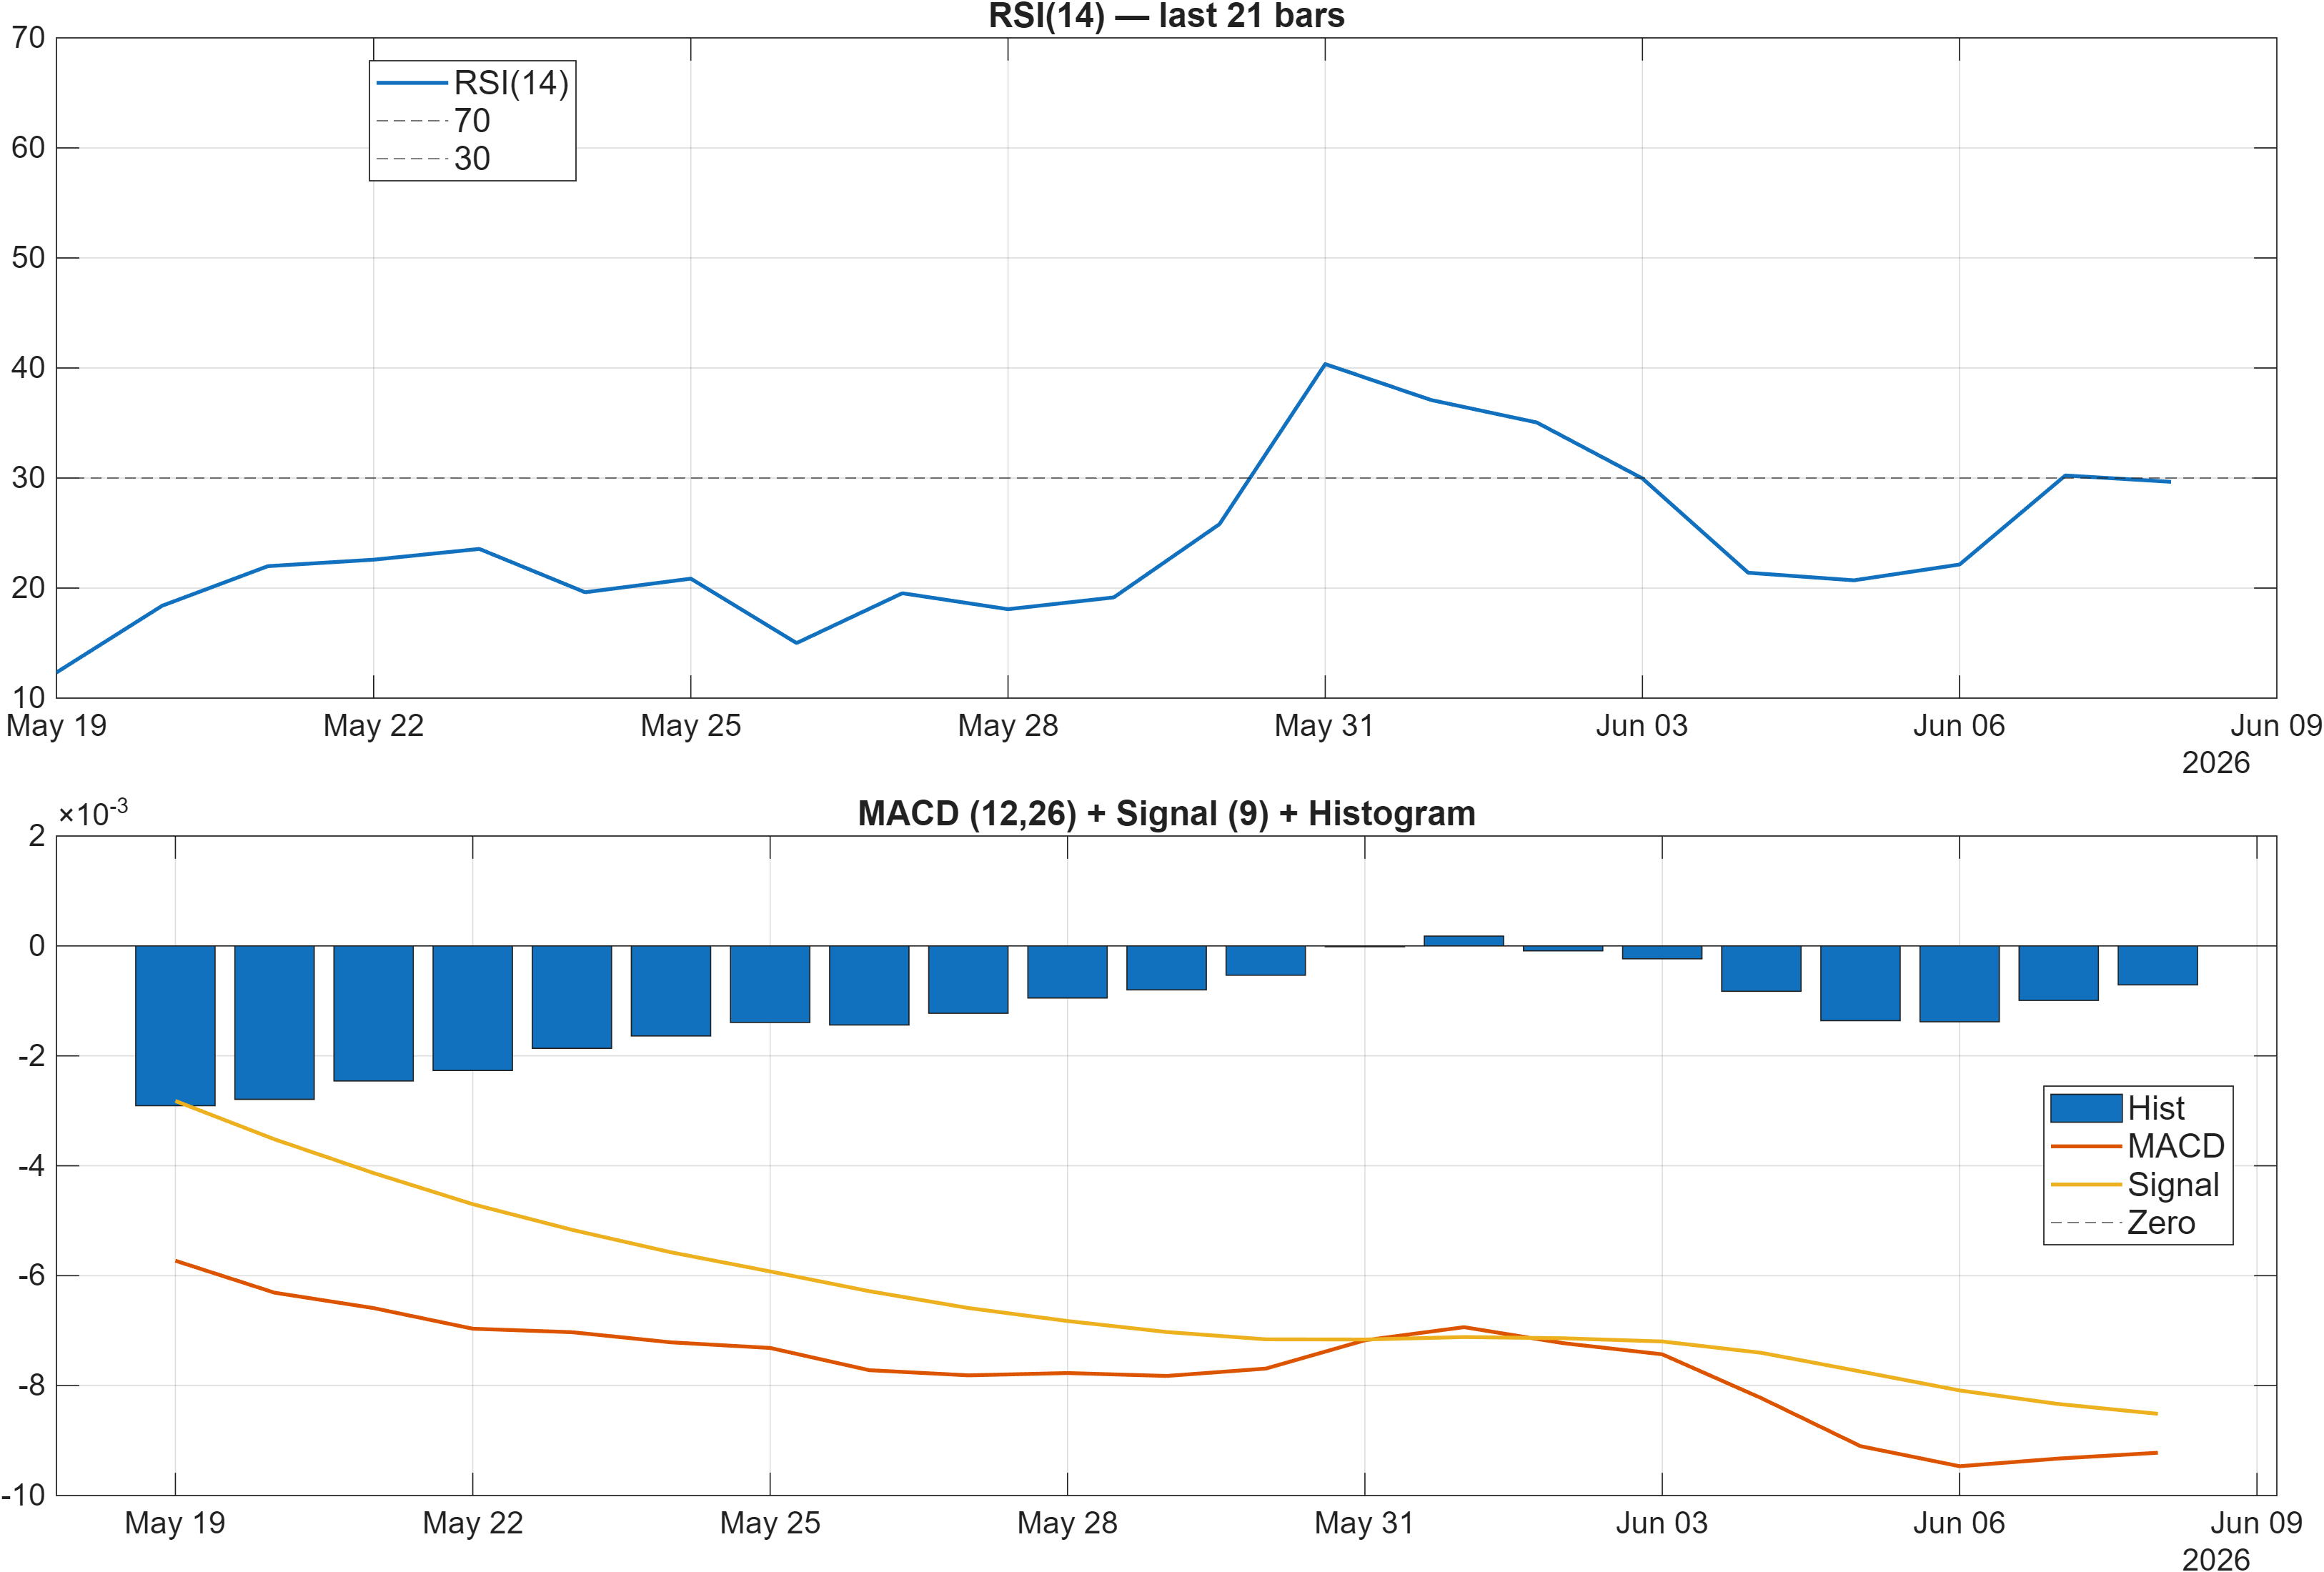
Momentum conditions lean bearish, but with signals that can behave differently depending on whether the market is trending or ranging. RSI(14) at 29.66 sits in a weak zone, consistent with the report’s stated RSI bias = Bearish. In many crypto regimes, sub-30 RSI can mark downside pressure that persists; in others, it becomes a setup for reflex rebounds—particularly if support holds and volume stabilizes.
The MACD histogram at -0.0007 indicates negative momentum remains present, aligning with bearish moving-average structure in Section 2. Importantly, MACD can improve before trend changes become obvious in price; however, the current reading still reflects a market where downside impulses have not fully dissipated.
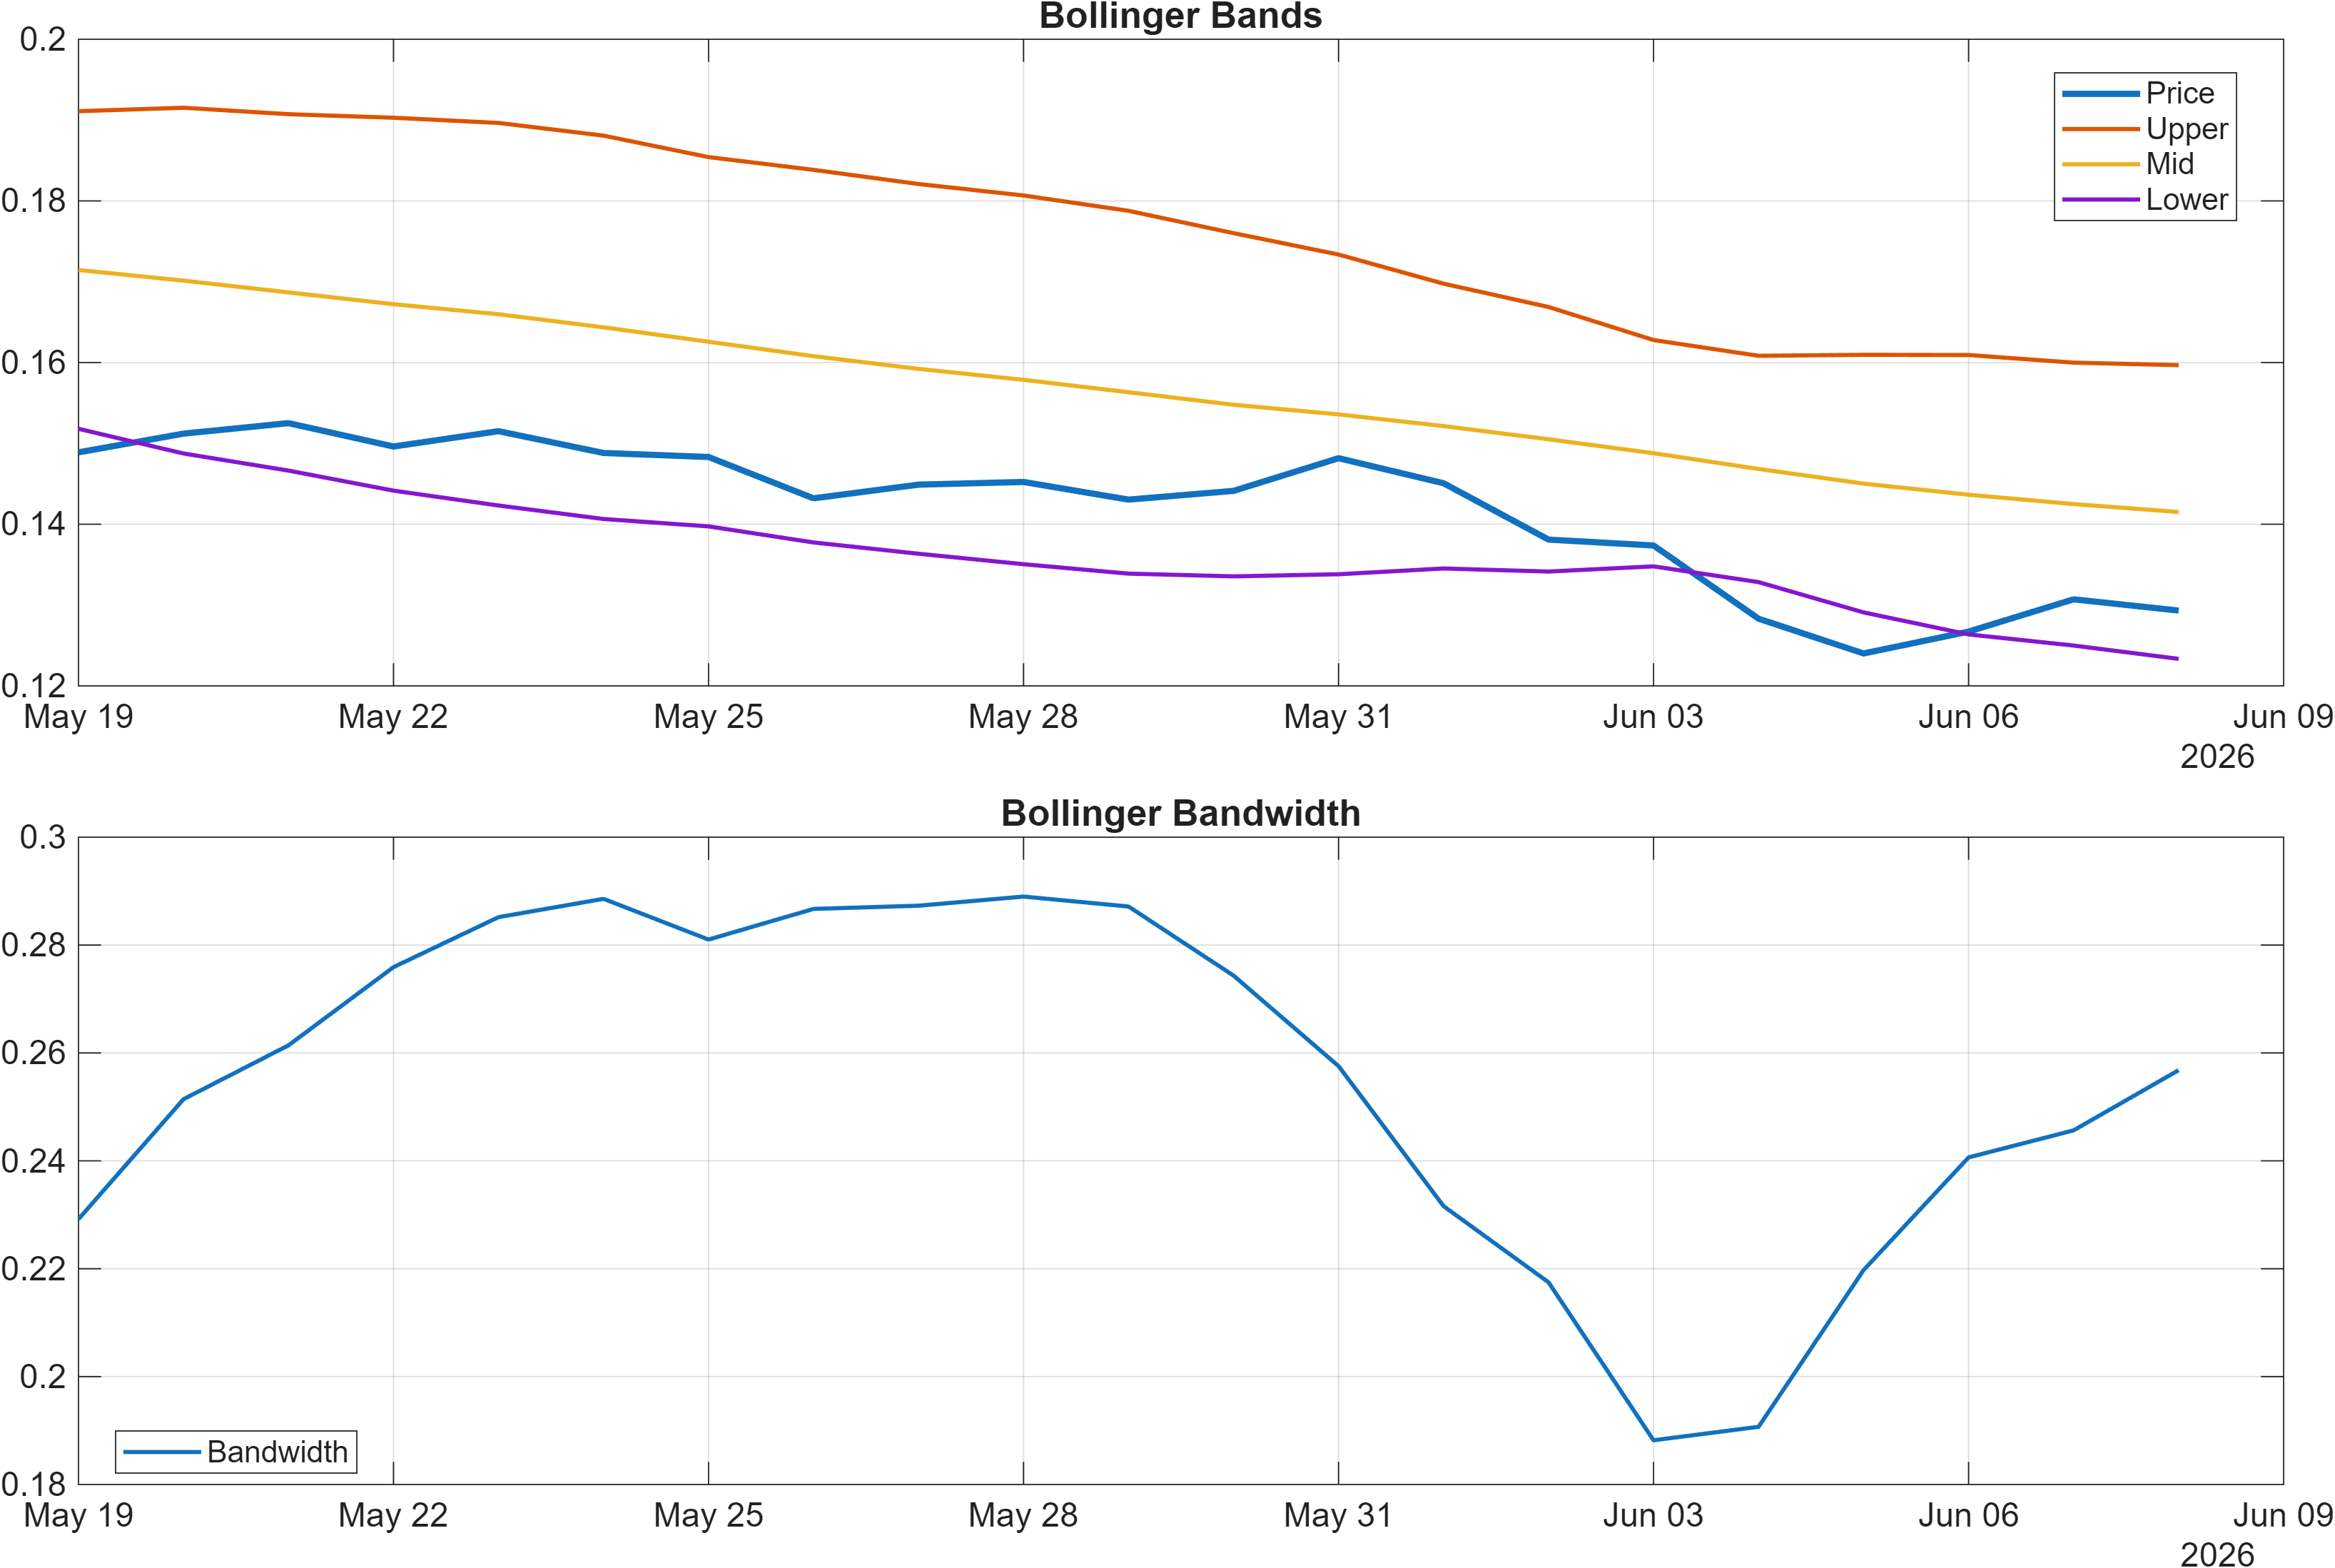
Volatility context comes from Bollinger Bandwidth, with the latest 0.2568. Bandwidth at this level suggests volatility is present but not necessarily in a runaway expansion. This matters because momentum weakness with contained volatility often maps to grinding pressure rather than capitulation. For decision-making, the key is whether volatility expands as price approaches 0.1365 support (risk of breakdown) or expands through 0.1859 resistance (potential regime transition).
Interpretation: RSI bias = Bearish, MACD hist = -0.0007. Bandwidth (volatility regime) latest = 0.2568.
4) Support / Resistance zones
Support ~ 0.1365 | Resistance ~ 0.1859
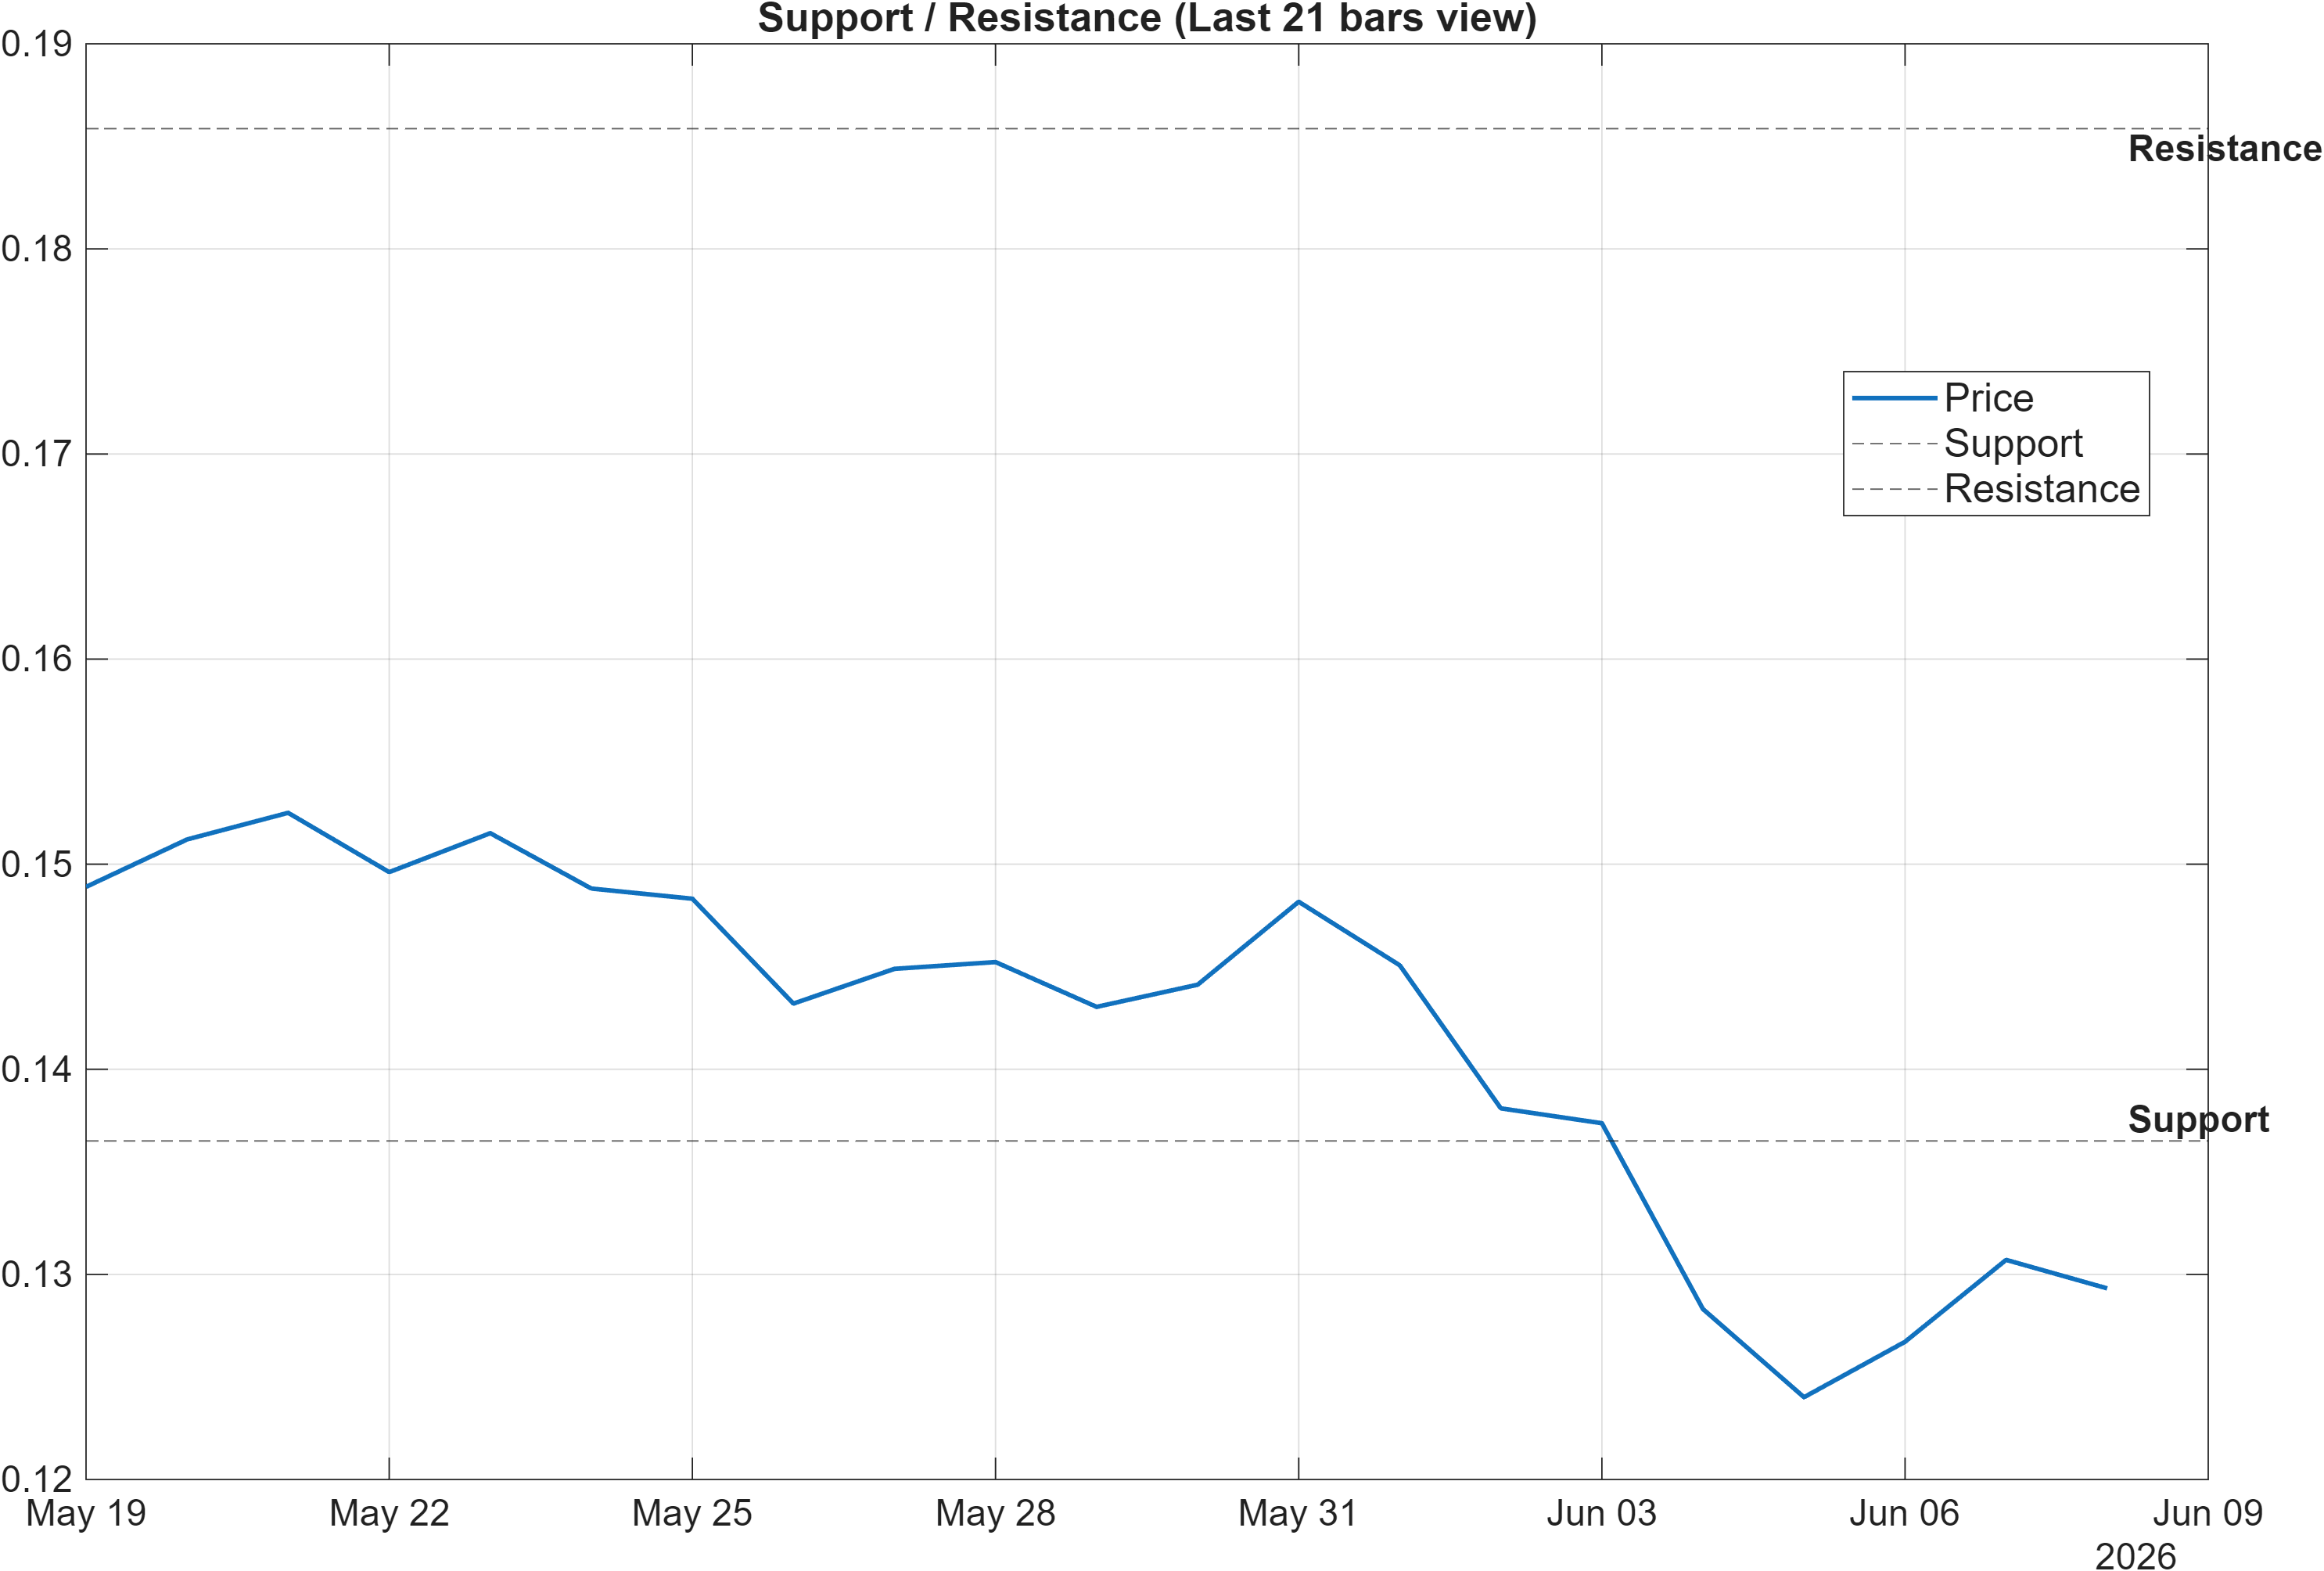
The current framework is explicitly zone-driven: PI is bounded by 0.1365 on the downside and 0.1859 on the upside. With moving averages bearish and RSI depressed (29.66), the support zone functions as the primary invalidation area for “sideways” bias. A close below support would tend to synchronize multiple bearish inputs—trend, momentum, and confluence—into a more coherent downside regime.
On the other side, the resistance zone is the level that must be reclaimed for a credible shift away from range behavior. The scenario guidance is clear: break above resistance with volume supports continuation. In practice, a high-quality breakout attempt usually coincides with improving momentum (MACD histogram moving toward zero from -0.0007) and less oversold RSI conditions. Without that, upside moves can remain susceptible to fade risk inside the range.
The rank structure reinforces this “confirmation-first” approach. With the weekly rank at #196 but the 3-month rank at #461, PI would typically need a sustained period of constructive closes—rather than a single spike—to pull the longer horizon out of the weaker cohort. That is why the report emphasizes confirmation and invalidation zones instead of point forecasts.
Scenario view: Break above resistance with volume → continuation. Close below support → signal deterioration risk.
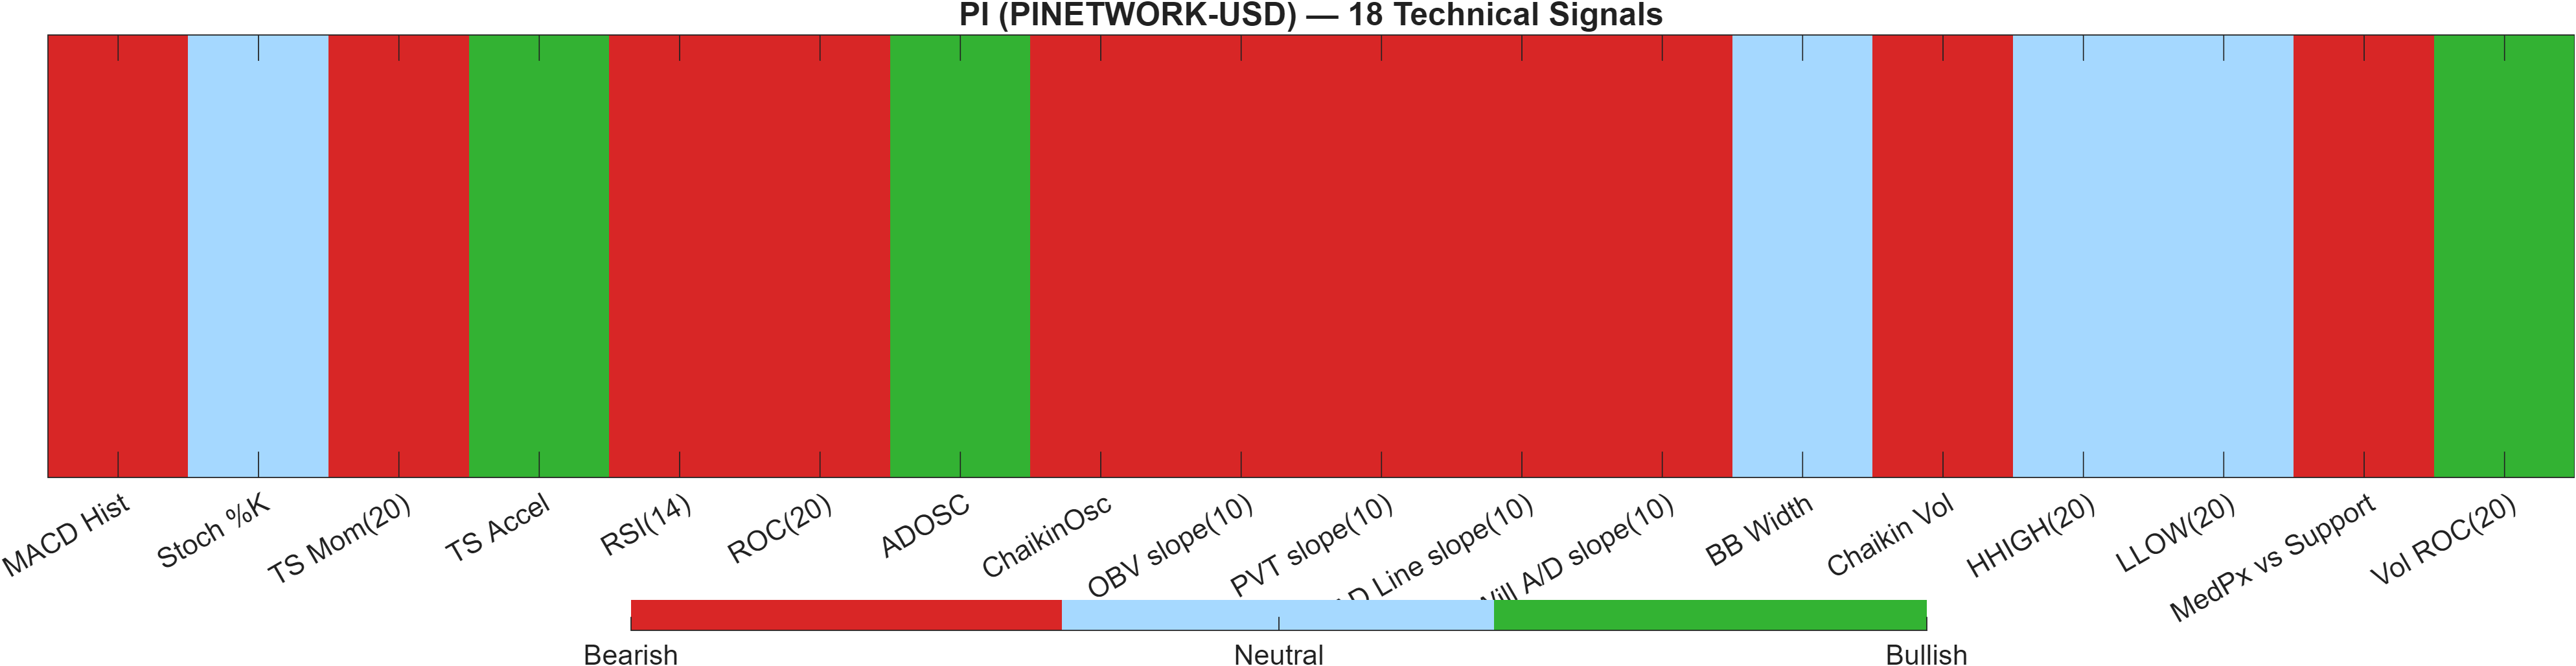
5) Quant Technical Dashboard (18 Signals)
KGNAI AI Technical Analysis Score (Deep Reinforcement Learning): Rank #251 out of 800 (Rank 1 represents the strongest technical positioning and a higher probability of favorable price behavior. As ranks increase toward the maximum, the probability of favorable outcomes weakens and bearish positioning becomes more dominant.) | Label: Neutral | Score: 0.373
18-Signal Technical Confluence Score: -0.444 (Bearish)
Overall Technical Score (18-signal confluence + DRL rank blend): -0.199 (Neutral)
Note: The blended score reflects signal strength weighted against broader AI technical ranking, which may temporarily diverge.
Blended technical score breakdown: -0.199 (Neutral | Bull 3 / Bear 11 / Neutral 4)
The dashboard highlights a key analytical tension: confluence is bearish (-0.444), yet the blended overall technical score is neutral (-0.199) due to the DRL technical rank sitting at #251 (labelled Neutral, score 0.373). This is a classic example of model stacking producing a “hold-neutral” outcome even when individual indicators skew negative.
Internally, the blend is consistent with the signal mix: Bear 11 / Bull 3 / Neutral 4. The bearish majority implies that momentum and flow proxies are not broadly supportive, which aligns with RSI weakness (29.66) and a negative MACD histogram (-0.0007088 in the signal table). At the same time, the presence of a few bullish components can reduce the probability of immediate breakdown if they reflect stabilization in activity (for example, volume change measures) rather than pure price momentum.
The most actionable interpretation is not “bearish equals sell,” but rather signal asymmetry: downside signals are currently more numerous, so any attempt to shift the regime typically needs stronger confirmation (e.g., reclaiming 0.1859 with volume) to overcome the present bias. If price fails to reclaim resistance and instead compresses toward 0.1365, the bearish confluence becomes more likely to dominate the blended neutral reading.
Signal table (Bull/Bear/Neutral)
| Indicator | Value | Signal |
|---|---|---|
| MACD Hist | -0.0007088 | Bearish |
| Stoch %K | 31.79 | Neutral |
| TS Mom(20) | -0.02189 | Bearish |
| TS Accel | 0.008551 | Bullish |
| RSI(14) | 29.66 | Bearish |
| ROC(20) | -14.48 | Bearish |
| ADOSC | 28.78 | Bullish |
| ChaikinOsc | -1.391e+04 | Bearish |
| OBV slope(10) | -6.109e+05 | Bearish |
| PVT slope(10) | -2.817e+04 | Bearish |
| AD Line slope(10) | -2.948e+05 | Bearish |
| Will A/D slope(10) | -0.01315 | Bearish |
| BB Width | 0.2568 | Neutral |
| Chaikin Vol | 48.68 | Bearish |
| HHIGH(20) | 0.1553 | Neutral |
| LLOW(20) | 0.1185 | Neutral |
| MedPx vs Support | -0.006979 | Bearish |
| Vol ROC(20) | 8.163 | Bullish |
Interpretation: Indicator-level signals form the base confluence, which is then adjusted using a separate AI-driven technical ranking model. The final technical score summarizes this combined view.
6) News sentiment + extractive gist
Note: Instrument-specific news matches were not found, so the digest includes broader market/sector headlines.
Sentiment score (avg): -0.013 | Positive: 6% | Neutral: 81% | Negative: 12%
KGNAI AI News Sentiment Score (normalized -1 to +1): Not available (as of —) | Label: Not available | Overall news score: -0.01
Positive Developments
Recent coverage across major financial outlets indicates pockets of constructive tone centered on market structure and capital flows rather than PI-specific drivers. The dominant “positive” thread is that risk capital allocation remains active—particularly where large technology and AI-related fundraising narratives are influencing liquidity expectations across speculative assets. In parallel, policy discussion around developer protections and regulatory framing has been covered in a way that can be read as supportive for open-source and infrastructure-adjacent crypto activity over time. In sentiment terms, this constructive backdrop is present but modest, consistent with the low 6% positive share and the slightly negative average sentiment (-0.013). For PI, the practical implication is that broader risk appetite can help stabilize range conditions, but it does not replace the need for technical confirmation near 0.1859 resistance.
Neutral / Mixed Developments
The neutral bucket remains dominant (81%), reflecting that most coverage is informational and cross-market rather than catalytic for a single token. The recurring themes are regulatory process updates, market positioning commentary, and macro-style read-throughs (liquidity, leverage, and risk-on/risk-off framing). This aligns with a regime where traders often respond more to technical levels than to incremental headlines. With PI’s technical picture showing bearish moving-average structure but a neutral blended score (-0.199), a high neutral-news share typically coincides with range-bound price discovery: news is not providing a strong push, so support/resistance levels at 0.1365 and 0.1859 remain the primary decision references.
Negative / Risk Signals
Risk-oriented coverage has emphasized leverage sensitivity and downside air pockets across major crypto assets, including discussions of liquidations and the fragility that can emerge when positioning becomes one-sided. Even though this digest is sector-level (not PI-specific), it matters for correlation risk: in stressed tapes, smaller assets often inherit volatility from majors. The negative share is 12%, which is not extreme, but it is directionally consistent with PI’s bearish confluence reading (-0.444) and depressed momentum (RSI(14) 29.66). If risk-off narratives intensify, the market tends to test support zones more frequently, raising the importance of how price behaves around 0.1365 and whether volatility expands beyond the current bandwidth context (0.2568).
- Whether price holds 0.1365 on daily closes while RSI recovers from 29.66.
- Any push through 0.1859 that is accompanied by visible volume confirmation.
- Whether the weekly rank (currently #196) improves while the 3-month rank (#461) stops lagging.
Sources referenced: Reuters, Bloomberg, Yahoo Finance, MarketWatch, Investing.com
Snapshot: AI Rank (Short–Mid–Long): Neutral (Neutral–Neutral–Neutral) · Technical Confluence: Bearish · Key Levels: Support ~0.14 | Resistance ~0.19 · News Sentiment: Neutral
7) Sources
Not available in the provided data.
You may also like: How KGNAI AI ranks instruments across global markets
Disclaimer: KGNAI provides AI-generated analytics and educational market commentary only. This is not financial advice. Markets involve risk. Always do your own research.