CHFRUB (Swiss Franc/Russian Rouble) — 21-Jun-2026 Quant Signal Review with a Neutral-to-Bullish Long-Term Tilt
CHFRUB is displaying a split profile across horizons as of 21-Jun-2026: long-horizon KGNAI ranks remain constructive (Monthly #23 and Yearly #16 out of 927), while short-horizon positioning is less decisive (Daily #384, 3-Monthly #506). Technically, trend structure is leaning heavy on the near-term—price is below the MA50 and the MA50 is below the MA200—yet momentum is not uniformly bearish: MACD histogram is still positive at 0.0630 even as RSI(14) reads 33.26 (bearish bias). Volatility is also relatively compressed with Bollinger Bandwidth at 0.0364, raising the importance of level-based confirmation. Key decision zones are clearly defined: support near 89.8980 and resistance near 96.5763. News sentiment in the provided digest skews neutral overall (0.050 average; 81% neutral), framing a context where technical confirmation likely dominates the next actionable signal.
- Rank stance: Short-term Neutral | Mid-term Neutral | Long-term Bullish
- Technical confluence: Neutral (18-signal confluence -0.111; blended 0.129) with DRL technical rank #144/927 Bullish
- Key levels: Support ~ 89.8980 | Resistance ~ 96.5763
- News sentiment bias: Neutral (avg 0.050; 19% positive / 81% neutral / 0% negative)
- Confirmation / invalidation: A sustained move above 96.5763 supports continuation; a close below 89.8980 increases deterioration risk.
KGNAI evaluates assets using large cross-sectional datasets built from millions of structured data points. Inputs incorporate fundamental metrics, technical structures, and systematically processed news sentiment. Statistical models, machine learning, and AI frameworks are used to assess relative positioning, signal alignment, and probabilistic behavior across broad universes.
- Ranks are comparative across the tracked universe, not absolute price targets.
- Confluence reflects alignment among independent signal groups.
- Support/resistance levels are probabilistic decision zones, not guarantees.
- Sentiment provides contextual bias within the broader analytical framework.
KGNAI Signal + Technical Snapshot + News Sentiment Digest
As of: 21-Jun-2026
Ticker: CHFRUB
1) KGNAI AI Analysis
Region: FOREX
Total universe size: 927 ranked instruments
- Daily rank: #384 out of 927 — Neutral
- Weekly rank: #145 out of 927 — Bullish
- Monthly rank: #23 out of 927 — Bullish
- 3-Monthly rank: #506 out of 927 — Neutral
- 6-Monthly rank: #33 out of 927 — Bullish
- Yearly rank: #16 out of 927 — Bullish
Cross-horizon ranking dispersion is the defining feature. The Yearly rank (#16) and Monthly rank (#23) sit in the top decile of the 927-instrument universe, signaling that the longer-run statistical profile remains favorable relative to peers. This contrasts with a Daily rank (#384) in the middle of the distribution and a 3-Monthly rank (#506) in the lower half, indicating near-term behavior is not yet reinforcing the long-horizon edge.
The intermediate frames lean constructive but not extreme: Weekly (#145) sits in the upper quartile while 6-Monthly (#33) remains firmly top-decile. Taken together, the rank stack reads less like a uniform trend and more like a regime transition where longer-term factors stay supportive while shorter-term price behavior is working through drawdown or consolidation.
Within KGNAI’s framework, this “long-term bullish / short-term neutral” mix usually places emphasis on confirmation: the market can remain statistically attractive over long windows while still requiring improved short-window structure before the probability-weighted path becomes cleaner. That distinction is consistent with the current term view: Short-term Neutral, Mid-term Neutral, Long-term Bullish.
Term view: Short-term: Neutral. Mid-term: Neutral. Long-term: Bullish.
Want the full universe and complete rank tables? Unlock full access on KGNAI: https://www.kgnai.com/pricing
2) Price & trend overview
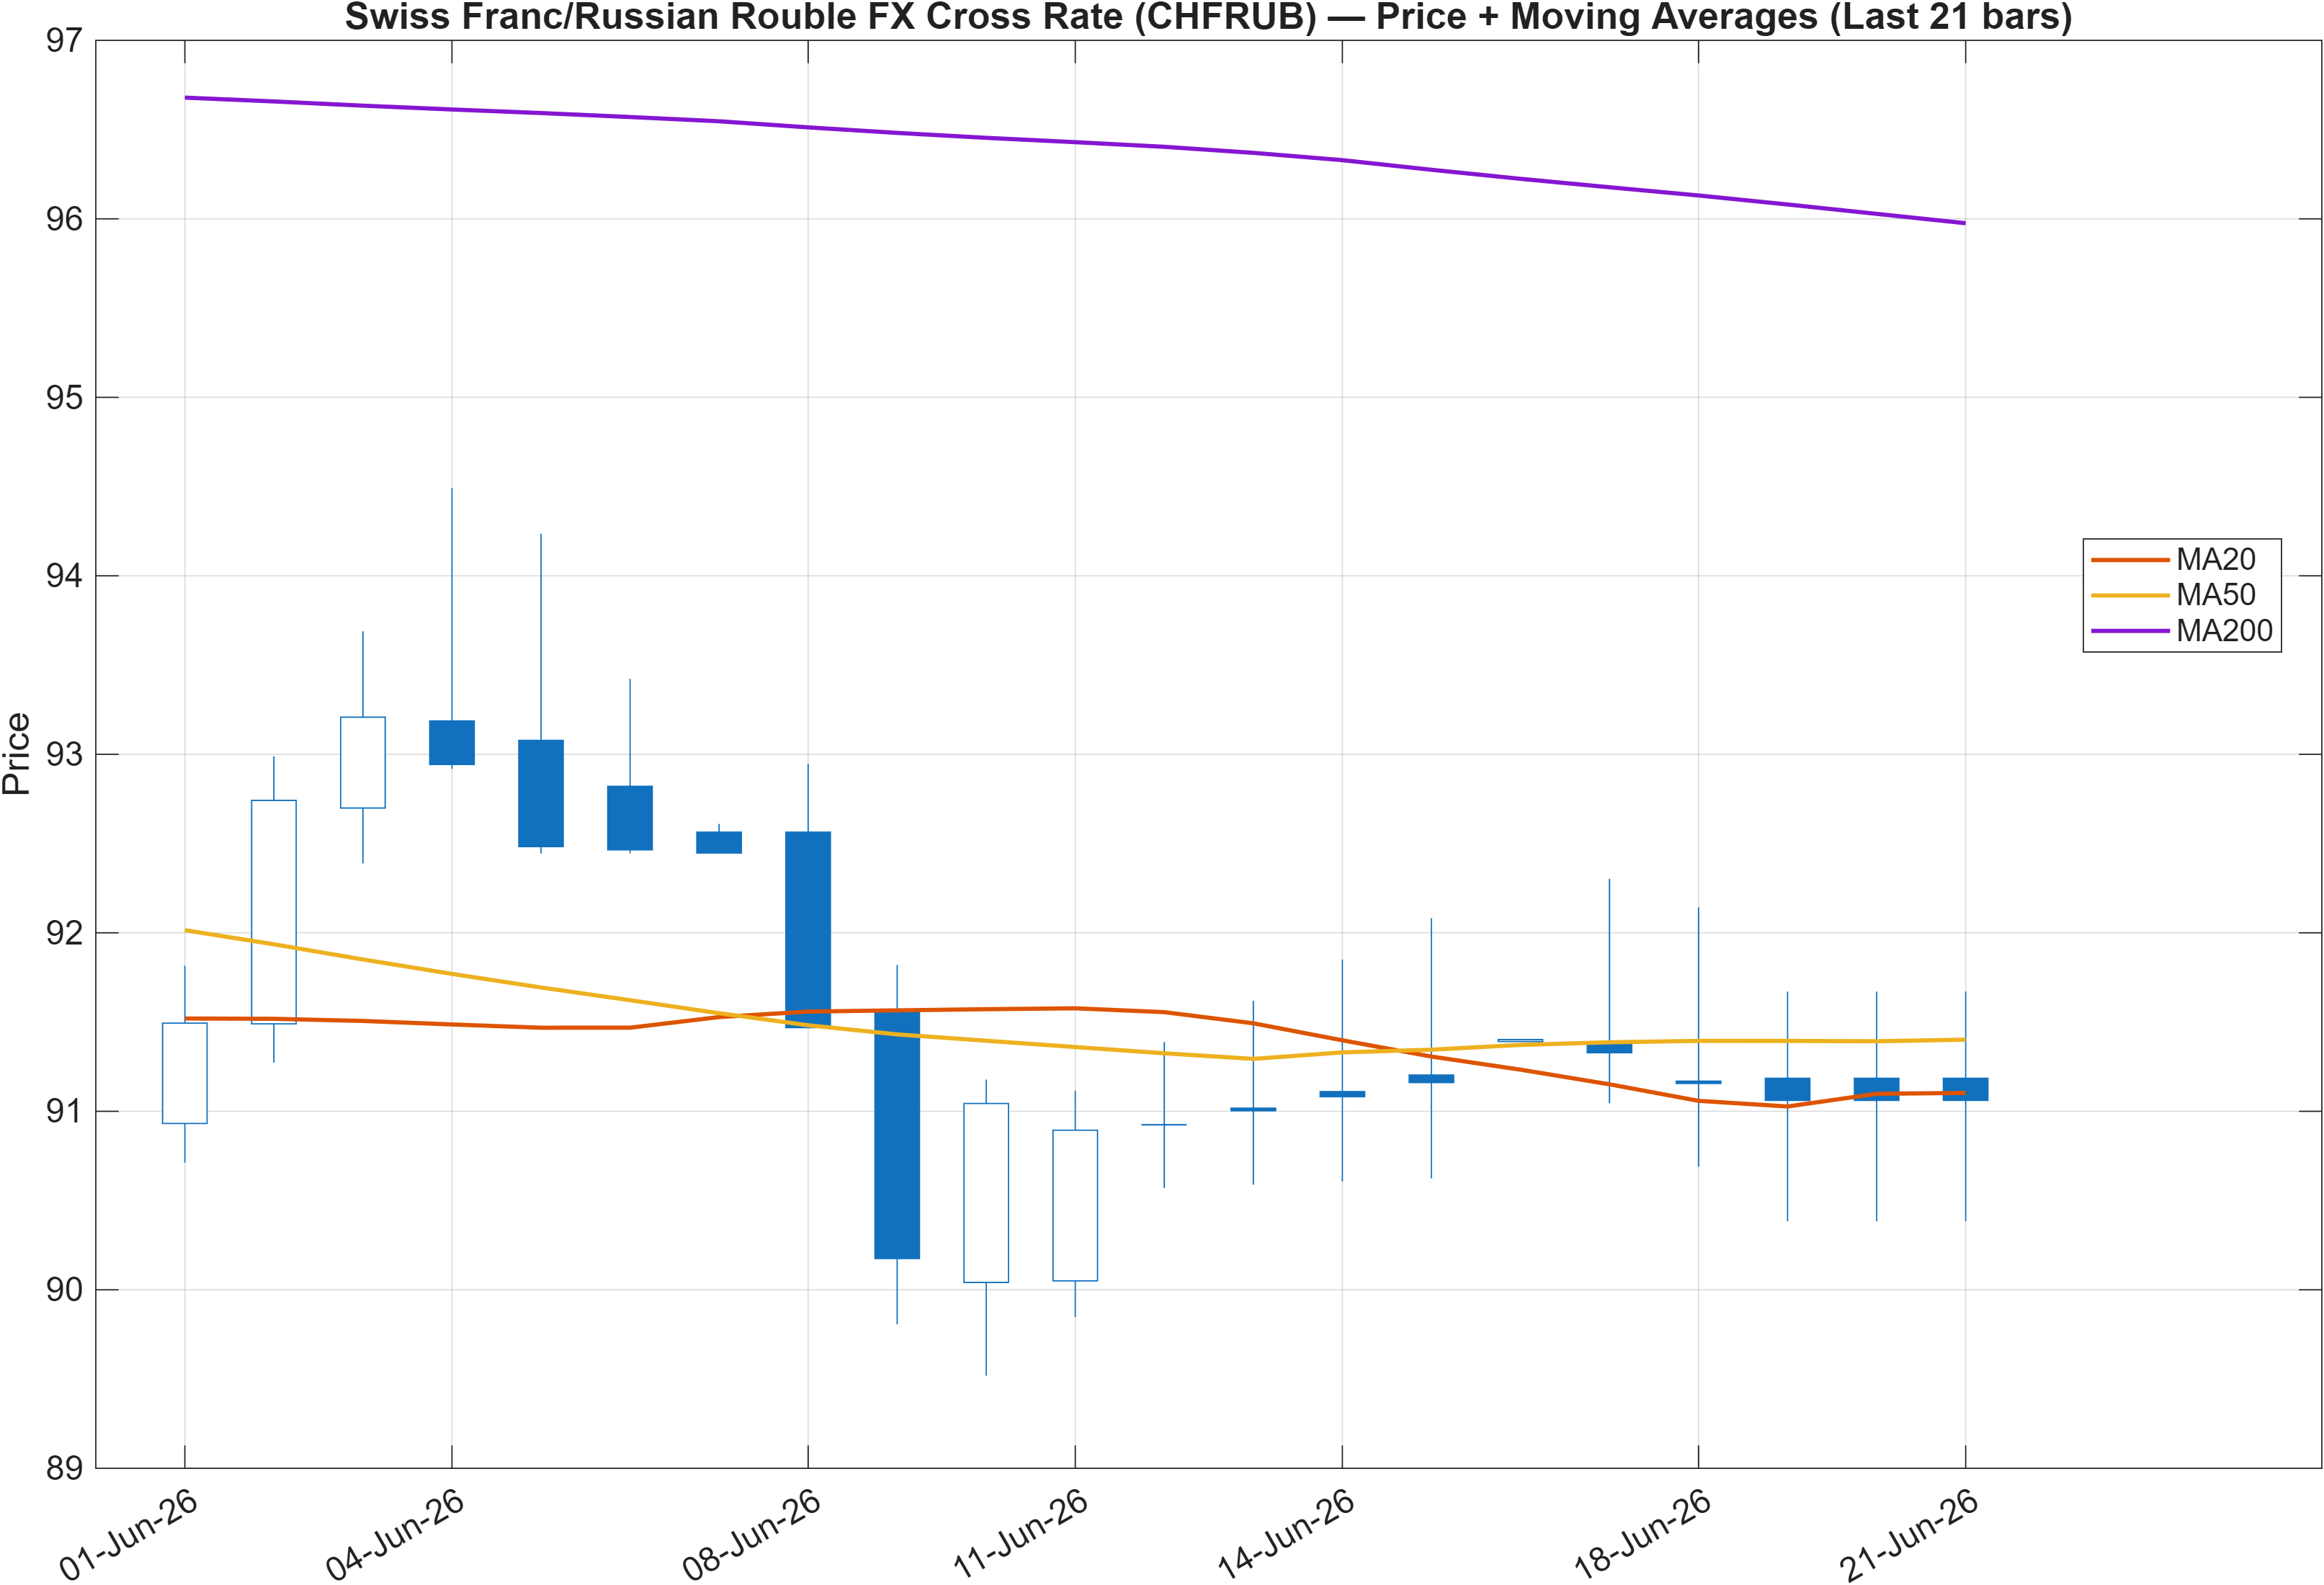
The trend stack is currently Bearish on a classical moving-average basis: close vs MA50 is bearish, and MA50 vs MA200 is bearish. This configuration typically reflects a market that has not yet rebuilt medium-term trend support, even if longer-horizon ranks remain favorable.
The key analytical nuance is the interaction between the bearish MA structure and the high-quality long-horizon ranks (e.g., Yearly #16, 6-Monthly #33). When those disagree, the market often becomes sensitive to range boundaries and inflection points rather than delivering steady trend continuation. That sensitivity is reinforced by the clearly defined nearby zones: support ~89.8980 and resistance ~96.5763.
Practically, the MA configuration argues that rallies can face overhead friction until the market begins to reclaim trend measures. Conversely, the rank profile argues that if price action stabilizes and confirms through resistance, the longer-term statistical tilt has room to reassert. With the market framed between 89.8980 and 96.5763, trend confirmation is less about narrative and more about whether price can transition from “below key averages” to “rebuilding above them.”
Interpretation: Close vs MA50 = Bearish, MA50 vs MA200 = Bearish.
3) Momentum & volatility dashboard
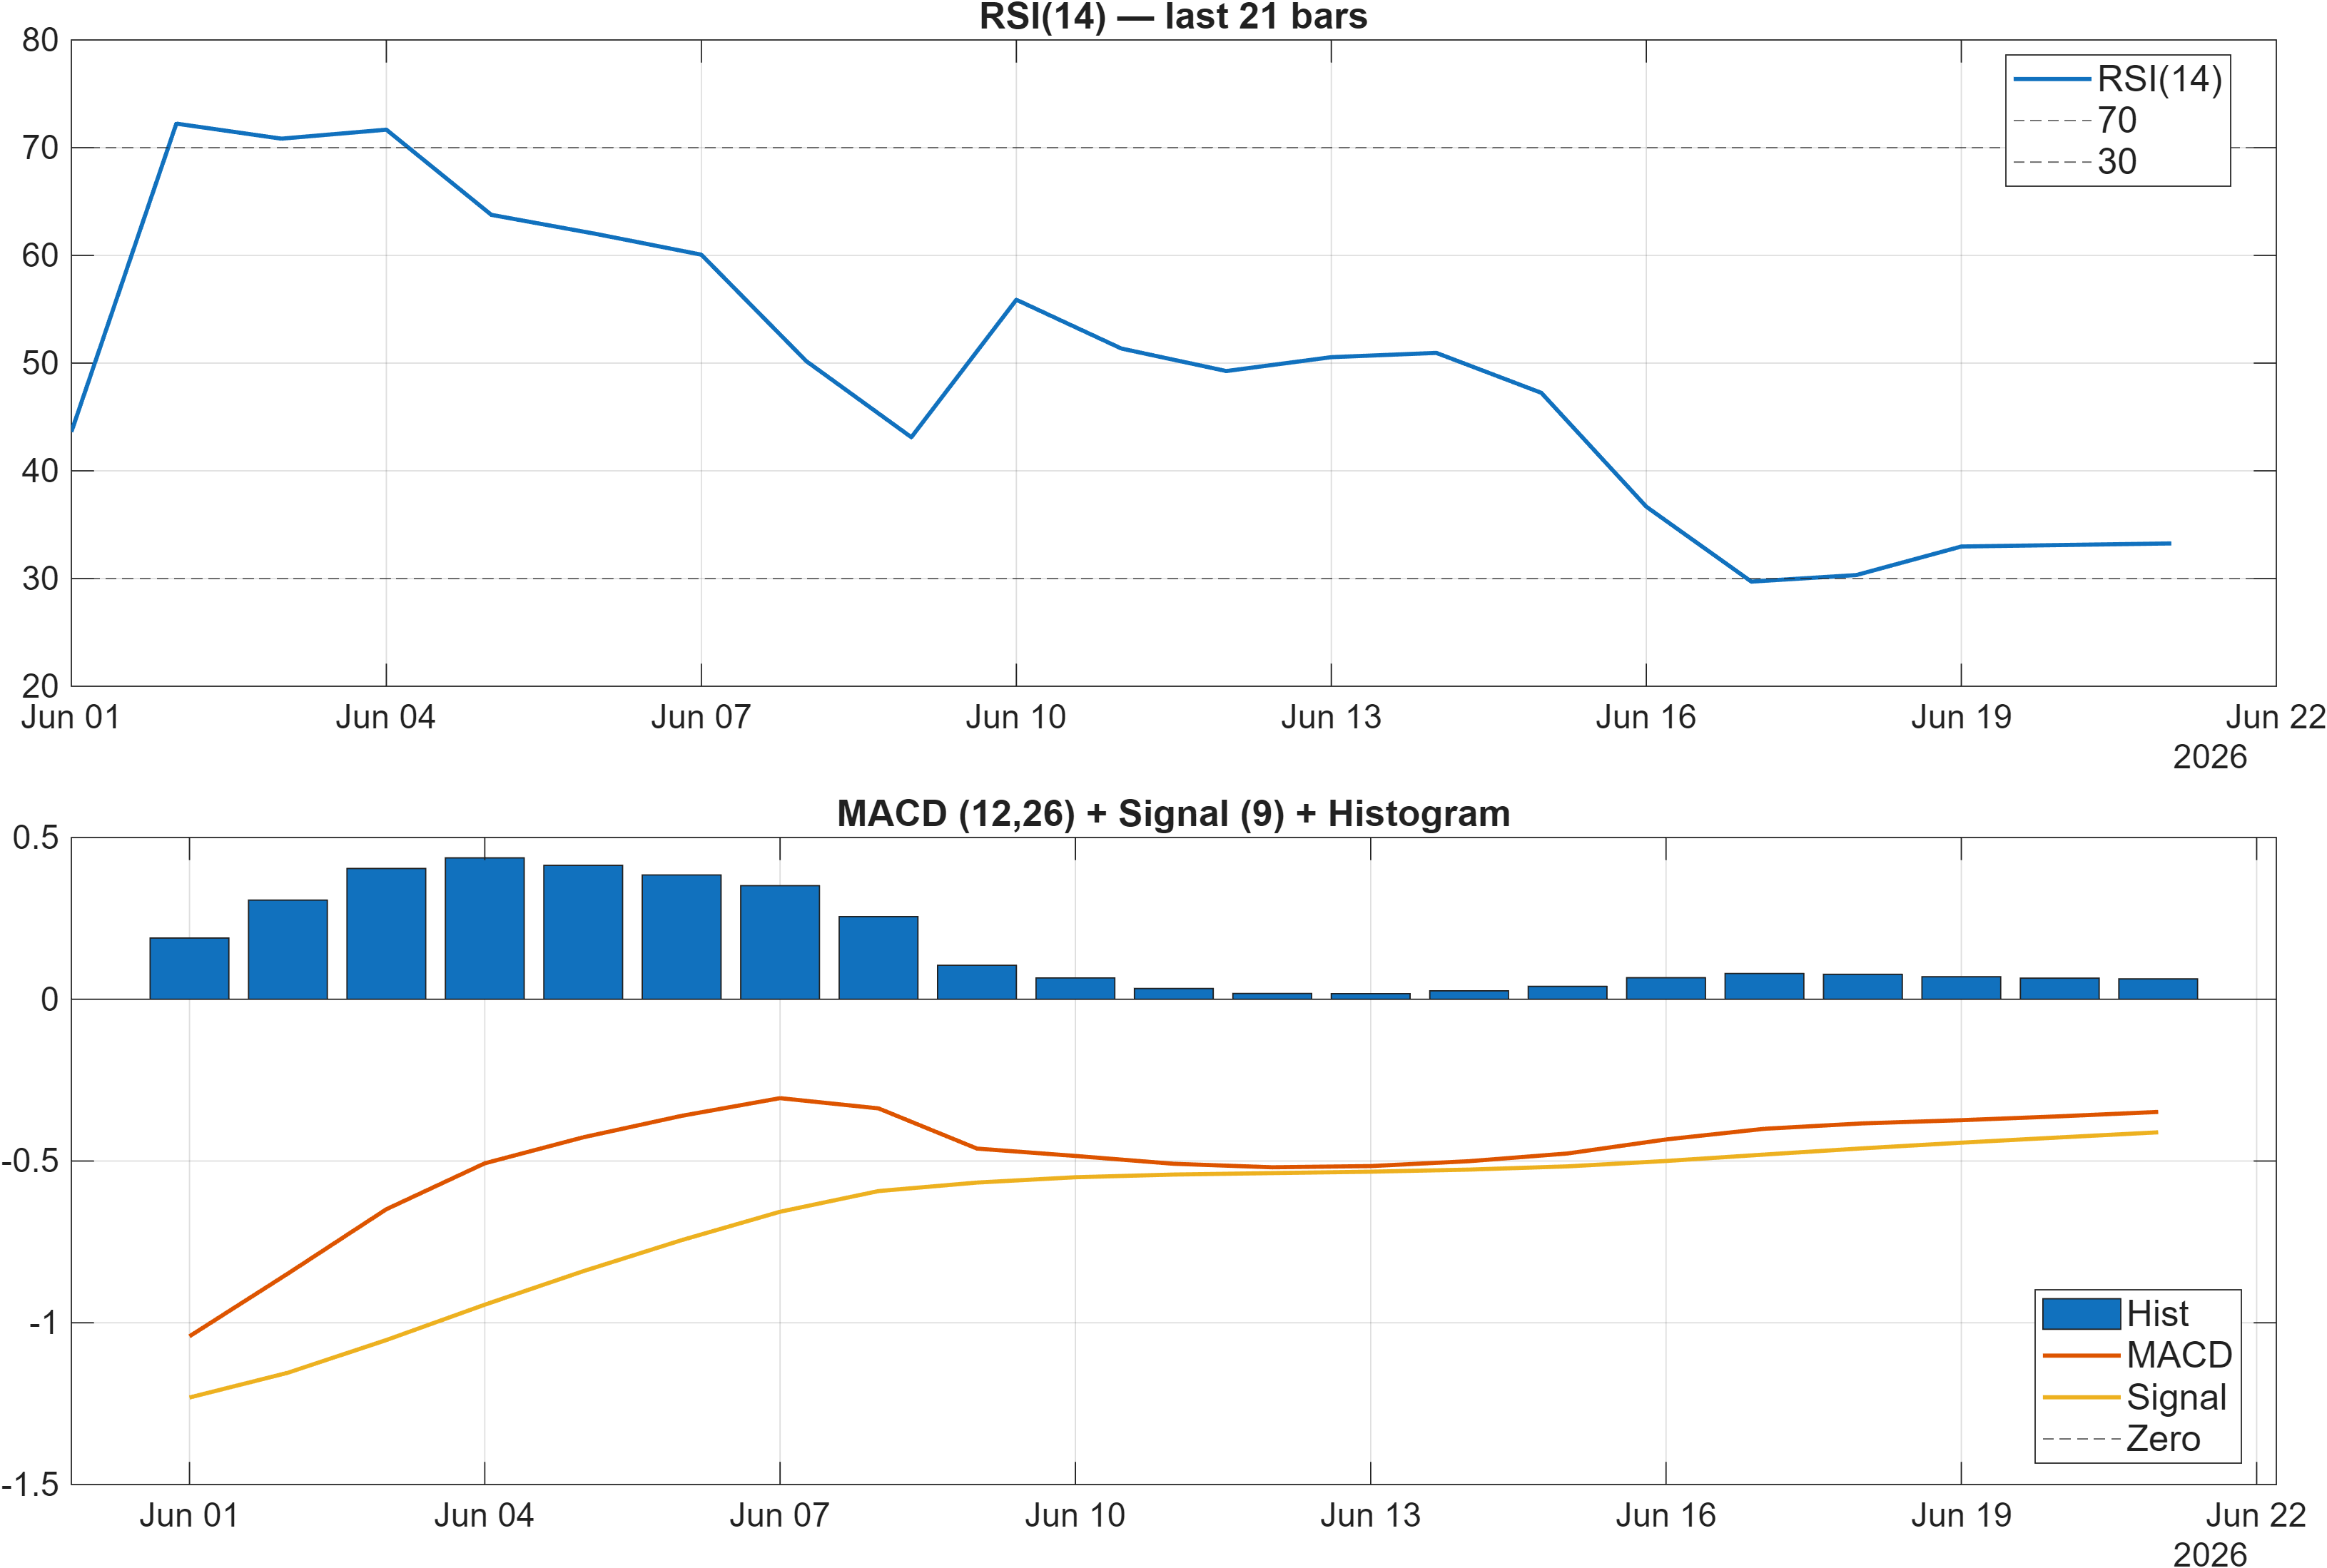
Momentum signals are sending a mixed message that fits the broader “crossroads” profile. RSI(14) at 33.26 carries a Bearish bias, consistent with recent downside pressure and limited immediate trend strength. At the same time, MACD histogram at 0.0630 remains positive, suggesting downside momentum may be moderating rather than accelerating.
Volatility adds another layer: Bollinger Bandwidth at 0.0364 signals a relatively compressed regime. In FX crosses, compression frequently increases the importance of breakout validation because incremental momentum readings can flip quickly when range conditions give way. This makes level-based interpretation more reliable than extrapolating a single oscillator.
Within the 18-signal dashboard, momentum and rate-of-change elements are tilted negative (e.g., TS Mom(20) -1.681 and ROC(20) -1.813 are bearish in the signal table), yet not all participation/flow proxies confirm persistent distribution (several slopes are neutral). That combination often characterizes a market where sellers had control recently, but follow-through is no longer dominant enough to create a clean trend extension.
Netting these components: RSI points to weak short-window demand, MACD points to stabilization potential, and low bandwidth argues for patience until price confirms direction through the nearby support/resistance structure.
Interpretation: RSI bias = Bearish, MACD hist = 0.0630.
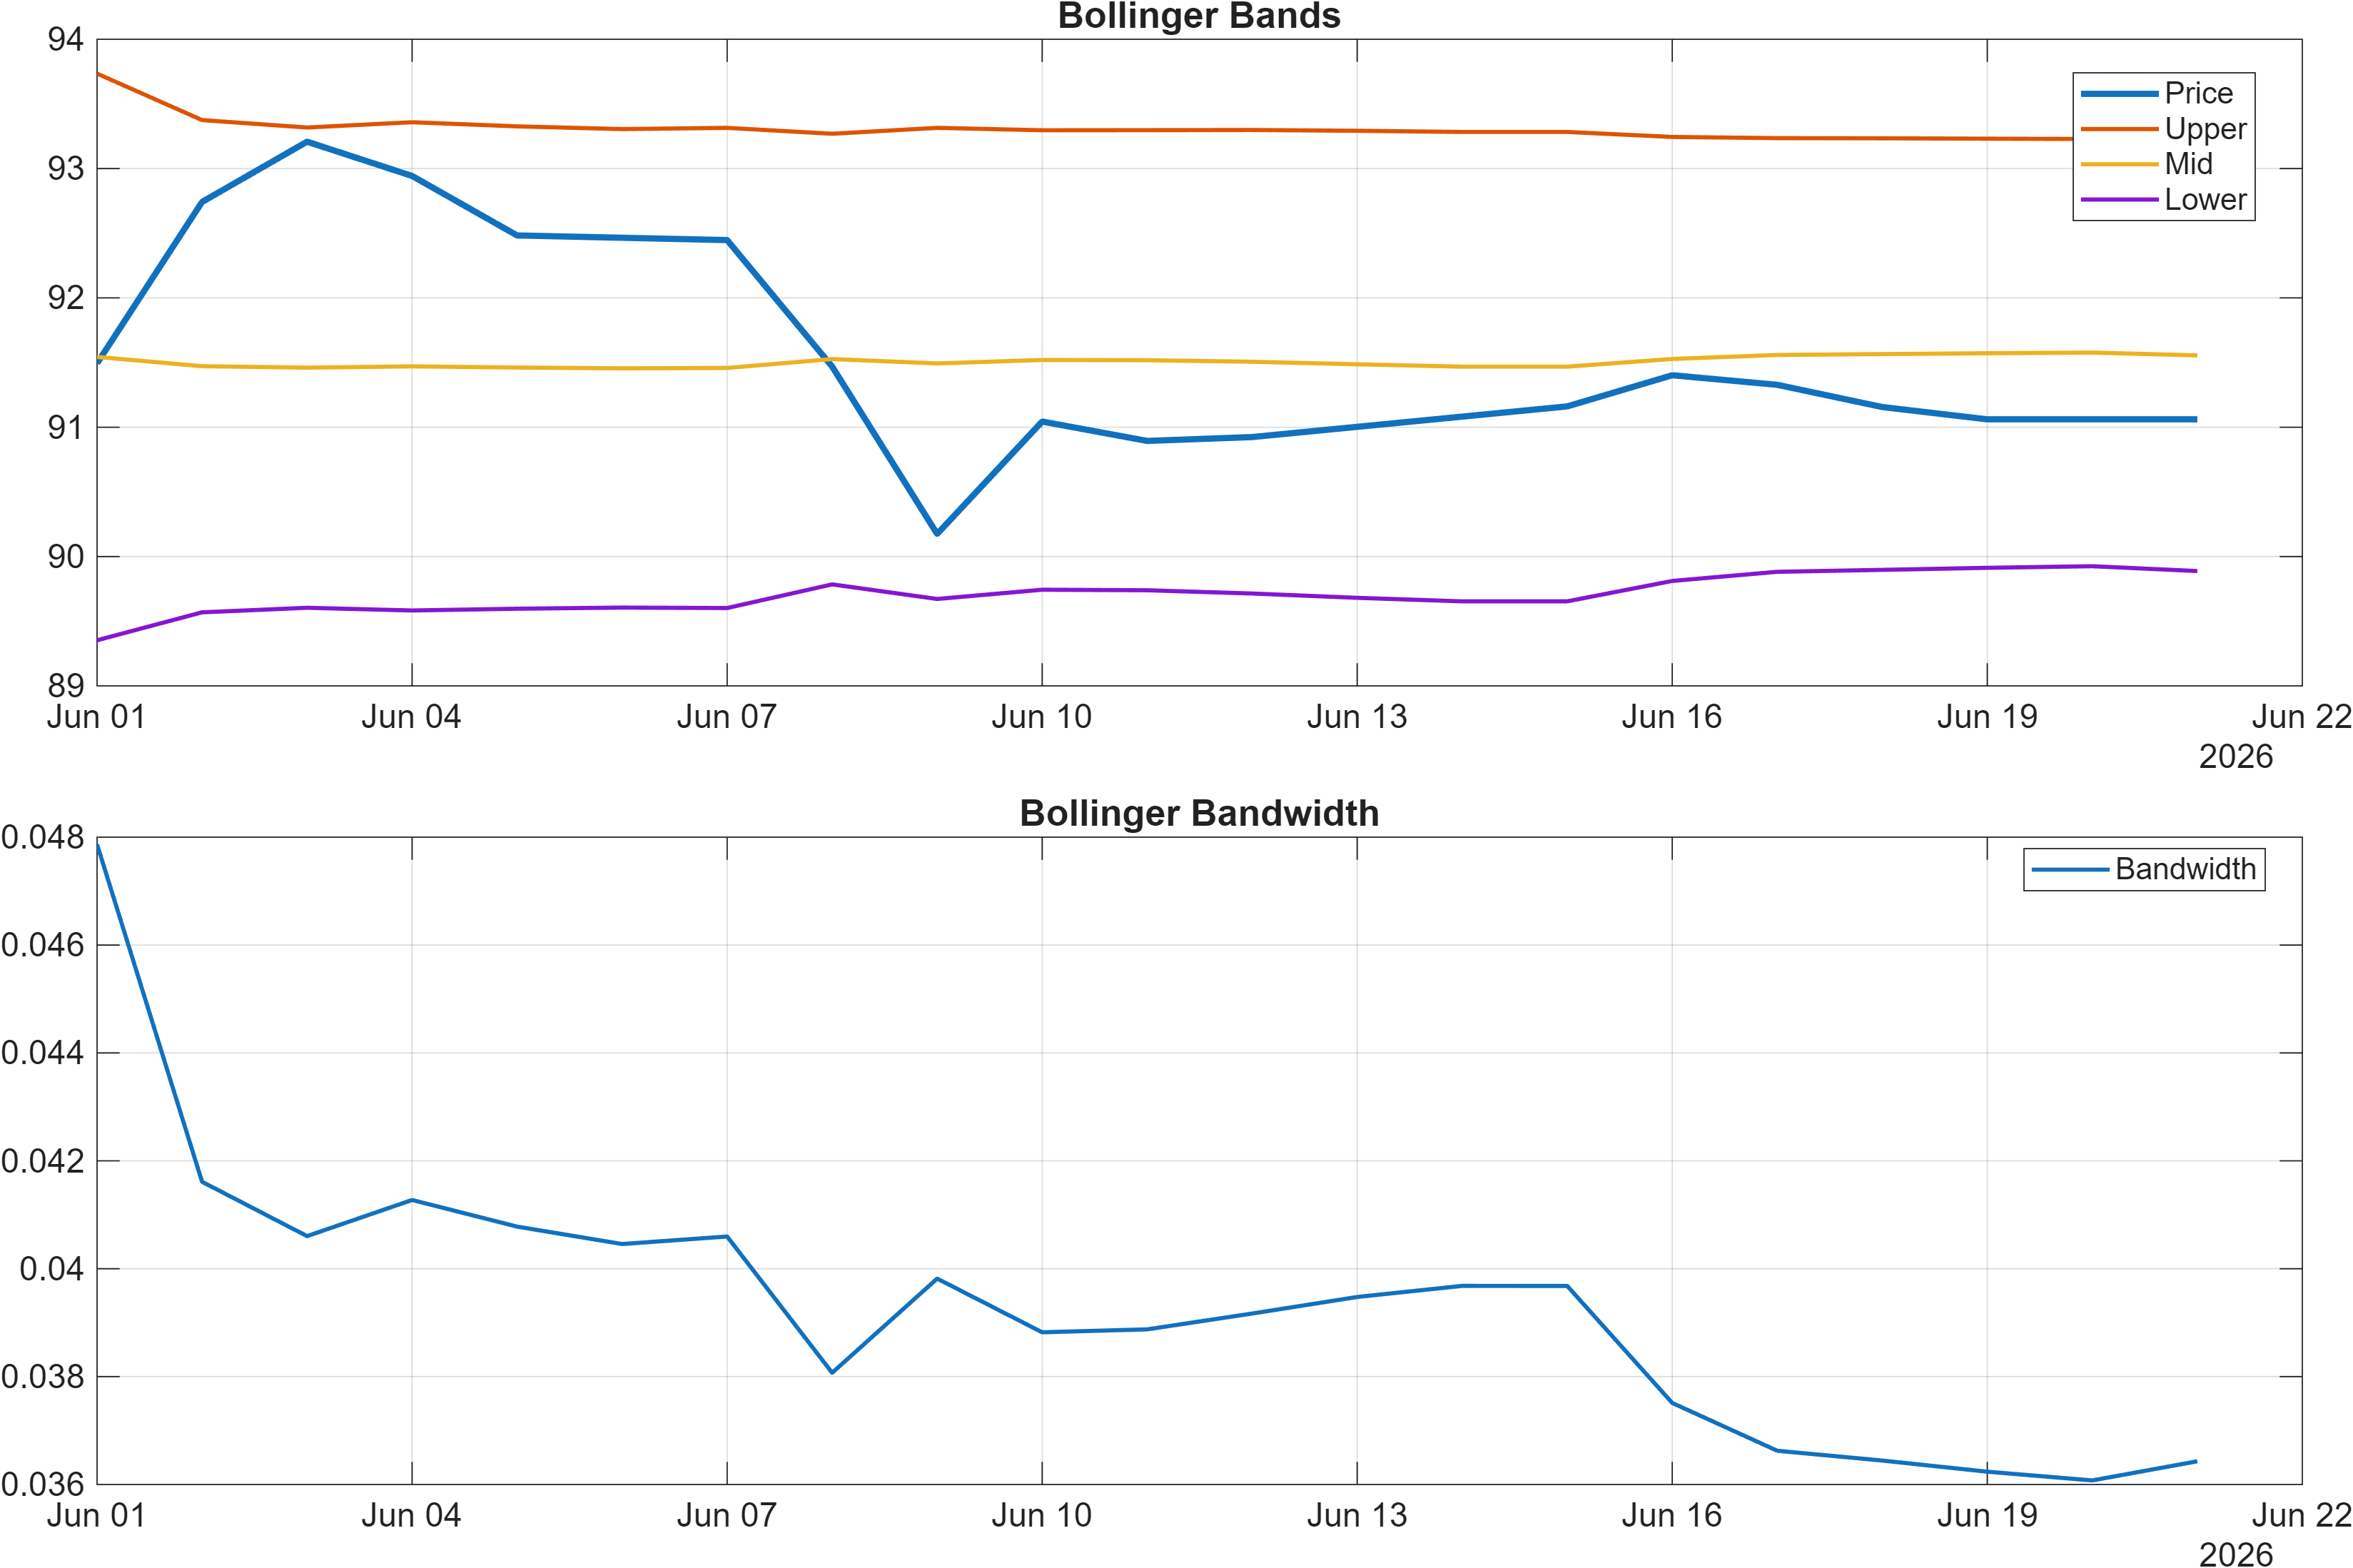
Interpretation: Bandwidth (volatility regime) latest = 0.0364.
4) Support / Resistance zones
Support ~ 89.8980 | Resistance ~ 96.5763
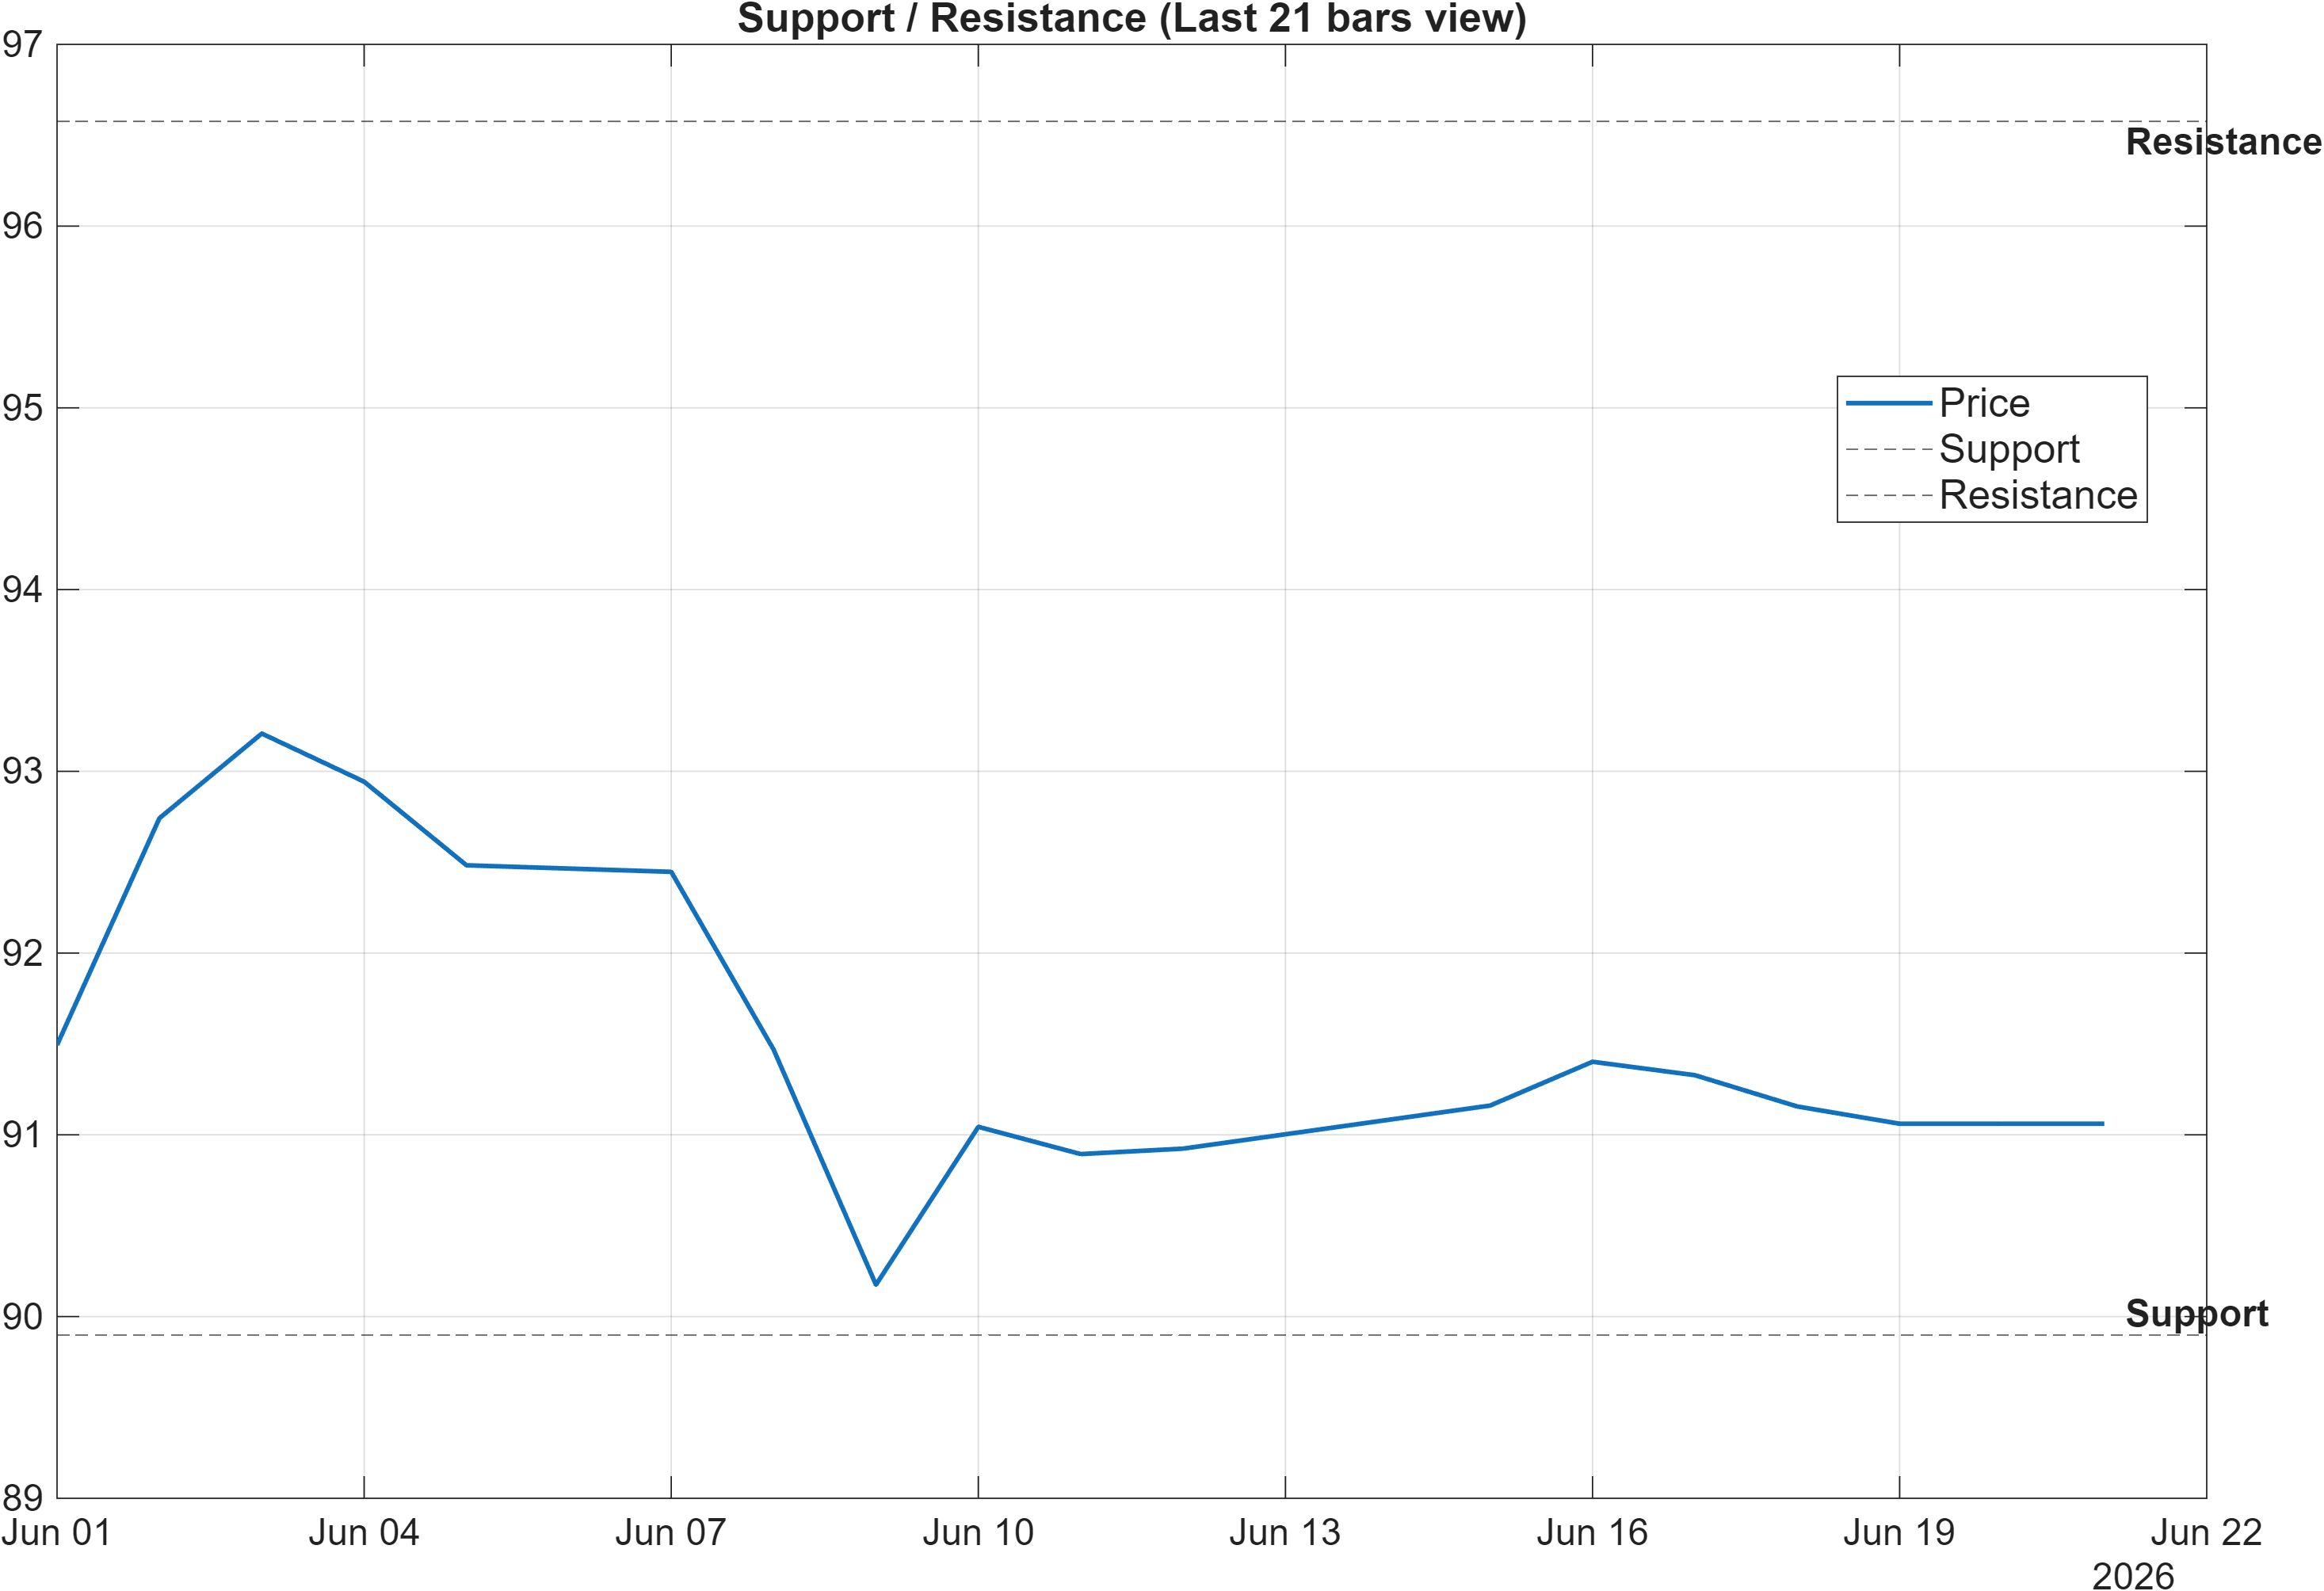
The current map is unusually clean: 89.8980 defines the downside decision zone and 96.5763 defines the upside decision zone. With volatility compressed (bandwidth 0.0364) and moving averages still bearish, these levels operate as the primary evidence gates for whether the cross is transitioning from consolidation into trend.
The signal table adds subtle context to the level framework. LLOW(20) at 89.52 sits close to the stated support area, reinforcing that the market is operating near a recent lower boundary rather than mid-range. On the upside, HHIGH(20) at 94.49 remains below resistance, implying that a move to 96.5763 would likely require incremental expansion beyond the most recent 20-period high range.
An additional nuance comes from the “location vs support” read: MedPx vs Support at 1.13 is labeled bullish, implying median price is still positioned above the support reference—constructive for stabilization as long as the floor holds. However, this is best treated as a conditional positive rather than a directional call, given the bearish MA structure and bearish RSI bias (33.26).
In this setup, follow-through is the differentiator: a sustained break above 96.5763 would be a structural confirmation event, while a close below 89.8980 would shift the balance toward deterioration consistent with the weaker short-horizon ranks (e.g., 3-Monthly #506).
Scenario view: Break above resistance with volume → continuation. Close below support → signal deterioration risk.
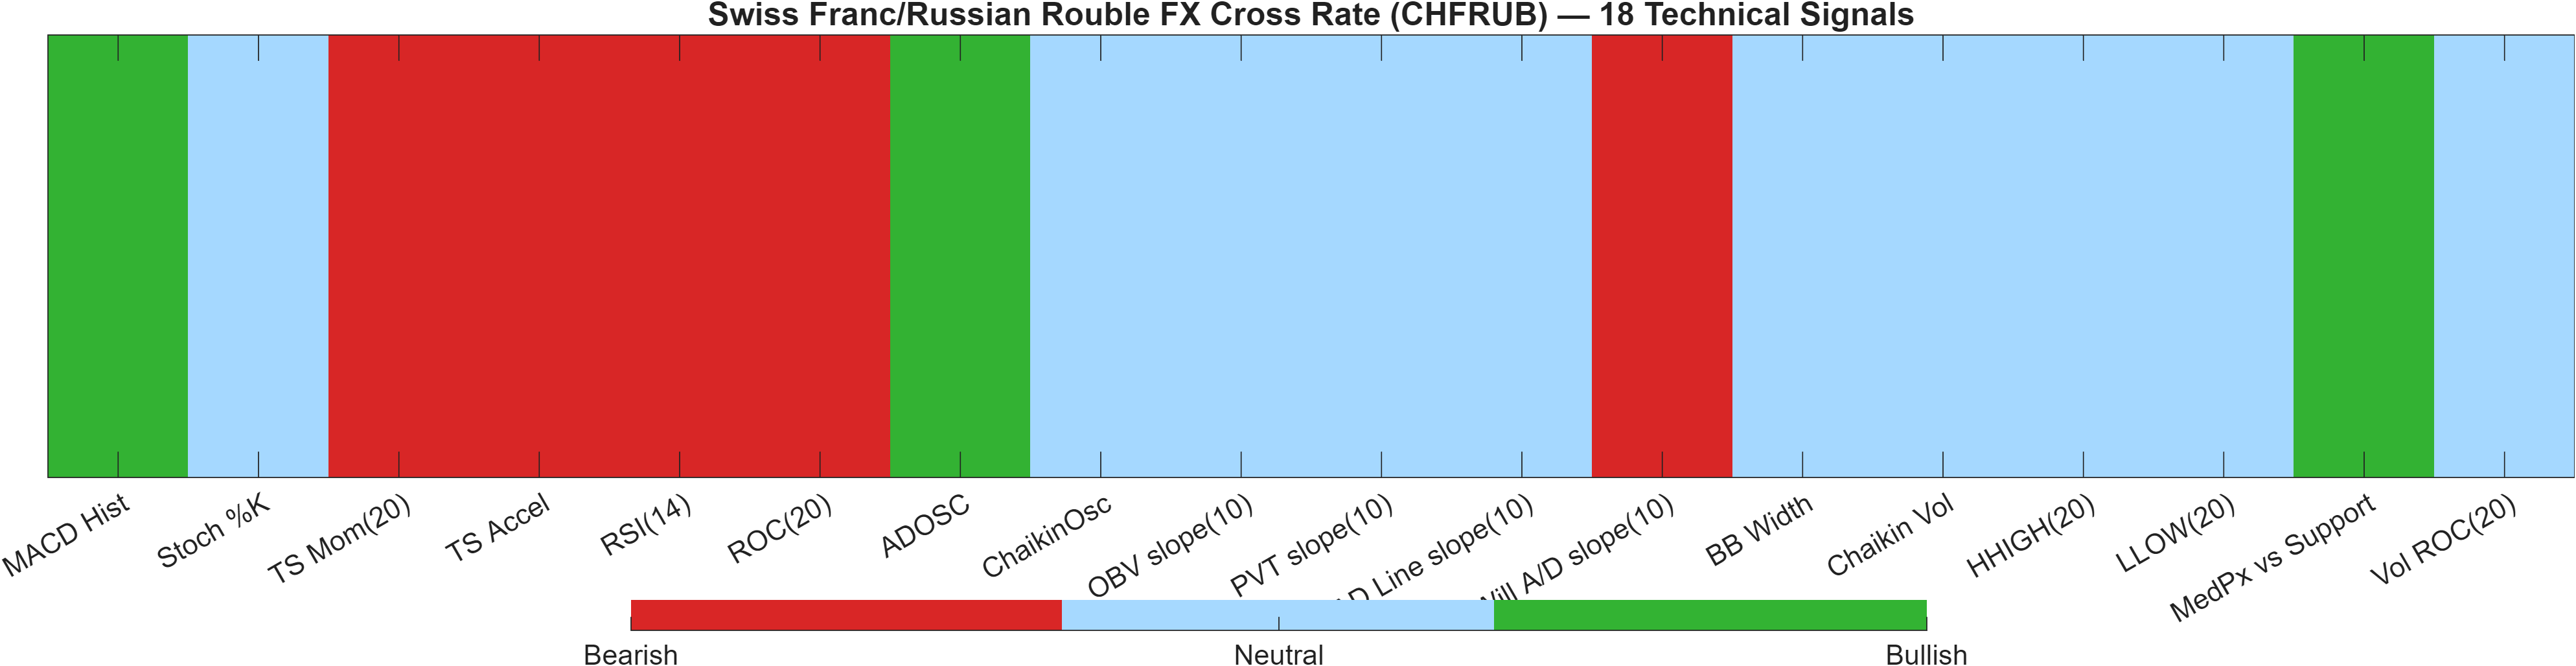
5) Quant Technical Dashboard (18 Signals)
KGNAI AI Technical Analysis Score (Deep Reinforcement Learning): Rank #144 out of 927 (Rank 1 represents the strongest technical positioning and a higher probability of favorable price behavior. As ranks increase toward the maximum, the probability of favorable outcomes weakens and bearish positioning becomes more dominant.) | Label: Bullish | Score: 0.689
18-Signal Technical Confluence Score: -0.111 (Neutral)
Overall Technical Score (18-signal confluence + DRL rank blend): 0.129 (Neutral)
Note: The blended score reflects signal strength weighted against broader AI technical ranking, which may temporarily diverge.
Blended technical score breakdown: 0.129 (Neutral | Bull 3 / Bear 5 / Neutral 10)
Signal alignment vs model ranking
The technical layer is best described as model-supported, signal-mixed. The Deep Reinforcement Learning technical rank is #144 out of 927 with a Bullish label and 0.689 score—an upper-quartile profile. Yet the discrete 18-signal confluence score is -0.111, and the blended overall technical score is 0.129, both Neutral.
That divergence matters because it indicates the AI ranking model is detecting favorable technical behavior patterns in a broader context, while the point-in-time indicator set is not fully confirming. The breakdown (Bull 3 / Bear 5 / Neutral 10) leans slightly bearish at the margin but is dominated by neutral readings—consistent with low bandwidth (0.0364) and an environment where signals can be slow to resolve.
A few indicator examples highlight why the blend lands neutral. MACD Hist 0.063 is bullish, while RSI(14) 33.26, TS Mom(20) -1.681, and ROC(20) -1.813 are bearish, pulling against each other. Meanwhile, several volume/flow slopes are neutral (zeros across OBV/PVT/AD line slope entries), suggesting participation confirmation is not decisive in either direction.
Signal table (Bull/Bear/Neutral)
| Indicator | Value | Signal |
|---|---|---|
| MACD Hist | 0.063 | Bullish |
| Stoch %K | 35.3 | Neutral |
| TS Mom(20) | -1.681 | Bearish |
| TS Accel | -0.992 | Bearish |
| RSI(14) | 33.26 | Bearish |
| ROC(20) | -1.813 | Bearish |
| ADOSC | 45.18 | Bullish |
| ChaikinOsc | 0 | Neutral |
| OBV slope(10) | 0 | Neutral |
| PVT slope(10) | 0 | Neutral |
| AD Line slope(10) | 0 | Neutral |
| Will A/D slope(10) | -0.55 | Bearish |
| BB Width | 0.03643 | Neutral |
| Chaikin Vol | -0.8923 | Neutral |
| HHIGH(20) | 94.49 | Neutral |
| LLOW(20) | 89.52 | Neutral |
| MedPx vs Support | 1.13 | Bullish |
| Vol ROC(20) | — | Neutral |
Interpretation: Indicator-level signals form the base confluence, which is then adjusted using a separate AI-driven technical ranking model. The final technical score summarizes this combined view.
6) News sentiment + extractive gist
Note: Instrument-specific news matches were not found, so the digest includes broader market/sector headlines. Links are provided for verification.
Sentiment score (avg): 0.050 | Positive: 19% | Neutral: 81% | Negative: 0%
KGNAI AI News Sentiment Score (normalized -1 to +1): Not available (as of —) | Label: Not available | Overall news score: 0.05
Positive Developments
Recent coverage across major financial outlets indicates a modestly constructive backdrop for risk-taking and certain commodity/FX narratives, though without a strong CHFRUB-specific catalyst. The provided sentiment mix is dominated by neutrality (81%), but the positive slice (19%) aligns with themes of shifting rate expectations and episodic rebounds in broader markets. In parallel, parts of the digest emphasize a firmer US dollar tone, which can matter for cross-currency behavior by influencing global funding and risk transmission channels. Oil pricing commentary near key levels is also presented in a way that suggests risk premia can reprice quickly after periods of stress—relevant for volatility expectations even when the immediate read is subdued. Overall, the positive tone is best interpreted as “supportive but not directive,” consistent with the aggregate sentiment score of 0.050 rather than a strongly directional bias.
Neutral / Mixed Developments
The neutral cluster in the digest centers on event-driven uncertainty and cross-asset correlations that are not consistently stable. Several items highlight that standard relationships (for example, between commodity price action and certain currencies) can decouple, which matters when assessing FX crosses during regime shifts. This maps to CHFRUB’s current technical state: a neutral blended technical score (0.129) alongside compressed volatility (bandwidth 0.0364) often coincides with headline-sensitive, range-bound trading. With no instrument-specific matches, the informational flow is better used as a context filter rather than a signal generator—helping explain why confirmation at 96.5763 or failure below 89.8980 could be more influential than incremental sentiment fluctuations.
Negative / Risk Signals
Risk-oriented coverage in the digest points to geopolitical and policy uncertainty that can trigger abrupt volatility, even when baseline sentiment readings appear calm. Such backdrops often compress implied volatility until a catalyst forces a repricing—an important consideration given the low Bandwidth reading (0.0364). For CHFRUB, that risk framing interacts with a technically fragile near-term setup (bearish close vs MA50; bearish MA50 vs MA200) and bearish momentum bias (RSI(14) 33.26). The practical takeaway is not that risks are “priced in,” but that the current structure can be more sensitive to shocks while the market sits between well-defined zones. Under this type of news regime, level breaks tend to matter more than incremental oscillator changes.
What to monitor next
- Whether price can reclaim and hold above resistance 96.5763 during a volatility expansion from the 0.0364 bandwidth regime.
- Whether support 89.8980 holds if risk headlines intensify and RSI remains suppressed near 33.26.
- Whether short-horizon ranks (Daily #384; 3-Monthly #506) begin converging toward the stronger long-horizon profile (Yearly #16).
Sources referenced: Reuters, Bloomberg, Yahoo Finance, MarketWatch, Investing.com
Snapshot: AI Rank (Short–Mid–Long): Mixed (Neutral–Neutral–Bullish) · Technical Confluence: Neutral · Key Levels: Support ~89.90 | Resistance ~96.58 · News Sentiment: Neutral
7) Sources
- Breaking: Iran closes the Strait of Hormuz amid ceasefire deal violation — https://www.fxstreet.com/news/breaking-iran-closes-the-strait-of-hormuz-amid-ceasefire-deal-violation-202606201419
- Brent at $80: Did the market buy the Iran deal twice? — https://www.fxstreet.com/news/brent-at-80-did-the-market-buy-the-iran-deal-twice-202606192209
- The Canadian Dollar ditches Crude Oil for Gold — https://www.fxstreet.com/news/the-canadian-dollar-ditches-crude-oil-for-gold-202606192203
- The Euro sinks on its own rate hike — https://www.fxstreet.com/news/the-euro-sinks-on-its-own-rate-hike-202606192201
- The Australian Dollar looks for an excuse to break ranks — https://www.fxstreet.com/news/the-australian-dollar-looks-for-an-excuse-to-break-ranks-202606192158
- Gold answers to the Fed, not the fear — https://www.fxstreet.com/news/gold-answers-to-the-fed-not-the-fear-202606192156
- The US Dollar remembers how to rally — https://www.fxstreet.com/news/the-us-dollar-remembers-how-to-rally-202606192154
- Forecasting the upcoming week: US Dollar loses momentum ahead of key US inflation data — https://www.fxstreet.com/news/forecasting-the-upcoming-week-us-dollar-loses-momentum-ahead-of-key-us-inflation-data-202606192043
You may also like: How KGNAI AI ranks instruments across global markets
Disclaimer: KGNAI provides AI-generated analytics and educational market commentary only. This is not financial advice. Markets involve risk. Always do your own research.