STRAX-USD (Stratis) Technical Analysis — Range-Bound to Weak Bias as of 07-Jun-2026
Stratis (STRAX-USD) currently presents a mixed-to-defensive configuration where longer-horizon relative strength in KGNAI ranks coexists with softer technical structure and subdued sentiment. Cross-sectional positioning shows a notable split: the 3-Monthly rank (#22 out of 800) sits in the upper tier, while the Weekly rank (#522) is closer to the lower portion of the universe, consistent with a market that has not fully rebuilt near-term momentum. On traditional trend reads, the moving-average regime remains bearish (close vs MA50 and MA50 vs MA200), while momentum remains pressured with RSI(14) at 35.46 and a slightly negative MACD histogram (-0.0004). Volatility is not signaling a clean expansion either, with Bollinger bandwidth at 0.5807, reinforcing a range/trend-transition backdrop. Key decision zones remain tight at support ~0.0111 and resistance ~0.0142, where confirmation from volume and breadth-sensitive signals becomes decisive.
- Rank stance: Short Neutral | Mid Neutral | Long Neutral, with a notable upside skew in the 3-Monthly rank (#22).
- Technical confluence: Bearish (18-signal confluence -0.556; overall technical score -0.498).
- Key levels: Support 0.0111 | Resistance 0.0142.
- News sentiment bias: Neutral (avg -0.046; normalized -0.03).
- Confirmation / invalidation: A break above 0.0142 with volume supports continuation; a close below 0.0111 elevates deterioration risk.
KGNAI evaluates assets using large cross-sectional datasets built from millions of structured data points. Inputs incorporate fundamental metrics, technical structures, and systematically processed news sentiment. Statistical models, machine learning, and AI frameworks are used to assess relative positioning, signal alignment, and probabilistic behavior across broad universes.
- Ranks are comparative across the tracked universe, not absolute price targets.
- Confluence reflects alignment among independent signal groups.
- Support/resistance levels are probabilistic decision zones, not guarantees.
- Sentiment provides contextual bias within the broader analytical framework.
KGNAI Signal + Technical Snapshot + News Sentiment Digest
As of: 07-Jun-2026
Ticker: STRAX-USD
1) KGNAI AI Analysis
Region: CRYPTO
Total universe size: 800 ranked instruments
- Daily rank: #101 out of 800 — Bullish
- Weekly rank: #522 out of 800 — Neutral
- Monthly rank: #171 out of 800 — Neutral
- 3-Monthly rank: #22 out of 800 — Bullish
Cross-horizon ranking dispersion is the defining feature. The Daily rank (#101) sits near the upper end of the top decile, signaling a near-term relative improvement versus most of the 800-instrument universe. In contrast, the Weekly rank (#522) falls into a weaker slice of the distribution, which is consistent with recent price behavior struggling to convert into persistent trend strength.
The intermediate horizon is less extreme: the Monthly rank (#171) aligns with a middle-to-upper quartile profile, while the 3-Monthly rank (#22) stands out as a high-conviction relative strength reading. In practical market-structure terms, this type of configuration often reflects mean-reversion pressure at short horizons coexisting with structural recovery attempts over longer windows.
The stated term view remains Neutral across short-, mid-, and long-term, which is coherent with the mixed ranking regime rather than a single dominant trend. For readers, the analytical implication is that STRAX-USD is not currently a “one-timeframe” instrument: confirmation requires alignment between the shorter horizon (daily) improvement and the weaker weekly context. Absent that alignment, the 3-month strength can remain latent while price continues to oscillate.
Want the full universe and complete rank tables? Unlock full access on KGNAI: https://www.kgnai.com/pricing
2) Price & trend overview
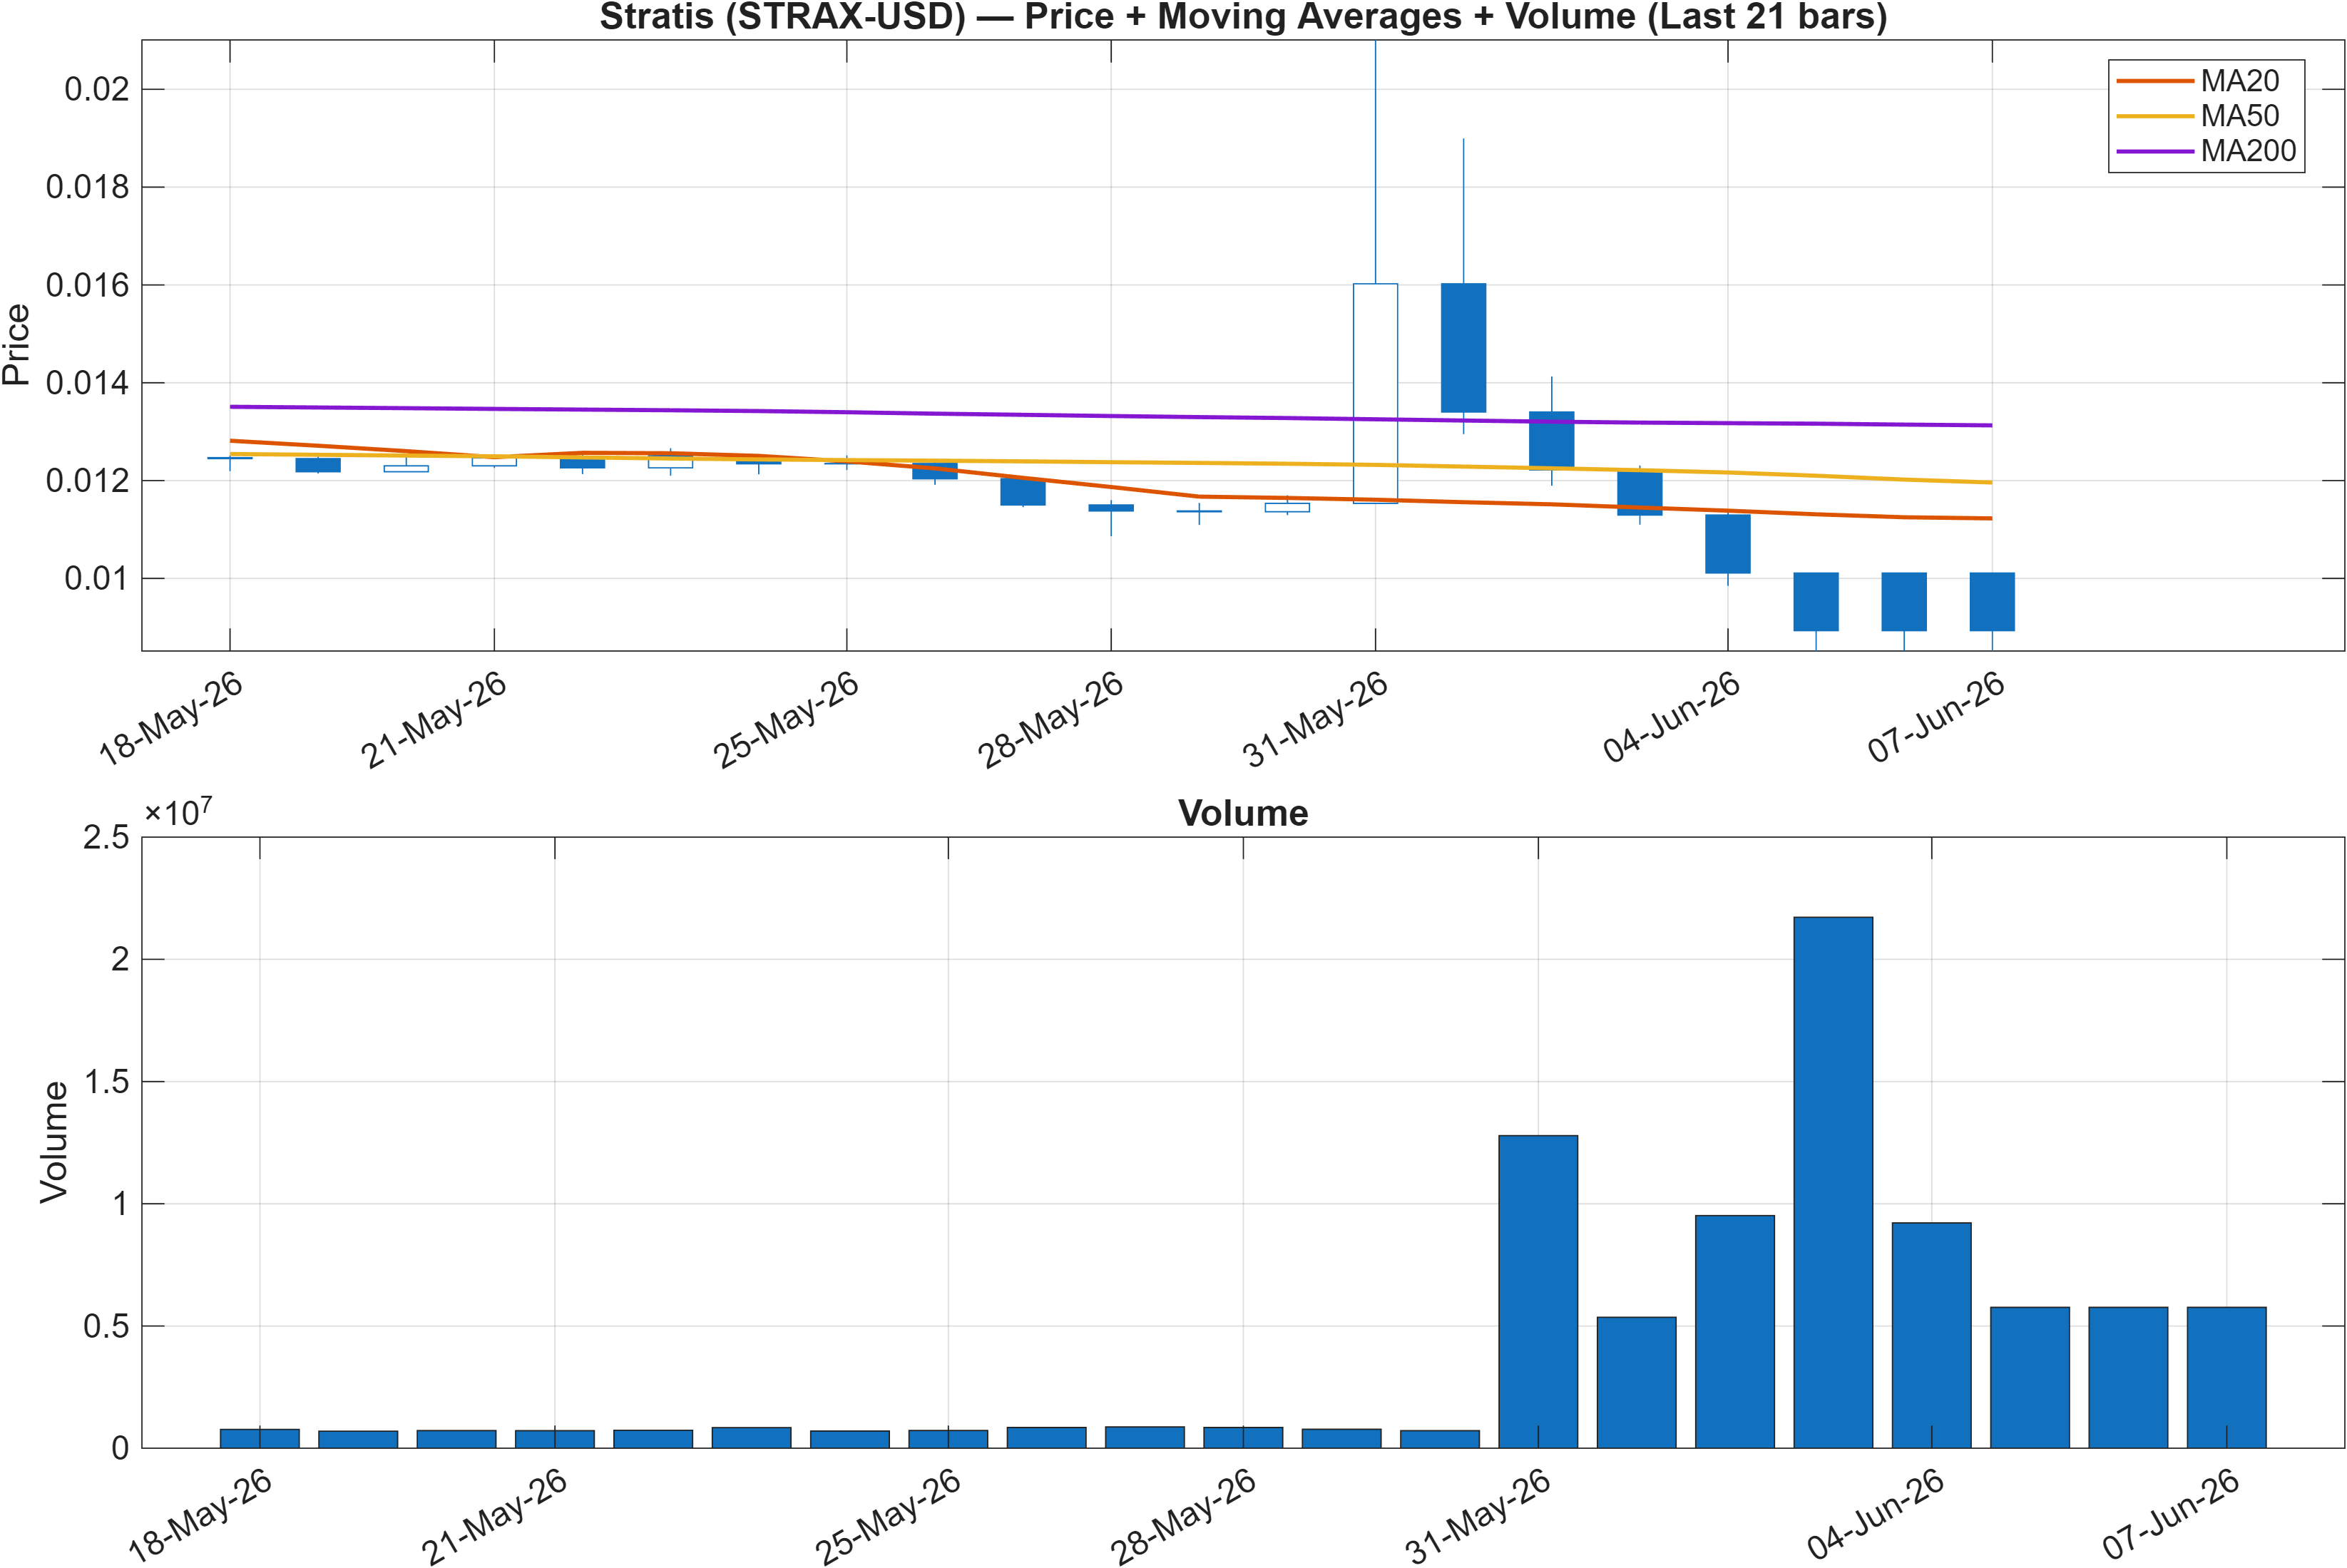
The trend stack remains defensive: close vs MA50 = Bearish and MA50 vs MA200 = Bearish. That combination typically describes a market still trading beneath intermediate trend control, with the longer moving average acting as an overhead anchor. Importantly, this does not force a “straight-down” narrative; it instead frames rallies as needing additional proof through sustained closes and participation.
The nearby map of decision zones reinforces the range framing. With support ~0.0111 and resistance ~0.0142, STRAX-USD is operating in a tight corridor where trend indicators can stay bearish even as price attempts to stabilize. When MA regimes are bearish, resistance zones tend to behave “stickier,” meaning upside attempts can stall unless the move is accompanied by a clear improvement in participation measures.
The cross-timeframe rank split supports the same conclusion. A Daily rank of #101 suggests improving behavior relative to peers, but the Weekly rank of #522 argues that the broader market still prices STRAX-USD as lagging on a swing basis. The market-structure read is therefore best expressed as range-bound with a weak trend bias until price either reclaims the trend stack or decisively loses support.
3) Momentum & volatility dashboard
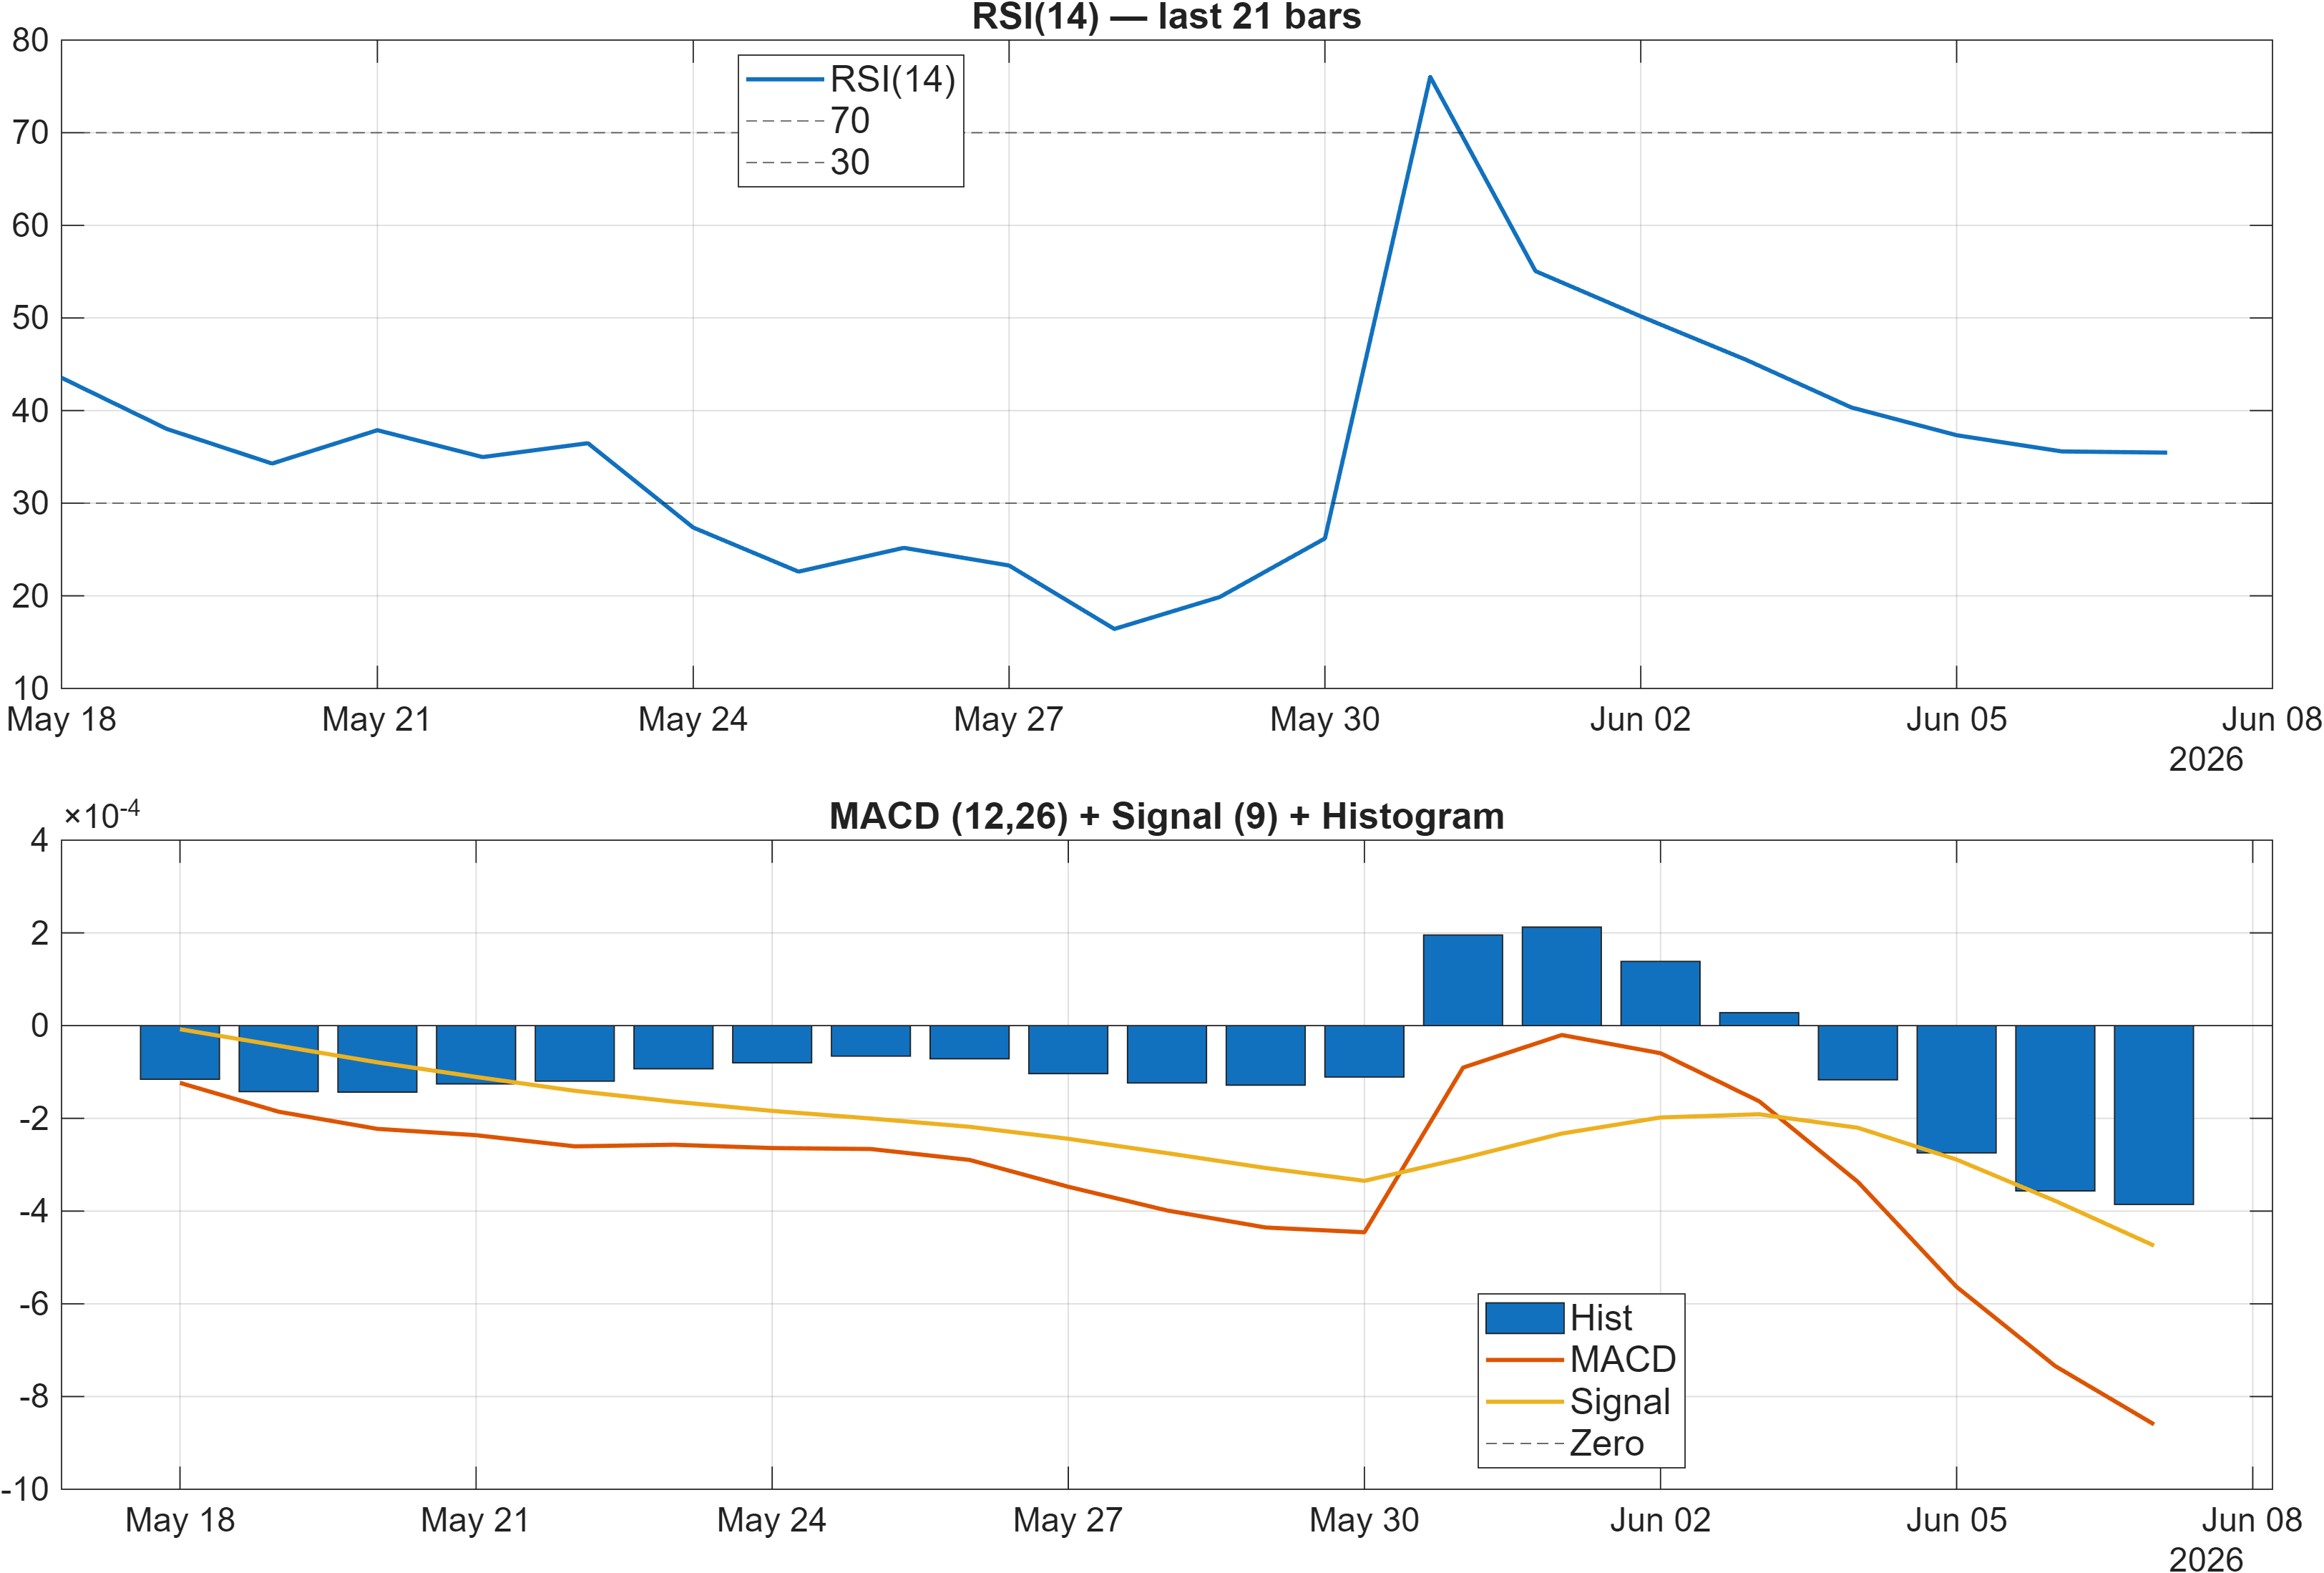
Momentum readings skew cautious. RSI(14) at 35.46 sits below the common midline and is tagged as a Bearish bias, indicating that upside follow-through has been insufficient to reset momentum. At the same time, the MACD histogram remains slightly negative (-0.0004), pointing to a market where momentum is not yet accelerating upward on a smoothed basis.
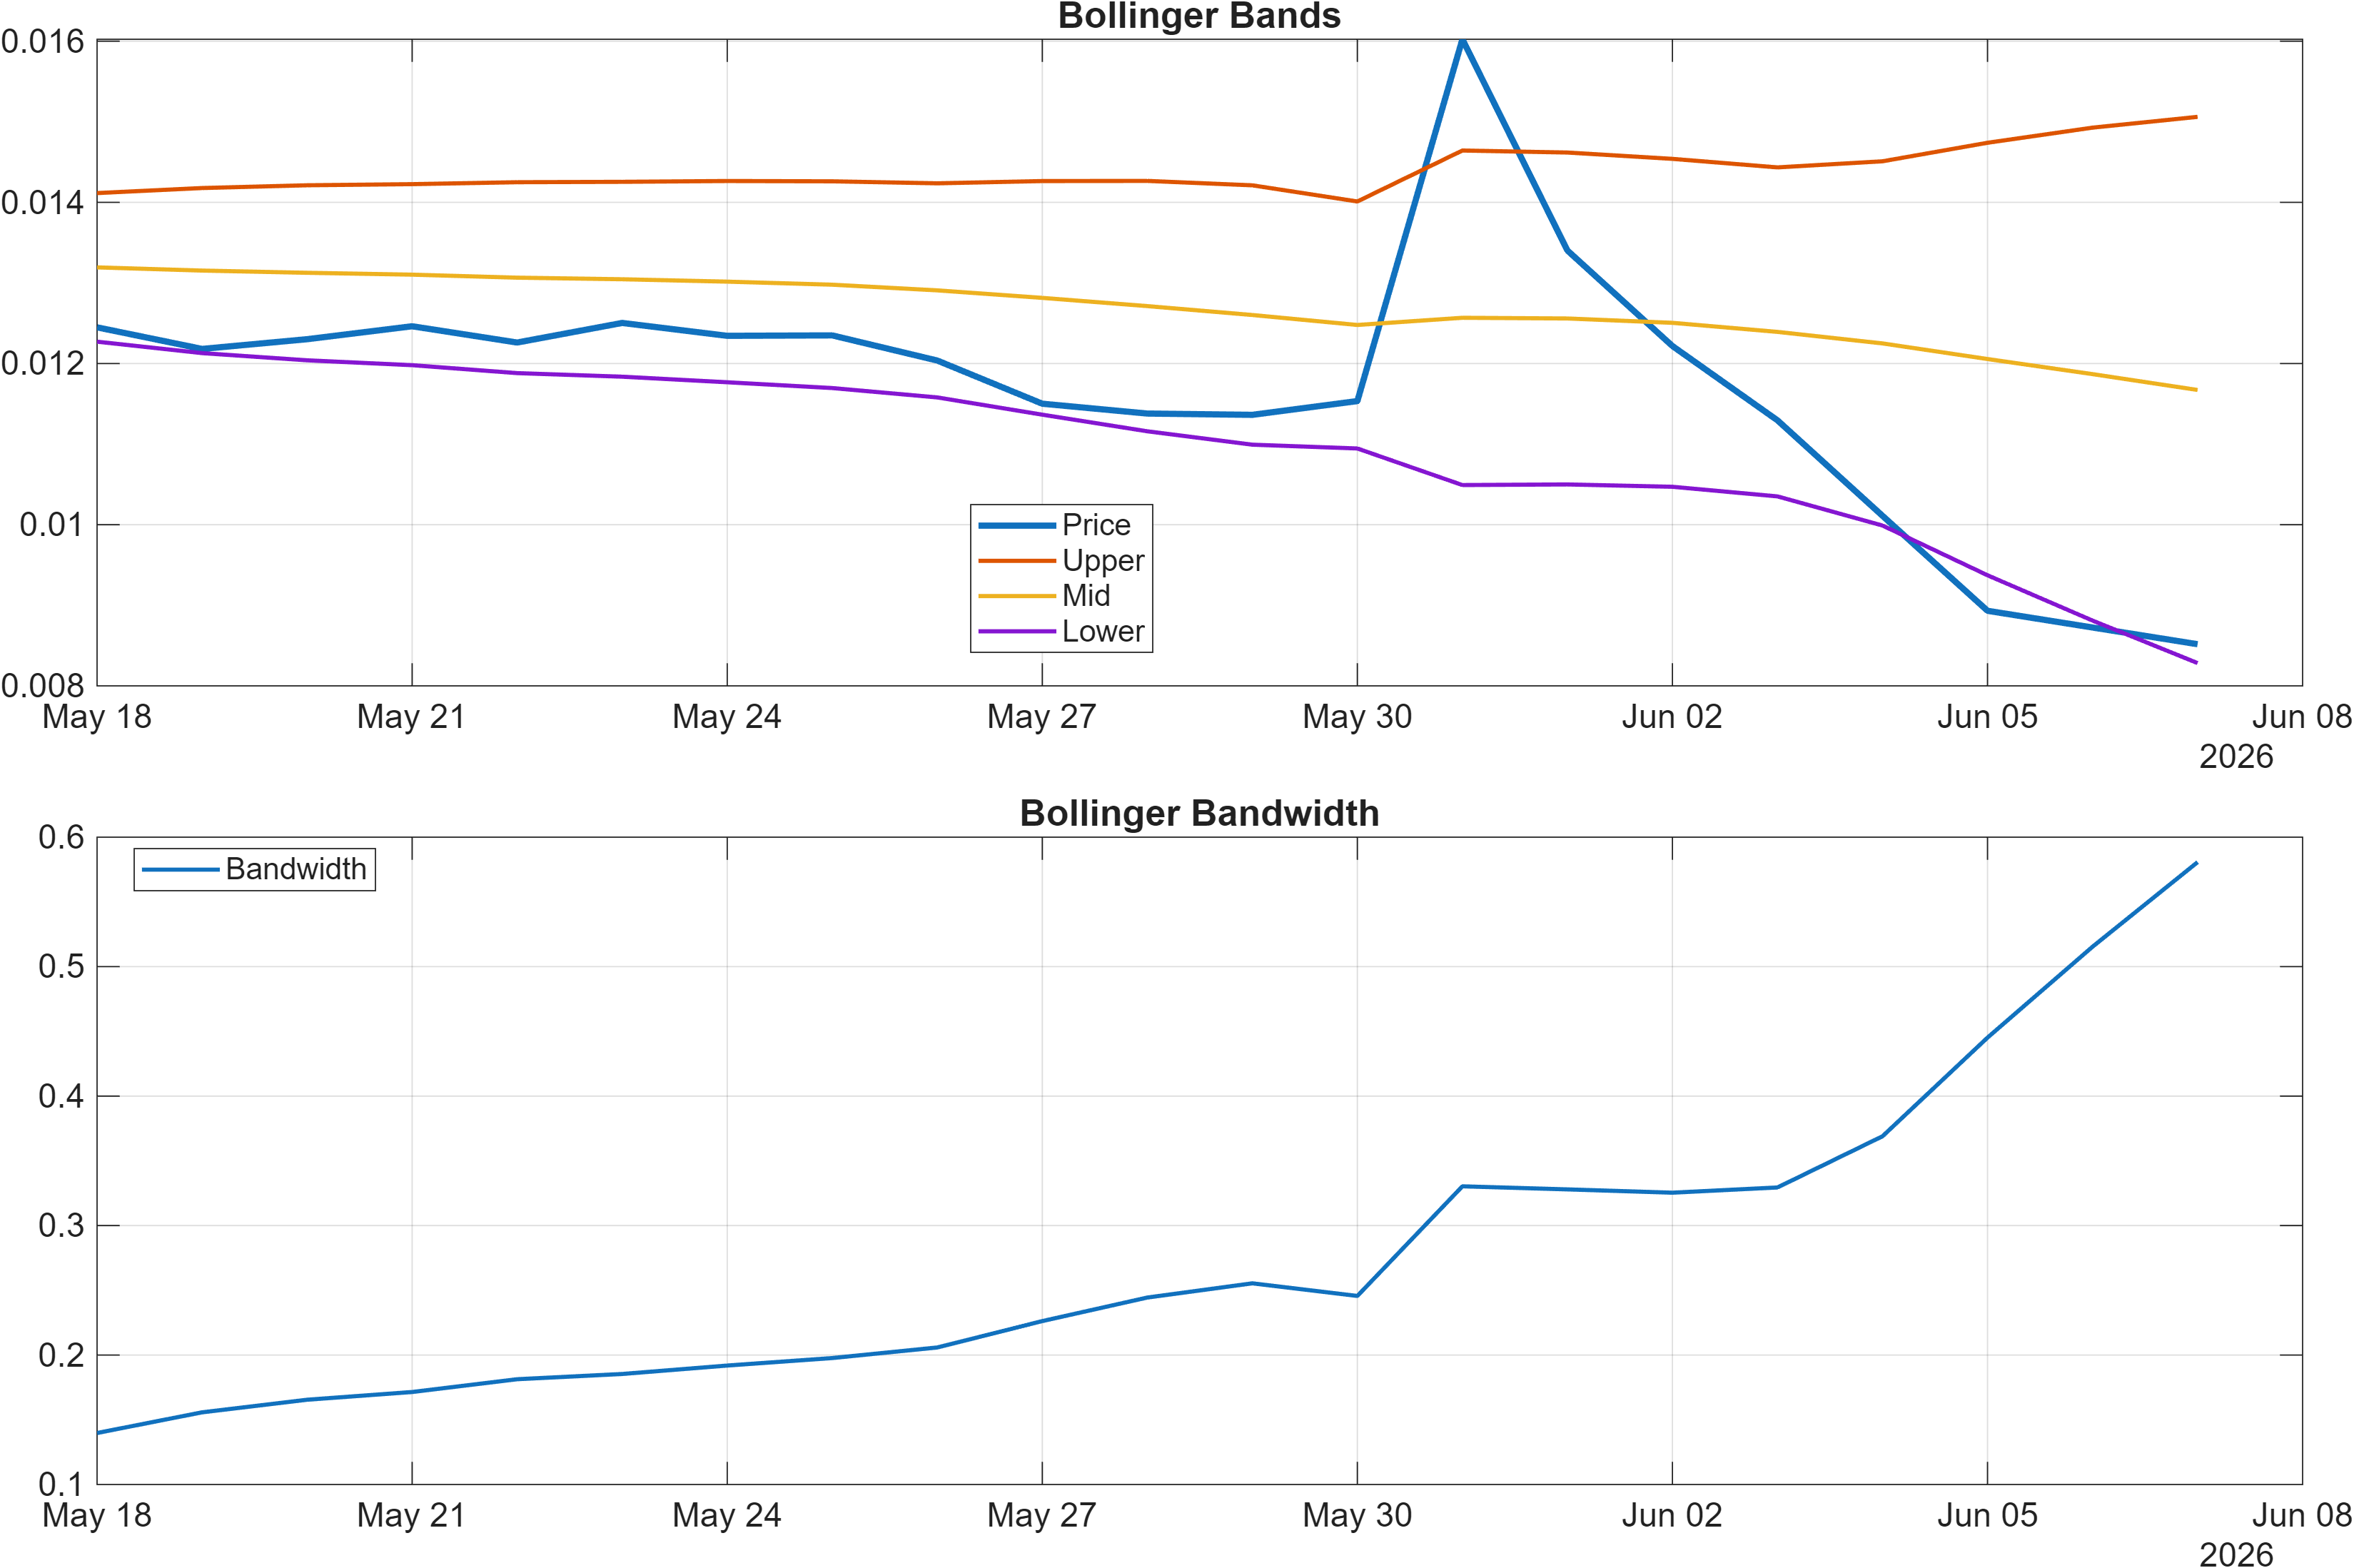
Volatility conditions are not yet offering a clean “breakout regime” signal. Bollinger bandwidth is 0.5807, which matters less as an absolute number and more as a regime marker: it suggests volatility is present but not clearly transitioning into a persistent expansion that would typically accompany durable directional moves. In range contexts, RSI can remain depressed and MACD can remain negative while price oscillates, especially if participation fails to confirm.
Taken together, the dashboard implies momentum compression with negative tilt: downside pressure is visible, yet the data does not show an unequivocal volatility expansion that would validate a strong impulse leg. For STRAX-USD, that mix tends to elevate the importance of the nearby levels (0.0111 and 0.0142) as the practical “decision rails,” rather than attempting to infer direction from a single oscillator print.
4) Support / Resistance zones
Support ~ 0.0111 | Resistance ~ 0.0142
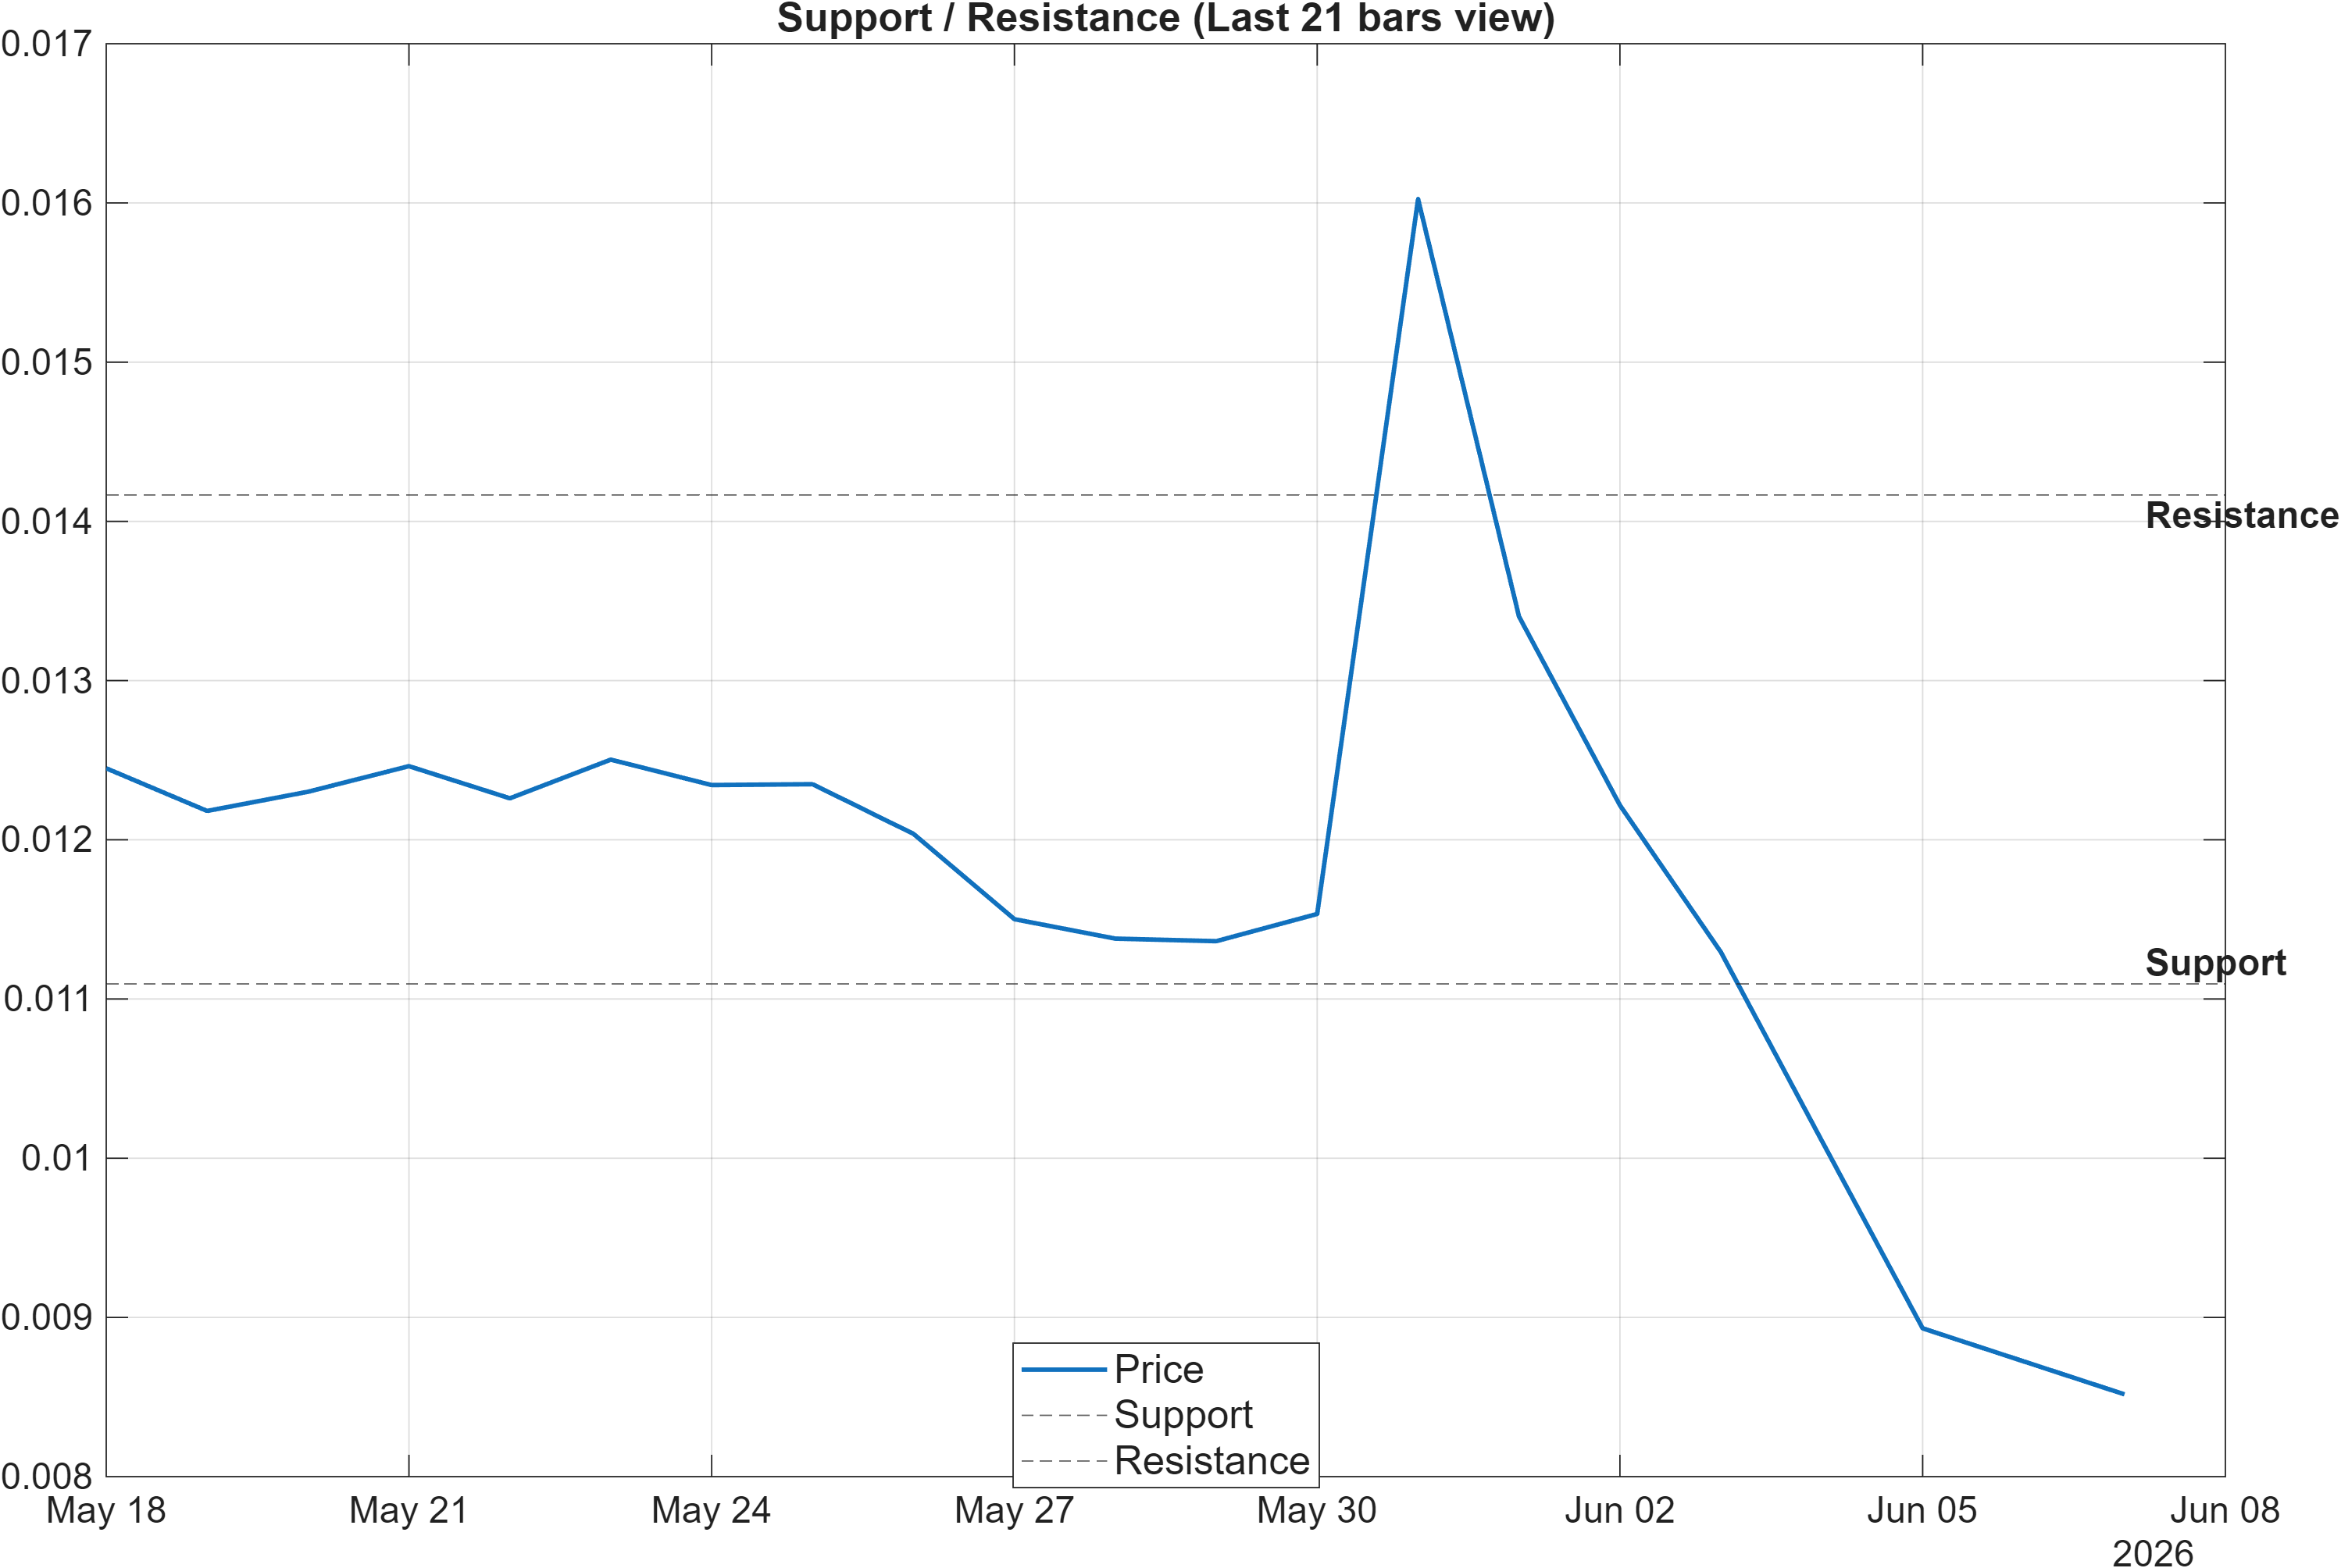
STRAX-USD is trading in a well-defined tactical box bounded by 0.0111 (support) and 0.0142 (resistance). With the broader trend structure still bearish (MA regime) and momentum soft (RSI 35.46), these zones become the primary probabilistic decision points for both continuation and deterioration scenarios.
The scenario logic embedded in the snapshot is straightforward but informative: a break above resistance with volume is treated as continuation, while a close below support raises signal-deterioration risk. This is especially relevant because the indicator stack contains a high proportion of bearish signals in the confluence set (see Section 5), meaning that upside attempts may require stronger confirmation than usual to overcome the prevailing negative skew.
The ranking dispersion also interacts with these levels. The Daily rank (#101) suggests near-term behavior has improved relative to the universe, which can support resistance tests. However, the Weekly rank (#522) warns that failed breakouts are still plausible within the broader swing context. In range-dominant regimes, a common failure mode is repeated “probing” of resistance without sustained acceptance; conversely, repeated holds above support can gradually reduce downside convexity even if the MA stack remains bearish.
5) Quant Technical Dashboard (18 Signals)
KGNAI AI Technical Analysis Score (Deep Reinforcement Learning): Rank #546 out of 800 (Rank 1 represents the strongest technical positioning and a higher probability of favorable price behavior. As ranks increase toward the maximum, the probability of favorable outcomes weakens and bearish positioning becomes more dominant.) | Label: Neutral | Score: -0.365
18-Signal Technical Confluence Score: -0.556 (Bearish)
Overall Technical Score (18-signal confluence + DRL rank blend): -0.498 (Bearish)
Note: The blended score reflects signal strength weighted against broader AI technical ranking, which may temporarily diverge.
Blended technical score breakdown: -0.498 (Bearish | Bull 3 / Bear 13 / Neutral 2)
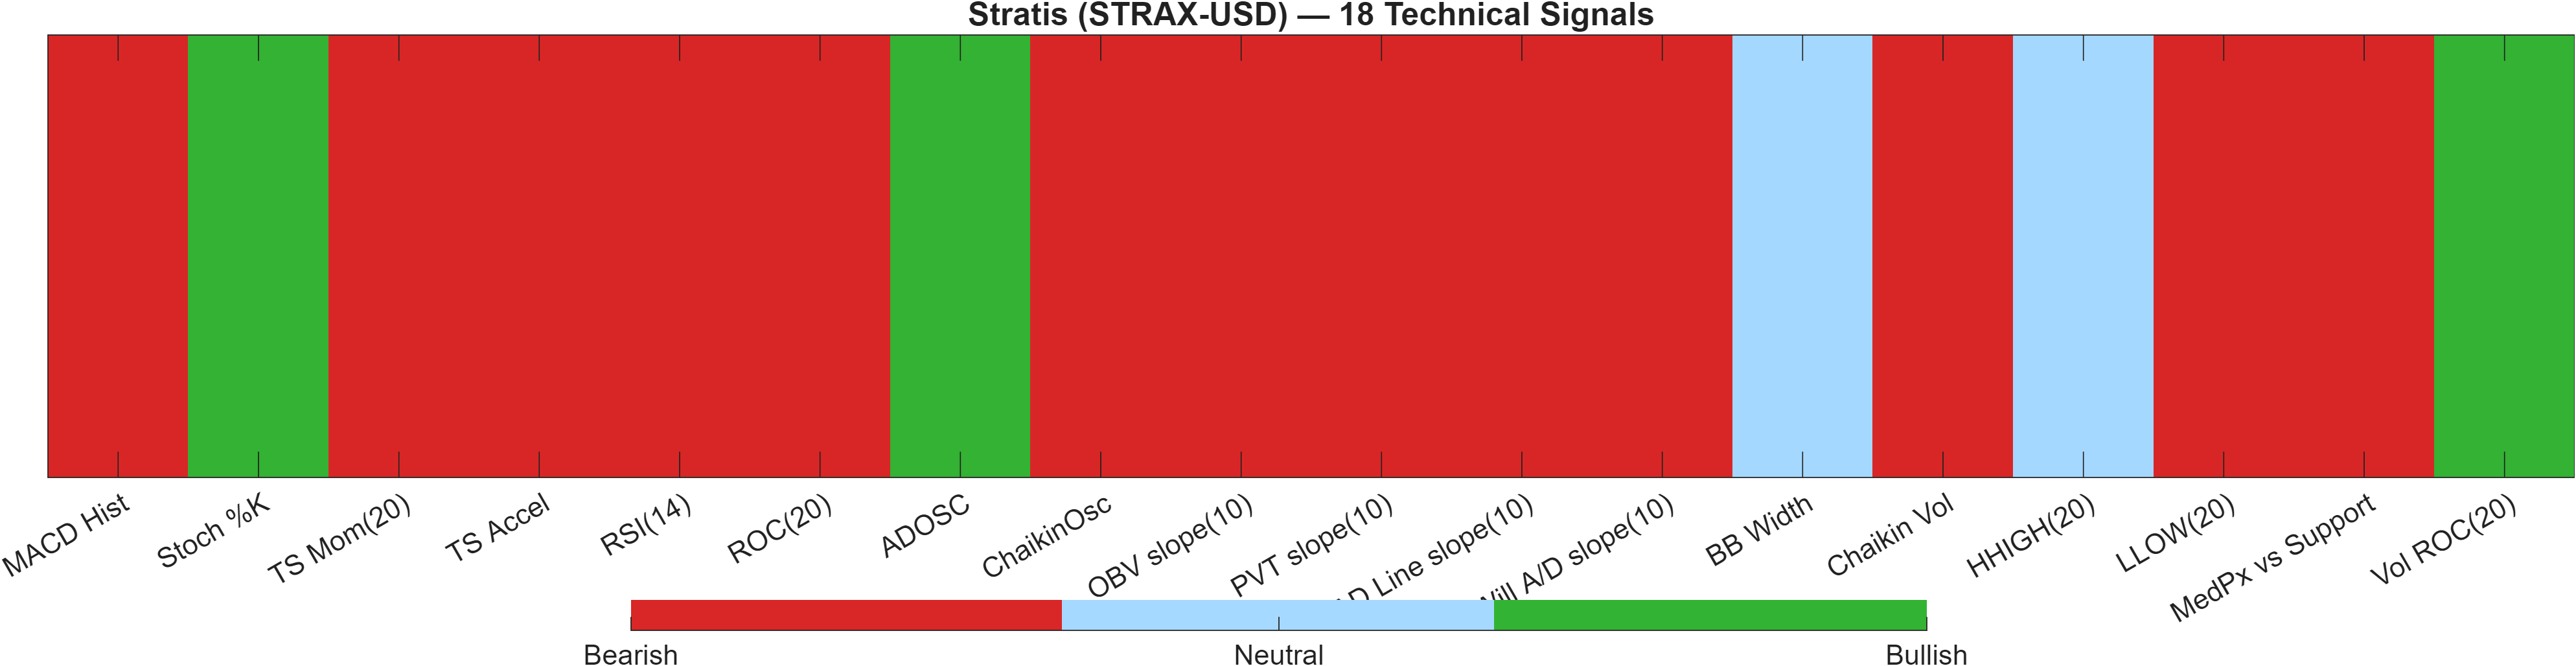
Signal table (Bull/Bear/Neutral)
| Indicator | Value | Signal |
|---|---|---|
| MACD Hist | -0.0003856 | Bearish |
| Stoch %K | 3.331 | Bullish |
| TS Mom(20) | -0.00325 | Bearish |
| TS Accel | -0.00258 | Bearish |
| RSI(14) | 35.46 | Bearish |
| ROC(20) | -30.08 | Bearish |
| ADOSC | 13.05 | Bullish |
| ChaikinOsc | -1.357e+07 | Bearish |
| OBV slope(10) | -3.885e+07 | Bearish |
| PVT slope(10) | -8488 | Bearish |
| AD Line slope(10) | -4.058e+07 | Bearish |
| Will A/D slope(10) | -0.006378 | Bearish |
| BB Width | 0.5807 | Neutral |
| Chaikin Vol | 295.7 | Bearish |
| HHIGH(20) | 0.02101 | Neutral |
| LLOW(20) | 0.008515 | Bearish |
| MedPx vs Support | -0.001782 | Bearish |
| Vol ROC(20) | 727.4 | Bullish |
The quant dashboard is dominated by bearish breadth: the blended breakdown shows Bear 13 against Bull 3 with Neutral 2, producing an 18-signal confluence score of -0.556 and an overall technical score of -0.498, both tagged Bearish. This is consistent with the macro read from trend and momentum sections: the current state is not a single-indicator anomaly; it is a clustered skew.
A notable nuance is the separate AI technical model: the DRL technical rank is #546 out of 800 with a score of -0.365 and a Neutral label. That relative neutrality versus the more bearish confluence suggests the model blend is detecting conditions consistent with stabilization attempts, even though the indicator stack has not broadly turned.
Inside the indicators, the tension between short-term bounce potential and broader weakness is visible: Stoch %K at 3.331 is bullish (often consistent with short-term oversold behavior), while RSI(14) at 35.46, ROC(20) at -30.08, and the negative MACD histogram argue that the impulse backdrop remains weak. For a cleaner improvement in regime, the confluence would typically need bearish participation signals to stop dominating while price holds above the 0.0111 support zone.
6) News sentiment + extractive gist
Note: Instrument-specific news matches were not found, so the digest includes broader market/sector headlines. Links are provided for verification.
Sentiment score (avg): -0.046 | Positive: 12% | Neutral: 56% | Negative: 31%
KGNAI AI News Sentiment Score (normalized -1 to +1): -0.03 (as of 2026-06-01) | Label: Neutral | Overall news score: 0.03
Positive Developments
Recent coverage across major financial outlets indicates a modest constructive undertone driven mainly by broader crypto market narratives rather than STRAX-specific catalysts. Discussion has included risk-asset positioning around AI-related spending themes and the ways liquidity expectations can influence crypto beta, which can support intermittent relief rallies even when individual tokens remain technically heavy. Another constructive element is the persistence of “oversold” framing in large-cap crypto commentary, which can improve short-horizon sentiment conditions and encourage tactical dip-buying behavior. In this context, STRAX-USD’s Daily rank (#101) fits the idea of near-term stabilization attempts, even while the broader technical confluence remains bearish. Net: the positive stream is best read as macro-constructive optionality rather than a direct catalyst, and it does not override the importance of technical confirmation at 0.0142 resistance.
Neutral / Mixed Developments
The dominant tone is still mixed, with a high share of neutral coverage consistent with the sentiment distribution (56% neutral) and the overall label staying Neutral. Several items are informational and sector-wide—touching payments, stablecoin usage, and market infrastructure—without creating a direct impulse for STRAX-USD. This matters because, in the absence of token-specific news flow, price action tends to be dominated by technical structure (MA regime) and liquidity conditions. With the normalized sentiment score at -0.03 and avg at -0.046, the market backdrop reads as slightly cautious but not one-directional.
Negative / Risk Signals
Risk signaling in recent coverage clusters around two areas: (1) macro sensitivity to data that can shift rate expectations, and (2) regulatory or compliance-related headlines affecting parts of the crypto ecosystem. These themes can tighten risk appetite and amplify downside reactions, especially when an asset’s indicator stack is already skewed bearish. For STRAX-USD, that interaction is visible in the technical configuration: bearish moving-average alignment plus bearish confluence (-0.498 overall technical score) can make the market less tolerant of negative macro or regulatory surprises. With 31% negative sentiment share, the tone is not extreme, but it is sufficient to keep rallies vulnerable to failure near resistance and to keep 0.0111 support as the immediate risk boundary.
- Whether price acceptance improves above 0.0142 alongside participation-sensitive measures.
- Whether momentum stabilizes as RSI holds and begins to recover from 35.46 while MACD histogram reduces negativity.
- Whether downside probes hold 0.0111 as sector-wide risk sentiment shifts.
Sources referenced: Reuters, Bloomberg, Yahoo Finance, MarketWatch, Investing.com
Snapshot: AI Rank (Short–Mid–Long): Neutral (Neutral–Neutral–Neutral) · Technical Confluence: Bearish · Key Levels: Support ~0.01 | Resistance ~0.01 · News Sentiment: Neutral
7) Sources
- Bitcoin most oversold since 2020 crash: Can BTC rebound to $70K next? — https://cointelegraph.com/markets/bitcoin-most-oversold-since-2020-crash-can-btc-rebound-to-70k-next?utm_source=rss_feed&utm_medium=rss&utm_campaign=rss_partner_inbound
- ETH falls to 13-month low on Zcash bug news and Bitcoin drop to sub-$60K: Is $1.4K next? — https://cointelegraph.com/markets/eth-falls-to-13-month-low-on-zcash-bug-news-and-bitcoin-drop-to-sub-60k-is-14k-next?utm_source=rss_feed&utm_medium=rss&utm_campaign=rss_partner_inbound
- Travala lets AI agents book hotels with USDC on Base — https://cointelegraph.com/news/travala-ai-agents-book-hotels-usdc-base?utm_source=rss_feed&utm_medium=rss&utm_campaign=rss_partner_inbound
- Crypto tax proposals weighed ahead of Tuesday House hearing — https://cointelegraph.com/news/crypto-tax-bills-house-ways-means-hearing?utm_source=rss_feed&utm_medium=rss&utm_campaign=rss_partner_inbound
- Bitcoin bears face $2.6B trap as BTC funding rate drops: Is a short squeeze brewing? — https://cointelegraph.com/markets/bitcoin-bears-face-26b-trap-as-btc-funding-rate-drops-is-a-short-squeeze-brewing?utm_source=rss_feed&utm_medium=rss&utm_campaign=rss_partner_inbound
- Kraken offers SpaceX IPO access through xStocks — https://cointelegraph.com/news/kraken-offers-spacex-ipo-access-through-xstocks?utm_source=rss_feed&utm_medium=rss&utm_campaign=rss_partner_inbound
- Crypto tax in Illinois FY2027 budget is one step away from becoming law — https://cointelegraph.com/news/cryptocurrency-tax-illinois-fy2027-budget-law?utm_source=rss_feed&utm_medium=rss&utm_campaign=rss_partner_inbound
- Crypto Biz: Nobody told Saylor ‘never sell’ — https://cointelegraph.com/news/strategy-bitcoin-sale-clarity-act-jpmorgan-capital-b-fundraising?utm_source=rss_feed&utm_medium=rss&utm_campaign=rss_partner_inbound
You may also like: How KGNAI AI ranks instruments across global markets
Disclaimer: KGNAI provides AI-generated analytics and educational market commentary only. This is not financial advice. Markets involve risk. Always do your own research.