ACX22620-USD (Across Protocol USD) Technical Outlook — 21-Jun-2026 | Constructive Ranks, Neutral Confluence
Across Protocol USD (ACX22620-USD) screens with consistently strong cross-horizon KGNAI ranks inside a 800-instrument crypto universe, while the technical confluence remains neutral and selective. The weekly rank (#13) and monthly rank (#10) place the asset in the upper tier of the tracked universe, suggesting relative strength compared with peers; however, the blended technical layer is less decisive, with an overall technical score of 0.196 (Neutral). Momentum inputs are mixed: RSI(14) at 46.13 points to a balanced-to-soft bias, while MACD histogram at -0.0001 still reflects mild downside pressure. Volatility is not extreme, with Bollinger bandwidth near 0.0992, keeping the market in a regime where level breaks can matter more than indicator oscillations. Structurally, the near-term decision area is defined by support ~0.0397 and resistance ~0.0456. News sentiment is modestly positive on average (0.060) but dominated by neutral coverage.
- Rank stance: Short-term Bullish (daily #141), Mid-term Bullish (weekly #13), Long-term Bullish (monthly #10; 3-monthly #14).
- Technical confluence: Neutral (18-signal confluence 0.111; overall technical score 0.196).
- Key levels: Support 0.0397 and resistance 0.0456 frame the near-term risk boundary.
- News sentiment bias: Neutral with 0.060 average sentiment; 81% neutral classification.
- Confirmation / invalidation: A break above 0.0456 with volume supports continuation; a close below 0.0397 increases deterioration risk.
KGNAI evaluates assets using large cross-sectional datasets built from millions of structured data points. Inputs incorporate fundamental metrics, technical structures, and systematically processed news sentiment. Statistical models, machine learning, and AI frameworks are used to assess relative positioning, signal alignment, and probabilistic behavior across broad universes.
- Ranks are comparative across the tracked universe, not absolute price targets.
- Confluence reflects alignment among independent signal groups.
- Support/resistance levels are probabilistic decision zones, not guarantees.
- Sentiment provides contextual bias within the broader analytical framework.
1) KGNAI AI Analysis
Region: CRYPTO | Total universe size: 800 ranked instruments
- Daily rank: #141 out of 800 — Bullish
- Weekly rank: #13 out of 800 — Bullish
- Monthly rank: #10 out of 800 — Bullish
- 3-Monthly rank: #14 out of 800 — Bullish
ACX22620-USD’s rank profile is notable for its timeframe consistency. The weekly (#13), monthly (#10), and 3‑monthly (#14) placements cluster tightly in the top tier of the 800-instrument universe, implying that medium-to-long horizon behaviors are being scored similarly by multiple model tests. The daily rank (#141) remains bullish but is comparatively weaker than the higher-timeframe set, which often aligns with a market that is constructive but not fully synchronized across short-horizon price/flow inputs.
Alignment vs. divergence across horizons
The practical implication of this rank structure is an upward-biased regime with short-term variability. When longer-horizon ranks are strong but the daily rank sits meaningfully lower, it can reflect either (a) consolidation inside a broader constructive setup, or (b) a market awaiting confirmation from participation and momentum before the short-term model “catches up.” This framing becomes especially relevant given the later technical blend showing neutrality (overall technical score 0.196), which suggests that while the cross-sectional rank engine favors ACX22620-USD, indicator-level agreement is not uniformly directional.
Term view (model stance)
The model’s stated term view remains Bullish across short-, mid-, and long-term. From a portfolio construction lens, this reads less as a timing signal and more as a relative positioning flag: within the tracked universe, ACX22620-USD is being scored as stronger than most peers on the horizons where the ranks are deepest in the upper tail (weekly/monthly/3‑monthly). The near-term challenge is whether price structure and volume behavior can validate that advantage around the key levels discussed later (0.0397 and 0.0456).
KGNAI ranks each instrument across large universes using multiple proprietary AI tests and statistical models (millions of data points). Lower ranks generally indicate stronger probability of favorable performance behavior, while higher ranks indicate weaker probability and more bearish positioning.
Term view: Short-term: Bullish. Mid-term: Bullish. Long-term: Bullish.
2) Price & trend overview
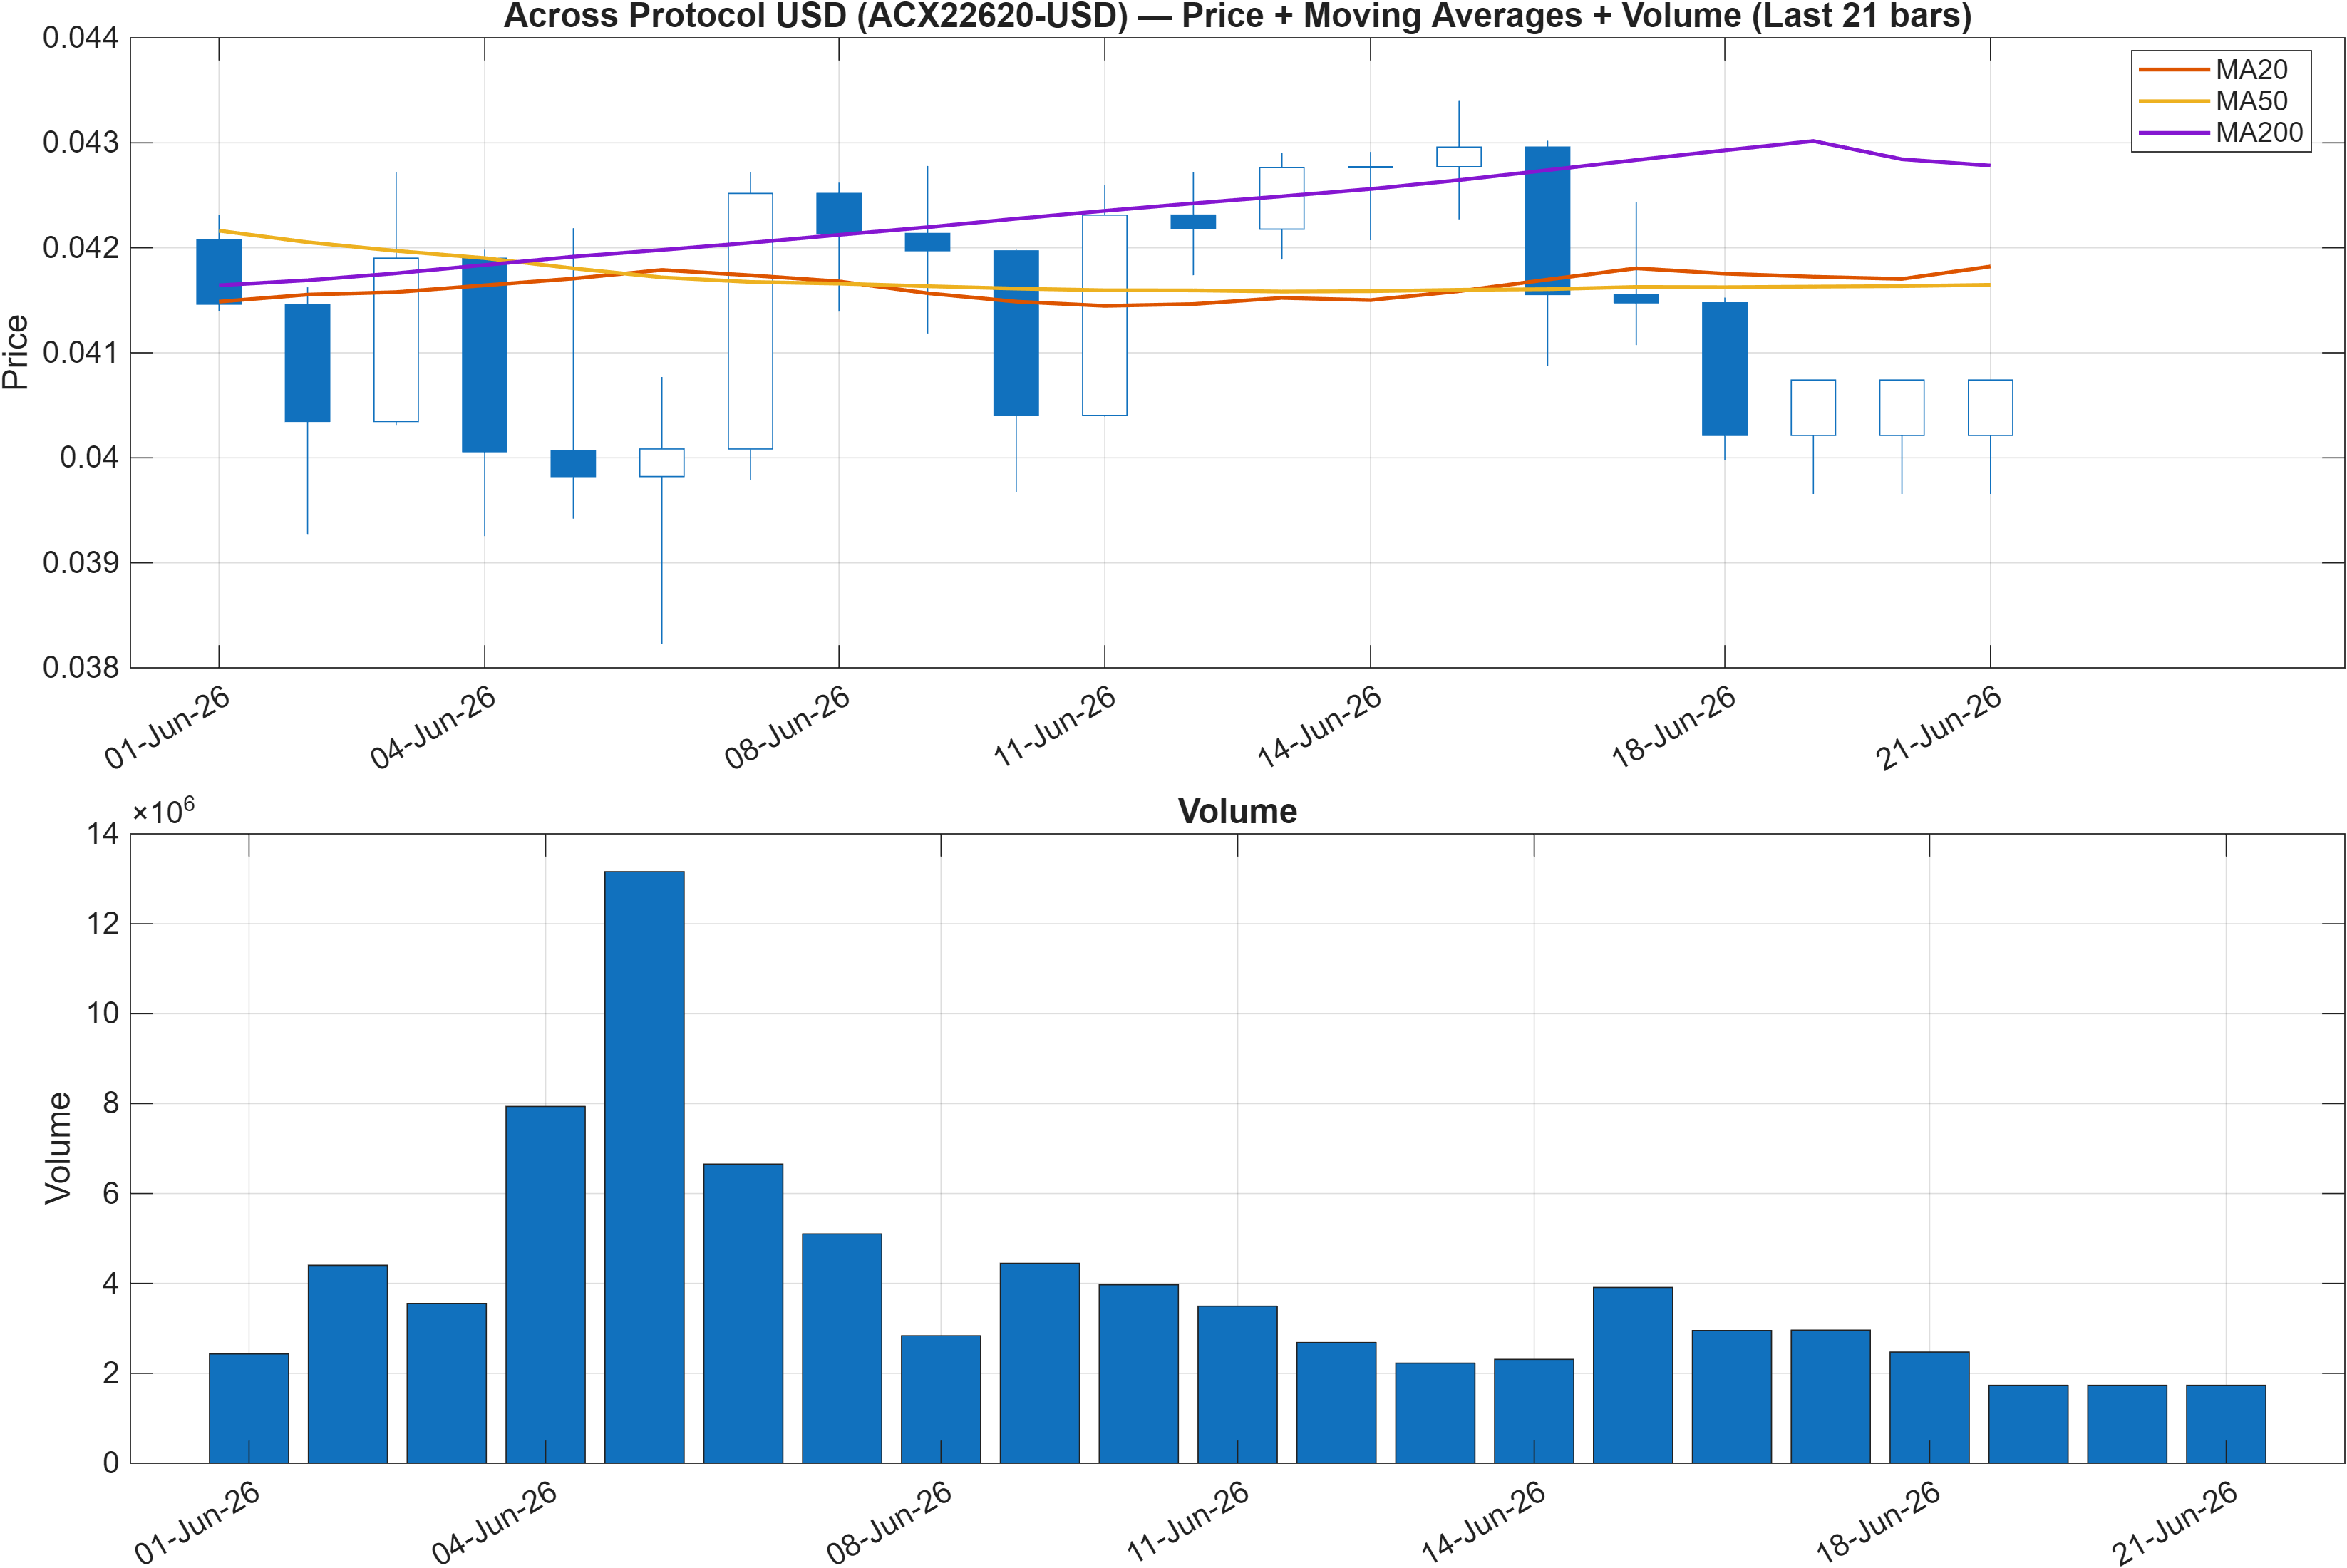
Interpretation: Close vs MA50 = Bullish, MA50 vs MA200 = Bearish.
Regime read: near-term strength vs longer-term structure
The moving-average interpretation is split: close vs MA50 is Bullish, while MA50 vs MA200 is Bearish. That combination typically describes a market where recent price action is improving but the longer lookback trend framework has not fully repaired. In practice, this often produces range-like behavior or stepwise advances rather than uninterrupted trend continuation, because the longer-term average can act as a structural “memory” of prior weakness.
Rank strength vs trend confirmation
This is where the rank stack matters. With weekly/monthly ranks in the upper tier (#13 and #10), ACX22620-USD is being favored on a cross-sectional basis even though the long moving-average relationship remains bearish. The tension between those two readings can be constructive if subsequent price action sustains above near-term support (0.0397) while repeatedly testing the upper boundary (0.0456). It can also be a warning if the market fails to hold gains despite a bullish close vs MA50, suggesting the daily strength is not broadening into trend persistence.
Participation sensitivity into resistance
Because the MA framework is mixed, price tends to become more sensitive to volume confirmation around key inflection points. The report’s own scenario framing later emphasizes that a break above resistance should occur with volume. That is consistent with a market trying to transition from a short-term recovery (bullish vs MA50) into a more durable trend state that would eventually improve the MA50 vs MA200 condition. Until that occurs, the cleaner read is a constructive bias with structural hurdles.
3) Momentum & volatility dashboard
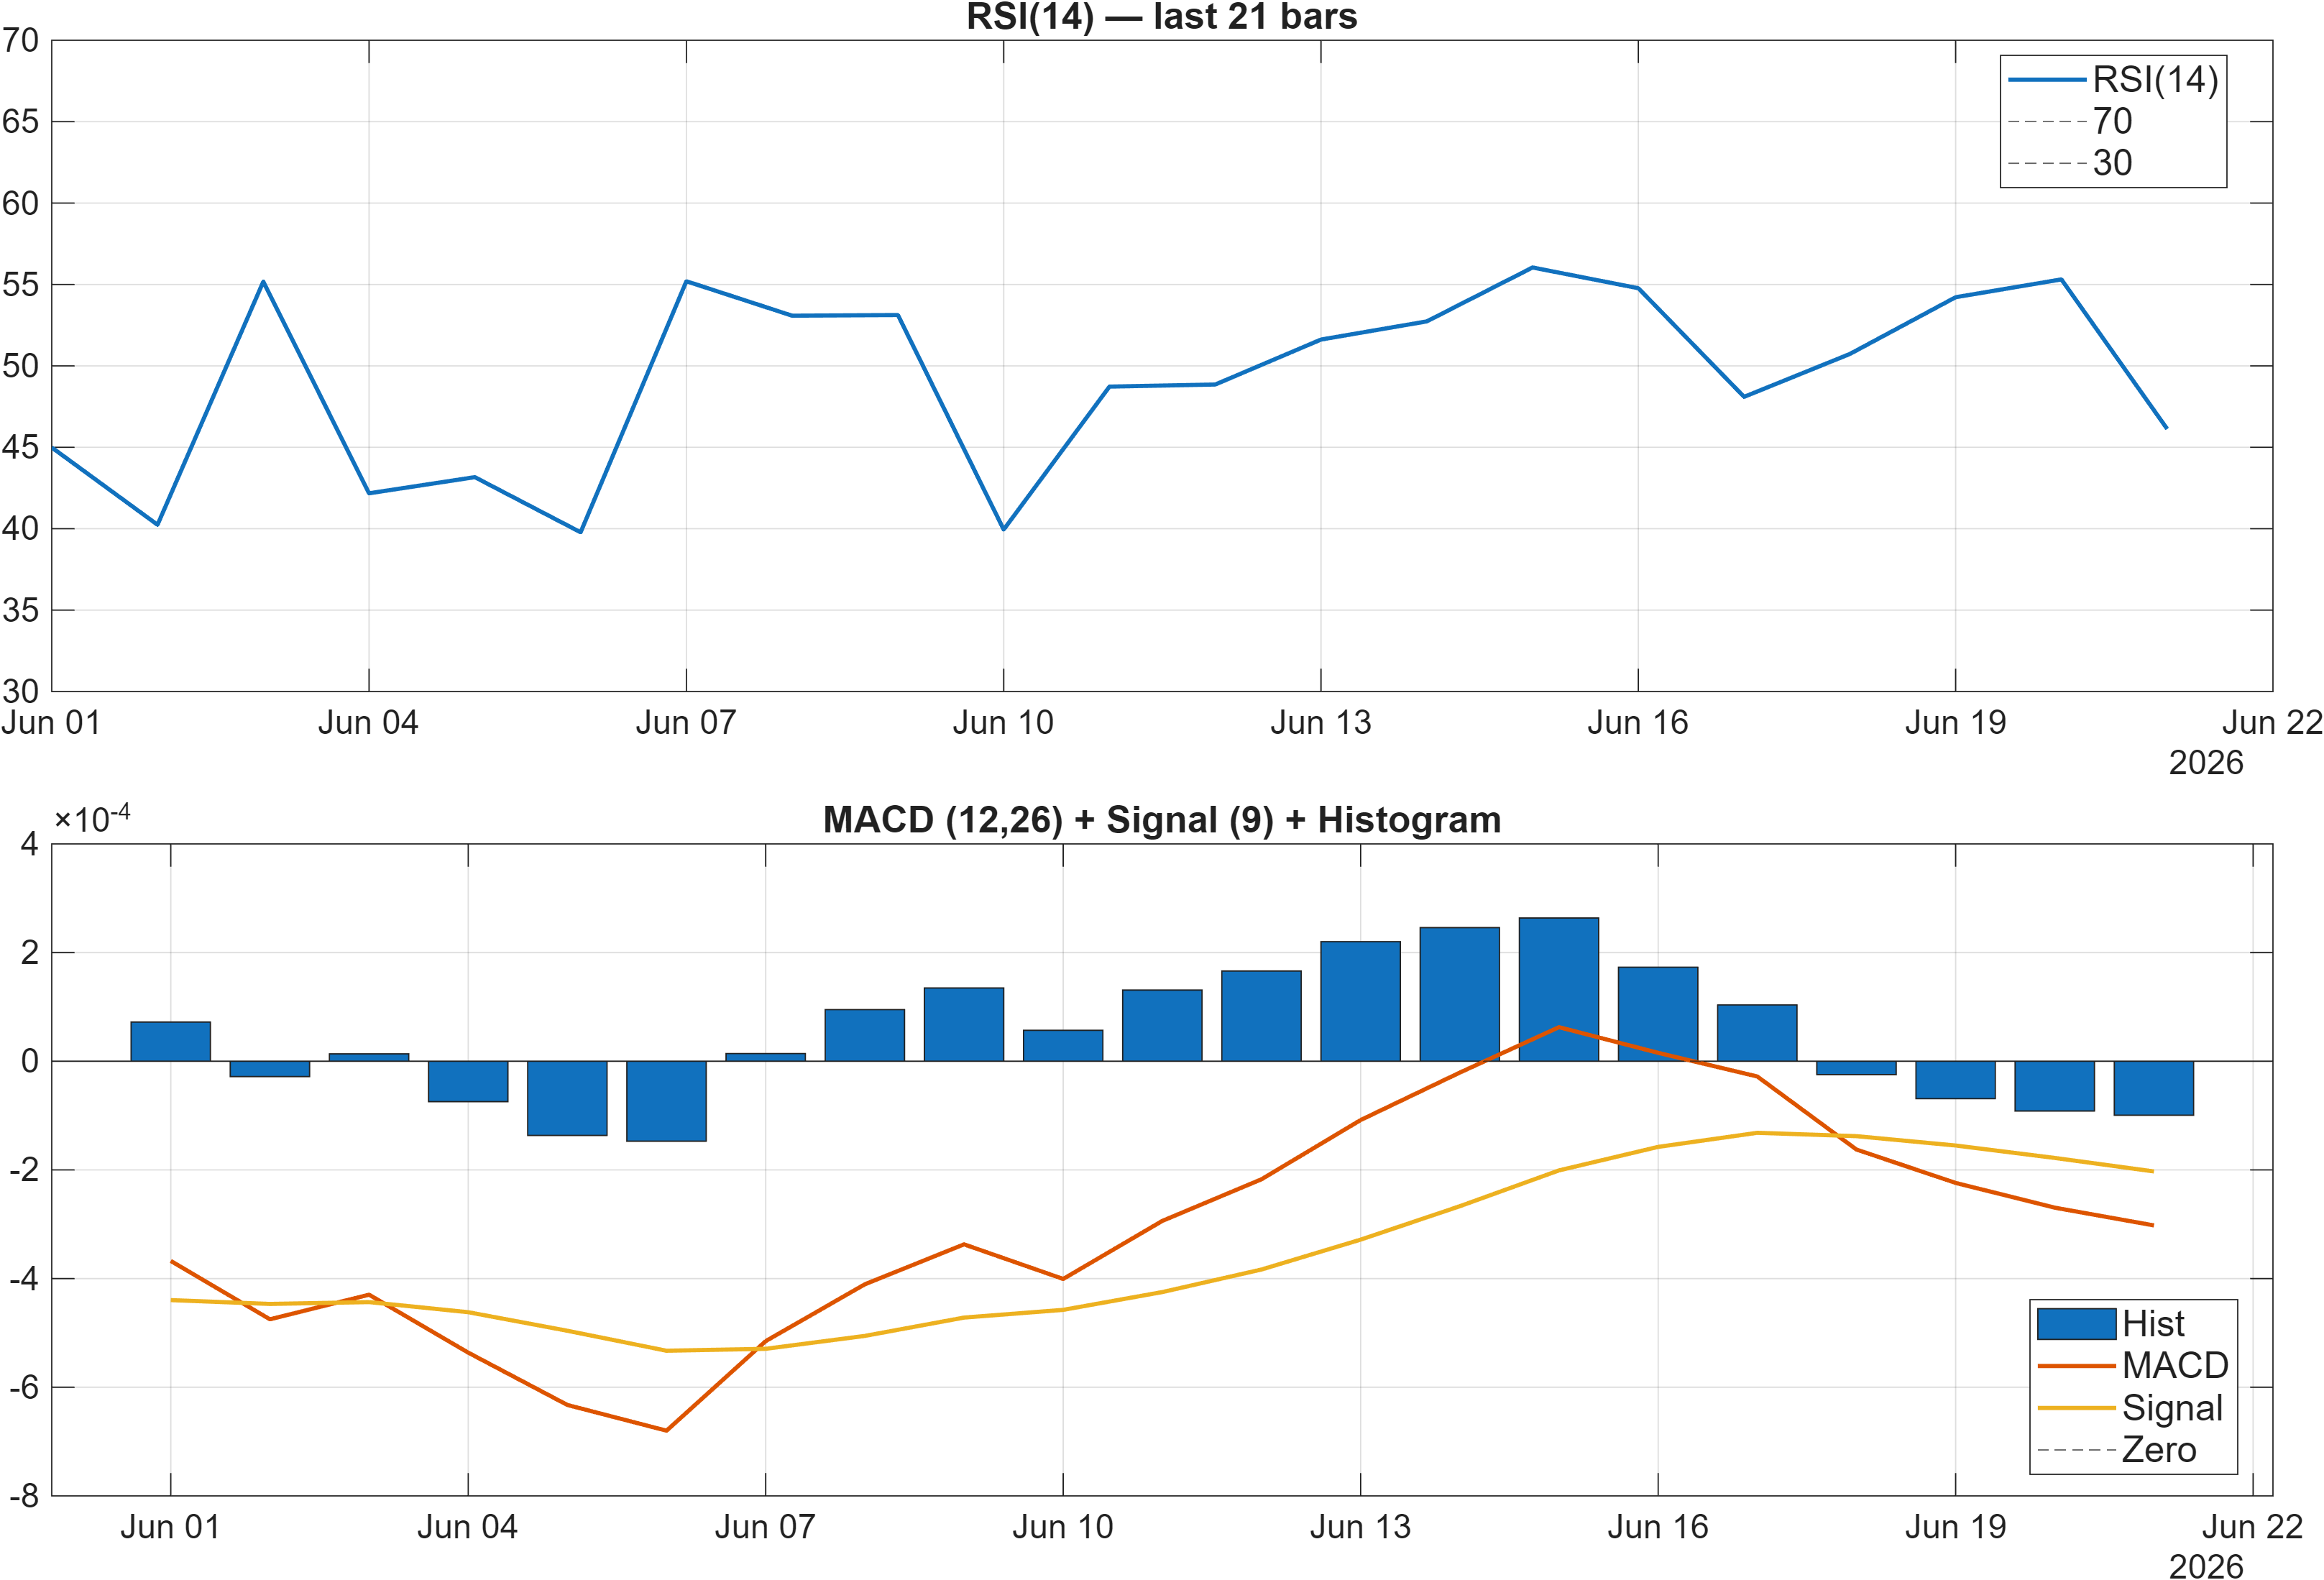
Interpretation: RSI bias = Neutral, MACD hist = -0.0001.
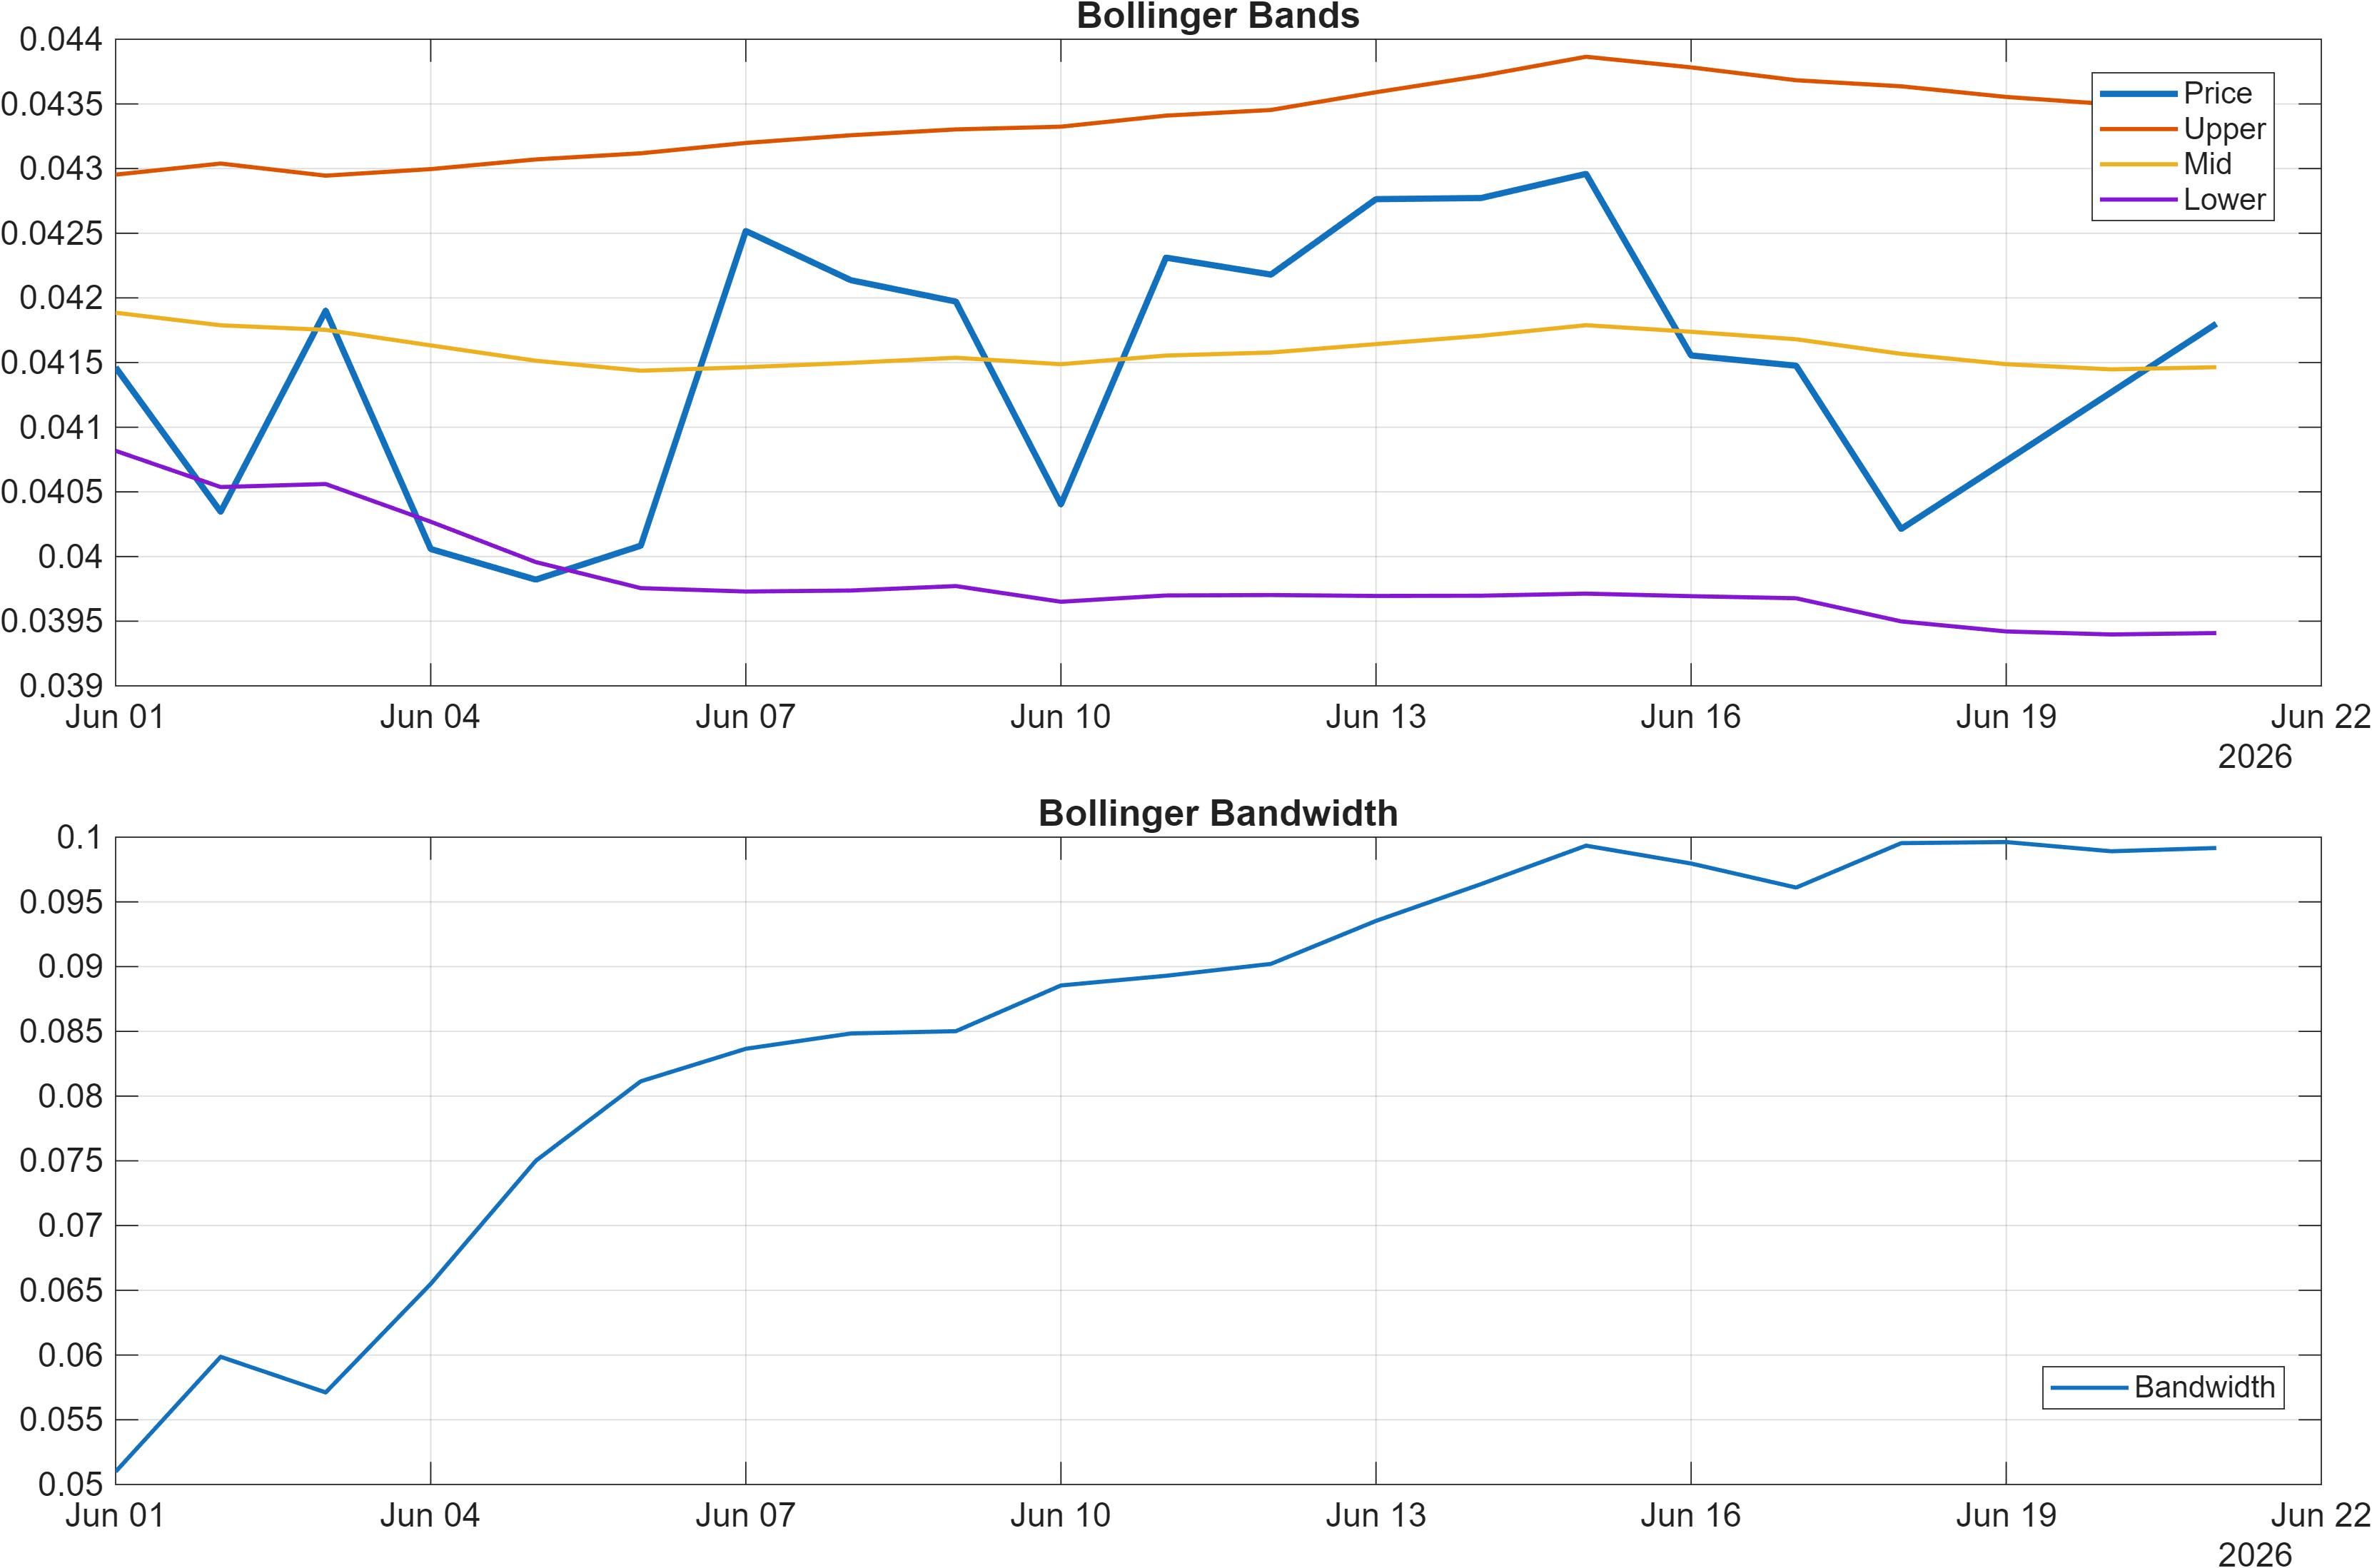
Interpretation: Bandwidth (volatility regime) latest = 0.0992.
Momentum: neutral RSI with slightly negative MACD impulse
Momentum is not delivering a single dominant signal. RSI(14) at 46.13 sits in a neutral zone, consistent with a market that is neither extended to the upside nor deeply oversold. At the same time, the MACD histogram at -0.0001 indicates residual downside impulse, albeit mild in magnitude. When RSI is neutral and MACD histogram is slightly negative, markets often require price/level confirmation before momentum traders engage decisively.
Volatility regime: moderate compression, level-driven outcomes
Bollinger bandwidth near 0.0992 points to a volatility environment that is not extreme. In non-expansive regimes, breakouts can fail if they are not supported by participation; conversely, ranges can persist longer than expected. This is consistent with the report’s emphasis on structural levels rather than aggressive indicator chasing. It also aligns with the technical blend remaining neutral (0.196 overall technical score), implying that momentum/volatility signals are not uniformly pointing in one direction.
Interaction with rank strength
The rank stack (weekly #13, monthly #10) suggests constructive relative behavior, but the momentum dashboard indicates the market may be in a confirmation phase. In that context, attention tends to shift toward how price behaves as it approaches resistance (0.0456) and whether pullbacks stay orderly above support (0.0397). A decisive improvement would typically be reflected first in MACD histogram moving away from negative values while RSI holds above the midline—conditions that are not yet evident in the provided readings.
4) Support / Resistance zones
Support ~ 0.0397 | Resistance ~ 0.0456
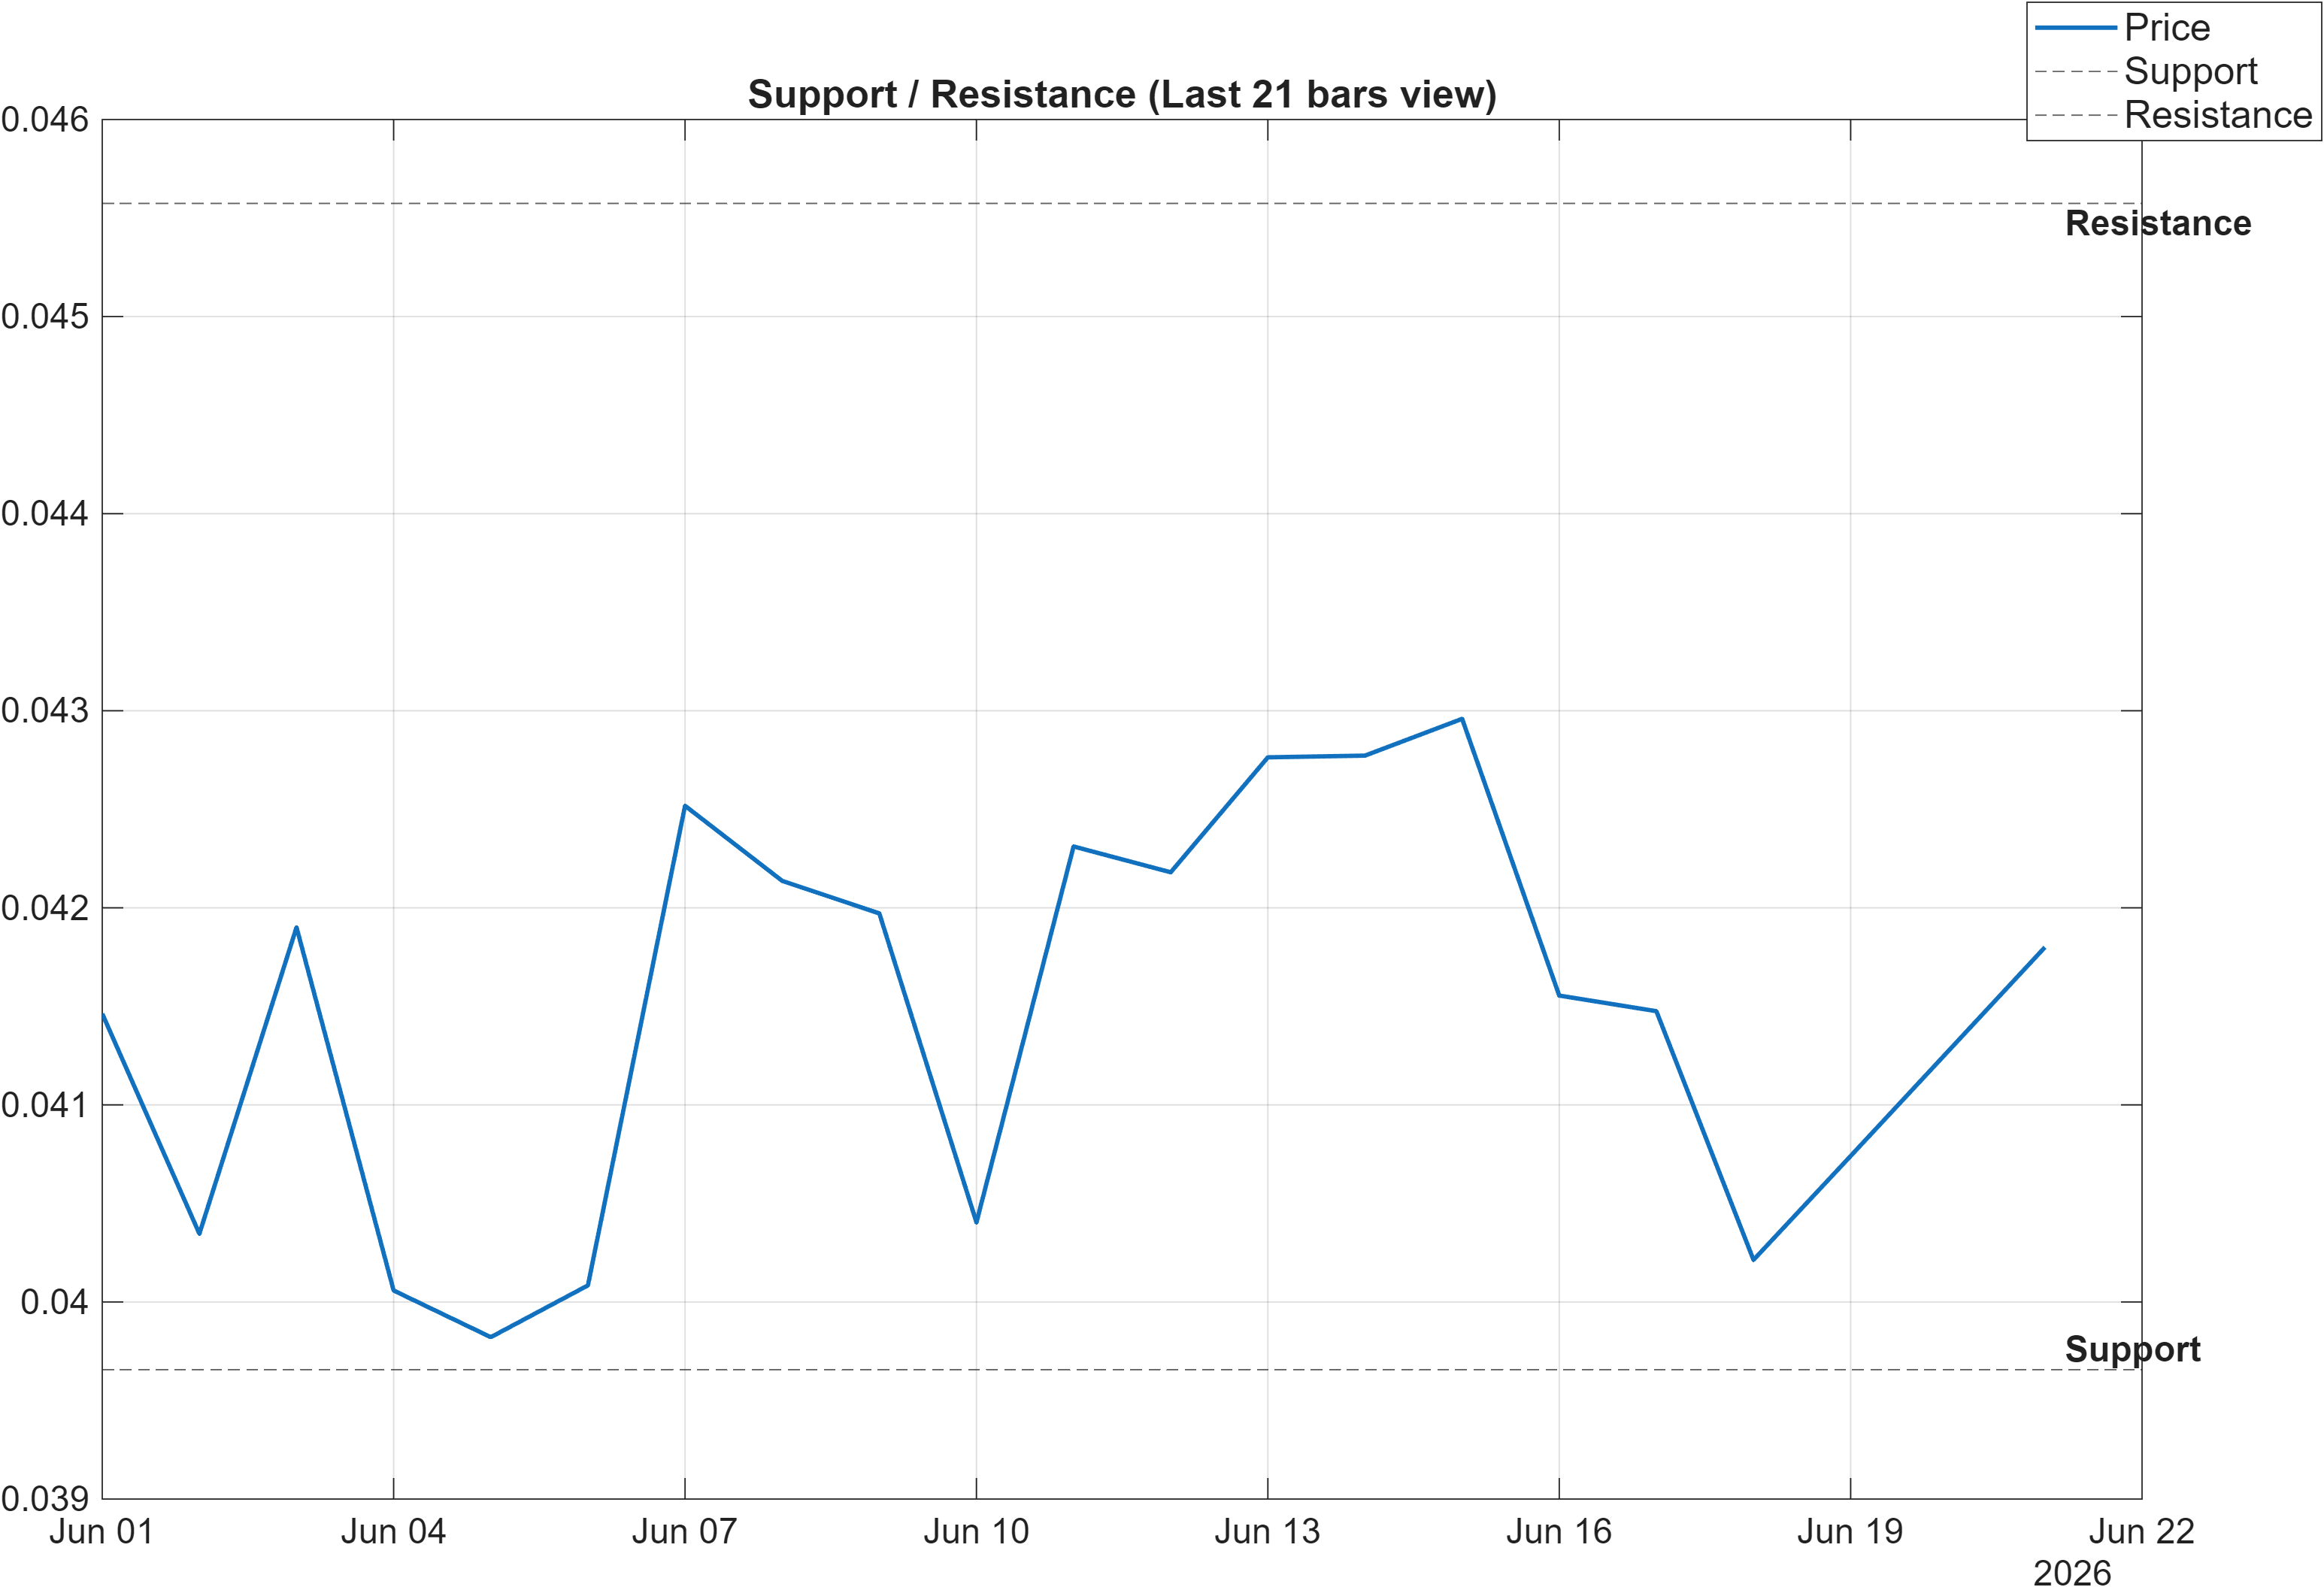
Scenario view: Break above resistance with volume → continuation. Close below support → signal deterioration risk.
Decision zones: probability framing rather than targets
The level map is tight and actionable: 0.0397 defines the primary support reference, while 0.0456 marks resistance. With momentum readings mixed (RSI 46.13; MACD histogram -0.0001) and volatility moderate (bandwidth 0.0992), these zones tend to carry more information than oscillators alone. In similar setups, the market often alternates between probing resistance and defending support until a catalyst—typically participation—forces expansion.
Continuation vs. deterioration: what must change
The scenario language embedded in the report is explicit: a break above 0.0456 with volume supports continuation. That aligns with the moving-average split (bullish close vs MA50, bearish MA50 vs MA200), where a clean break can be the mechanism that helps transition the market from recovery to trend repair. Conversely, a close below 0.0397 is framed as deterioration risk—consistent with the idea that, with a neutral technical blend (0.196), the bullish rank stack requires the market to avoid structural damage.
Level interaction with the broader model stance
Because longer-horizon ranks remain strong (monthly #10, 3‑monthly #14), the support area can be viewed as a structural validation zone for the bullish regime classification. If price repeatedly respects support while compressing beneath resistance, the market is effectively building an evidence base for the higher-timeframe ranks. If support fails, the more neutral/mixed indicator state suggests the probability weight could shift quickly, bringing the daily rank (#141) closer to the longer-term structure rather than reinforcing it.
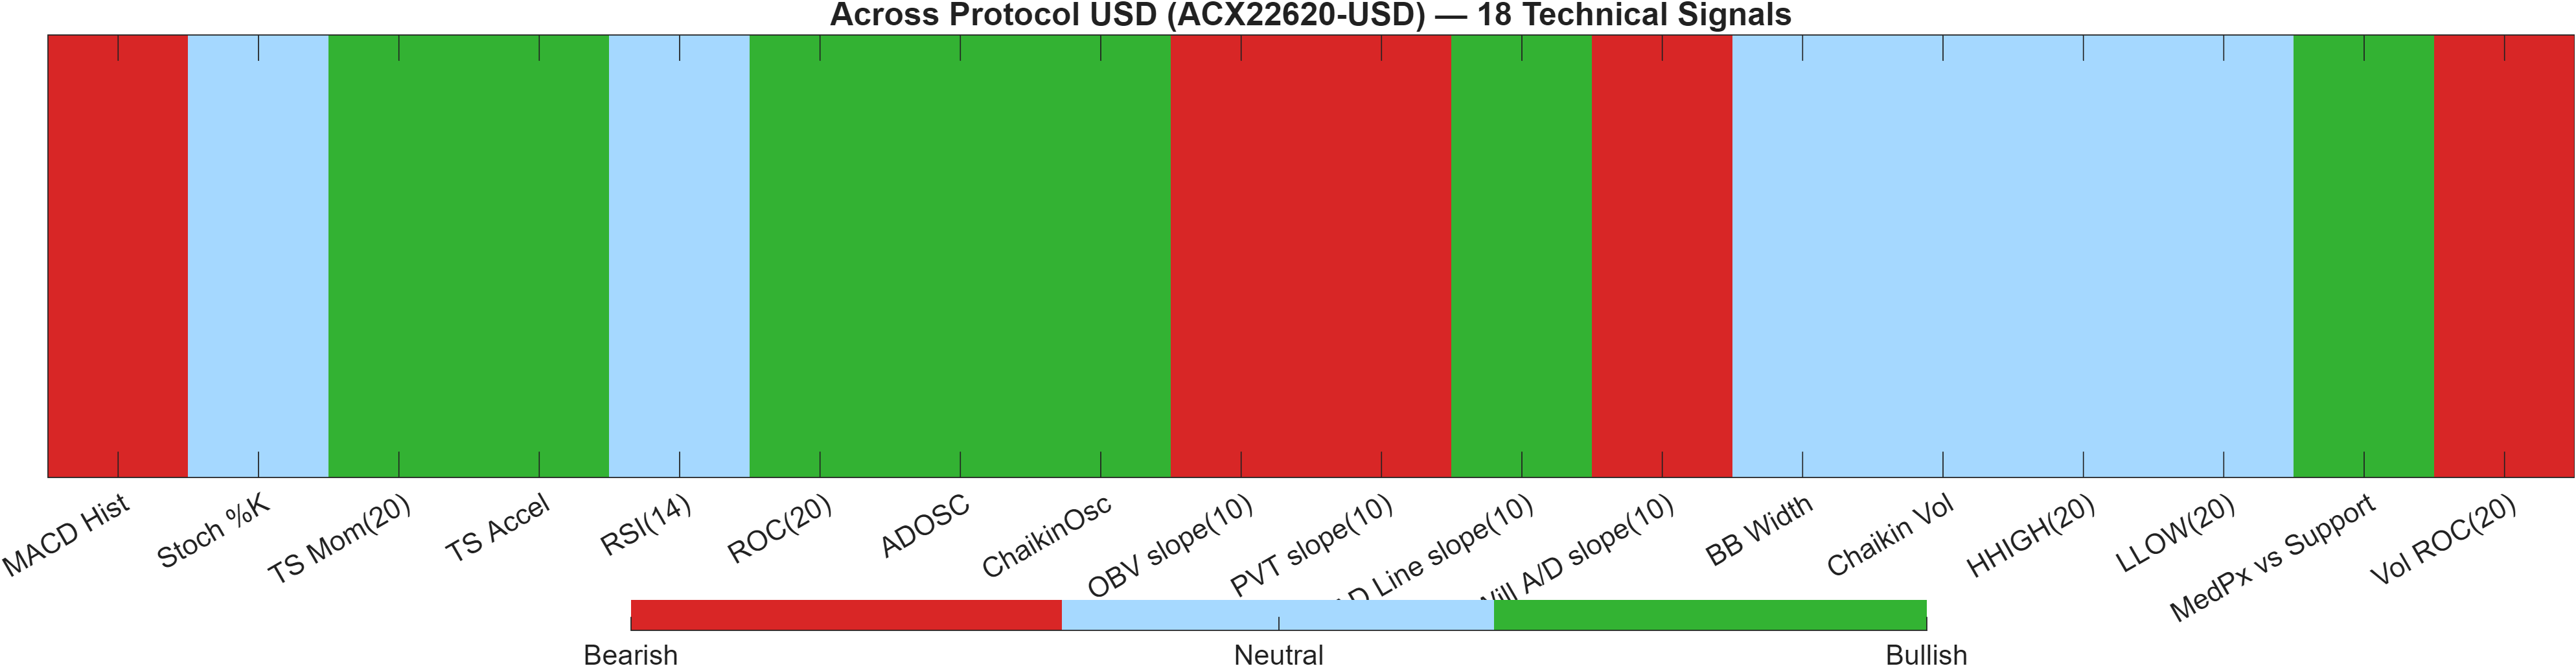
5) Quant Technical Dashboard (18 Signals)
KGNAI AI Technical Analysis Score (Deep Reinforcement Learning): Rank #243 out of 800 (Rank 1 represents the strongest technical positioning and a higher probability of favorable price behavior. As ranks increase toward the maximum, the probability of favorable outcomes weakens and bearish positioning becomes more dominant.) | Label: Neutral | Score: 0.392
18-Signal Technical Confluence Score: 0.111 (Neutral)
Overall Technical Score (18-signal confluence + DRL rank blend): 0.196 (Neutral)
Note: The blended score reflects signal strength weighted against broader AI technical ranking, which may temporarily diverge.
Blended technical score breakdown: 0.196 (Neutral | Bull 7 / Bear 5 / Neutral 6)
Composite read: neutral blend despite bullish rank stack
The technical layer is best described as constructive but unconvinced. The Deep Reinforcement Learning technical rank sits at #243 out of 800 with a 0.392 score and a Neutral label. Separately, the 18-signal confluence is 0.111 (Neutral), producing a blended overall technical score of 0.196 (Neutral). This is a clear case where the broader rank engine is bullish, while the indicator cluster is not fully aligned.
Signal balance: bullish majority, but bears are strategically placed
The breakdown (Bull 7 / Bear 5 / Neutral 6) indicates a slight bullish tilt, yet several bearish inputs sit in areas that can matter during breakout attempts. For example, MACD Hist is bearish (value -9.935e-05), and participation proxies show friction with OBV slope(10) bearish at -8.897e+05 and Vol ROC(20) bearish at -60.62. Offsetting that, multiple accumulation-style measures are positive, including ADOSC bullish at 74.31 and AD Line slope(10) bullish at 4.933e+06, which helps explain why the system does not skew bearish overall.
Interpretive priority: when neutrality is informative
Neutral confluence does not imply inactivity; it often signals a distribution of plausible paths that is wider than usual. In this report, the neutrality of the composite aligns with the level structure: support 0.0397 and resistance 0.0456 become the tie-breakers. If price resolves upward with confirming participation, the existing bullish rank stack (weekly #13, monthly #10) has more room to be “validated” by indicators. If participation remains soft into resistance, the bearish volume components can dominate despite otherwise supportive ranks.
Signal table (Bull/Bear/Neutral)
| Indicator | Value | Signal |
|---|---|---|
| MACD Hist | -9.935e-05 | Bearish |
| Stoch %K | 28.97 | Neutral |
| TS Mom(20) | 0.0003945 | Bullish |
| TS Accel | 0.002653 | Bullish |
| RSI(14) | 46.13 | Neutral |
| ROC(20) | 3.603 | Bullish |
| ADOSC | 74.31 | Bullish |
| ChaikinOsc | 1.491e+06 | Bullish |
| OBV slope(10) | -8.897e+05 | Bearish |
| PVT slope(10) | -1.147e+05 | Bearish |
| AD Line slope(10) | 4.933e+06 | Bullish |
| Will A/D slope(10) | -0.0009265 | Bearish |
| BB Width | 0.09916 | Neutral |
| Chaikin Vol | -27.02 | Neutral |
| HHIGH(20) | 0.0434 | Neutral |
| LLOW(20) | 0.03823 | Neutral |
| MedPx vs Support | 0.0005422 | Bullish |
| Vol ROC(20) | -60.62 | Bearish |
Interpretation: Indicator-level signals form the base confluence, which is then adjusted using a separate AI-driven technical ranking model. The final technical score summarizes this combined view.
6) News sentiment + extractive gist
Note: Instrument-specific news matches were not found, so the digest includes broader market/sector headlines. Links are provided for verification.
Sentiment score (avg): 0.060 | Positive: 19% | Neutral: 81% | Negative: 0%
KGNAI AI News Sentiment Score (normalized -1 to +1): Not available (as of —) | Label: Not available | Overall news score: 0.06
Positive Developments
Recent coverage across major financial outlets indicates a modestly constructive tone for the broader crypto complex, consistent with the aggregate sentiment mix (0.060 average; 19% positive). Commentary has emphasized pockets of strong token-specific performance even as broader “altcoin season” breadth appears uneven, which tends to support a selective risk-on posture rather than indiscriminate beta chasing. Macro-linked narratives have also highlighted resilience in major crypto benchmarks during policy-related volatility, a backdrop that can improve spillover sentiment for smaller instruments even without direct project-specific catalysts. For ACX22620-USD, this backdrop aligns with the report’s bullish cross-horizon ranks (weekly #13, monthly #10) while leaving the more granular technical layer neutral, suggesting optimism is present but not universally confirmed by market microstructure inputs such as volume momentum.
Neutral / Mixed Developments
The dominant classification is neutral (81%), implying informational flow without a strong directional impulse. Coverage has included market-structure topics (trading dynamics, liquidity routing, and adversarial behaviors in DeFi) alongside rotation narratives describing capital concentration in major assets. For a smaller instrument, that blend can translate into a “wait-and-see” environment: relative ranking can remain strong while day-to-day price discovery is driven more by cross-asset flows than by asset-specific news. This neutrality is consistent with the report’s indicator posture—RSI(14) 46.13 and MACD histogram -0.0001—where the market is not signaling either momentum acceleration or capitulation.
Negative / Risk Signals
Risk-oriented coverage has centered on operational and regulatory uncertainty across the sector rather than ACX22620-USD specifically. Market-structure risks (including exploit-related discussion) and evolving regulatory frameworks can weigh on risk appetite, particularly for assets that depend on broad liquidity conditions. Additionally, rotation narratives that favor major crypto assets can delay sustained participation in smaller tokens, which matters because this report flags volume as a key confirmation requirement at resistance (0.0456). While the aggregate dataset shows 0% negative classification, the presence of “risk” themes is still relevant: with a neutral technical blend (0.196 overall) and volatility that is not elevated (bandwidth 0.0992), downside risk can express primarily through failed breakouts and support tests rather than sharp, sentiment-driven dislocations.
- Whether participation improves on approaches to 0.0456, consistent with the “break with volume” continuation condition.
- Whether price action continues to defend 0.0397 during pullbacks as a validation of the bullish rank regime.
- Whether momentum confirms via a sustained improvement from MACD histogram -0.0001 while RSI holds firm around/above the midline (46.13 currently).
Sources referenced: Reuters, Bloomberg, Yahoo Finance, MarketWatch, Investing.com
7) Sources
- Notorious ‘sandwich attack’ bot Jaredfromsubway.eth exploited for $7.5M — https://cointelegraph.com/news/notorious-sandwich-attack-bot-jaredfromsubwayeth-exploited-for-75m?utm_source=rss&utm_medium=rss&utm_campaign=rss
- Bitcoin rotations into altcoins collapses: Have altseasons 'disappeared'? — https://cointelegraph.com/markets/bitcoin-rotations-into-altcoins-collapses-have-altseasons-disappeared?utm_source=rss&utm_medium=rss&utm_campaign=rss
- Crypto industry looks to stablecoins and DeFi revisions in MiCA 2.0 — https://cointelegraph.com/features/crypto-industry-stablecoins-defi-mica?utm_source=rss&utm_medium=rss&utm_campaign=rss
- Pudgy Penguins expands retail footprint with Target trading card rollout — https://cointelegraph.com/news/pudgy-penguins-expands-retail-footprint-with-target-trading-card-rollout?utm_source=rss&utm_medium=rss&utm_campaign=rss
- Philippine SEC signals readiness for RWA tokenization — https://cointelegraph.com/news/philippine-sec-rwa-tokenization-readiness?utm_source=rss&utm_medium=rss&utm_campaign=rss
- Crypto kidnappers who robbed a Minnesota family of $8M plead guilty — https://cointelegraph.com/news/crypto-kidnappers-who-robbed-a-minnesota-family-of-8m-plead-guilty?utm_source=rss&utm_medium=rss&utm_campaign=rss
- Sonic token drops 5% as 3 former execs resign from Sonic Labs board — https://cointelegraph.com/news/s-token-drops-5-as-3-former-execs-resign-from-sonic-labs-board?utm_source=rss&utm_medium=rss&utm_campaign=rss
- Charles Schwab to enter prediction markets with S&P 500 wagers: WSJ — https://cointelegraph.com/news/charles-schwab-prediction-markets-sp500-wagers?utm_source=rss&utm_medium=rss&utm_campaign=rss
You may also like: How KGNAI AI ranks instruments across global markets
Disclaimer: KGNAI provides AI-generated analytics and educational market commentary only. This is not financial advice. Markets involve risk. Always do your own research.