ABN.AS — ABN Amro Group NV (Netherlands) | 10-Jun-2026 Technical & Rank Read: Consolidation with Short-Term Strength, Longer-Term Drag
ABN Amro Group NV (ABN.AS) currently shows a split regime across horizons: the daily rank (#197 out of 1396) indicates comparatively firmer near-term positioning, while the 6-month (#1120) and yearly (#1259) ranks sit in the weaker portion of the universe. Technically, the picture also reflects compression—price action is consolidating with mixed trend cues (close vs MA50 is bearish, while MA50 vs MA200 is bullish). Momentum is not decisively trending: MACD histogram at -0.2371 and RSI(14) at 44.65 lean soft, while volatility is subdued with Bollinger Bandwidth at 0.0543, often consistent with range behavior. Key decision levels remain well-defined at support ~28.8050 and resistance ~34.4650. News sentiment readings are broadly neutral in distribution but modestly constructive in labeling, adding context rather than a standalone catalyst.
- Rank stance: Short-term Neutral (daily strength present), Mid-term Neutral, Long-term Bearish (6-month/yearly ranks remain weak).
- Technical confluence: Bearish on the 18-signal layer (blended view remains Neutral).
- Key levels: Support 28.8050 | Resistance 34.4650.
- News sentiment bias: Mostly neutral distribution (71% neutral) with a slightly constructive tilt in the model summary.
- Confirmation / invalidation: A break above 34.4650 with volume supports continuation; a close below 28.8050 elevates deterioration risk.
What KGNAI Measures
KGNAI evaluates assets using large cross-sectional datasets built from millions of structured data points. Inputs incorporate fundamental metrics, technical structures, and systematically processed news sentiment. Statistical models, machine learning, and AI frameworks are used to assess relative positioning, signal alignment, and probabilistic behavior across broad universes.
How to Read This Report
- Ranks are comparative across the tracked universe, not absolute price targets.
- Confluence reflects alignment among independent signal groups.
- Support/resistance levels are probabilistic decision zones, not guarantees.
- Sentiment provides contextual bias within the broader analytical framework.
1) KGNAI AI Analysis
Region: EUROPE
Total universe size: 1396 ranked instruments
- Daily rank: #197 out of 1396 — Bullish
- Weekly rank: #1092 out of 1396 — Neutral
- Monthly rank: #659 out of 1396 — Neutral
- 3-Monthly rank: #758 out of 1396 — Neutral
- 6-Monthly rank: #1120 out of 1396 — Bearish
- Yearly rank: #1259 out of 1396 — Bearish
ABN.AS is best described as short-term relative strength inside a weaker long-horizon envelope. The daily rank of #197 places it in the stronger segment of the 1396-instrument universe, suggesting the recent tape is behaving better than many peers. That advantage fades quickly when extending the lens: the weekly reading at #1092 sits in the weaker half-to-lower third, and the longer windows are more clearly pressured with the 6-month at #1120 and yearly at #1259.
This configuration typically signals mean-reversion and range risk rather than a clean, persistent trend. When the near-term rank improves while the yearly rank stays elevated, markets often oscillate between tactical strength and structural supply. The “Term view” summary aligns with that interpretation: Short-term Neutral, Mid-term Neutral, and Long-term Bearish. In practice, ABN.AS requires additional confirmation from independent technical layers before treating the daily improvement as more than a counter-trend phase.
From a market-structure perspective, the most useful takeaway is dispersion across horizons. Tactical traders may focus on whether the daily rank strength can pull the monthly/3-month ranks (#659 and #758) toward stronger relative positioning. Longer-horizon investors will typically look for evidence that the elevated 6-month and yearly ranks are starting to improve—without that, rallies can remain more vulnerable to reversals at established resistance.
2) Price & trend overview
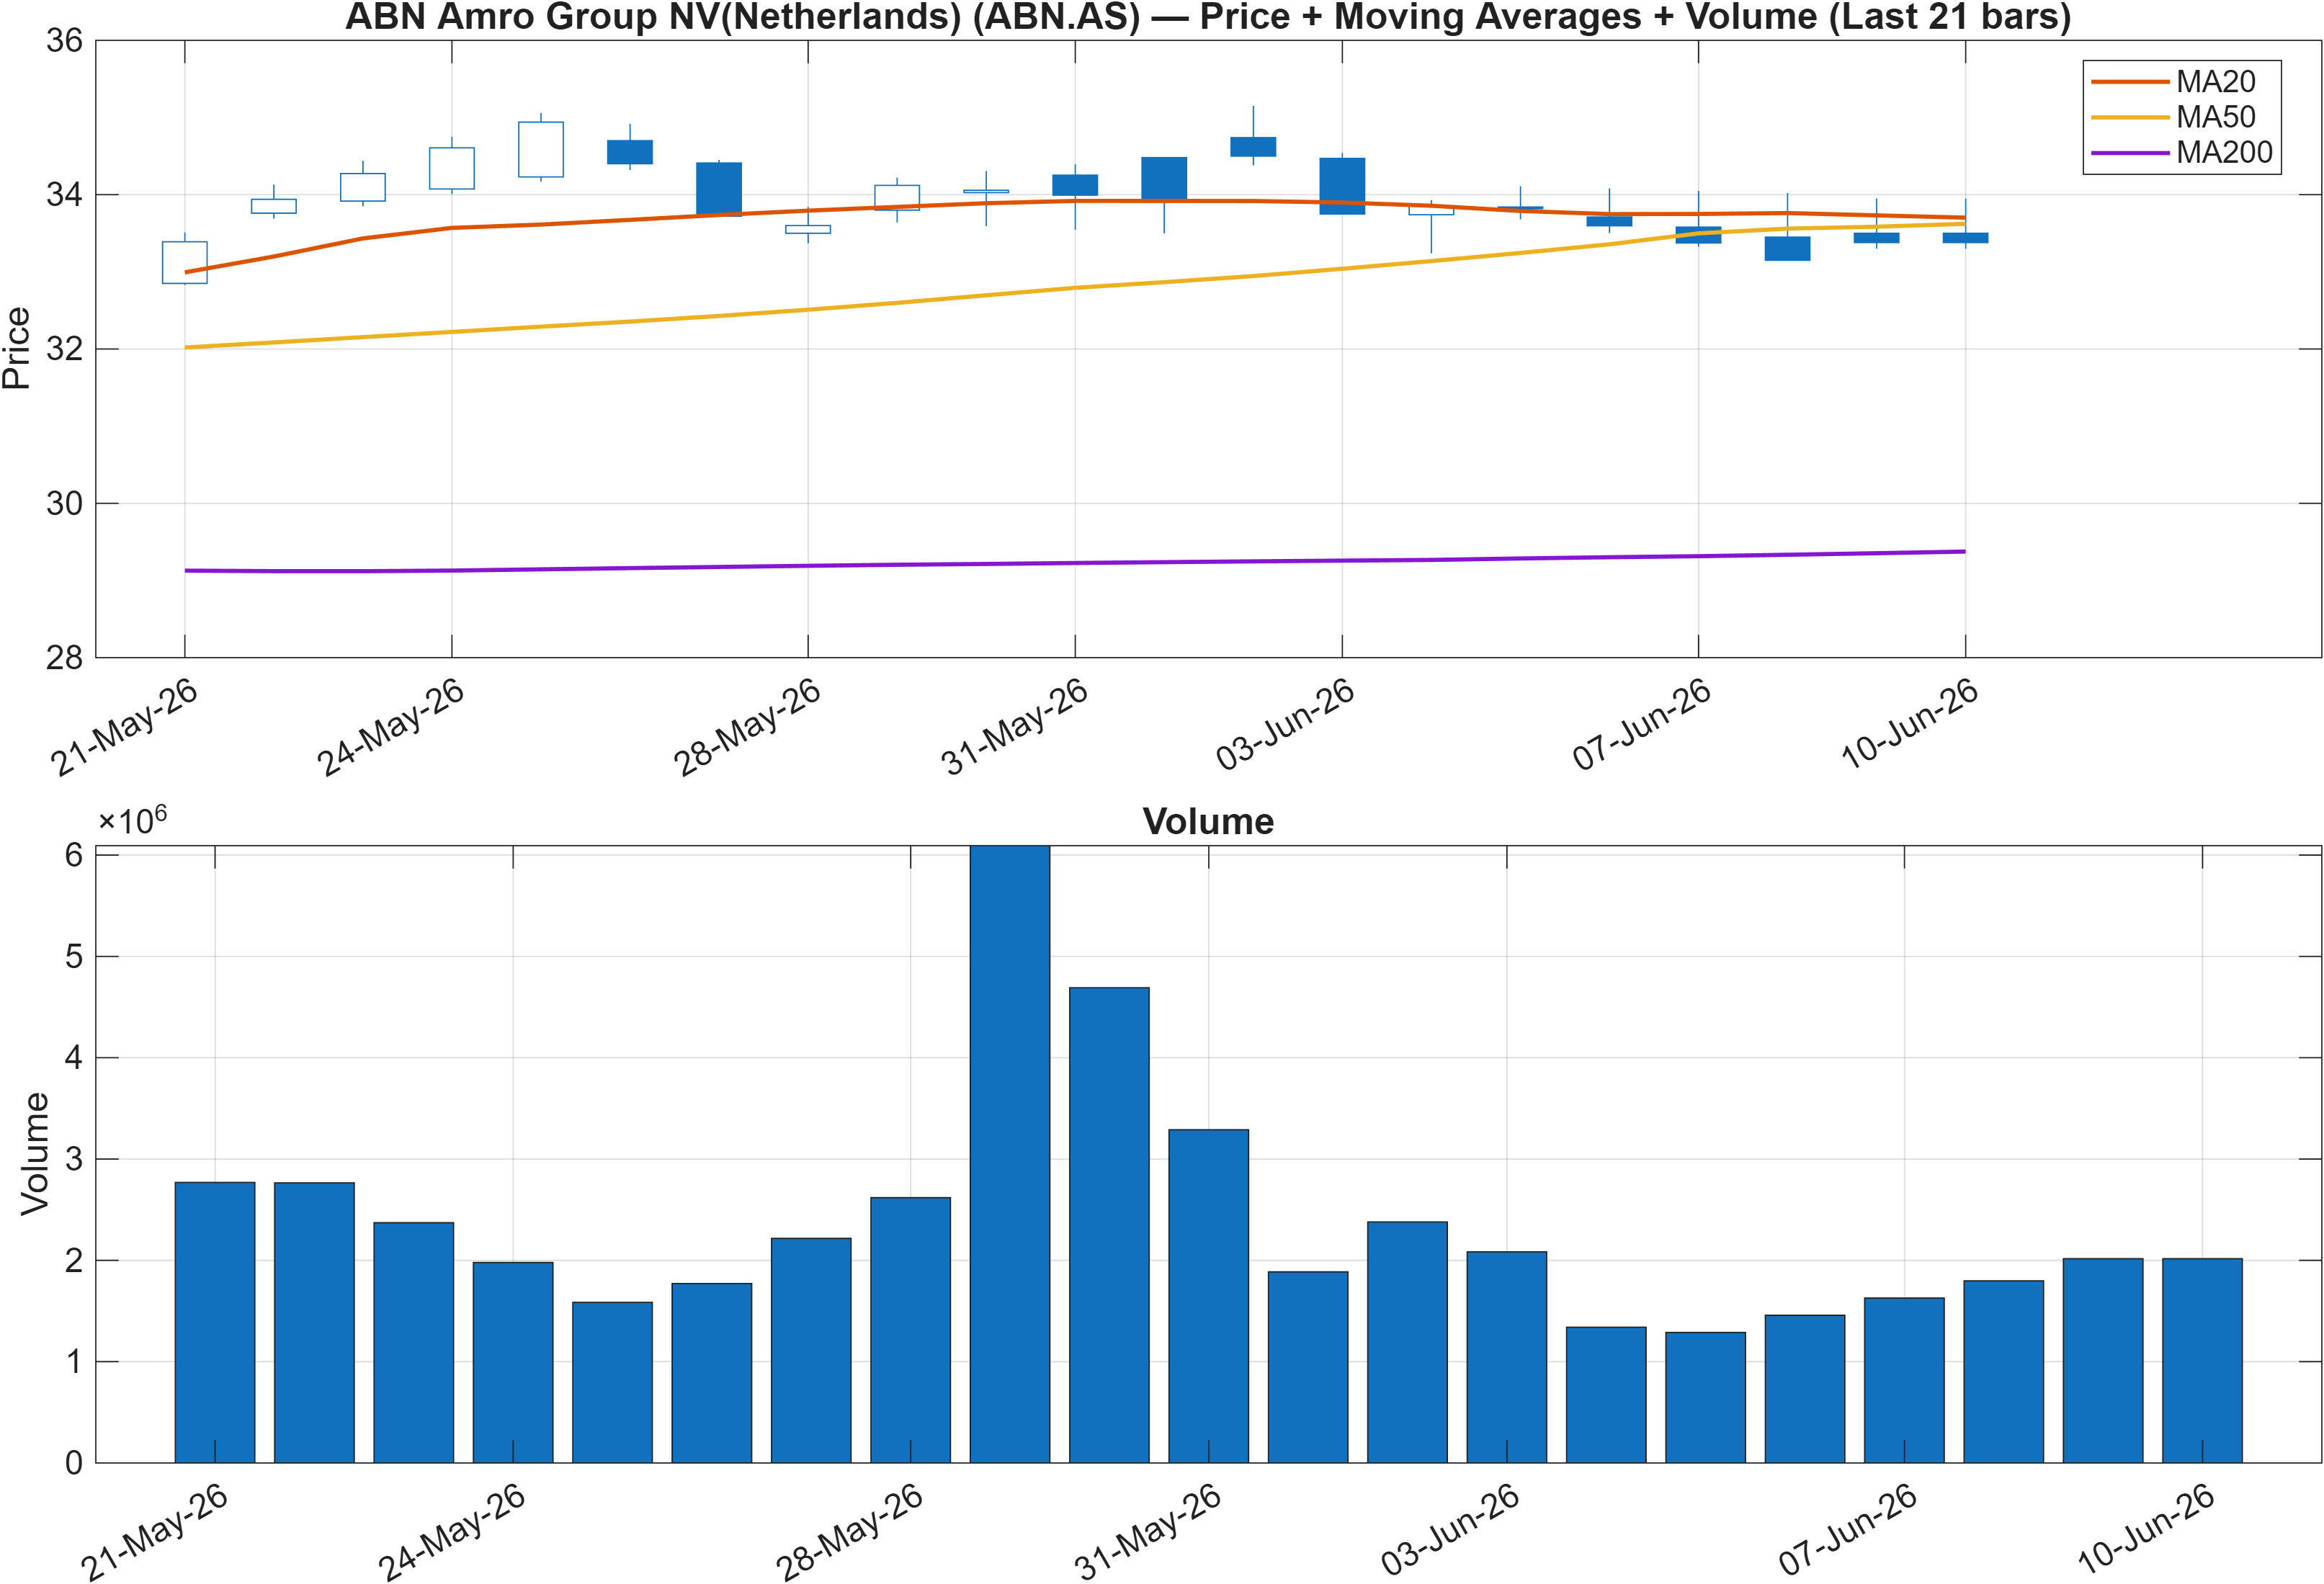
The trend stack is internally conflicted, which is consistent with the “state of consolidation” framing. The close relative to the MA50 is bearish, indicating price is not currently reclaiming the medium-term trend proxy. At the same time, MA50 vs MA200 is bullish, a configuration commonly associated with a prior uptrend that has not fully broken down on a slower basis.
This blend tends to produce range-bound trade selection: pullbacks can persist while longer-term moving-average structure still appears constructive. It also means that “trend following” signals can disagree depending on the lookback. That disagreement matters because the technical confluence layer later in the report tilts bearish (18-signal score -0.389), while the blended overall technical score is neutral (-0.236), implying the moving-average backdrop may be cushioning otherwise softer momentum/flow inputs.
Volume context is important during consolidation: without sustained participation, moves through key bands often fail. Here, the support/resistance map provides the operational boundaries—28.8050 below and 34.4650 above. With the MA signals split, price reaction around these zones becomes more informative than the moving averages alone. A constructive read would require price to regain traction above the MA50 and then demonstrate follow-through toward resistance; failure to do so leaves the structure vulnerable to repeated retracements.
3) Momentum & volatility dashboard
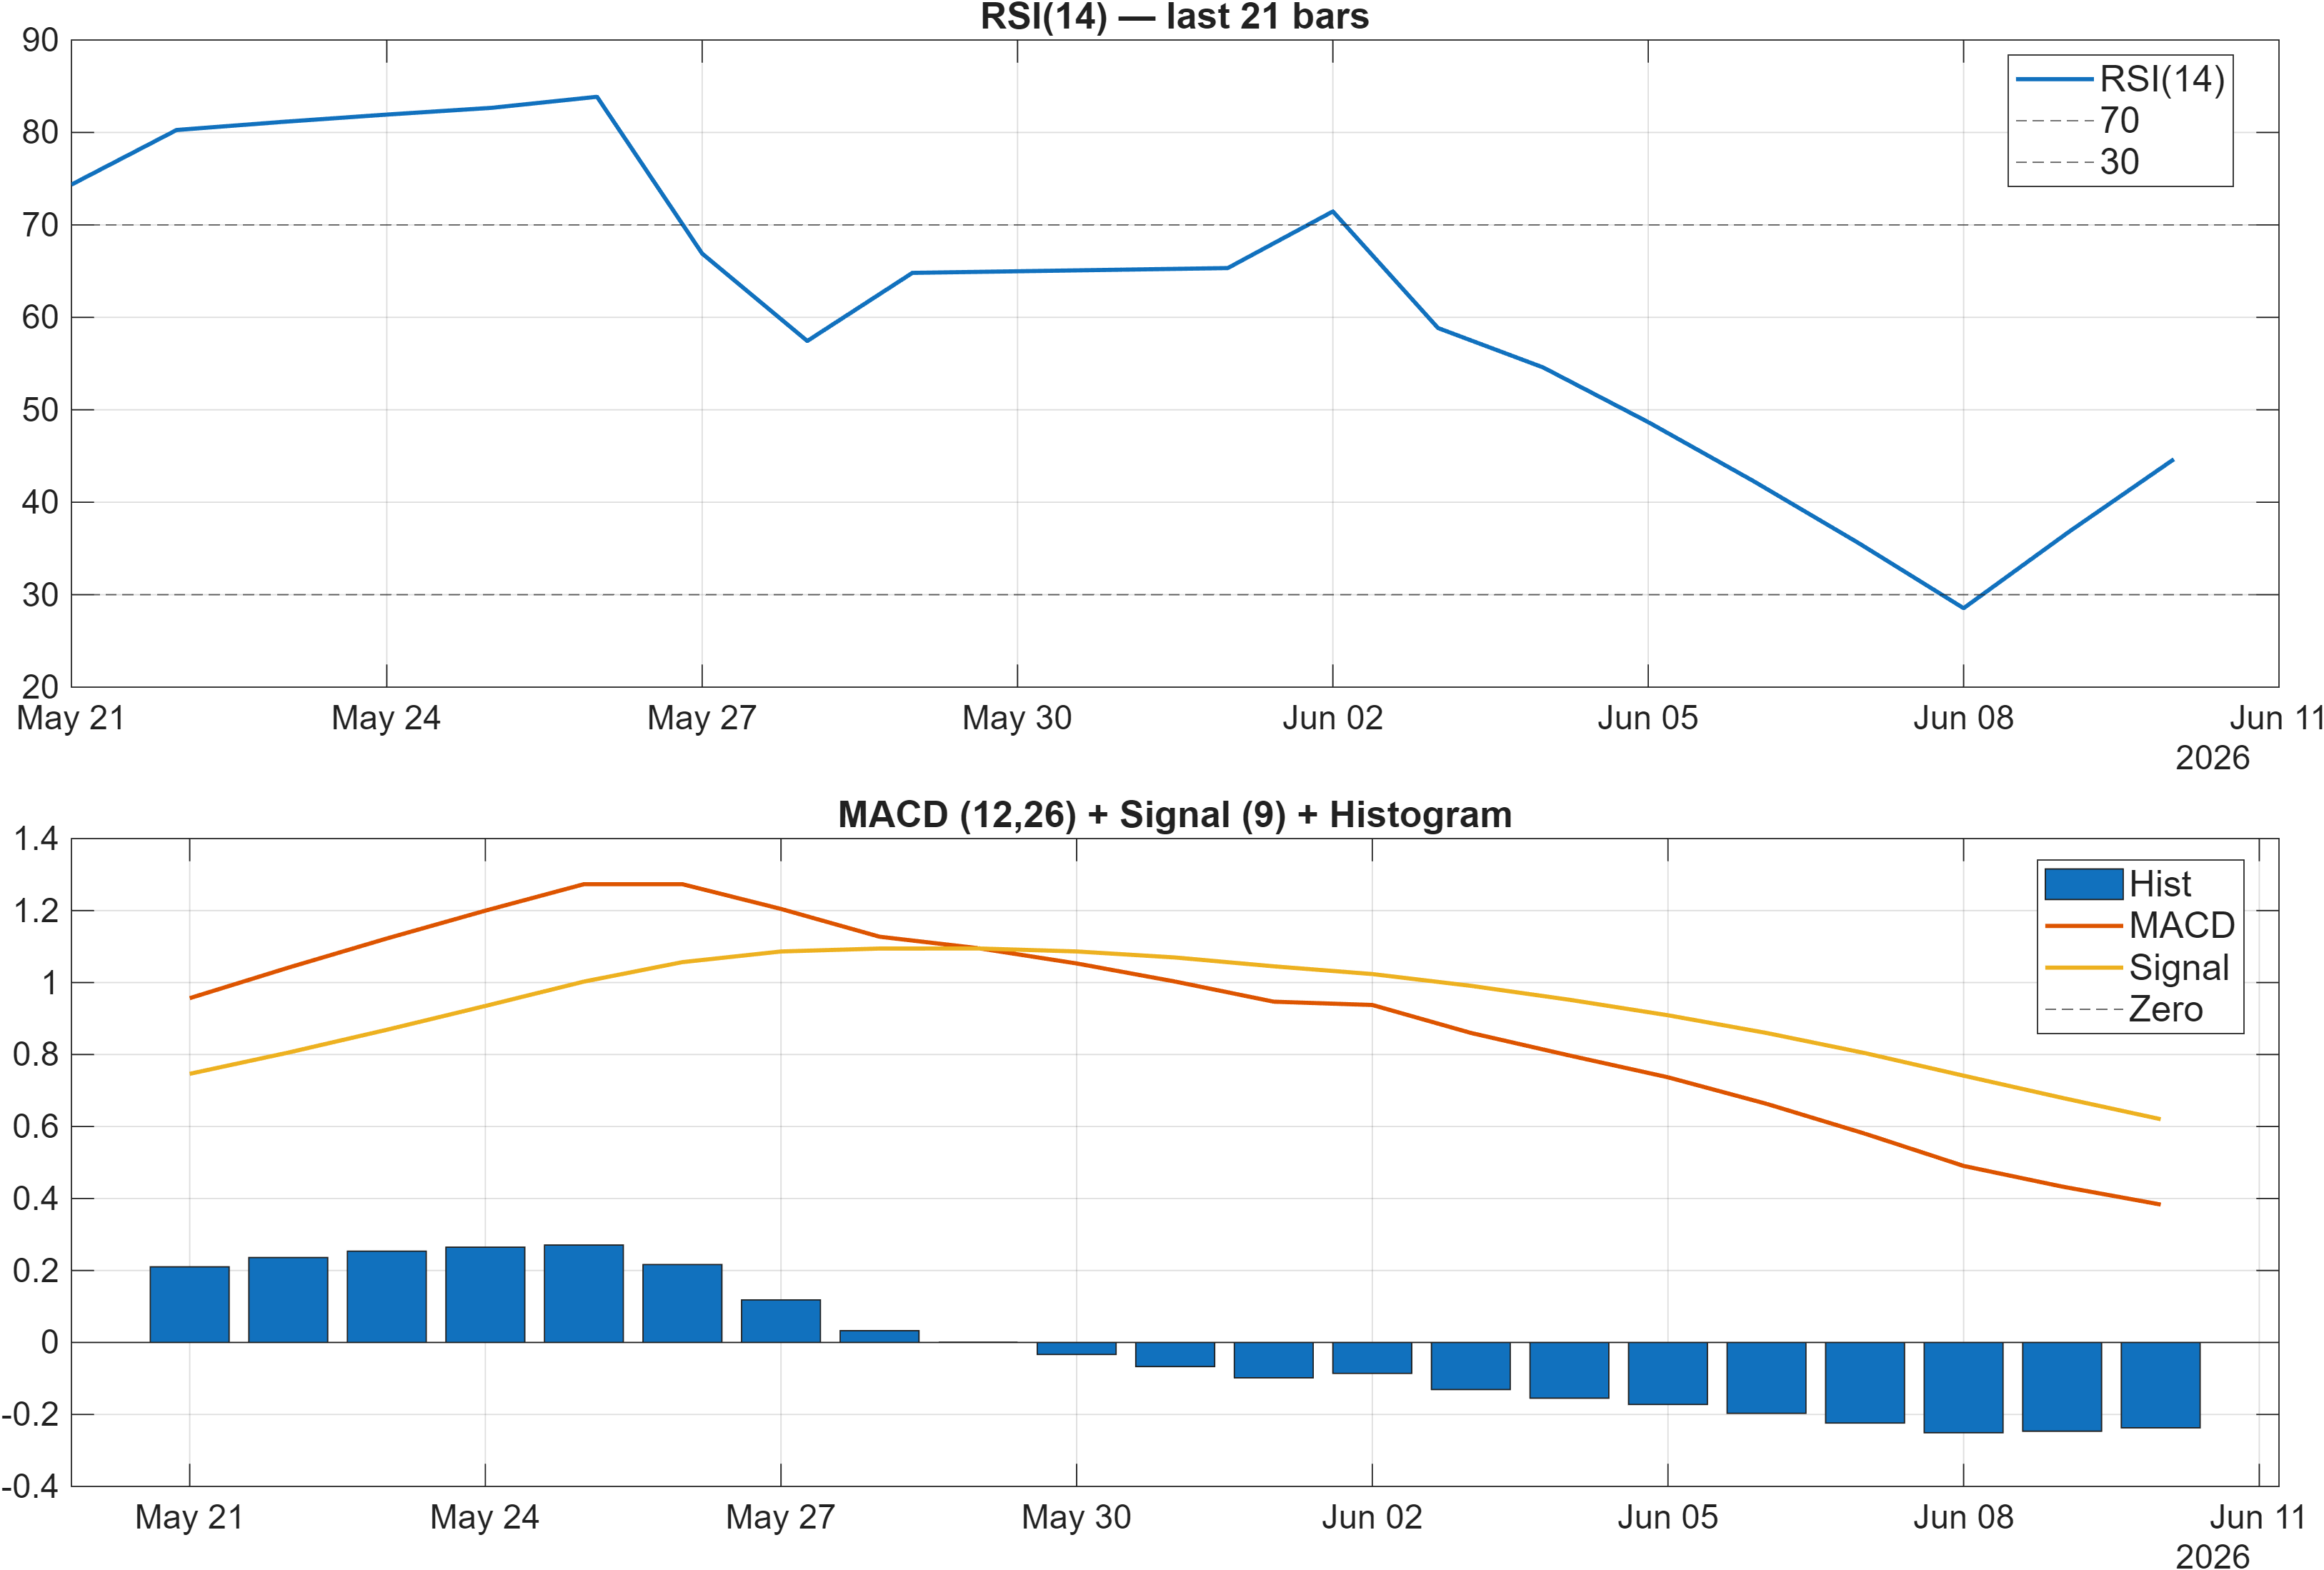
Momentum indicators point to softness without capitulation. RSI bias is described as neutral in the dashboard, yet the signal table classifies RSI(14) at 44.65 as bearish—consistent with sub-50 behavior that often accompanies weaker intermediate momentum. The MACD histogram at -0.2371 also sits in bearish territory, indicating negative momentum carry remains present even if the slope is not necessarily accelerating.
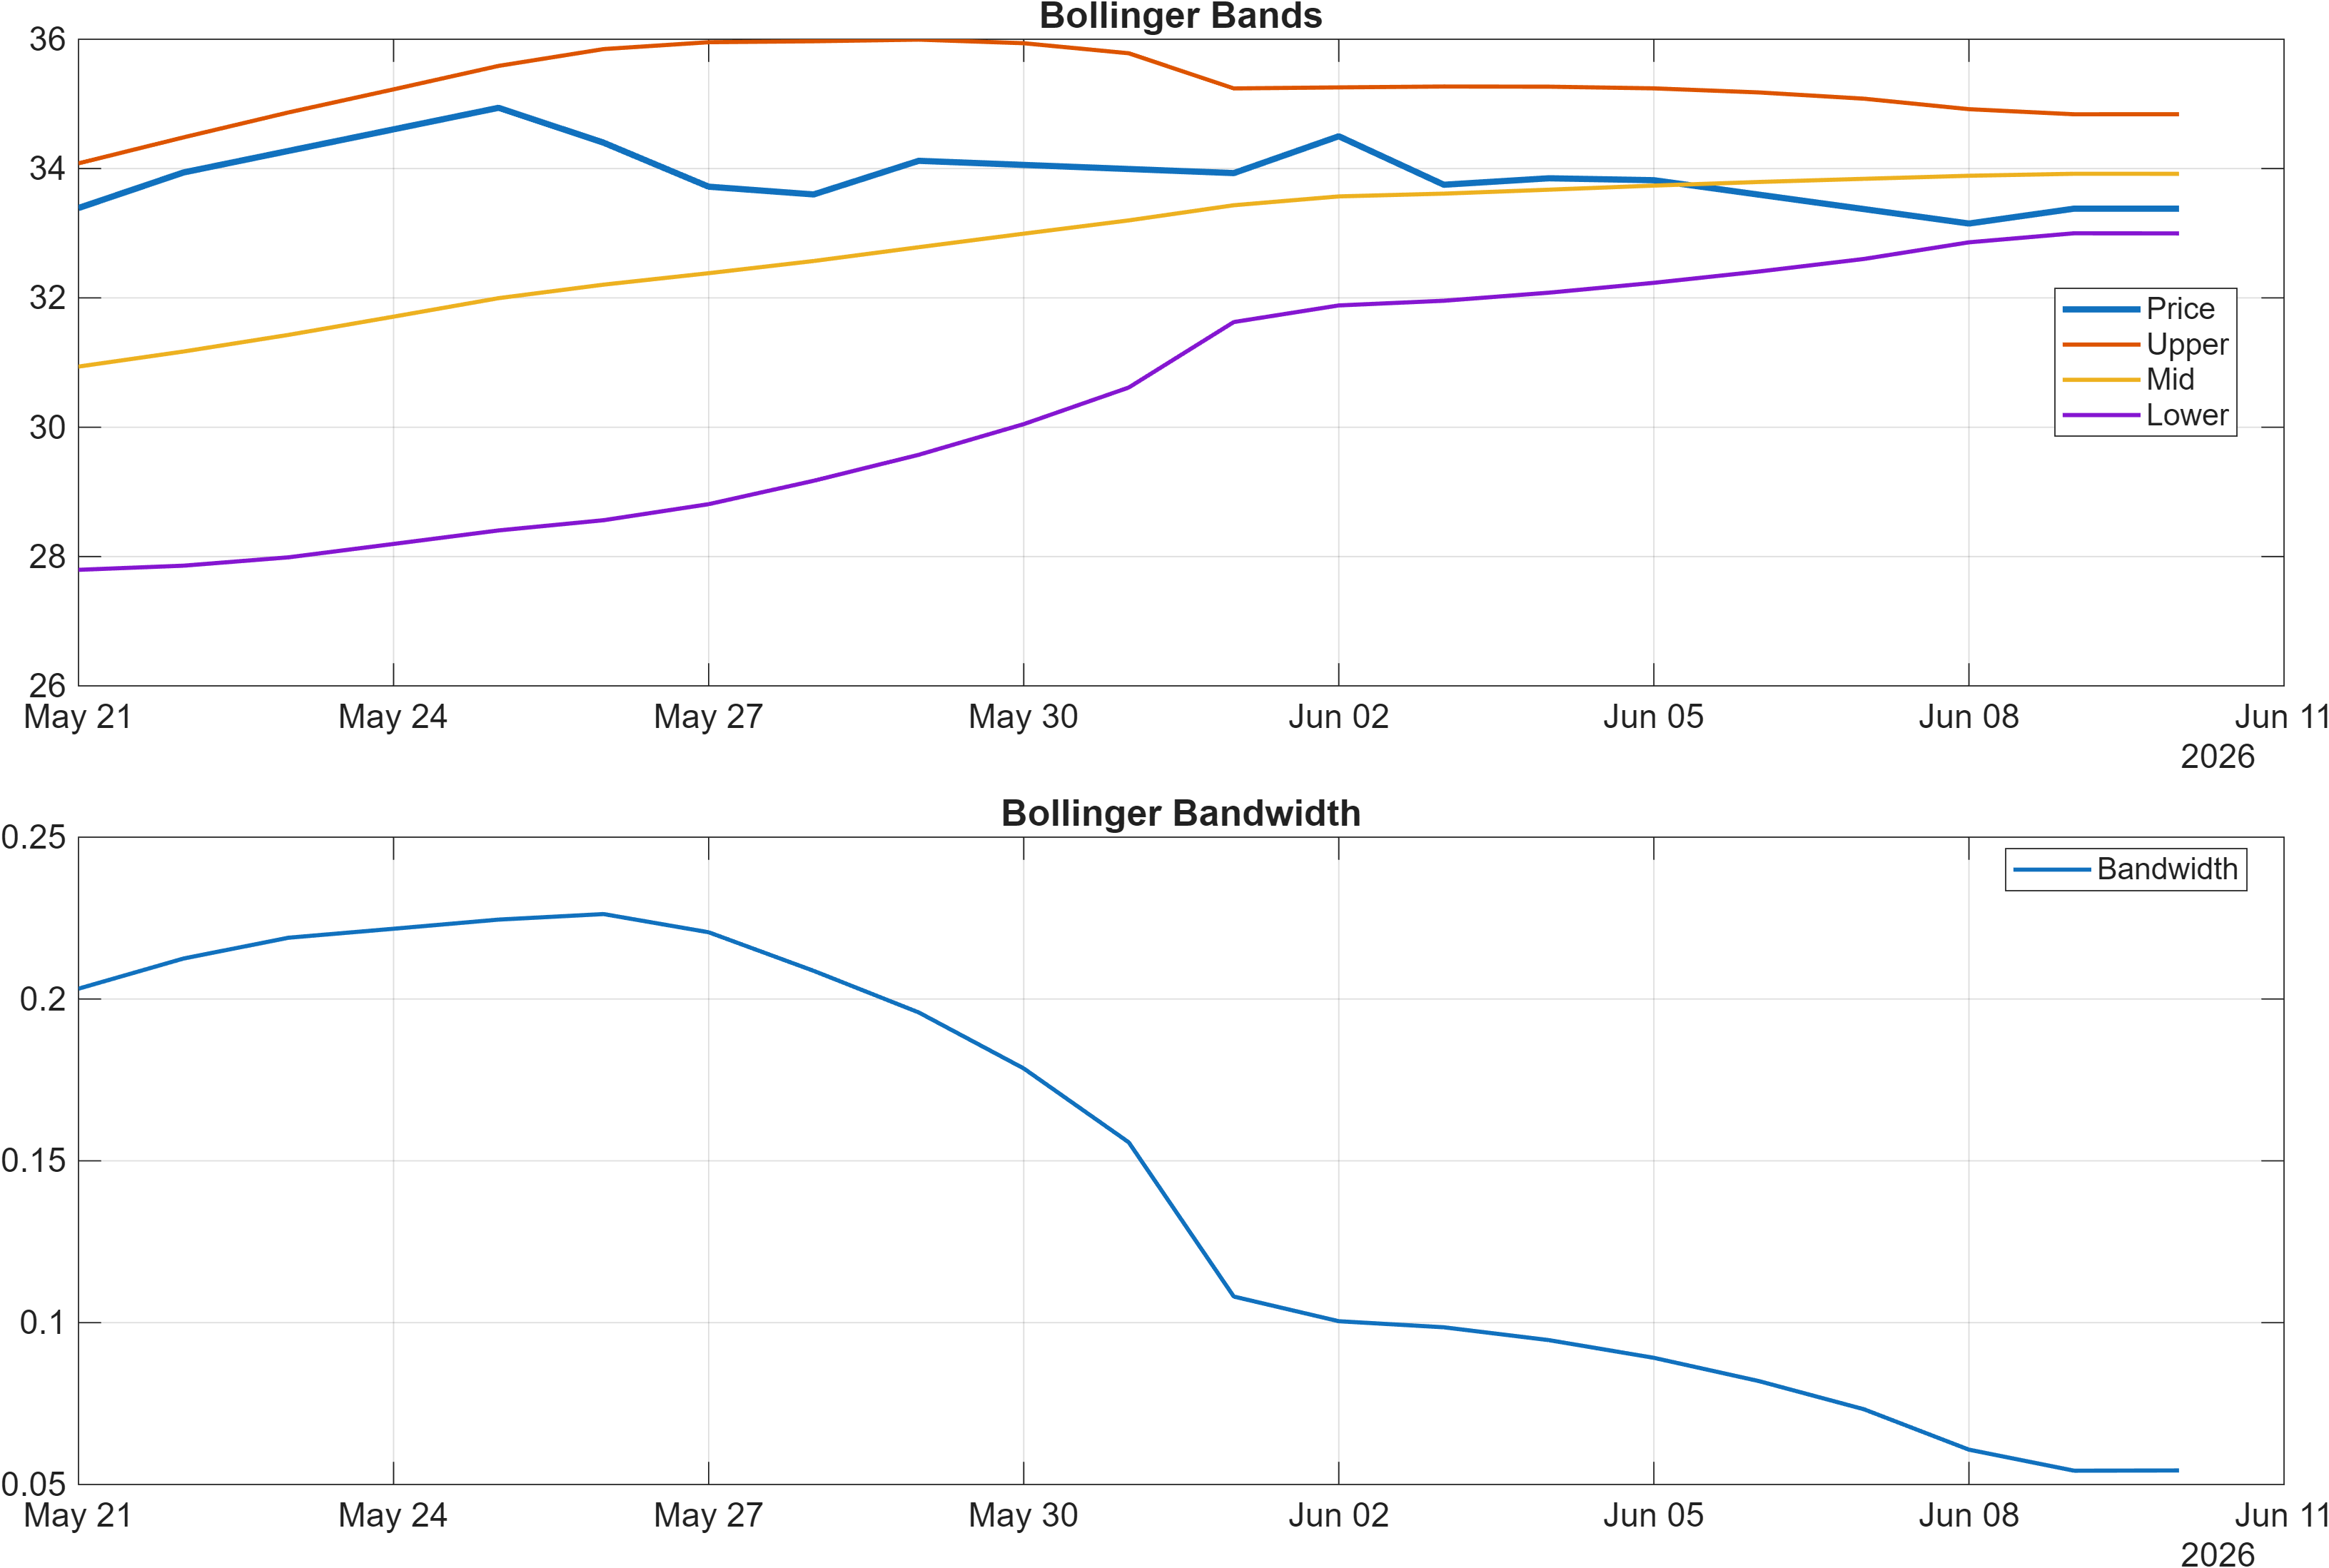
Volatility conditions reinforce a consolidation regime. Bollinger Bandwidth at 0.0543 is low enough to suggest compression rather than expansion—often a precondition for a larger directional move, but not a directional signal by itself. Notably, the signal table flags BB Width 0.05434 as bullish, which can reflect a setup where tightening bands precede breakout attempts.
Internally, several rate-of-change style measures lean negative (for example ROC(20) at -1.65 and TS Mom(20) at -0.56 are bearish), while at least one oscillator shows potential mean-reversion support (Stoch %K at 11.5 is bullish). This combination is typical when price is sliding within a broader range: oscillators become “oversold” before trend tools turn. The practical implication is that momentum is not uniformly aligned, so confirmation should come from either (a) MACD/RSI improving together, or (b) volatility expanding in the direction of a break through the defined price levels.
4) Support / Resistance zones
Support ~ 28.8050 | Resistance ~ 34.4650
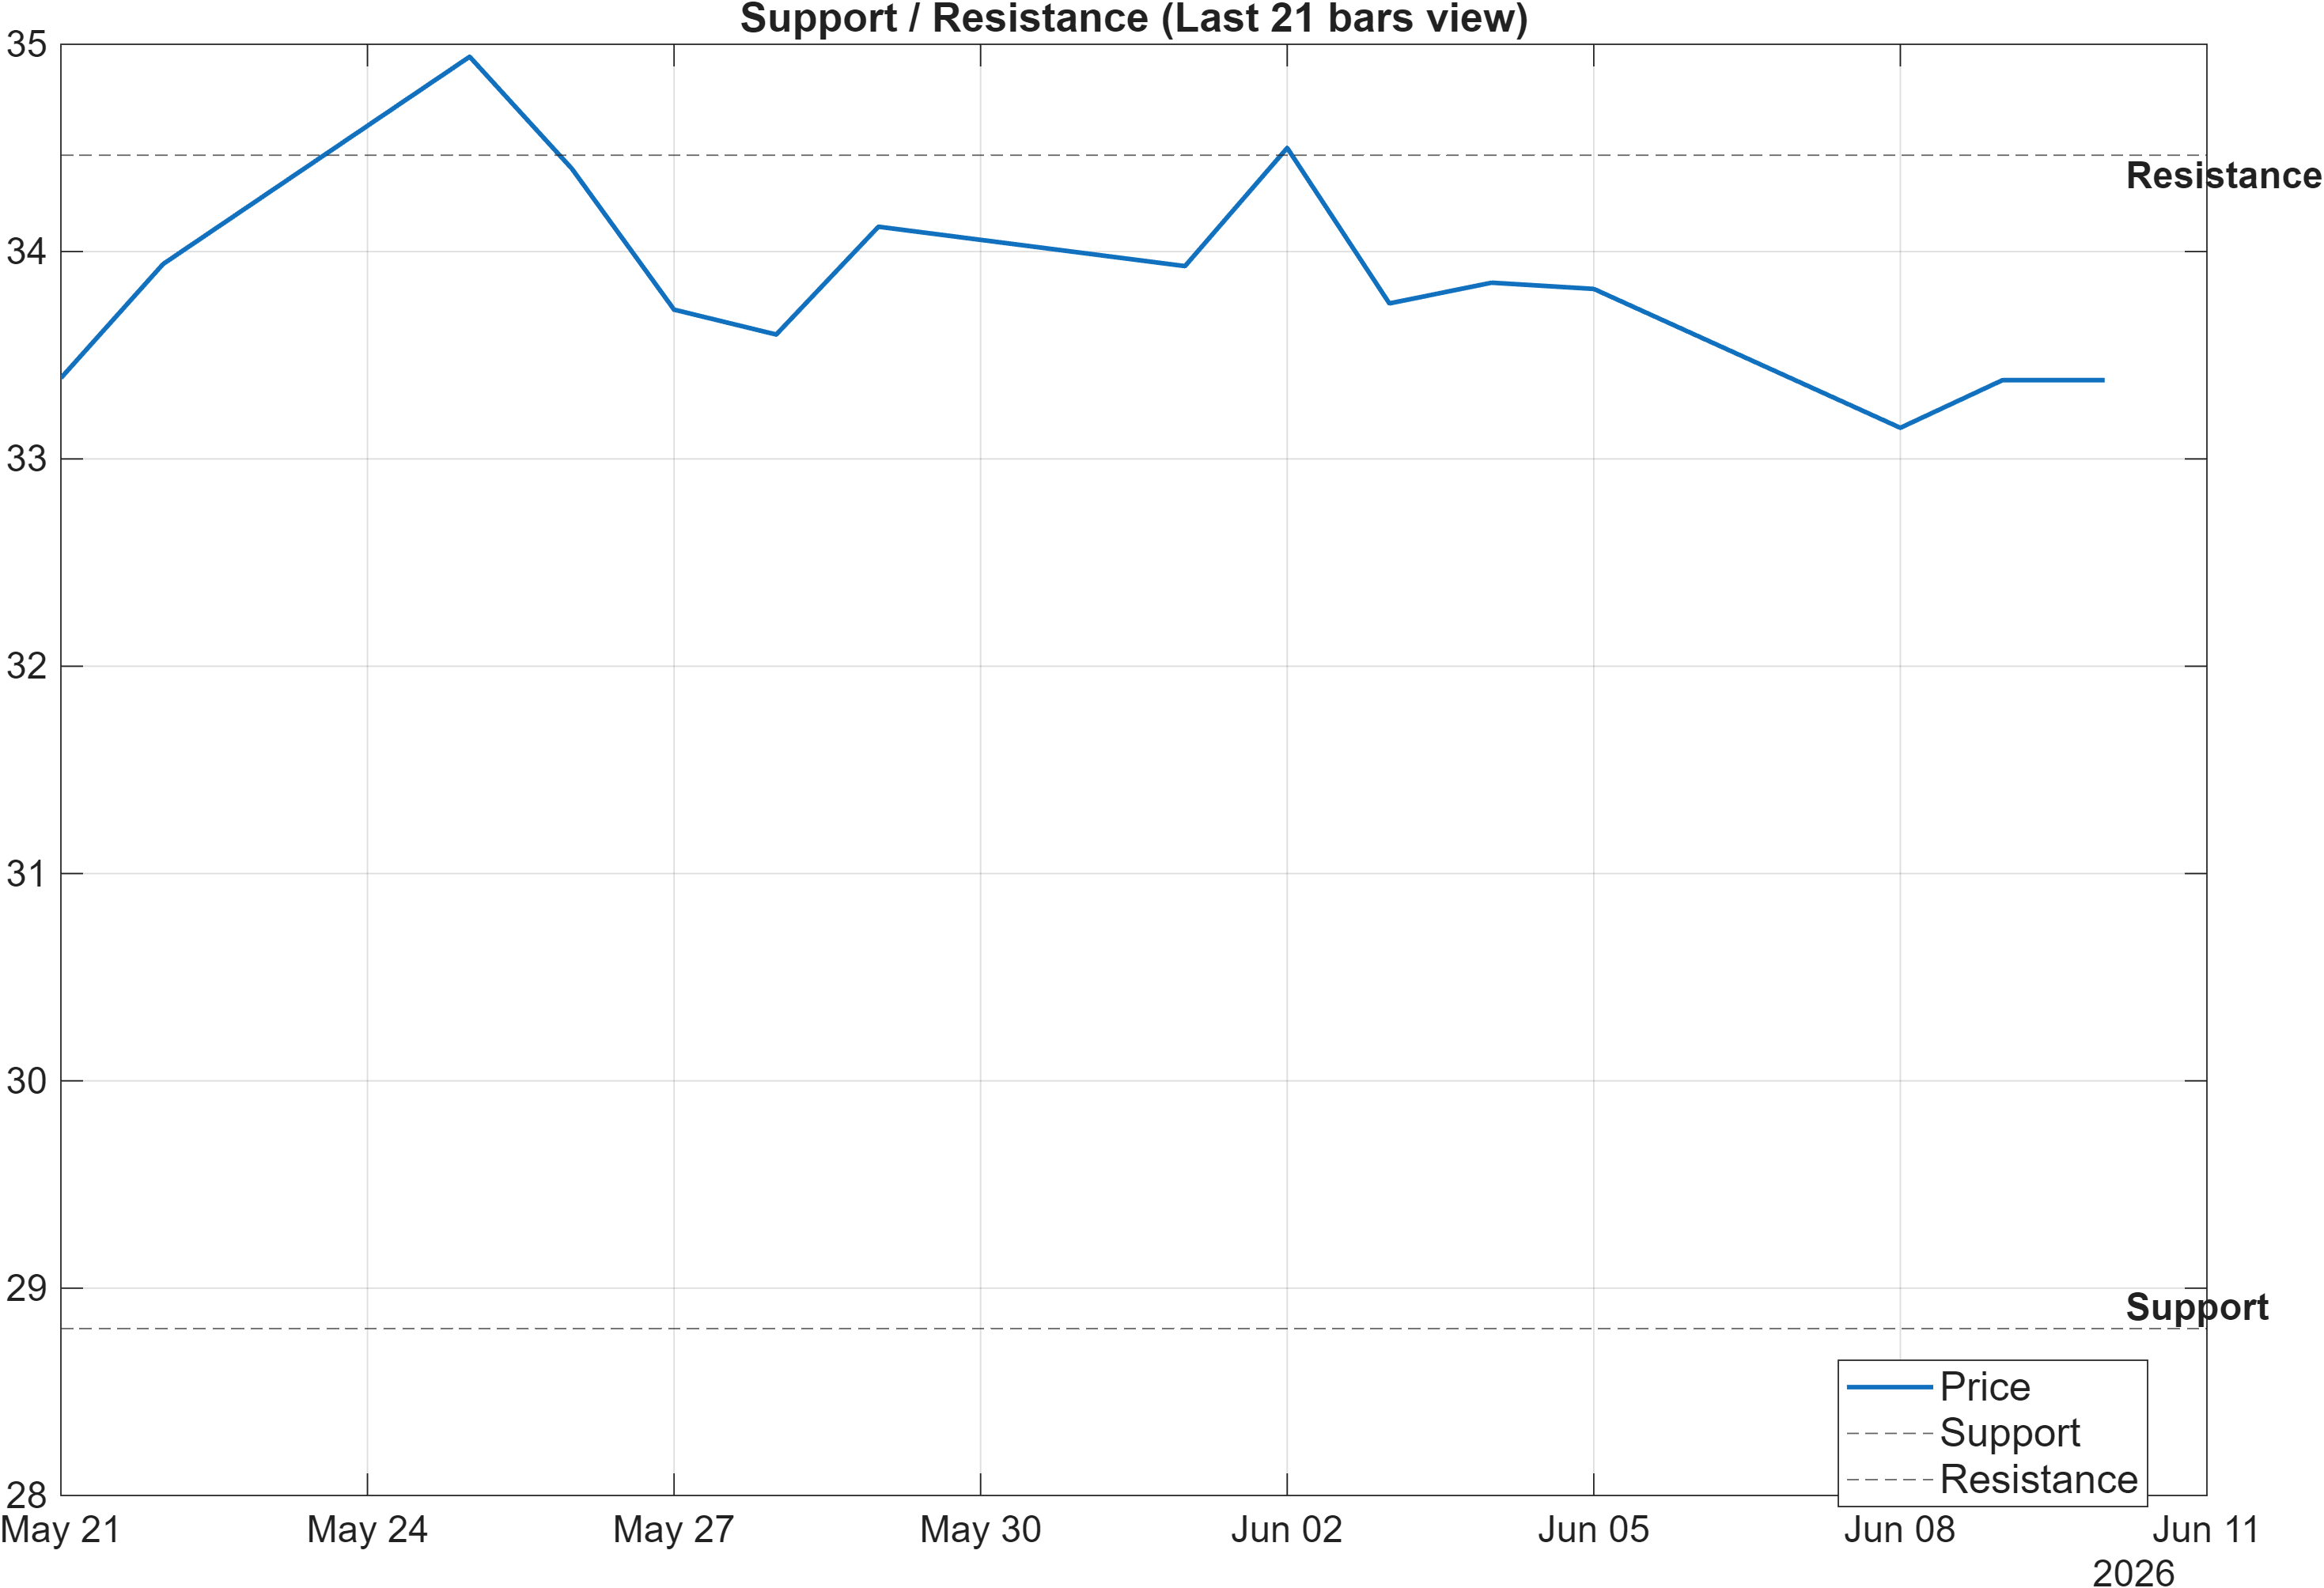
The level map is relatively clean, which helps when trend signals disagree. 28.8050 functions as the primary support reference; below it, the report explicitly flags “signal deterioration risk,” aligning with the weaker longer-horizon ranks (#1120 at 6-month and #1259 yearly). In that context, a decisive close below support would be read less as noise and more as alignment toward the longer-term weak regime.
On the upside, 34.4650 is the key resistance gate. A break above that level “with volume” is the scenario condition for continuation. This volume qualifier matters because the volatility state is compressed (Bandwidth 0.0543), and compressed markets can produce frequent false breaks without participation. Therefore, the quality of acceptance above resistance—rather than a brief intraday push—becomes the signal.
The signal table adds useful context for where price sits within its recent distribution: HHIGH(20) at 35.15 and LLOW(20) at 33.15 are marked neutral, implying nearby reference points that can cluster with resistance behavior. Meanwhile, “MedPx vs Support” is 4.82 (bullish), suggesting price has not been pressing the support zone imminently; that supports the idea of a mid-range negotiation where break conditions—either above 34.4650 or below 28.8050—carry disproportionate informational value.
5) Quant Technical Dashboard (18 Signals)
KGNAI AI Technical Analysis Score (Deep Reinforcement Learning): Rank #614 out of 1396 (Rank 1 represents the strongest technical positioning and a higher probability of favorable price behavior. As ranks increase toward the maximum, the probability of favorable outcomes weakens and bearish positioning becomes more dominant.) | Label: Neutral | Score: 0.120
18-Signal Technical Confluence Score: -0.389 (Bearish)
Overall Technical Score (18-signal confluence + DRL rank blend): -0.236 (Neutral)
Note: The blended score reflects signal strength weighted against broader AI technical ranking, which may temporarily diverge.
Blended technical score breakdown: -0.236 (Neutral | Bull 4 / Bear 11 / Neutral 3)
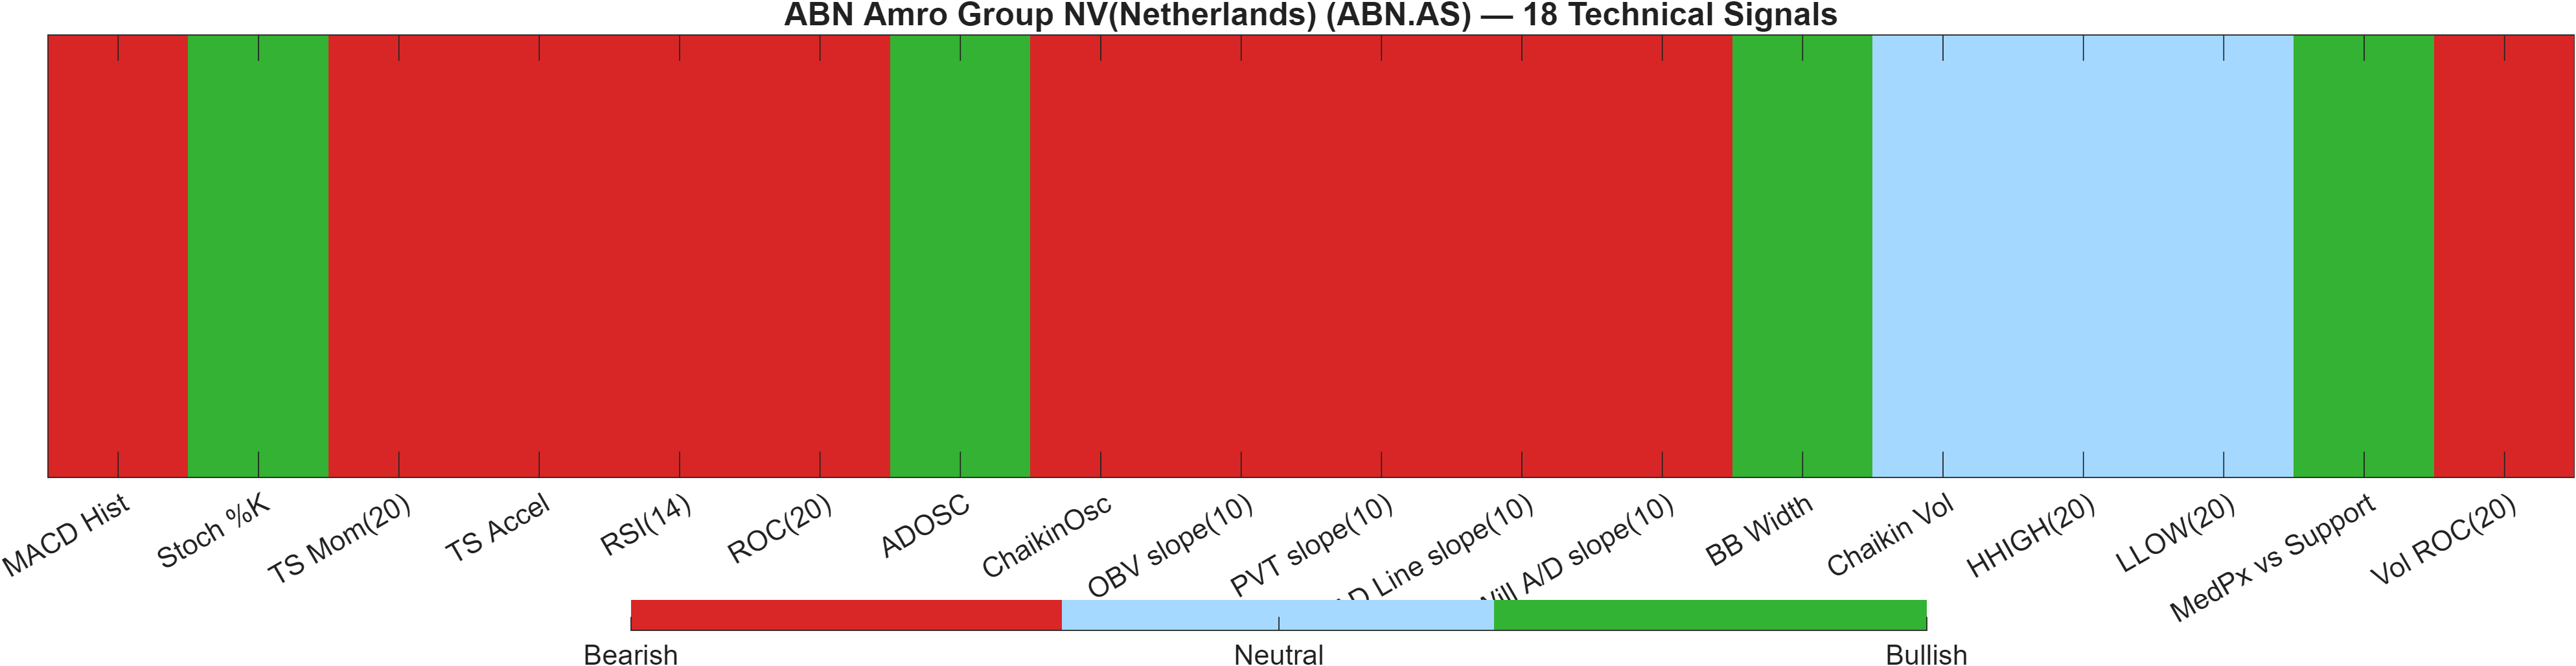
The technical stack is best characterized as bearish breadth with a neutral overlay. On the one hand, the 18-signal confluence score is -0.389, and the breakdown shows 11 bearish vs 4 bullish signals—an imbalanced structure that usually indicates more headwinds than tailwinds. Several components are consistent with this: MACD histogram -0.2371 (bearish) and Vol ROC(20) -27.08 (bearish) suggest momentum and participation are not broadly supportive.
On the other hand, the reinforcement-learning technical rank is #614 out of 1396 with a Neutral label and a score of 0.120. That rank sits closer to the middle of the universe, which helps explain why the overall blended technical score is -0.236 (Neutral) instead of matching the bearish confluence. In practical terms, the AI blend is signaling that while many indicator-level readings are bearish, the broader technical positioning is not extreme enough to confirm a strongly negative regime.
The bullish minority is informative because it often identifies what would need to expand for the tape to improve. For example, Stoch %K 11.5 (bullish) can flag tactical rebound potential inside consolidation, and ADOSC 40.77 (bullish) points to occasional positive accumulation impulses. The key constraint is that multiple flow/volume slopes (e.g., OBV slope and AD line slope are bearish in the table) are not yet aligned with a durable upside thesis—so improvements tend to require confirmation via price acceptance above resistance or sustained momentum repair (RSI/MACD).
Signal table (Bull/Bear/Neutral)
| Indicator | Value | Signal |
|---|---|---|
| MACD Hist | -0.2371 | Bearish |
| Stoch %K | 11.5 | Bullish |
| TS Mom(20) | -0.56 | Bearish |
| TS Accel | -5.375 | Bearish |
| RSI(14) | 44.65 | Bearish |
| ROC(20) | -1.65 | Bearish |
| ADOSC | 40.77 | Bullish |
| ChaikinOsc | -2.911e+06 | Bearish |
| OBV slope(10) | -4.407e+06 | Bearish |
| PVT slope(10) | -2.452e+04 | Bearish |
| AD Line slope(10) | -1.061e+07 | Bearish |
| Will A/D slope(10) | -2.25 | Bearish |
| BB Width | 0.05434 | Bullish |
| Chaikin Vol | -6.28 | Neutral |
| HHIGH(20) | 35.15 | Neutral |
| LLOW(20) | 33.15 | Neutral |
| MedPx vs Support | 4.82 | Bullish |
| Vol ROC(20) | -27.08 | Bearish |
Interpretation: Indicator-level signals form the base confluence, which is then adjusted using a separate AI-driven technical ranking model. The final technical score summarizes this combined view.
6) News sentiment + extractive gist
Sentiment score (avg): 0.071 | Positive: 24% | Neutral: 71% | Negative: 6%
KGNAI AI News Sentiment Score (normalized -1 to +1): -0.08 (as of 2026-06-09) | Label: Bullish | Overall news score: 0.23
Positive Developments
Recent coverage across major financial outlets indicates a modestly constructive backdrop for ABN AMRO, with emphasis on operational updates and shareholder actions rather than a single dominant narrative. The aggregate distribution is skewed neutral (71%), yet the positive share at 24% suggests supportive context around corporate execution themes. In the KGNAI scoring, the normalized reading is -0.08 while still carrying a Bullish label, which implies the model’s classification is driven by factors beyond raw polarity alone (for example, language patterns associated with stability or improving conditions). This matters because the technical picture is mixed—MACD histogram -0.2371 and RSI 44.65 lean soft—so any constructive sentiment tone is better treated as a stabilizer than as an outright momentum driver. Overall, the news layer is consistent with consolidation: incremental positives exist, but not at a magnitude that would override key price-level confirmation.
Neutral / Mixed Developments
The neutral majority (71%) suggests information flow is currently dominated by updates that are procedural or interpretive, rather than sharply directional. That profile often coincides with the type of price behavior visible in the volatility dashboard: Bollinger Bandwidth at 0.0543 reflects compression where markets can require a trigger to leave the range. With the overall news score at 0.23 and the average sentiment at 0.071, the message is not one of stress but also not one of unambiguous optimism. In a tape where the daily rank (#197) is relatively strong yet longer-term ranks remain weak (#1120 over 6 months), neutral news flow can allow technical levels to govern: support/resistance reactions become the primary decision mechanism rather than narrative repricing.
Negative / Risk Signals
Negative sentiment is limited in share (6%), but it still matters because the technical breadth is already tilted bearish (18-signal confluence -0.389; 11 bearish signals). In that setting, even a small amount of adverse or risk-focused coverage can reinforce the market’s preference to sell rallies near resistance (34.4650) or to test support (28.8050) during periods of weak participation (e.g., Vol ROC(20) -27.08). The key is not the absolute negativity level, but whether risk-themed items coincide with a volatility expansion out of the current compressed regime. If volatility expands while momentum indicators remain negative (MACD histogram -0.2371), downside moves can become more directional; if volatility stays contained, negative items more often translate into short-lived dips inside the broader range.
- Whether sentiment remains predominantly neutral while price tests 34.4650 (risk of rejection vs acceptance).
- Any shift in the negative share from 6% alongside an uptick in volatility from 0.0543 bandwidth.
- Consistency between news tone and tape: improvement in momentum (RSI/MACD) versus continued bearish breadth (11 bear signals).
Sources referenced: Reuters, Bloomberg, Yahoo Finance, MarketWatch, Investing.com
7) Sources
Not available in the provided data.
You may also like: How KGNAI AI ranks instruments across global markets
Disclaimer: KGNAI provides AI-generated analytics and educational market commentary only. This is not financial advice. Markets involve risk. Always do your own research.