NTAP (NetApp Inc) Technical & Sentiment Snapshot — 14-Jun-2026 | Neutral Bias With Mid-Term Strength
NetApp Inc (NTAP) presents a neutral aggregate setup as of 14-Jun-2026, with cross-timeframe ranks showing constructive mid-term positioning but a less aligned short/long profile. Within a 2046-instrument U.S. universe, the 3-month rank (#21) and monthly rank (#77) sit in the upper tier, while weekly (#657) and yearly (#695) read as more average. Technically, the moving-average structure is supportive (close above MA50; MA50 above MA200), yet momentum and participation are more conflicted: RSI(14) at 29.43 flags bearish momentum conditions while MACD histogram at -3.0383 indicates negative impulse. Volatility, via Bollinger Bandwidth at 0.3017, suggests a defined but not extreme regime. Key decision zones remain support ~106.4700 and resistance ~179.9750. News sentiment is constructive on scoring, but price/indicator conflict keeps the stance disciplined rather than directional.
Key Takeaways
- Rank stance: Short-term Neutral | Mid-term Bullish | Long-term Neutral (notably strong 3-month rank #21, weaker yearly #695).
- Technical confluence: Neutral (18-signal confluence -0.167; blended overall -0.014).
- Key levels: Support ~106.4700 | Resistance ~179.9750.
- News sentiment bias: Slightly constructive by model scoring (avg sentiment 0.102; normalized score 1.00), but monitor confirmation in price/volume.
- Confirmation / invalidation: Continuation improves on a break above 179.9750 with volume; deterioration risk increases on a close below 106.4700.
What KGNAI Measures
KGNAI evaluates assets using large cross-sectional datasets built from millions of structured data points. Inputs incorporate fundamental metrics, technical structures, and systematically processed news sentiment. Statistical models, machine learning, and AI frameworks are used to assess relative positioning, signal alignment, and probabilistic behavior across broad universes.
How to Read This Report
- Ranks are comparative across the tracked universe, not absolute price targets.
- Confluence reflects alignment among independent signal groups.
- Support/resistance levels are probabilistic decision zones, not guarantees.
- Sentiment provides contextual bias within the broader analytical framework.
KGNAI Signal + Technical Snapshot + News Sentiment Digest
As of: 14-Jun-2026
Ticker: NTAP
1) KGNAI AI Analysis
Region: USA
Total universe size: 2046 ranked instruments
- Daily rank: #310 out of 2046 — Bullish
- Weekly rank: #657 out of 2046 — Neutral
- Monthly rank: #77 out of 2046 — Bullish
- 3-Monthly rank: #21 out of 2046 — Bullish
- 6-Monthly rank: #537 out of 2046 — Neutral
- Yearly rank: #695 out of 2046 — Neutral
Cross-horizon ranking is mixed rather than uniformly trending. The strongest signal sits in the intermediate window, where 3-month (#21) and monthly (#77) ranks place NTAP in the upper cohort of the 2046-instrument universe—consistent with a regime that has recently been rewarded by the broader cross-sectional model.
By contrast, the weekly rank (#657) implies weaker near-term relative behavior, and the yearly rank (#695) points to a more average long-run posture. This spread often reflects a market that is digesting prior gains or transitioning from momentum-driven behavior to a more selective phase. The daily rank (#310) being bullish while weekly remains neutral reinforces that the most recent tape may be stabilizing, but confirmation has not yet propagated through the next-higher timeframe.
The practical implication is less about direction and more about timeframe selection: mid-term models are aligned positively, while short-term models are less consistent. This is coherent with a technical dashboard later in the report that blends to neutral despite a constructive moving-average backdrop—suggesting the current state is better described as positioning with friction than a clean trend signal.
KGNAI ranks each instrument across large universes using multiple proprietary AI tests and statistical models (millions of data points). Lower ranks generally indicate stronger probability of favorable performance behavior, while higher ranks indicate weaker probability and more bearish positioning.
Term view: Short-term: Neutral. Mid-term: Bullish. Long-term: Neutral.
Want the full universe and complete rank tables? Unlock full access on KGNAI: https://www.kgnai.com/pricing
2) Price & trend overview
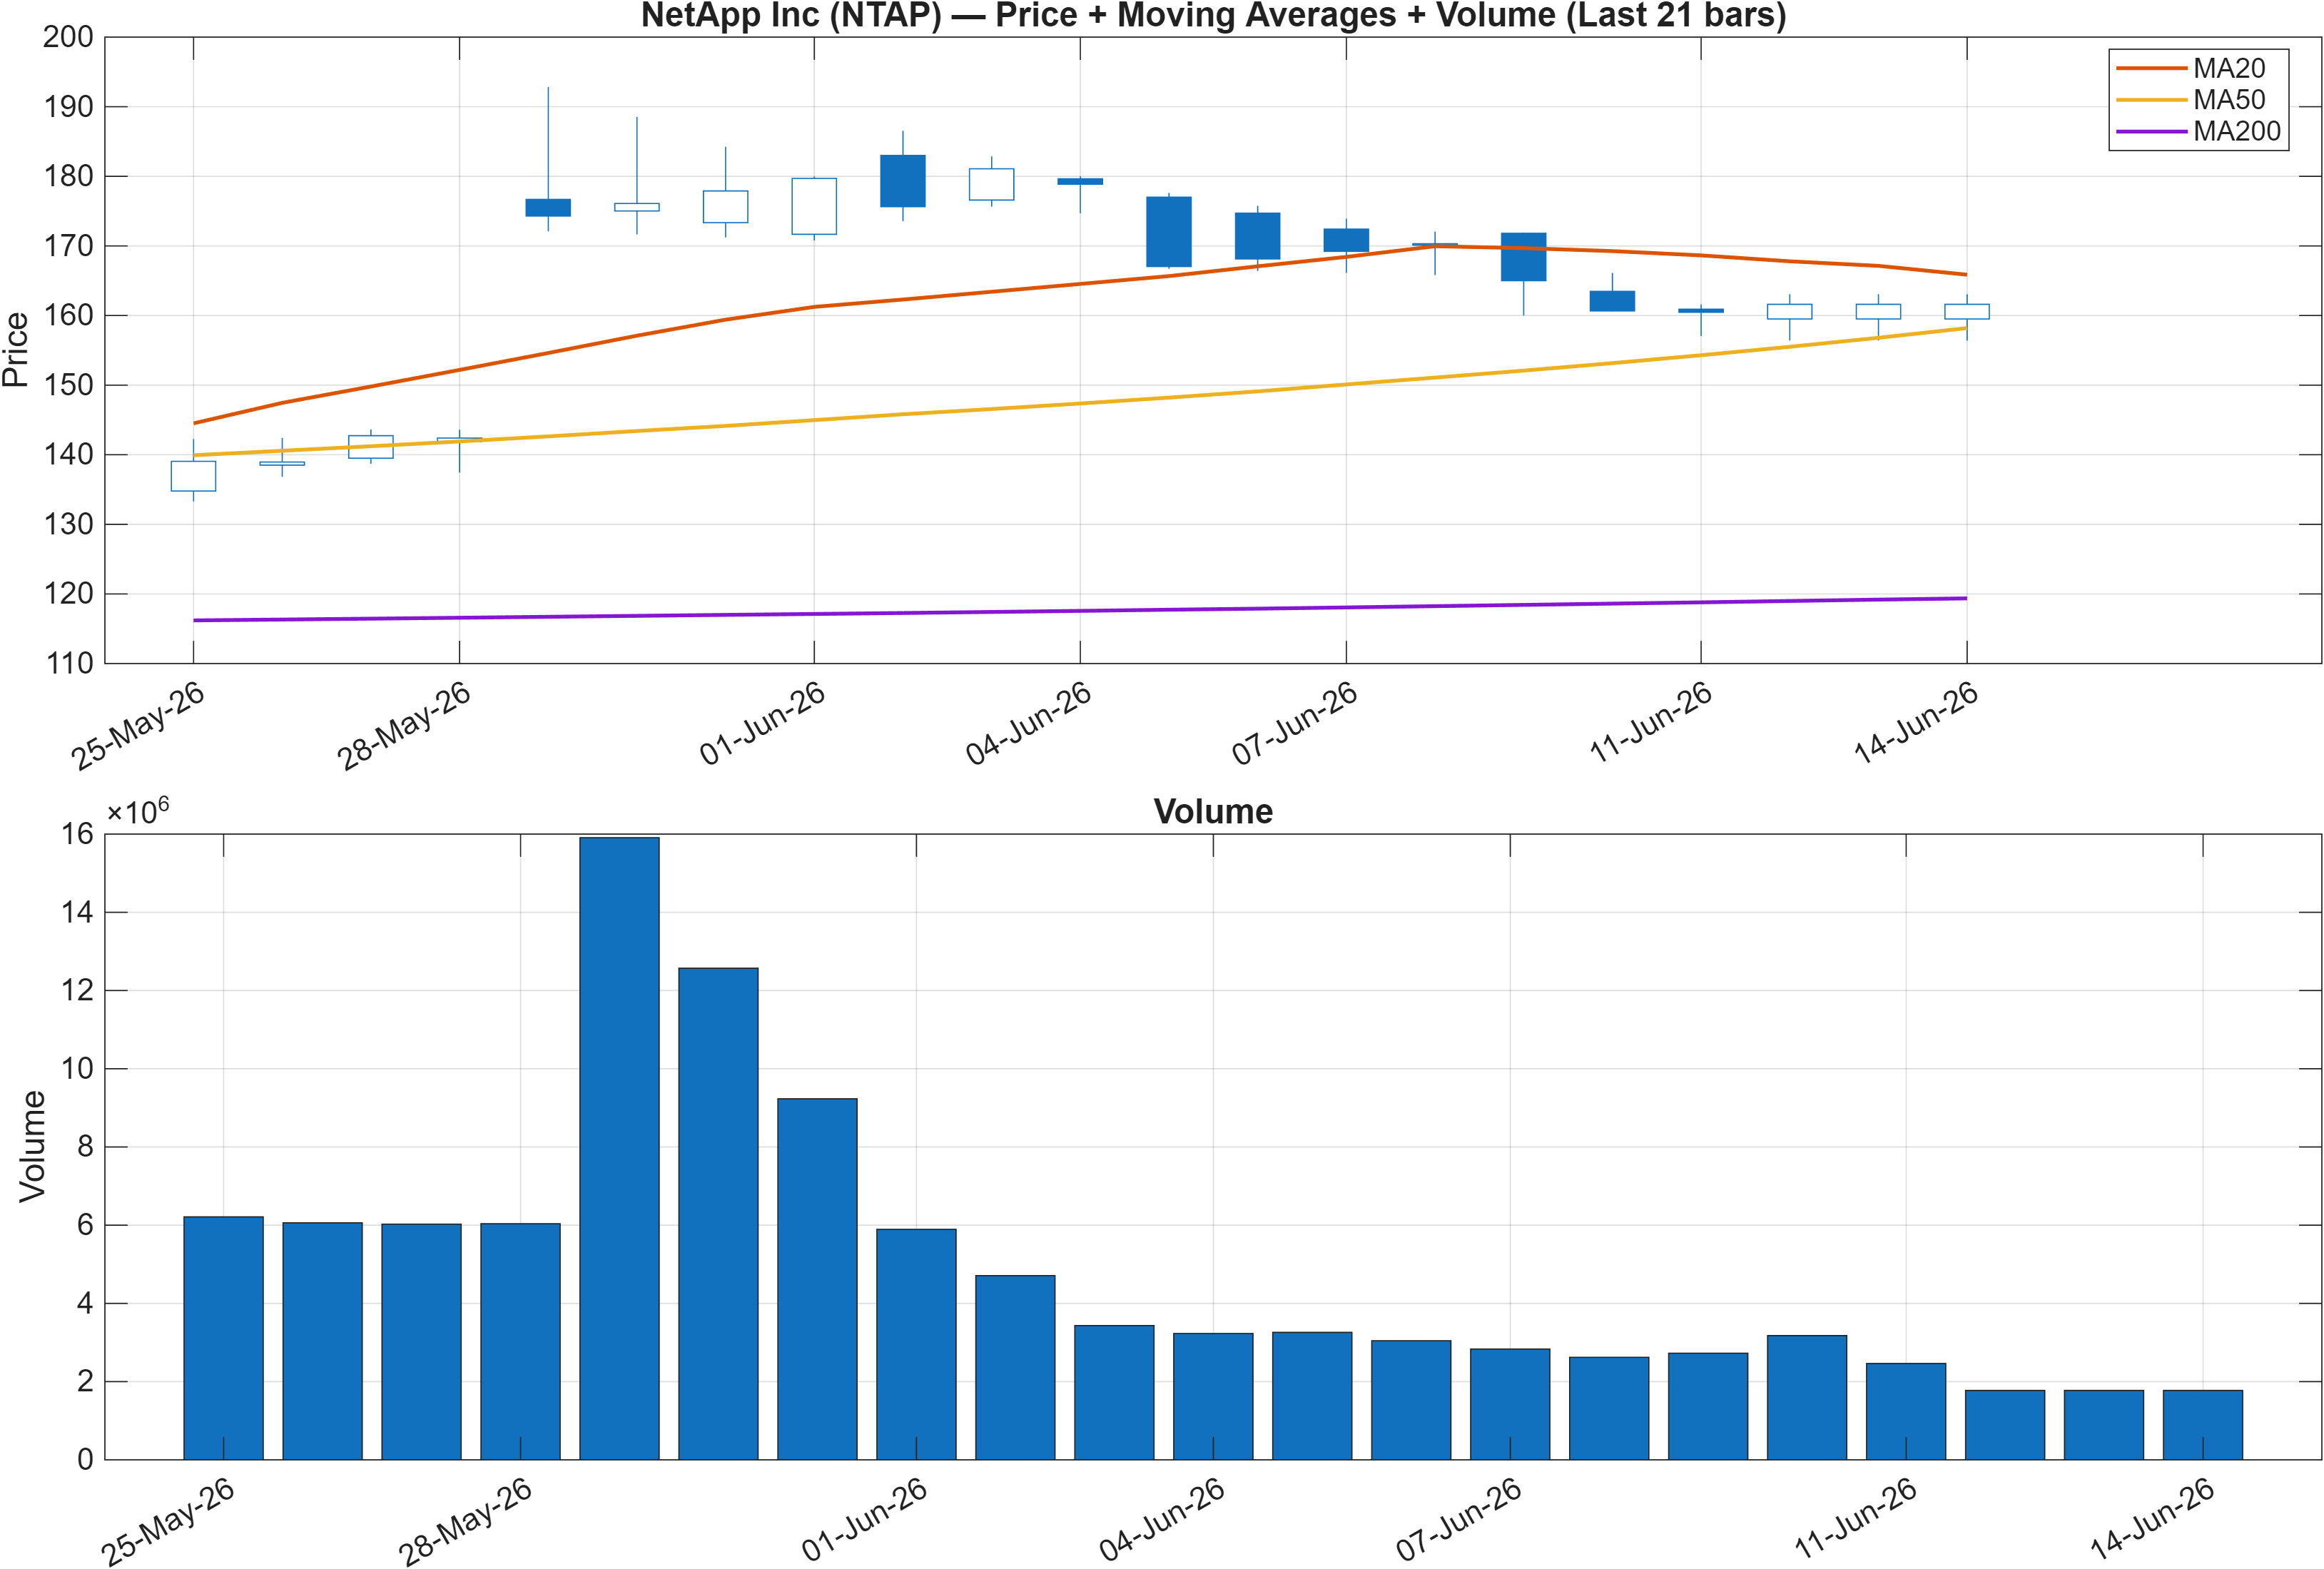
Interpretation: Close vs MA50 = Bullish, MA50 vs MA200 = Bullish.
Trend structure vs momentum condition
The moving-average configuration is clearly supportive: price is above MA50 and MA50 is above MA200. In classical trend terms, this is consistent with an uptrend architecture that tends to favor trend-following behavior, especially when it persists across multiple weeks.
However, this trend backdrop should be read alongside other parts of the dashboard that are less accommodative. The momentum panel flags a bearish RSI bias and a negative MACD histogram (-3.0383), which can occur when a broader trend is intact but the market is experiencing a pullback or consolidation within that trend. When that happens, breakouts often require renewed participation rather than relying on the moving averages alone.
Volume is included in the figure for context, and the signal table later adds a constraint: Vol ROC(20) at -70.72 points to waning activity relative to the recent baseline. In setups where the trend remains positive but participation cools, upside continuation tends to be more sensitive to inflection points around resistance and to whether volume expands as price attempts to lift.
Overall, the chart reads as trend-constructive but not frictionless: trend structure is bullish, while secondary conditions (momentum and activity) lean toward a “prove it” phase.
3) Momentum & volatility dashboard
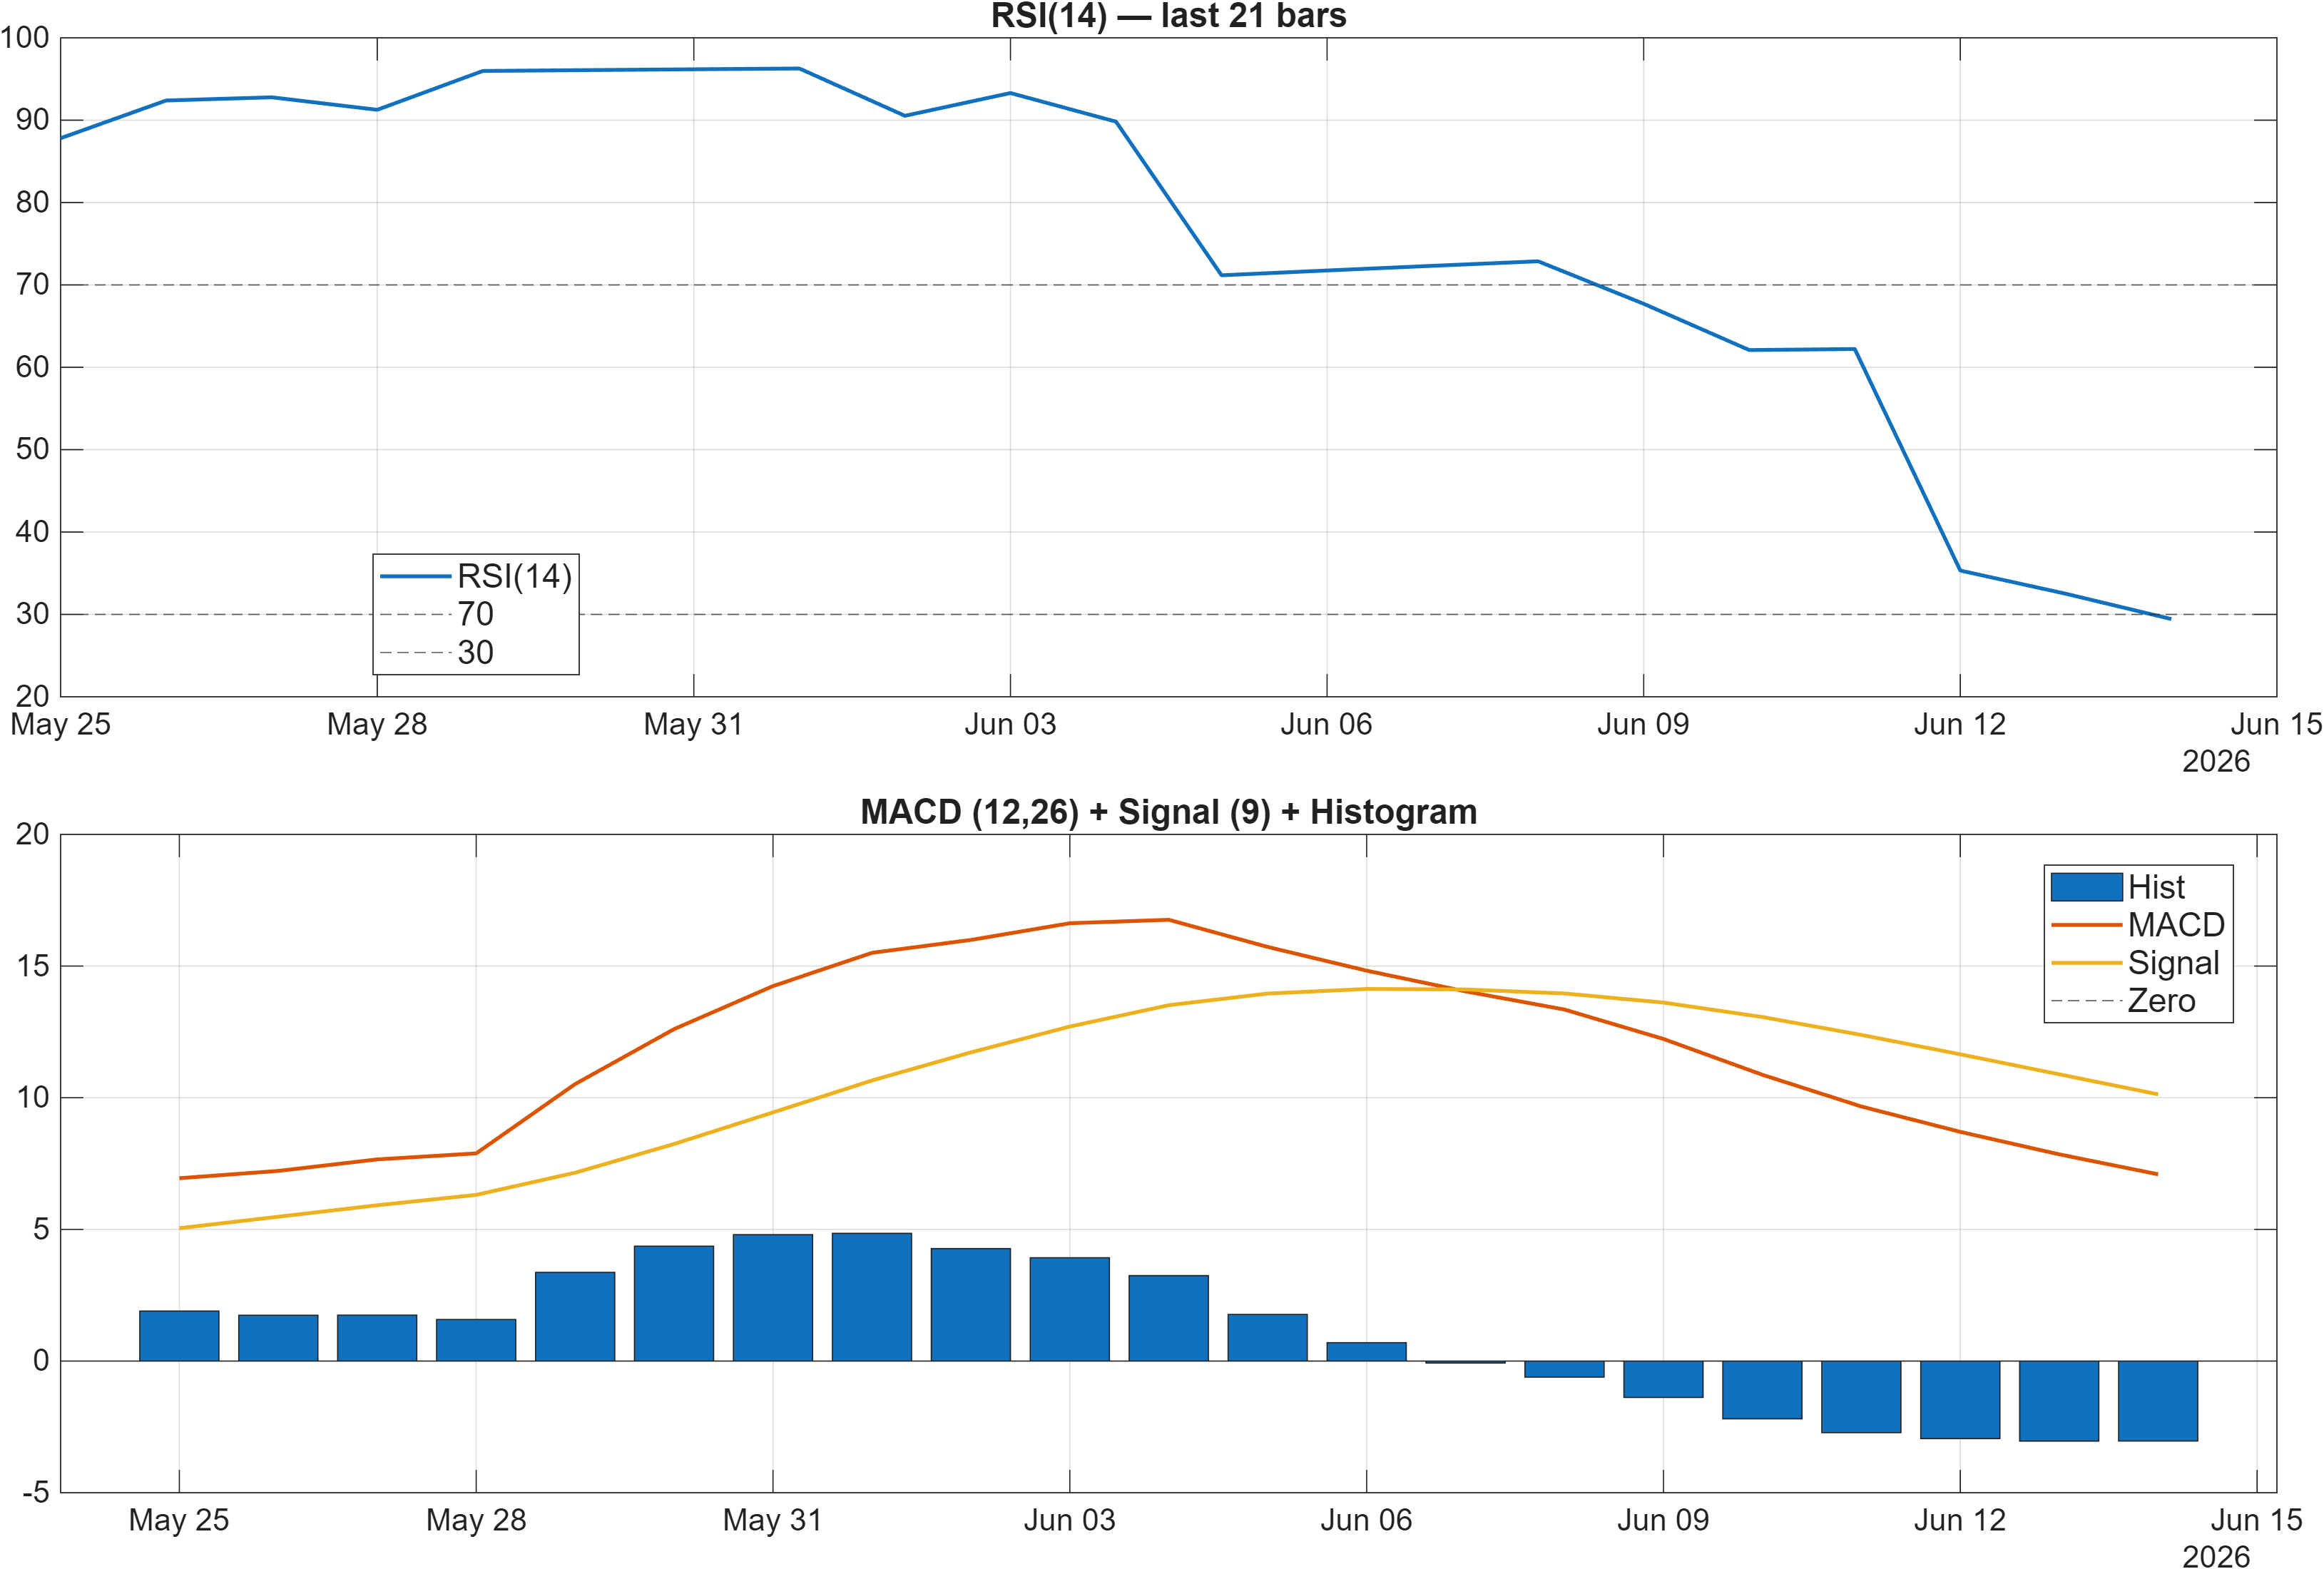
Interpretation: RSI bias = Bearish, MACD hist = -3.0383.
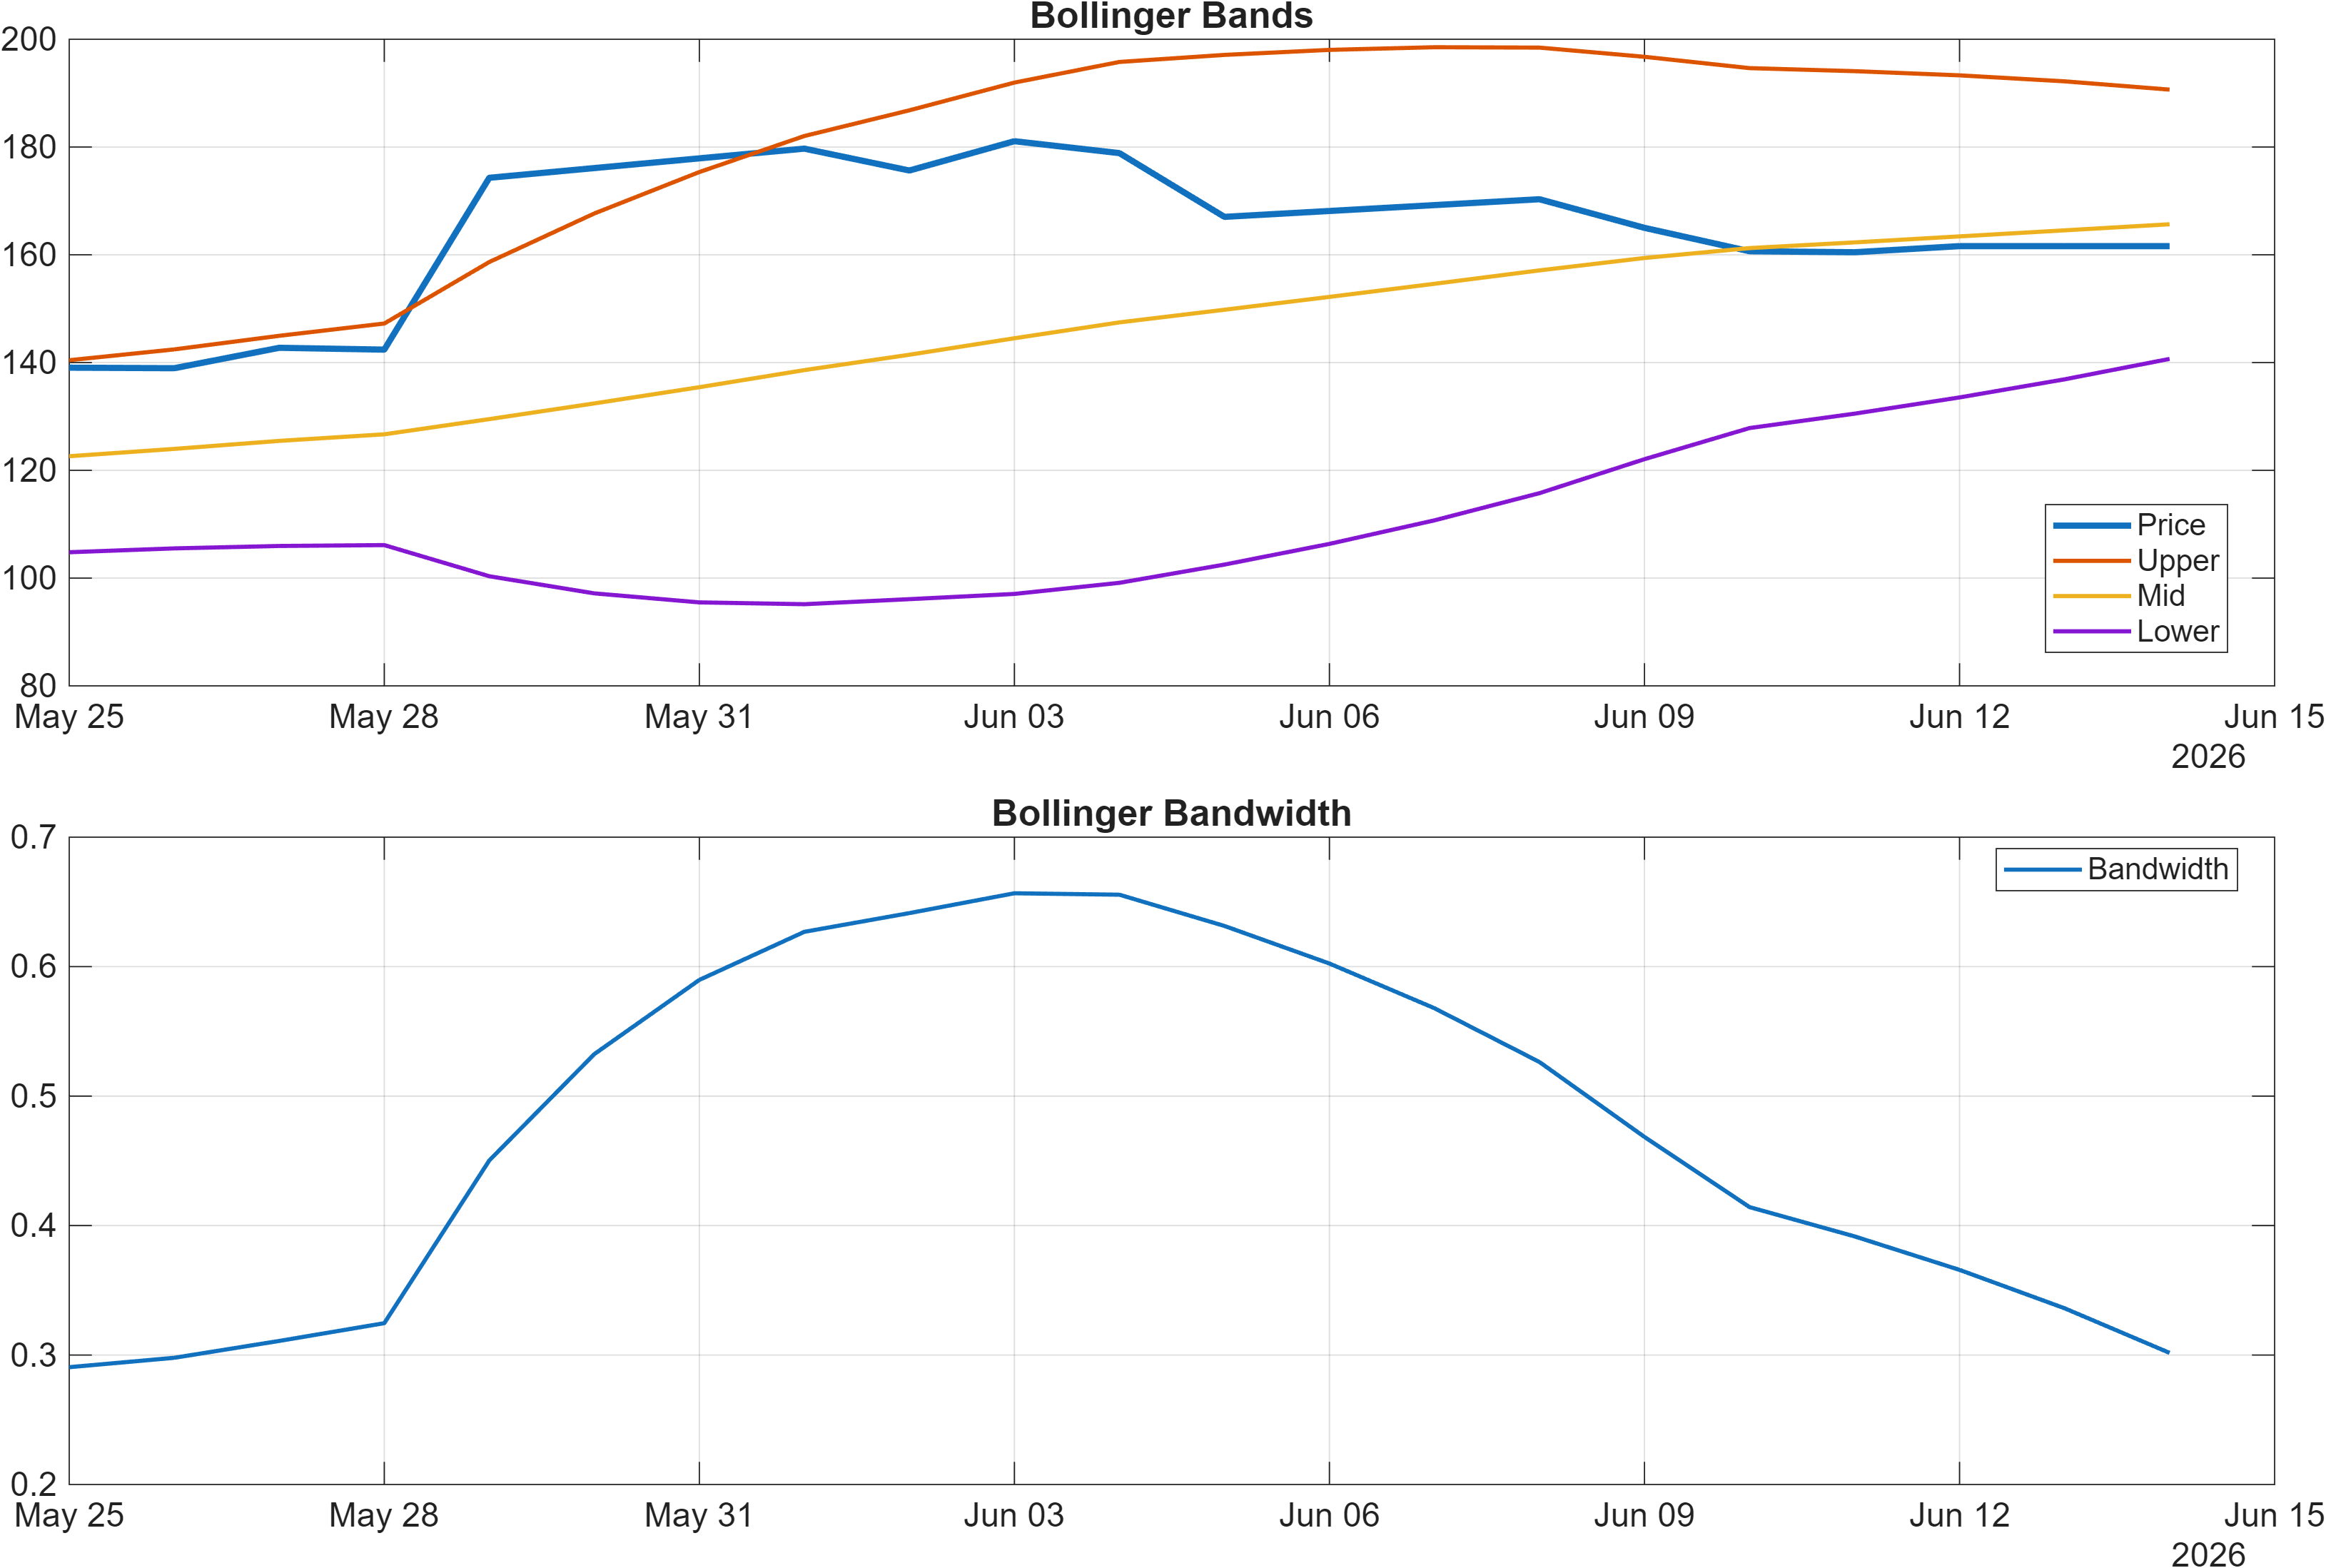
Interpretation: Bandwidth (volatility regime) latest = 0.3017.
Momentum divergence and volatility regime
The momentum complex is the main source of near-term caution. RSI(14) at 29.43 is flagged bearish, and the MACD histogram at -3.0383 indicates negative impulse. In combination, this is consistent with a market that has recently experienced downside pressure even if the broader moving-average structure remains constructive.
Importantly, the signal table shows both constructive and restrictive momentum elements at once. For example, ROC(20) at 16.31 and TS Mom(20) at 22.66 are bullish, while TS Accel at -3.29 is bearish. That mix typically fits a “decelerating advance” profile: prior gains remain visible in rate-of-change, but the most recent acceleration is negative.
Volatility context helps frame how quickly this can resolve. With Bollinger Bandwidth at 0.3017 (neutral), the regime looks neither compressed to an extreme nor signaling an outsized expansion event by itself. In practice, that implies a higher likelihood of a range-to-trend decision being driven by price acceptance around key levels rather than a pure volatility squeeze dynamic.
Netting it out: momentum is currently the constraint on the otherwise supportive trend structure, and the volatility backdrop suggests the next directional move may require confirmation rather than being mechanically implied by a volatility signal.
4) Support / Resistance zones
Support ~ 106.4700 | Resistance ~ 179.9750
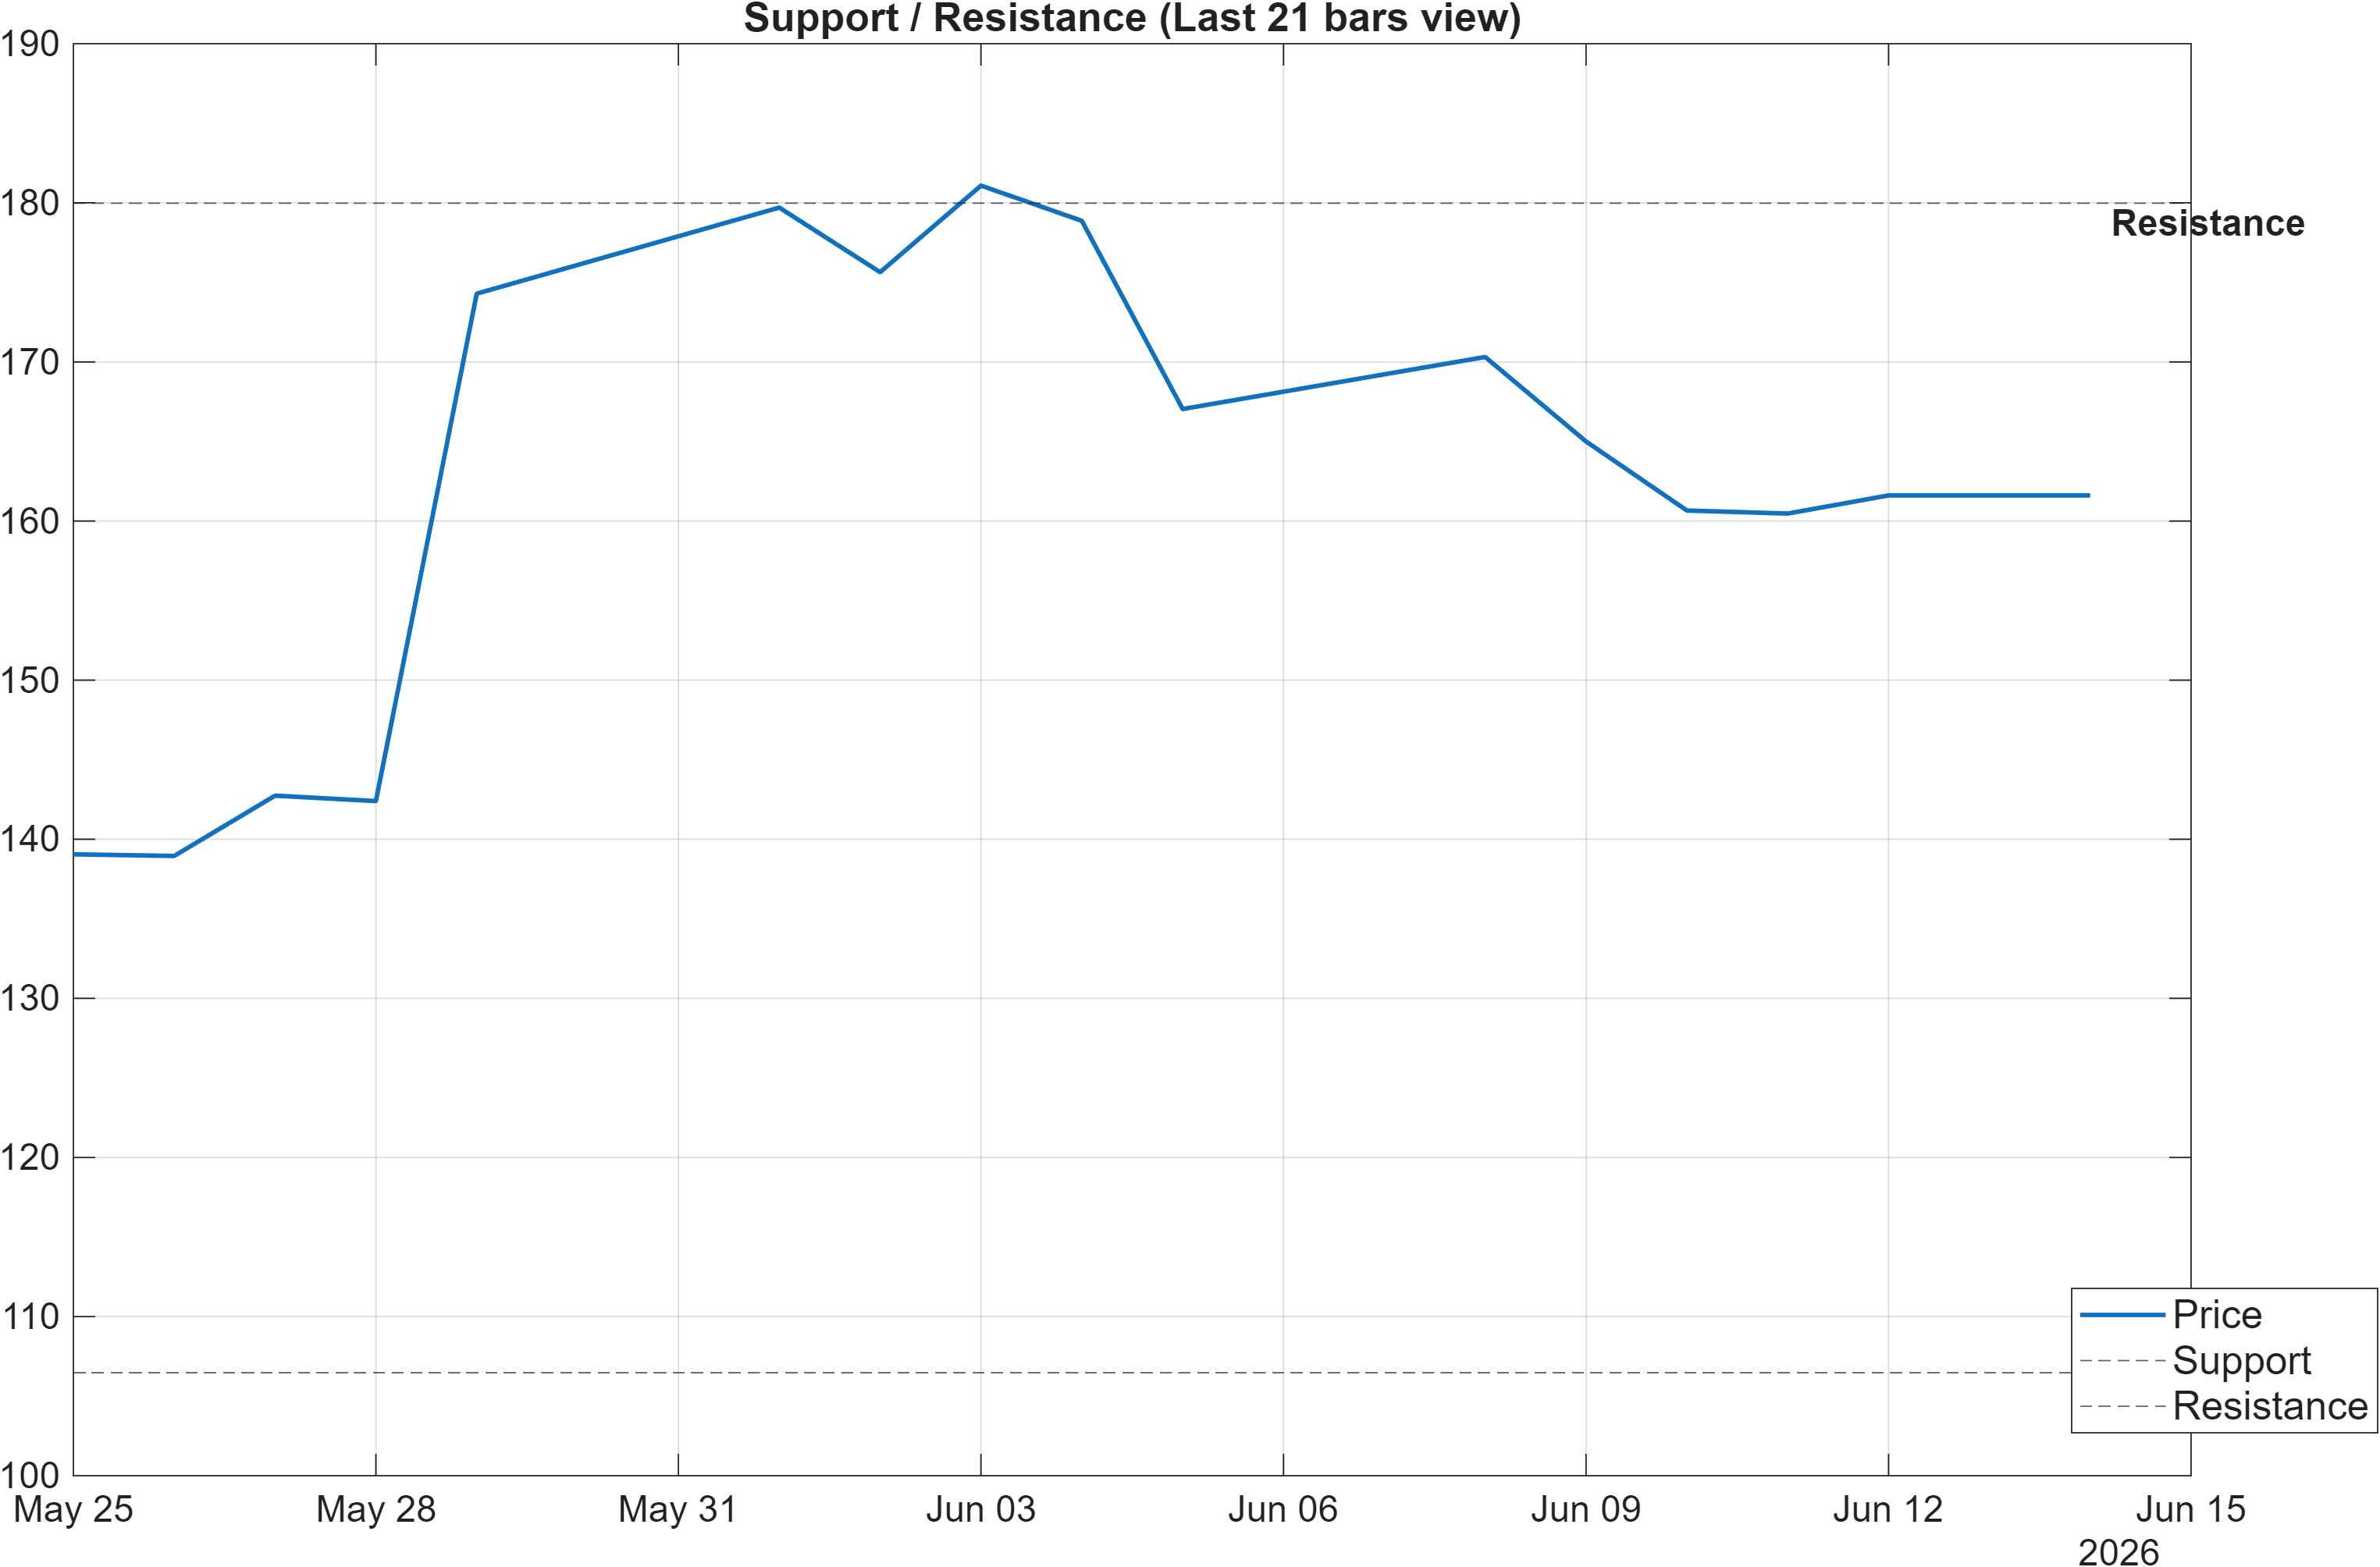
Scenario view: Break above resistance with volume → continuation. Close below support → signal deterioration risk.
Decision zones and validation logic
The current technical state is better managed as a level-driven setup. With a neutral blended technical score (-0.014) and bearish momentum markers (e.g., RSI(14) 29.43), support and resistance become the primary validation checkpoints.
The defined zones—support ~106.4700 and resistance ~179.9750—represent probabilistic areas where positioning can shift quickly. A break above resistance is explicitly conditioned on volume, which aligns with the participation warnings embedded elsewhere (notably Vol ROC(20) at -70.72). Without improving activity, upside moves are more vulnerable to failure even if price briefly trades through a level.
Conversely, a close below support is framed as deterioration risk rather than an automatic regime flip. That distinction matters because the longer moving-average structure remains bullish, and intermediate ranks (such as #21 over 3 months) suggest the broader cross-sectional context has been constructive. A clean breakdown through support would therefore represent a clearer shift: it would align price action with the weaker momentum readings and likely pull confluence further negative.
In neutral confluence regimes, discipline around level acceptance tends to be more informative than indicator micro-moves: watch how price behaves when approaching these zones and whether volume confirms the attempted transition.
5) Quant Technical Dashboard (18 Signals)
KGNAI AI Technical Analysis Score (Deep Reinforcement Learning): Rank #674 out of 2046 (Rank 1 represents the strongest technical positioning and a higher probability of favorable price behavior. As ranks increase toward the maximum, the probability of favorable outcomes weakens and bearish positioning becomes more dominant.) | Label: Neutral | Score: 0.341
18-Signal Technical Confluence Score: -0.167 (Neutral)
Overall Technical Score (18-signal confluence + DRL rank blend): -0.014 (Neutral)
Note: The blended score reflects signal strength weighted against broader AI technical ranking, which may temporarily diverge.
Blended technical score breakdown: -0.014 (Neutral | Bull 5 / Bear 8 / Neutral 5)
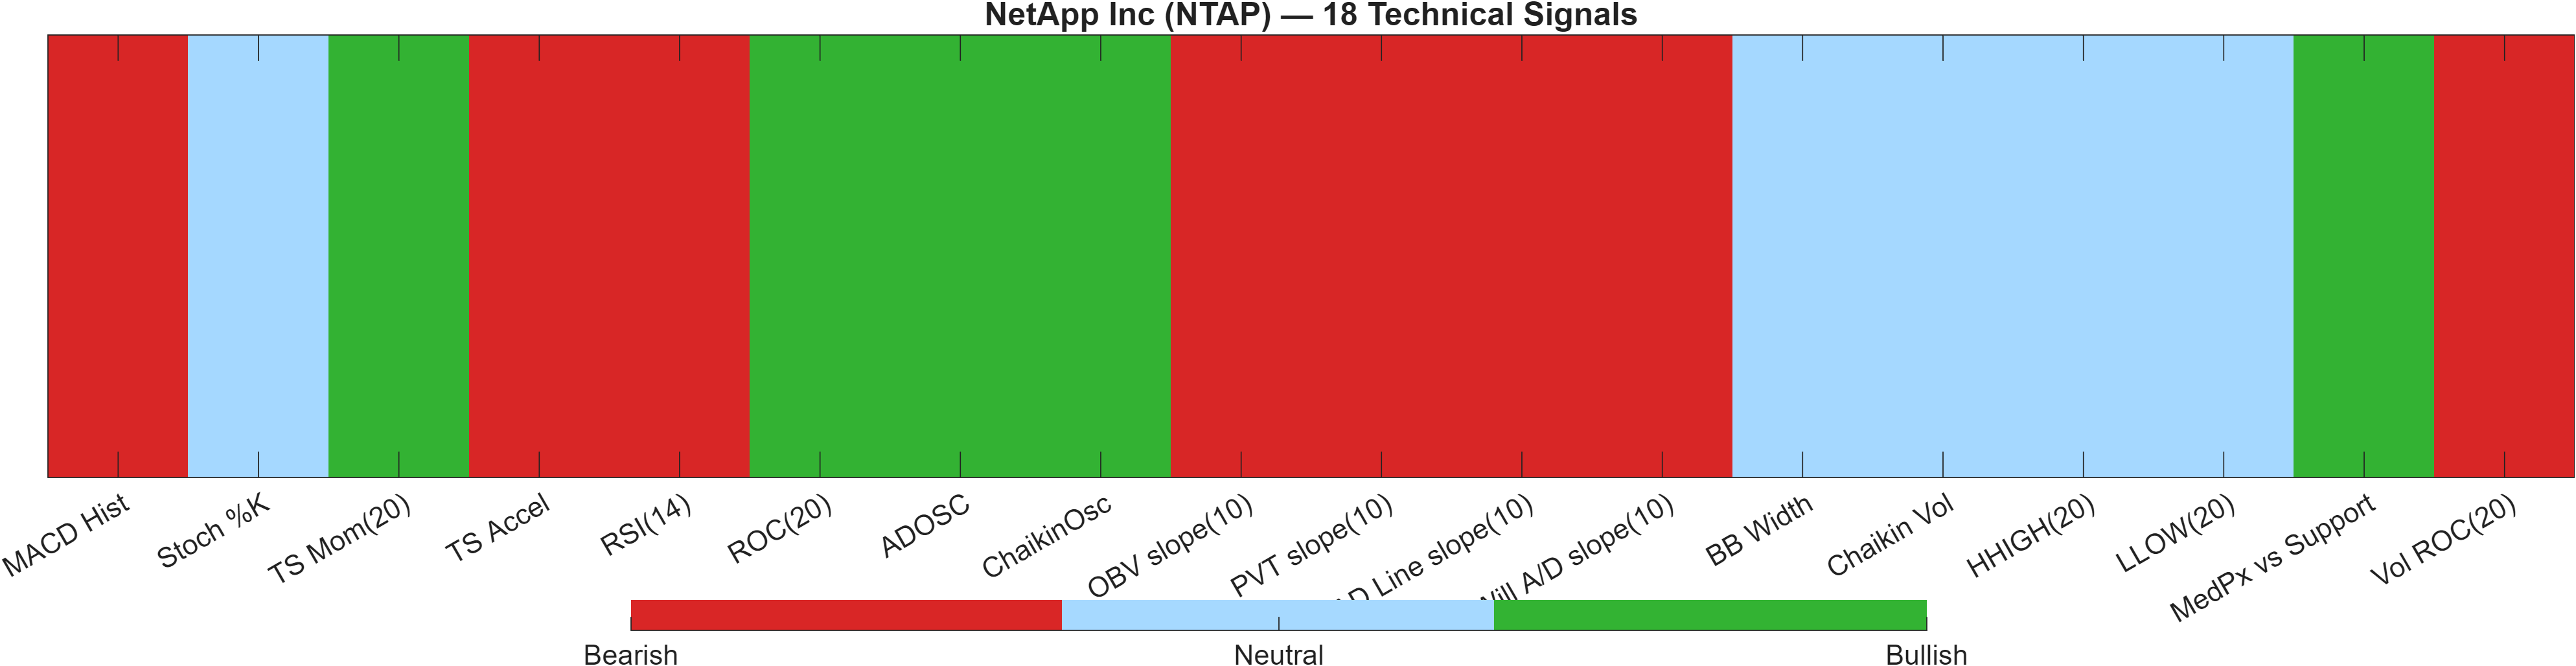
Signal table (Bull/Bear/Neutral)
| Indicator | Value | Signal |
|---|---|---|
| MACD Hist | -3.038 | Bearish |
| Stoch %K | 24.52 | Neutral |
| TS Mom(20) | 22.66 | Bullish |
| TS Accel | -3.29 | Bearish |
| RSI(14) | 29.43 | Bearish |
| ROC(20) | 16.31 | Bullish |
| ADOSC | 65.86 | Bullish |
| ChaikinOsc | 5.947e+04 | Bullish |
| OBV slope(10) | -1.348e+06 | Bearish |
| PVT slope(10) | -3.192e+05 | Bearish |
| AD Line slope(10) | -3.69e+06 | Bearish |
| Will A/D slope(10) | -10.83 | Bearish |
| BB Width | 0.3017 | Neutral |
| Chaikin Vol | -25.67 | Neutral |
| HHIGH(20) | 192.8 | Neutral |
| LLOW(20) | 136.8 | Neutral |
| MedPx vs Support | 53.27 | Bullish |
| Vol ROC(20) | -70.72 | Bearish |
Interpretation: Indicator-level signals form the base confluence, which is then adjusted using a separate AI-driven technical ranking model. The final technical score summarizes this combined view.
Confluence math: why “neutral” can hide internal conflict
The dashboard resolves to neutral even though the internal composition is skewed bearish: Bear 8 vs Bull 5 with 18-signal confluence at -0.167. The blend improves marginally to -0.014 after incorporating the DRL technical rank (#674, neutral), indicating the reinforcement-learning model is not as negative as the raw indicator stack.
A key analytical split is between momentum/acceleration and trend/position. Momentum is pressured (e.g., MACD histogram -3.038, RSI(14) 29.43, TS Accel -3.29), while some trend-anchored measures remain constructive (e.g., MedPx vs Support 53.27 is bullish). This pairing often appears when price is still “supported” structurally but short-term forces are pulling against it.
The volume/accumulation cluster leans risk-off: OBV slope(10) -1.348e+06, PVT slope(10) -3.192e+05, and AD Line slope(10) -3.69e+06 are all bearish. That makes level breaks more conditional—continuation generally improves when downside participation signals stop deteriorating and upside attempts occur with improving volume dynamics.
In short, “neutral” here represents offsetting forces: supportive structure versus weakened momentum and participation, rather than an absence of signal.
6) News sentiment + extractive gist
Sentiment score (avg): 0.102 | Positive: 32% | Neutral: 68% | Negative: 0%
KGNAI AI News Sentiment Score (normalized -1 to +1): 1.00 (as of 2026-06-12) | Label: Bullish | Overall news score: 0.96
Positive Developments
Recent coverage across major financial outlets indicates a constructive narrative backdrop for NetApp, with commentary emphasizing demand drivers tied to AI-enabled data infrastructure and enterprise storage workflows. The sentiment distribution supports that tone—32% positive, 68% neutral, and 0% negative—and the model’s normalized reading of 1.00 (overall news score 0.96) reflects consistent positive language in the extracted corpus. Importantly, this constructive bias aligns more with the mid-term rank strength (e.g., 3-month #21, monthly #77) than with the mixed short-term technical picture. When sentiment remains constructive while technicals are neutral, markets sometimes resolve via stabilization rather than immediate trend extension; in that context, news functions as a supporting condition rather than a standalone catalyst signal.
Neutral / Mixed Developments
Alongside constructive items, the flow is also materially informational, consistent with the high neutral share (68%). That mix commonly appears after a period of strong relative performance, where coverage shifts toward valuation framing, analyst posture, and competitive context rather than incremental surprises. This matters because the technical stack is not uniformly supportive: overall technical score -0.014 and confluence -0.167 indicate that even with favorable narrative tone, the market may require clearer price acceptance around levels to re-engage momentum. In other words, the news backdrop is not flashing stress, but it is also not, by itself, resolving the indicator conflict.
Negative / Risk Signals
Even with 0% negative in the sentiment split, risk signals can still surface indirectly through “cautious” framing and competitive/sector read-throughs. The current setup already shows technical friction—RSI(14) 29.43 (bearish) and MACD histogram -3.0383—so any narrative shift toward tighter expectations could amplify sensitivity around resistance (179.9750) or accelerate deterioration if price closes below support (106.4700). The more immediate risk is less about headline negativity and more about confirmation failure: if supportive coverage persists but volume participation stays weak (e.g., Vol ROC(20) -70.72), price may struggle to translate sentiment into sustained follow-through.
- What to monitor next: Whether price tests 179.9750 with improving volume versus fading attempts.
- What to monitor next: Whether momentum repairs (RSI lifts from 29.43; MACD histogram stabilizes from -3.0383).
- What to monitor next: Whether accumulation/participation measures stop deteriorating (e.g., OBV/PVT slope behavior alongside price).
Sources referenced: Reuters, Bloomberg, Yahoo Finance, MarketWatch, Investing.com
Snapshot: AI Rank (Short–Mid–Long): Mixed (Neutral–Bullish–Neutral) · Technical Confluence: Neutral · Key Levels: Support ~106.47 | Resistance ~179.97 · News Sentiment: Neutral
7) Sources
Not available in the provided data.
You may also like: How KGNAI AI ranks instruments across global markets
Disclaimer: KGNAI provides AI-generated analytics and educational market commentary only. This is not financial advice. Markets involve risk. Always do your own research.