ENOG.LSE — Energean Oil & Gas PLC(UK) (07-Jun-2026) | Neutral momentum with bearish technical pressure
Energean Oil & Gas PLC(UK) (ENOG.LSE) sits in a split regime as of 07-Jun-2026: longer-horizon KGNAI ranks remain strong while near-term positioning is less constructive. The 3-month and 6-month ranks are both #30 out of 1397 and the yearly rank is #85, signaling upper-decile relative strength over broader windows. By contrast, the weekly rank at #1157 indicates weaker short-cycle behavior, consistent with the chart read that the close is below the MA50 and the MA50 is below the MA200 (bearish trend structure). Momentum internals also lean heavy: MACD histogram is -8.6091 and RSI bias is bearish, while volatility is not trivial with Bollinger Bandwidth at 0.2586. With support at 768.7500 and resistance at 902.5000, ENOG.LSE is framed by well-defined decision zones where confirmation (or invalidation) is most likely to appear.
- Rank stance: Short Bearish | Mid Neutral | Long Bullish (3M/#30, 6M/#30, Year/#85; Weekly/#1157)
- Technical confluence: Bearish (18-signal score -0.444; blended -0.398; DRL rank #900)
- Key levels: Support ~768.7500 | Resistance ~902.5000
- News sentiment bias: Slightly positive/constructive backdrop in aggregate (avg 0.013; normalized 1.00; 81% neutral)
- Confirmation / invalidation: Break above 902.5000 with volume supports continuation; close below 768.7500 increases deterioration risk.
KGNAI evaluates assets using large cross-sectional datasets built from millions of structured data points. Inputs incorporate fundamental metrics, technical structures, and systematically processed news sentiment. Statistical models, machine learning, and AI frameworks are used to assess relative positioning, signal alignment, and probabilistic behavior across broad universes.
- Ranks are comparative across the tracked universe, not absolute price targets.
- Confluence reflects alignment among independent signal groups.
- Support/resistance levels are probabilistic decision zones, not guarantees.
- Sentiment provides contextual bias within the broader analytical framework.
1) KGNAI AI Analysis
Region: EUROPE
Total universe size: 1397 ranked instruments
- Daily rank: #520 out of 1397 — Neutral
- Weekly rank: #1157 out of 1397 — Bearish
- Monthly rank: #447 out of 1397 — Neutral
- 3-Monthly rank: #30 out of 1397 — Bullish
- 6-Monthly rank: #30 out of 1397 — Bullish
- Yearly rank: #85 out of 1397 — Bullish
The rank profile is best read as timeframe asymmetry rather than a single directional message. ENOG.LSE holds upper-decile placement across the 3-month and 6-month windows (both #30), and remains firmly constructive on the yearly view (#85). That persistence suggests the longer-run return behavior and relative positioning have stayed resilient versus the 1397-instrument European universe.
Short-cycle readings are notably weaker: the weekly rank (#1157) sits in the lower portion of the universe, and the daily rank (#520) is closer to the middle. This combination often appears when an instrument is in a longer-horizon uptrend undergoing a short-term drawdown or consolidation, or when prior strength is being tested by adverse momentum and trend structure.
The stated term view—Short-term Bearish, Mid-term Neutral, Long-term Bullish—is consistent with that cross-horizon split. The analytical task here is confirmation: whether short-term weakness resolves as a temporary interruption (supporting the bullish long ranks) or evolves into a broader regime shift (pulling monthly and longer ranks lower).
2) Price & trend overview
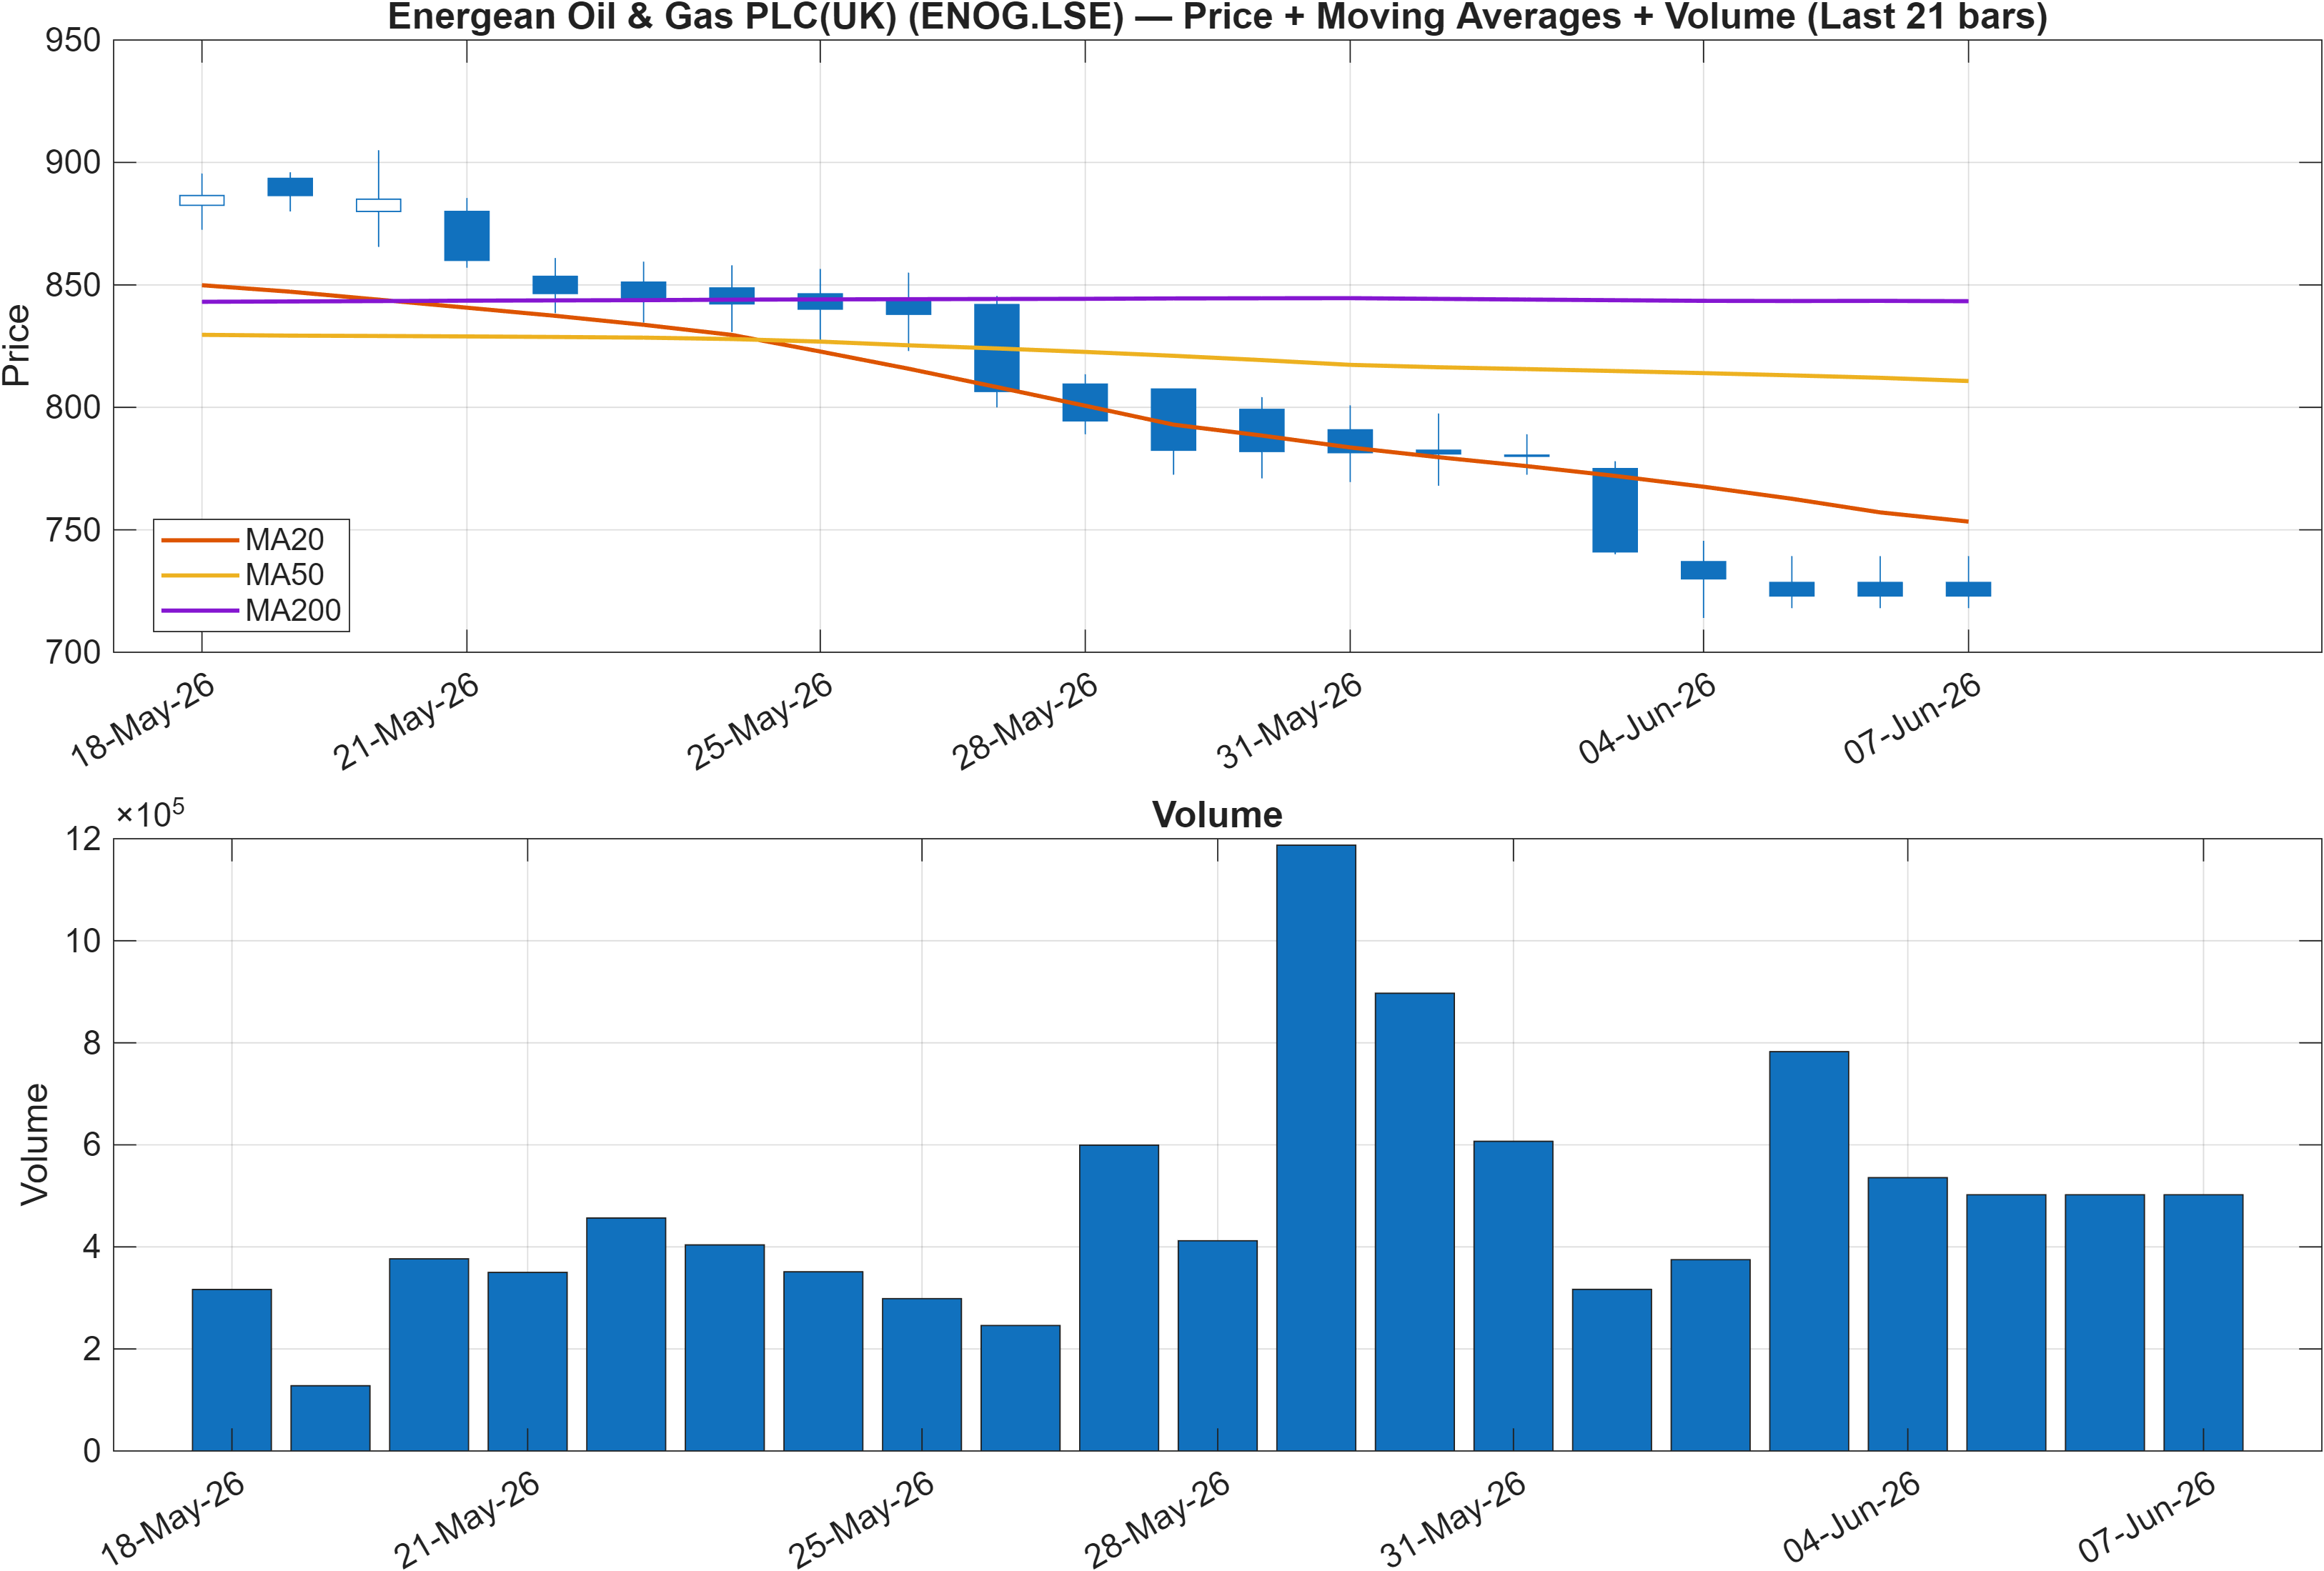
Trend structure is currently hostile to immediate upside follow-through. The interpretation flags two bearish alignments: the close is below the MA50, and the MA50 is below the MA200. In classical trend terms, that places ENOG.LSE in a configuration where rallies are more likely to encounter supply until moving-average relationships improve.
This trend read also helps explain why the weekly rank is weak (#1157) despite stronger 3–12 month ranks (3-month #30; yearly #85). When longer-run relative strength remains intact while price is positioned beneath key moving averages, markets often enter a repair phase: the instrument must either recover above the MA50 and stabilize, or continue to bleed momentum and risk retesting lower reference levels.
Price action should also be evaluated alongside the defined decision zones in this report. With resistance at 902.5000, reclaiming that area would typically require not only a lift in price but also evidence that trend pressure is easing. Conversely, proximity to support at 768.7500 matters because bearish moving-average alignment can accelerate downside moves if support fails.
From a market-structure standpoint, this section is less about forecasting and more about identifying whether the market is in trend continuation versus trend transition. A sustained shift back above the MA50 would be a visible step toward transition; remaining pinned below it keeps the burden of proof on buyers.
3) Momentum & volatility dashboard
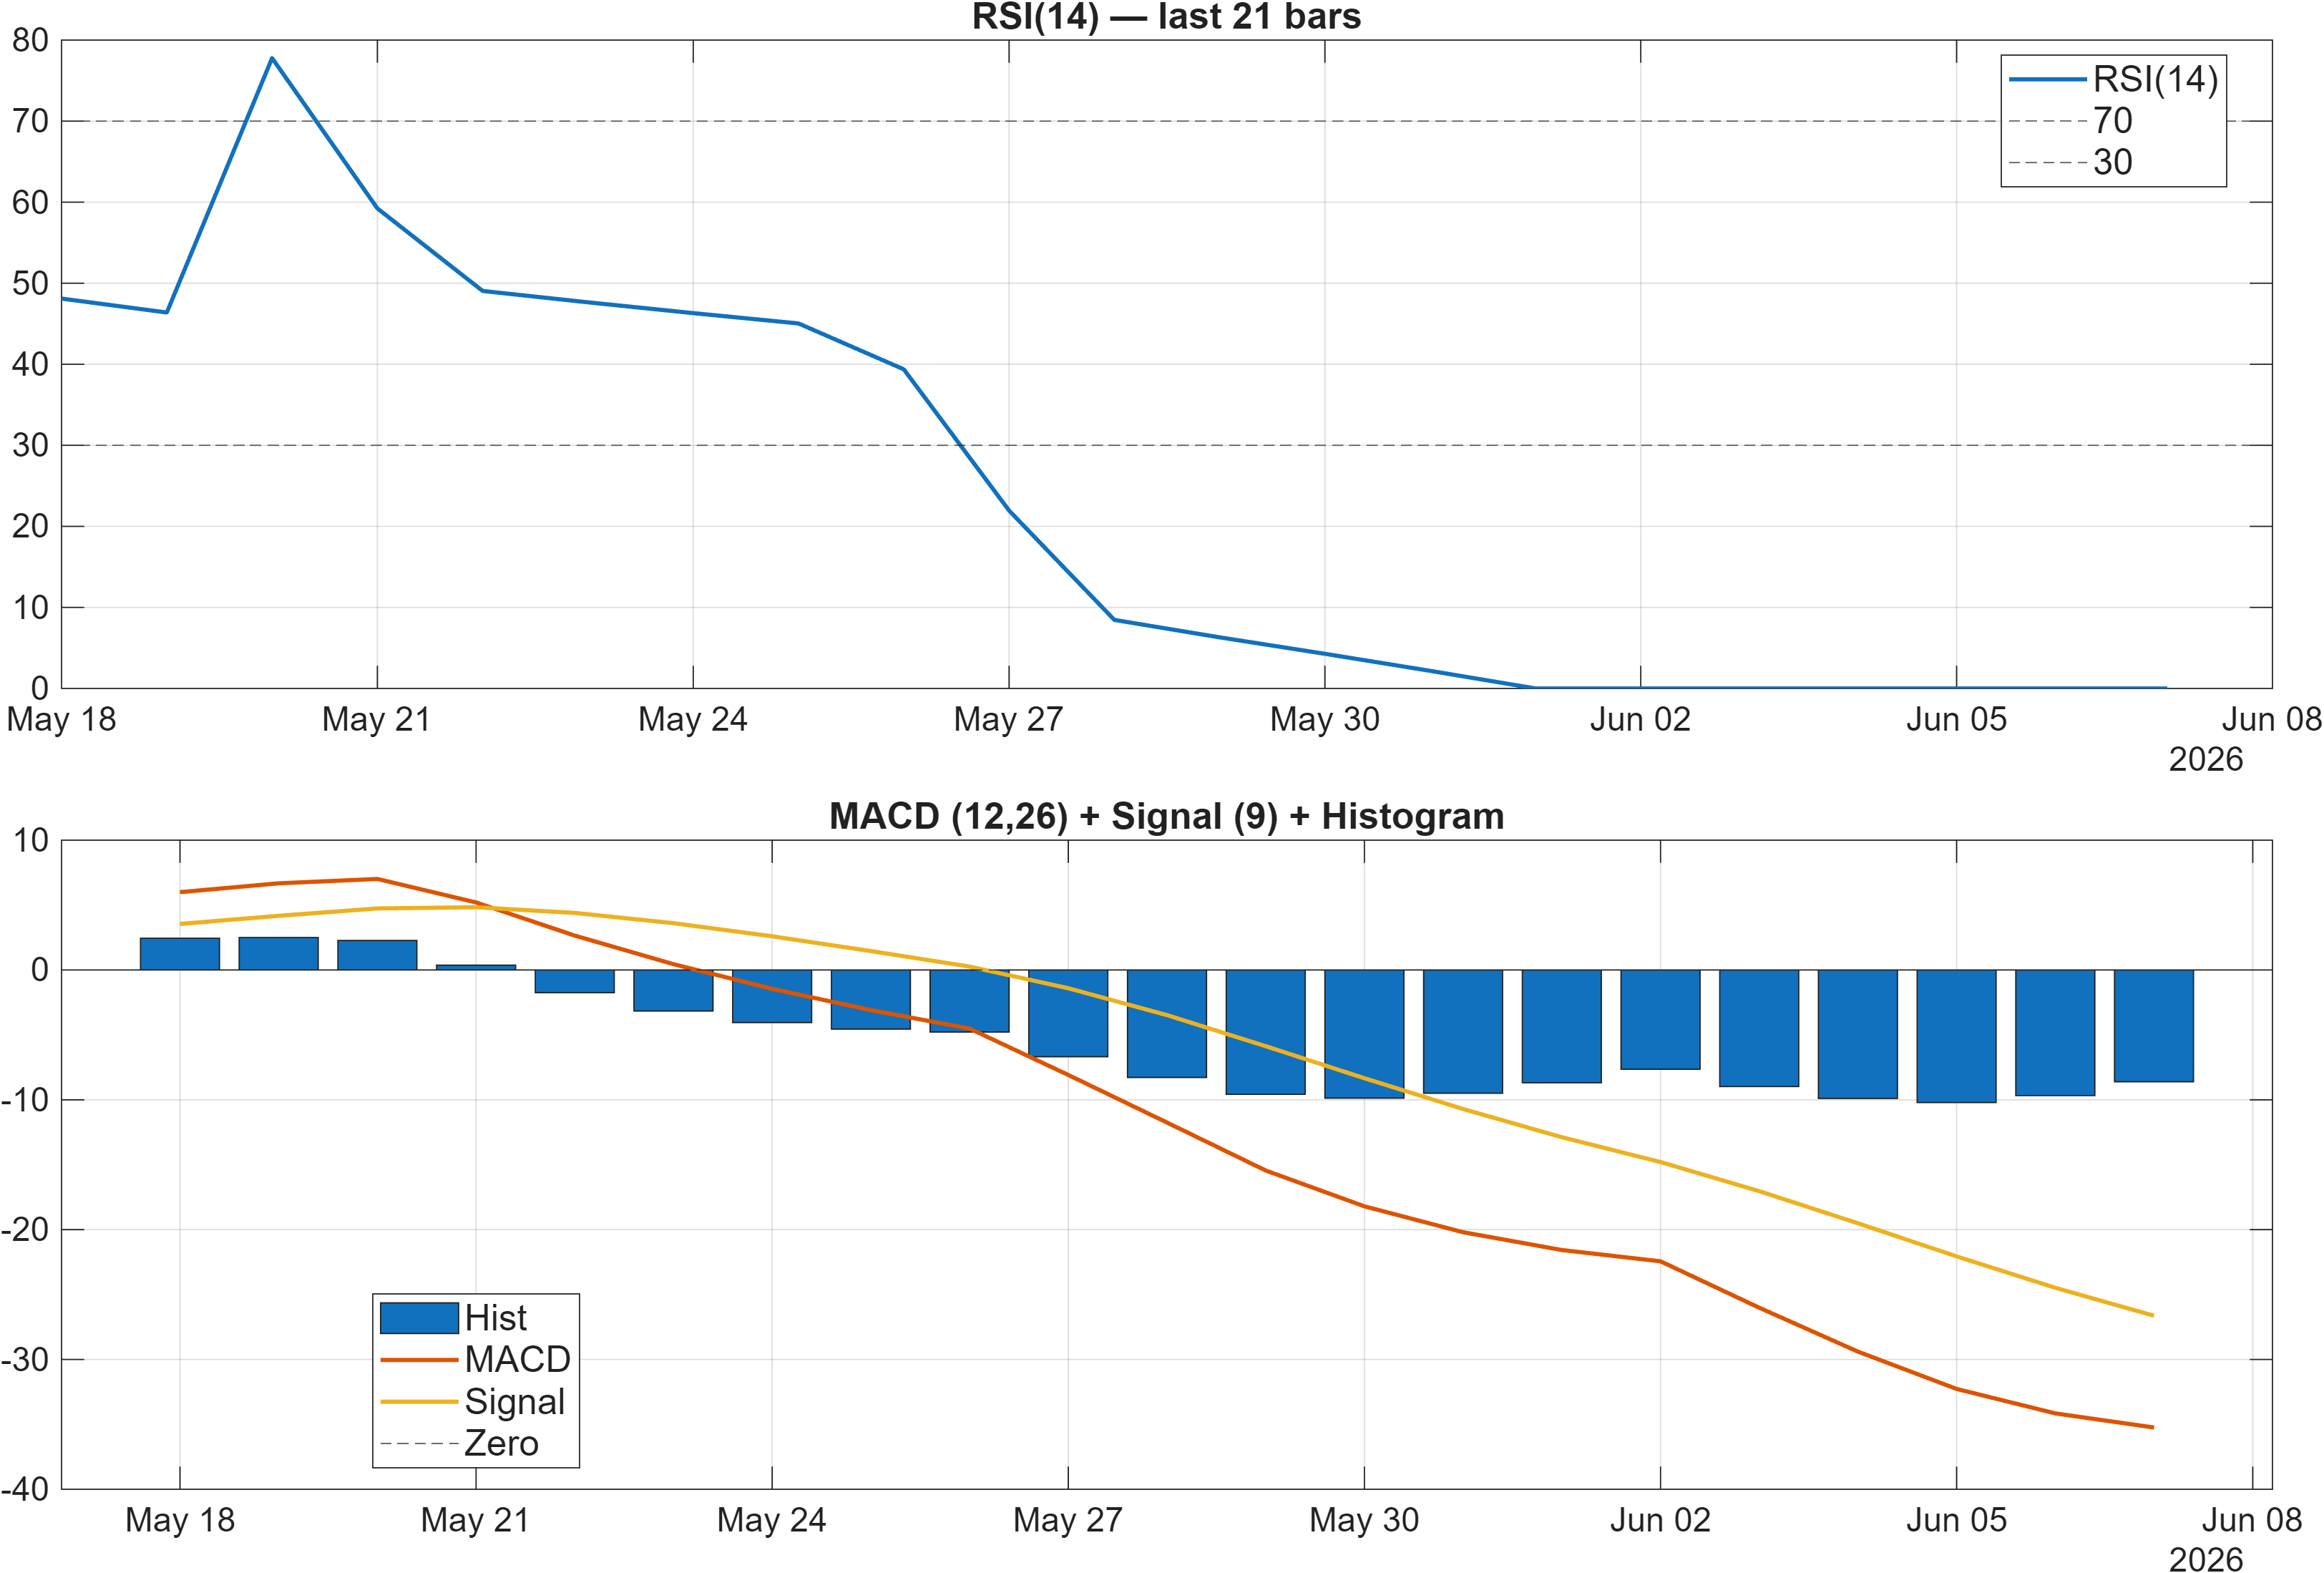
Momentum conditions remain skewed to the downside. The RSI bias is labeled bearish and the MACD histogram prints at -8.6091, indicating negative momentum persistence rather than a clean reversal signal. In this setup, short-lived bounces can occur, but they are often vulnerable if MACD remains below its signal dynamics and the histogram stays meaningfully negative.
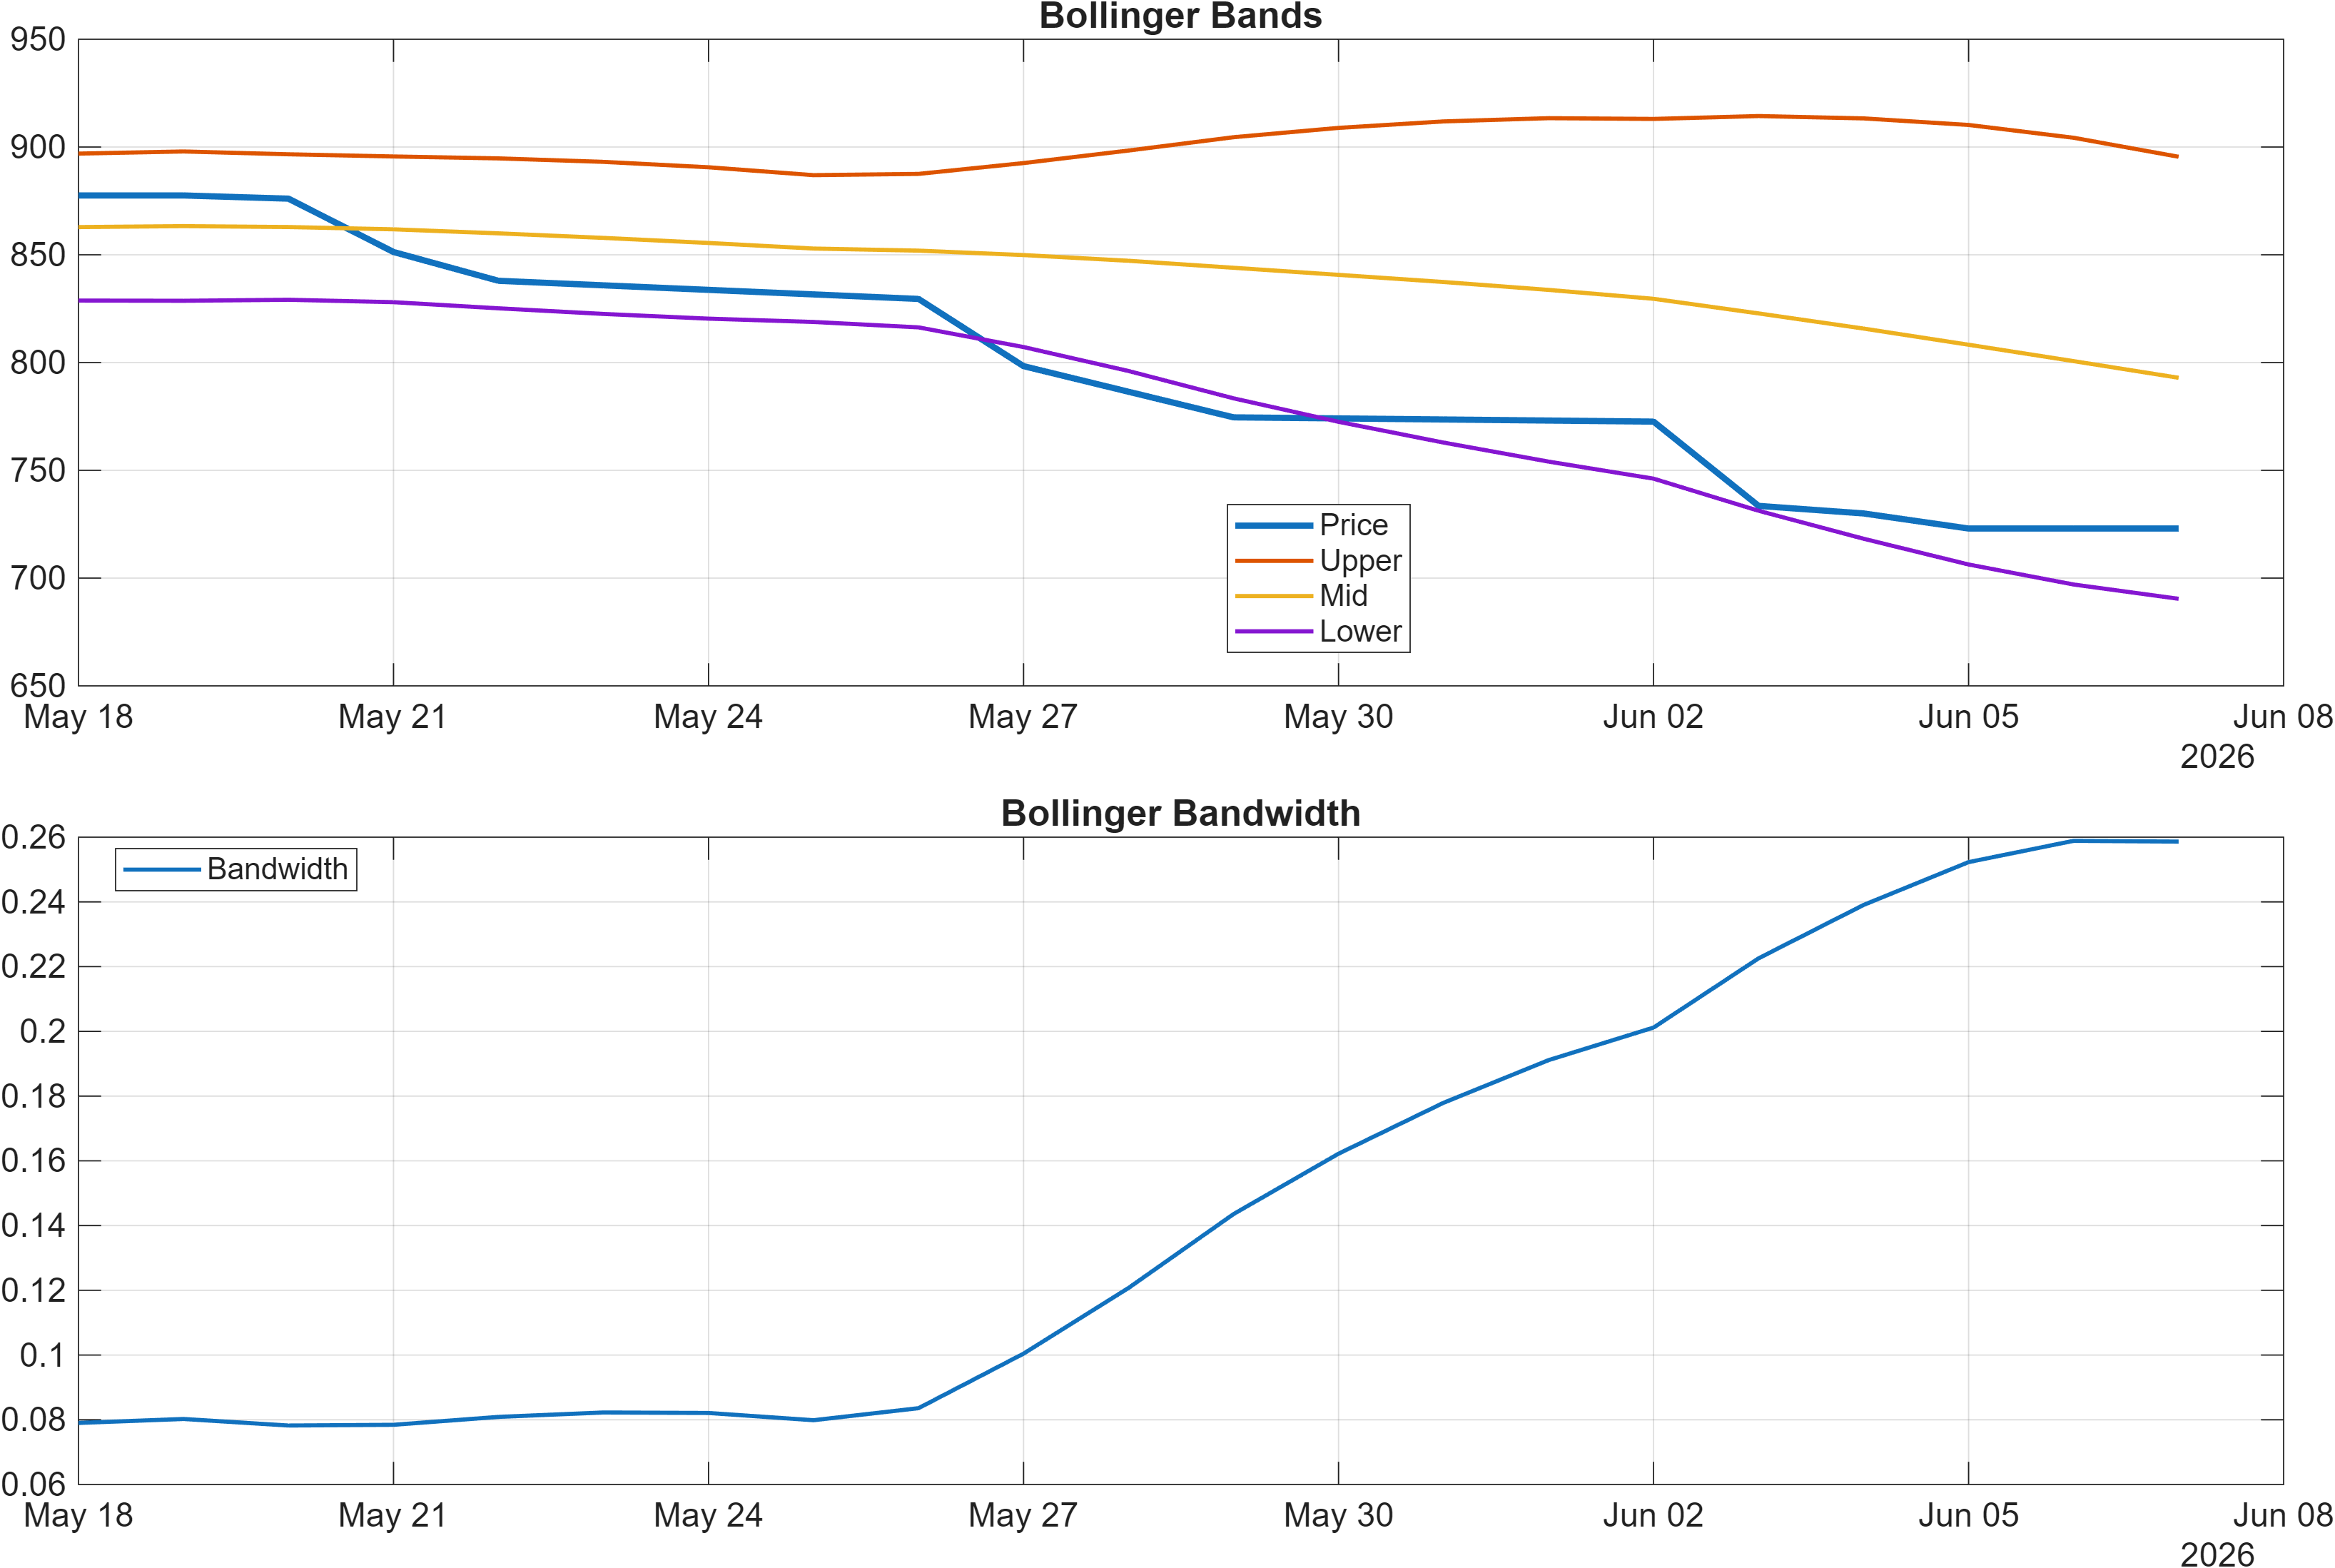
Volatility is not compressed: Bollinger Bandwidth is 0.2586. A wider bandwidth regime typically increases the dispersion of outcomes around key levels—useful for tactical opportunity, but it also raises the probability of false breaks if confirmation is not supported by volume and follow-through. This matters because the instrument is simultaneously in bearish moving-average alignment (Section 2), where volatility spikes can accelerate swings in both directions.
The most informative read here is the interaction between momentum weakness and elevated range potential. Negative MACD histogram (-8.6091) alongside bearish RSI bias argues that momentum is still working against the bulls. Meanwhile, a 0.2586 bandwidth suggests that when price approaches major references (support/resistance), the market may travel quickly—making confirmation criteria (e.g., sustained closes, volume behavior) more important than intraday excursions.
Net: the dashboard leans toward trend persistence rather than an exhaustion signal, until momentum indicators improve or price action begins to compress and stabilize around moving averages.
4) Support / Resistance zones
Support ~ 768.7500 | Resistance ~ 902.5000
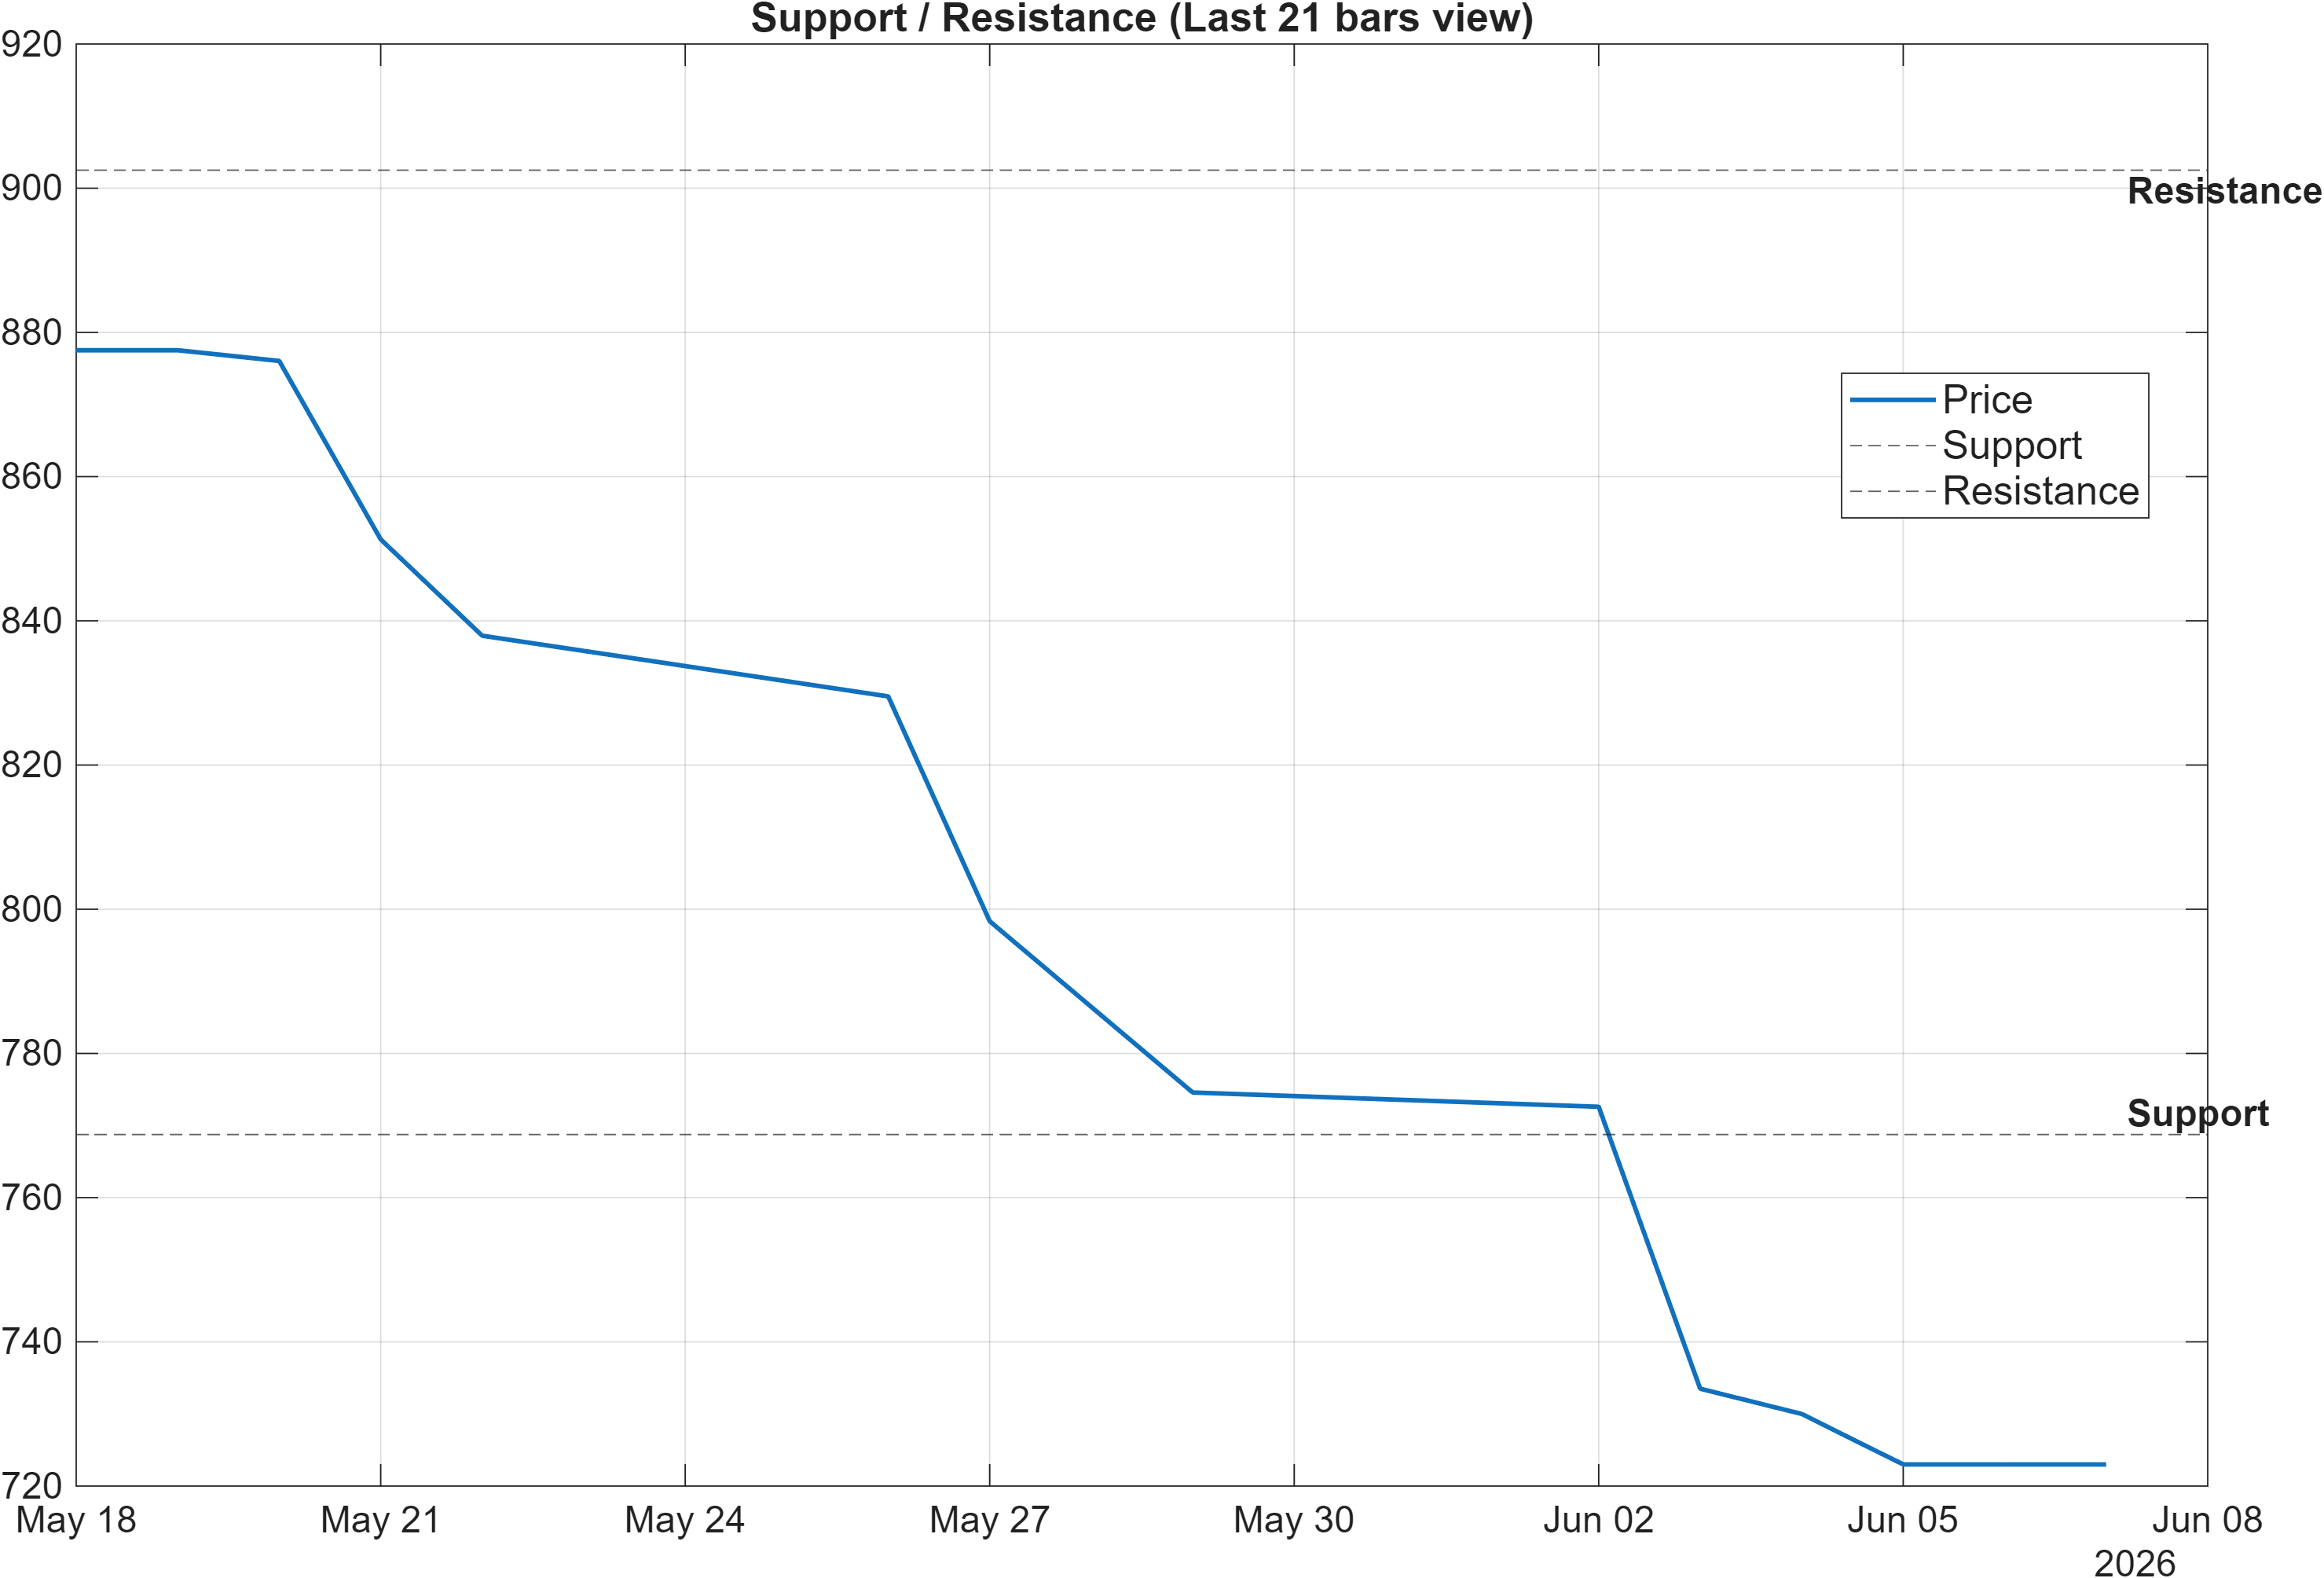
The level structure is clean and relatively wide: 768.7500 defines the primary support zone, while 902.5000 marks resistance. Given the bearish trend configuration (close < MA50 and MA50 < MA200), resistance tends to behave as an area where supply can re-enter unless momentum improves materially (see MACD histogram at -8.6091).
Two regime tests emerge from these zones. First, the report’s scenario view—“break above resistance with volume → continuation”—frames 902.5000 as a validation level for the longer-horizon bullish rank context (3-month #30; yearly #85). A move through resistance that holds would reduce the probability that the weekly weakness (#1157) is evolving into a deeper breakdown.
Second, “close below support → signal deterioration risk” makes 768.7500 the invalidation boundary for a stabilization thesis. With volatility not compressed (bandwidth 0.2586), it is reasonable to expect probing around support; the analytical distinction is between transient volatility and a confirmed close that shifts market control.
Practically, these zones organize the tape into decision points: above 902.5000 the market is attempting to re-establish constructive structure; below 768.7500 the current bearish technical stack is more likely to dominate. Between them, the market is negotiating whether the drawdown is corrective or structural.
5) Quant Technical Dashboard (18 Signals)
KGNAI AI Technical Analysis Score (Deep Reinforcement Learning): Rank #900 out of 1397 (Rank 1 represents the strongest technical positioning and a higher probability of favorable price behavior. As ranks increase toward the maximum, the probability of favorable outcomes weakens and bearish positioning becomes more dominant.) | Label: Neutral | Score: -0.288
18-Signal Technical Confluence Score: -0.444 (Bearish)
Overall Technical Score (18-signal confluence + DRL rank blend): -0.398 (Bearish)
Note: The blended score reflects signal strength weighted against broader AI technical ranking, which may temporarily diverge.
Blended technical score breakdown: -0.398 (Bearish | Bull 3 / Bear 11 / Neutral 4)
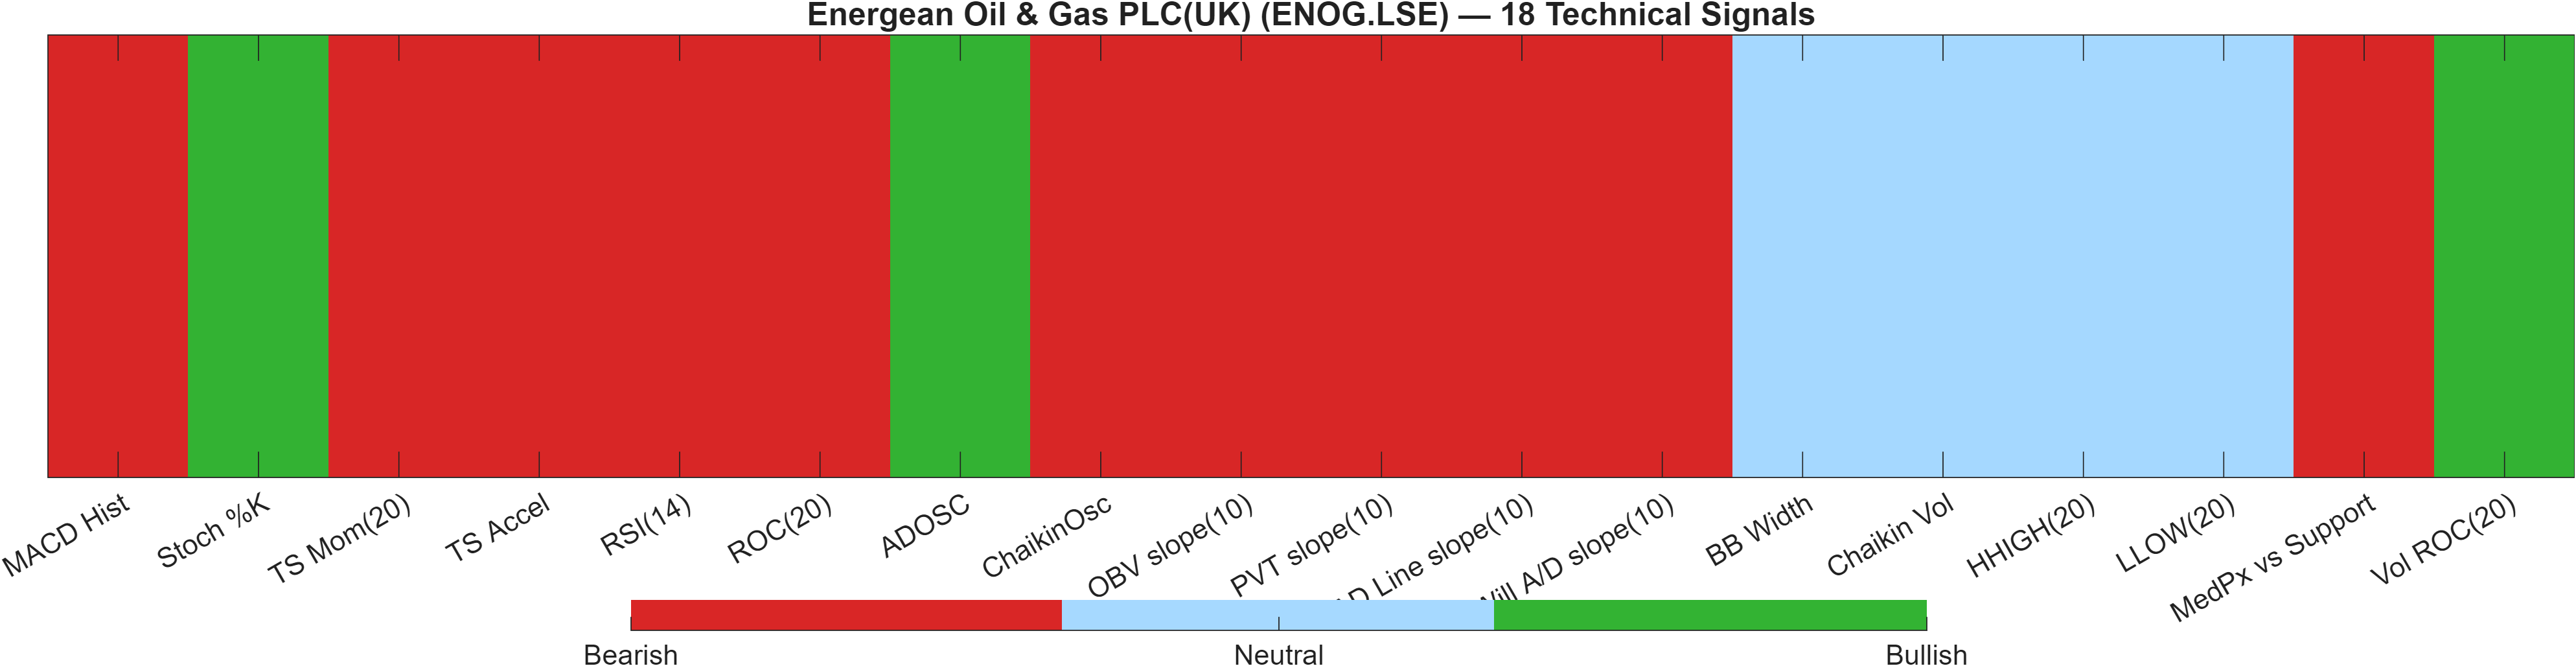
Signal table (Bull/Bear/Neutral)
| Indicator | Value | Signal |
|---|---|---|
| MACD Hist | -8.609 | Bearish |
| Stoch %K | 9.626 | Bullish |
| TS Mom(20) | -163.5 | Bearish |
| TS Accel | -156.5 | Bearish |
| RSI(14) | 0 | Bearish |
| ROC(20) | -17.61 | Bearish |
| ADOSC | 37.07 | Bullish |
| ChaikinOsc | -7.947e+05 | Bearish |
| OBV slope(10) | -5.204e+06 | Bearish |
| PVT slope(10) | -7.171e+04 | Bearish |
| AD Line slope(10) | -2.533e+06 | Bearish |
| Will A/D slope(10) | -162.8 | Bearish |
| BB Width | 0.2586 | Neutral |
| Chaikin Vol | -13.81 | Neutral |
| HHIGH(20) | 905 | Neutral |
| LLOW(20) | 714 | Neutral |
| MedPx vs Support | -40.12 | Bearish |
| Vol ROC(20) | 292.6 | Bullish |
The technical stack is dominated by bearish breadth rather than a narrow, single-indicator weakness. The 18-signal confluence score is -0.444 (bearish) and the blended overall technical score is -0.398 (bearish), with a distribution of Bull 3 / Bear 11 / Neutral 4. That mix signals broad pressure across momentum and volume-derived measures, even as a few components point to tactical rebound potential.
A useful way to reconcile the dashboard is mean-reversion versus trend-following conflict. Stoch %K at 9.626 is bullish, which typically appears when price is stretched and short-term bounce risk rises. However, trend-following and momentum measures remain heavy: MACD histogram is bearish (table value -8.609), ROC(20) at -17.61 is bearish, and TS Mom(20) at -163.5 is also bearish. When these groups disagree, mean-reversion signals can fail quickly unless price confirms by reclaiming structure and improving breadth.
Volume/accumulation signals add nuance rather than outright relief. ADOSC at 37.07 is bullish and Vol ROC(20) at 292.6 is bullish, yet multiple slope-based measures (e.g., OBV slope(10) and AD Line slope(10)) are bearish, implying that participation may be inconsistent across the measurement window. The DRL technical rank at #900 (Neutral; score -0.288) sits between these narratives, suggesting the model sees some stabilizing attributes but not enough to offset the broader bearish confluence.
6) News sentiment + extractive gist
Note: Instrument-specific news matches were not found, so the digest includes broader market/sector headlines. Links are provided for verification.
Sentiment score (avg): 0.013 | Positive: 12% | Neutral: 81% | Negative: 6%
KGNAI AI News Sentiment Score (normalized -1 to +1): 1.00 (as of 2026-06-03) | Label: Bullish | Overall news score: 0.98
Positive Developments
Recent coverage across major financial outlets indicates a modestly constructive backdrop, but largely macro/sector-linked rather than company-specific. The normalized news score is 1.00 (as of 2026-06-03) with an overall news score of 0.98, suggesting the processed language tone in the captured headlines skews positive. At the same time, the distribution remains mostly neutral (81% neutral; 12% positive), which often implies a market that is not anchored to a single dominant narrative. For ENOG.LSE, that can matter when the technical picture is bearish (overall technical score -0.398): supportive sector tone can help stabilize drawdowns, even if it does not independently reverse a weak chart. In practice, constructive macro headlines tend to act as a tailwind only when price confirms—particularly near defined resistance at 902.5000.
Neutral / Mixed Developments
The average sentiment reading is close to flat at 0.013, aligning with a feed dominated by informational and mixed items rather than directional catalysts. That neutrality is consistent with the note that instrument-specific matches were not found: when the news stream is broader and cross-sector, the signal often functions as context rather than a driver. For positioning, this means the market is more likely to trade off technical inputs—such as bearish moving-average alignment and the negative MACD histogram (-8.6091)—than off incremental headline flow. In this environment, the most valuable use of the news layer is to assess whether sentiment is amplifying technical risk. Here, it appears not to be: negative share is 6%, relatively contained.
Negative / Risk Signals
Risk language in the broader set remains present even with a bullish normalized score. With 6% negative and the rest largely neutral, the key takeaway is not an outright bearish headline regime but the potential for event-driven volatility to interact with an already stressed technical stack. ENOG.LSE’s volatility regime is not compressed (bandwidth 0.2586), which can magnify reaction functions if macro risk items dominate the tape. This is particularly relevant near the downside boundary at 768.7500, where the report explicitly flags deterioration risk on a close below support. In other words, the news layer is not currently the primary bearish factor; it is a conditional accelerant if risk tone intensifies while price is weak.
- Whether sentiment stays constructive while price tests 902.5000 (confirmation) or 768.7500 (invalidation).
- Any shift in the positive/neutral/negative split away from 81% neutral.
- Whether volatility remains elevated (bandwidth 0.2586) alongside improving momentum (MACD histogram moving up from -8.6091).
Snapshot: AI Rank (Short–Mid–Long): Mixed (Bearish–Neutral–Bullish) · Technical Confluence: Bearish · Key Levels: Support ~768.75 | Resistance ~902.50 · News Sentiment: Neutral
7) Sources
Sources referenced: Reuters, Bloomberg, Yahoo Finance, MarketWatch, Investing.com
You may also like: How KGNAI AI ranks instruments across global markets
Disclaimer: KGNAI provides AI-generated analytics and educational market commentary only. This is not financial advice. Markets involve risk. Always do your own research.