Sika AG (SIKA.SW) — 12-Jun-2026 Neutral-to-Bearish Technical Posture With Bullish Long-Horizon Rank Tailwind
Sika AG (SIKA.SW) enters 12-Jun-2026 with a short-term rank drag but a more balanced multi-horizon picture. KGNAI’s cross-sectional ranks show a Daily rank of #1207 (weak relative positioning), while the 3-Monthly rank improves to #206, suggesting a better medium-horizon setup versus the broader European universe. Technically, the blended framework leans risk-aware: the 18-signal confluence score is -0.333 and the overall blended technical score is -0.460, both labeled Bearish, aligning with momentum pressure (e.g., MACD histogram -0.5412 and RSI(14) 30.46). Volatility remains comparatively contained (Bollinger bandwidth 0.0506), implying that price may be coiling rather than trending aggressively. Key decision zones are well-defined at support ~138.0000 and resistance ~154.7333. News sentiment skews constructive in score terms (normalized 1.00) despite a predominantly neutral article mix, creating a sentiment/price tension worth monitoring.
- Rank stance: Short Bearish | Mid Neutral | Long Neutral
- Technical confluence: Bearish (overall blended technical score -0.460)
- Key levels: Support 138.0000 | Resistance 154.7333
- News sentiment bias: Slightly constructive by score (1.00 normalized) with mostly neutral distribution (56% neutral; 39% positive; 6% negative)
- Confirmation / invalidation: A break above 154.7333 with volume supports continuation; a close below 138.0000 increases deterioration risk
KGNAI evaluates assets using large cross-sectional datasets built from millions of structured data points. Inputs incorporate fundamental metrics, technical structures, and systematically processed news sentiment. Statistical models, machine learning, and AI frameworks are used to assess relative positioning, signal alignment, and probabilistic behavior across broad universes.
- Ranks are comparative across the tracked universe, not absolute price targets.
- Confluence reflects alignment among independent signal groups.
- Support/resistance levels are probabilistic decision zones, not guarantees.
- Sentiment provides contextual bias within the broader analytical framework.
1) KGNAI AI Analysis
Region: EUROPE
Total universe size: 1396 ranked instruments
- Daily rank: #1207 out of 1396 — Bearish
- Weekly rank: #403 out of 1396 — Neutral
- Monthly rank: #733 out of 1396 — Neutral
- 3-Monthly rank: #206 out of 1396 — Bullish
- 6-Monthly rank: #394 out of 1396 — Neutral
- Yearly rank: #452 out of 1396 — Neutral
The rank stack for SIKA.SW is best read as a horizon mismatch rather than a single-direction signal. The Daily rank (#1207 of 1396) places the stock in the weaker portion of the universe, consistent with near-term pressure and a market that is currently less forgiving to marginal momentum. By contrast, the 3-Monthly rank (#206) moves into a far stronger relative cohort, implying that the intermediate window is not uniformly negative and may reflect stabilization versus peers even if spot action remains soft.
The Weekly rank (#403) and 6-Monthly rank (#394) sit closer to the mid-pack, supporting a “neutral base case” in the mid-horizon, while the Yearly rank (#452) reinforces that longer-cycle positioning is not categorically weak. This configuration often appears when short-term selling or de-risking dominates tape behavior, but broader structure has not fully broken down across the universe.
In practical portfolio terms (without implying an outcome), the main analytical task is separating short-term fragility from a potentially resilient intermediate backdrop. The larger the gap between Daily and 3-Month ranks, the more sensitive the next phase becomes to confirmation from price structure and participation measures—particularly around the defined support/resistance zones highlighted later.
KGNAI ranks each instrument across large universes using multiple proprietary AI tests and statistical models (millions of data points). Lower ranks generally indicate stronger probability of favorable performance behavior, while higher ranks indicate weaker probability and more bearish positioning.
Term view: Short-term: Bearish. Mid-term: Neutral. Long-term: Neutral.
Want the full universe and complete rank tables? Unlock full access on KGNAI: https://www.kgnai.com/pricing
2) Price & trend overview
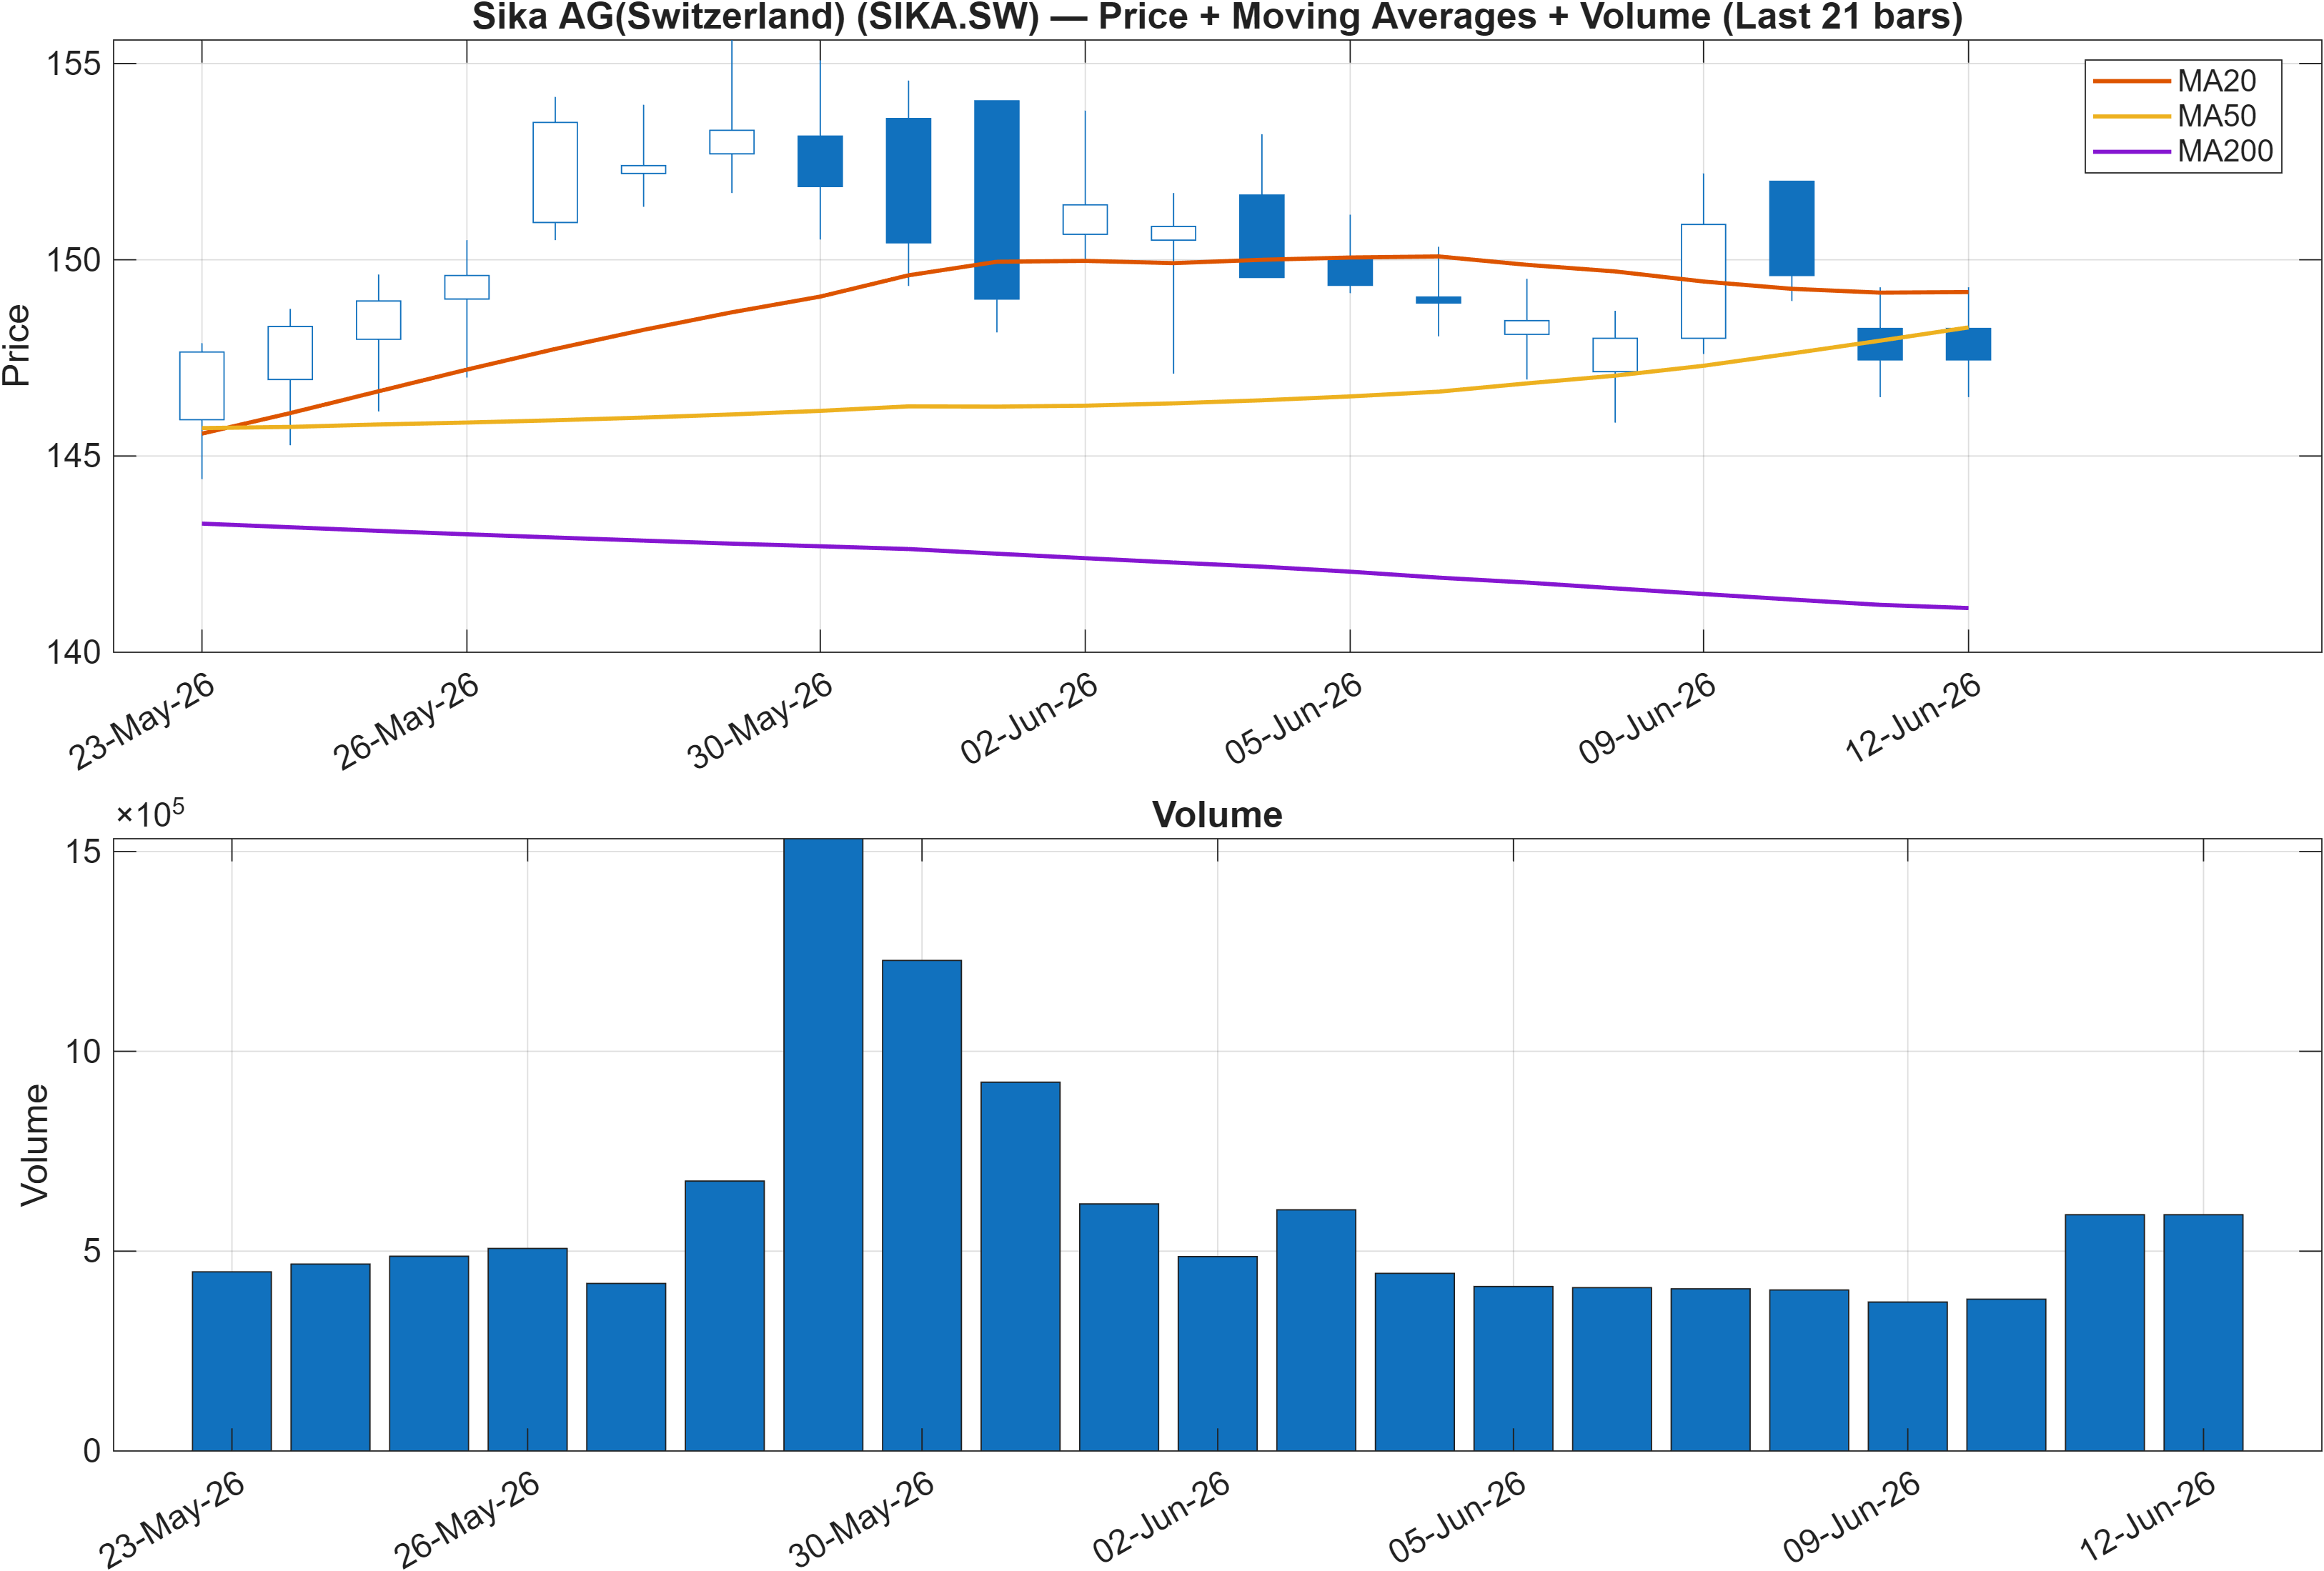
Trend structure currently shows a mixed regime: Close vs MA50 = Bearish while MA50 vs MA200 = Bullish. That combination typically reflects a longer trend that has not fully reversed, paired with a nearer-term phase where price is trading below the faster moving average. For SIKA.SW, it places emphasis on whether the current pullback is a mean-reversion phase within a broader uptrend, or the early stage of a larger transition.
The rank profile supports this interpretation: a weak Daily rank (#1207) aligns with the close sitting below the MA50, while the stronger 3-Monthly rank (#206) is more consistent with the MA50 remaining above the MA200. When these layers disagree, trend-following confirmation usually depends on whether price can reclaim the MA50 and hold it, rather than on one-day rebounds.
From a market-structure perspective, the situation can be framed as trend persistence vs. trend repair. If the longer moving-average relationship remains constructive but momentum (covered next) stays negative, price can spend time oscillating in a range that slowly “works off” prior excess. The tight Bollinger bandwidth (0.0506) later in the dashboard is consistent with that possibility—compression tends to amplify the importance of subsequent breakout levels rather than encourage over-interpretation of small day-to-day moves.
Interpretation: Close vs MA50 = Bearish, MA50 vs MA200 = Bullish.
3) Momentum & volatility dashboard
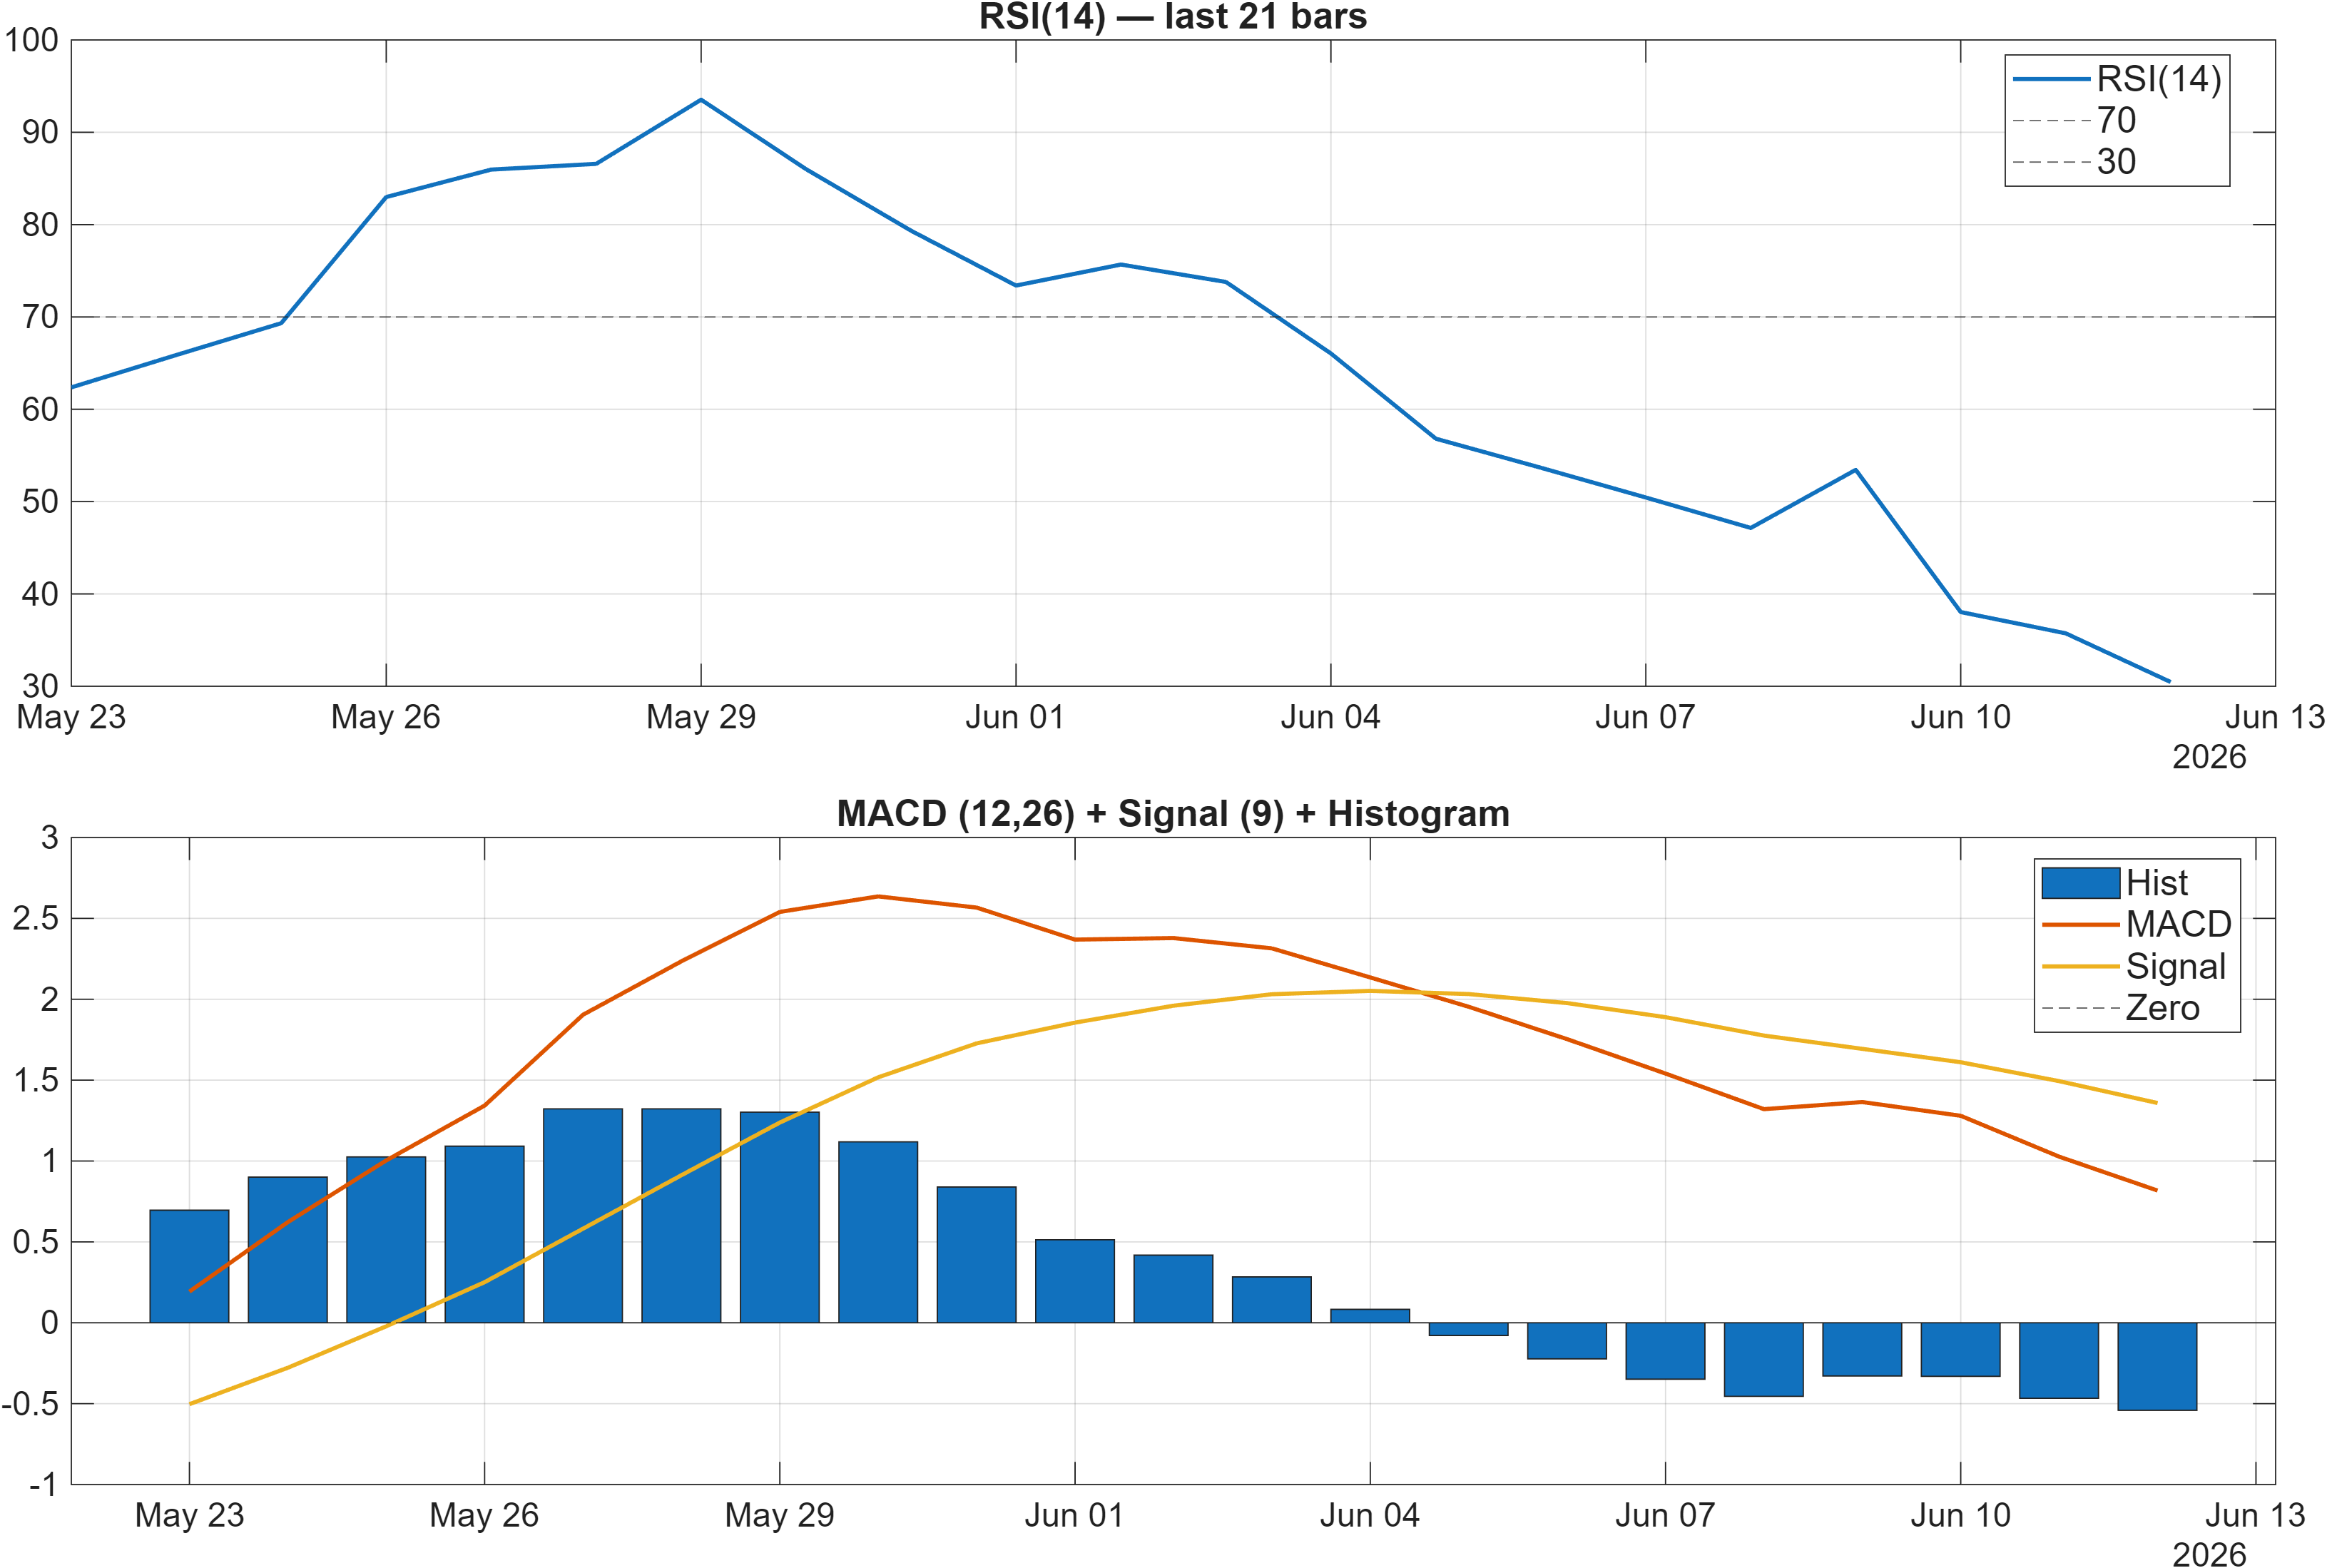
Momentum indicators are leaning risk-off. The RSI(14) at 30.46 is flagged bearish and sits near the conventional oversold boundary, signaling that downside momentum has been persistent enough to push the oscillator into stressed territory. That can coincide with late-stage selling, but by itself it does not confirm a durable low—especially when other momentum measures are also negative.
The MACD histogram at -0.5412 adds weight to the bearish impulse: negative histogram values reflect weaker momentum relative to the signal line. When RSI is depressed and MACD histogram remains meaningfully negative, the more common setup is bearish momentum persistence until price structure improves or momentum begins to flatten (histogram moving toward zero), even if intermittent rebounds occur.
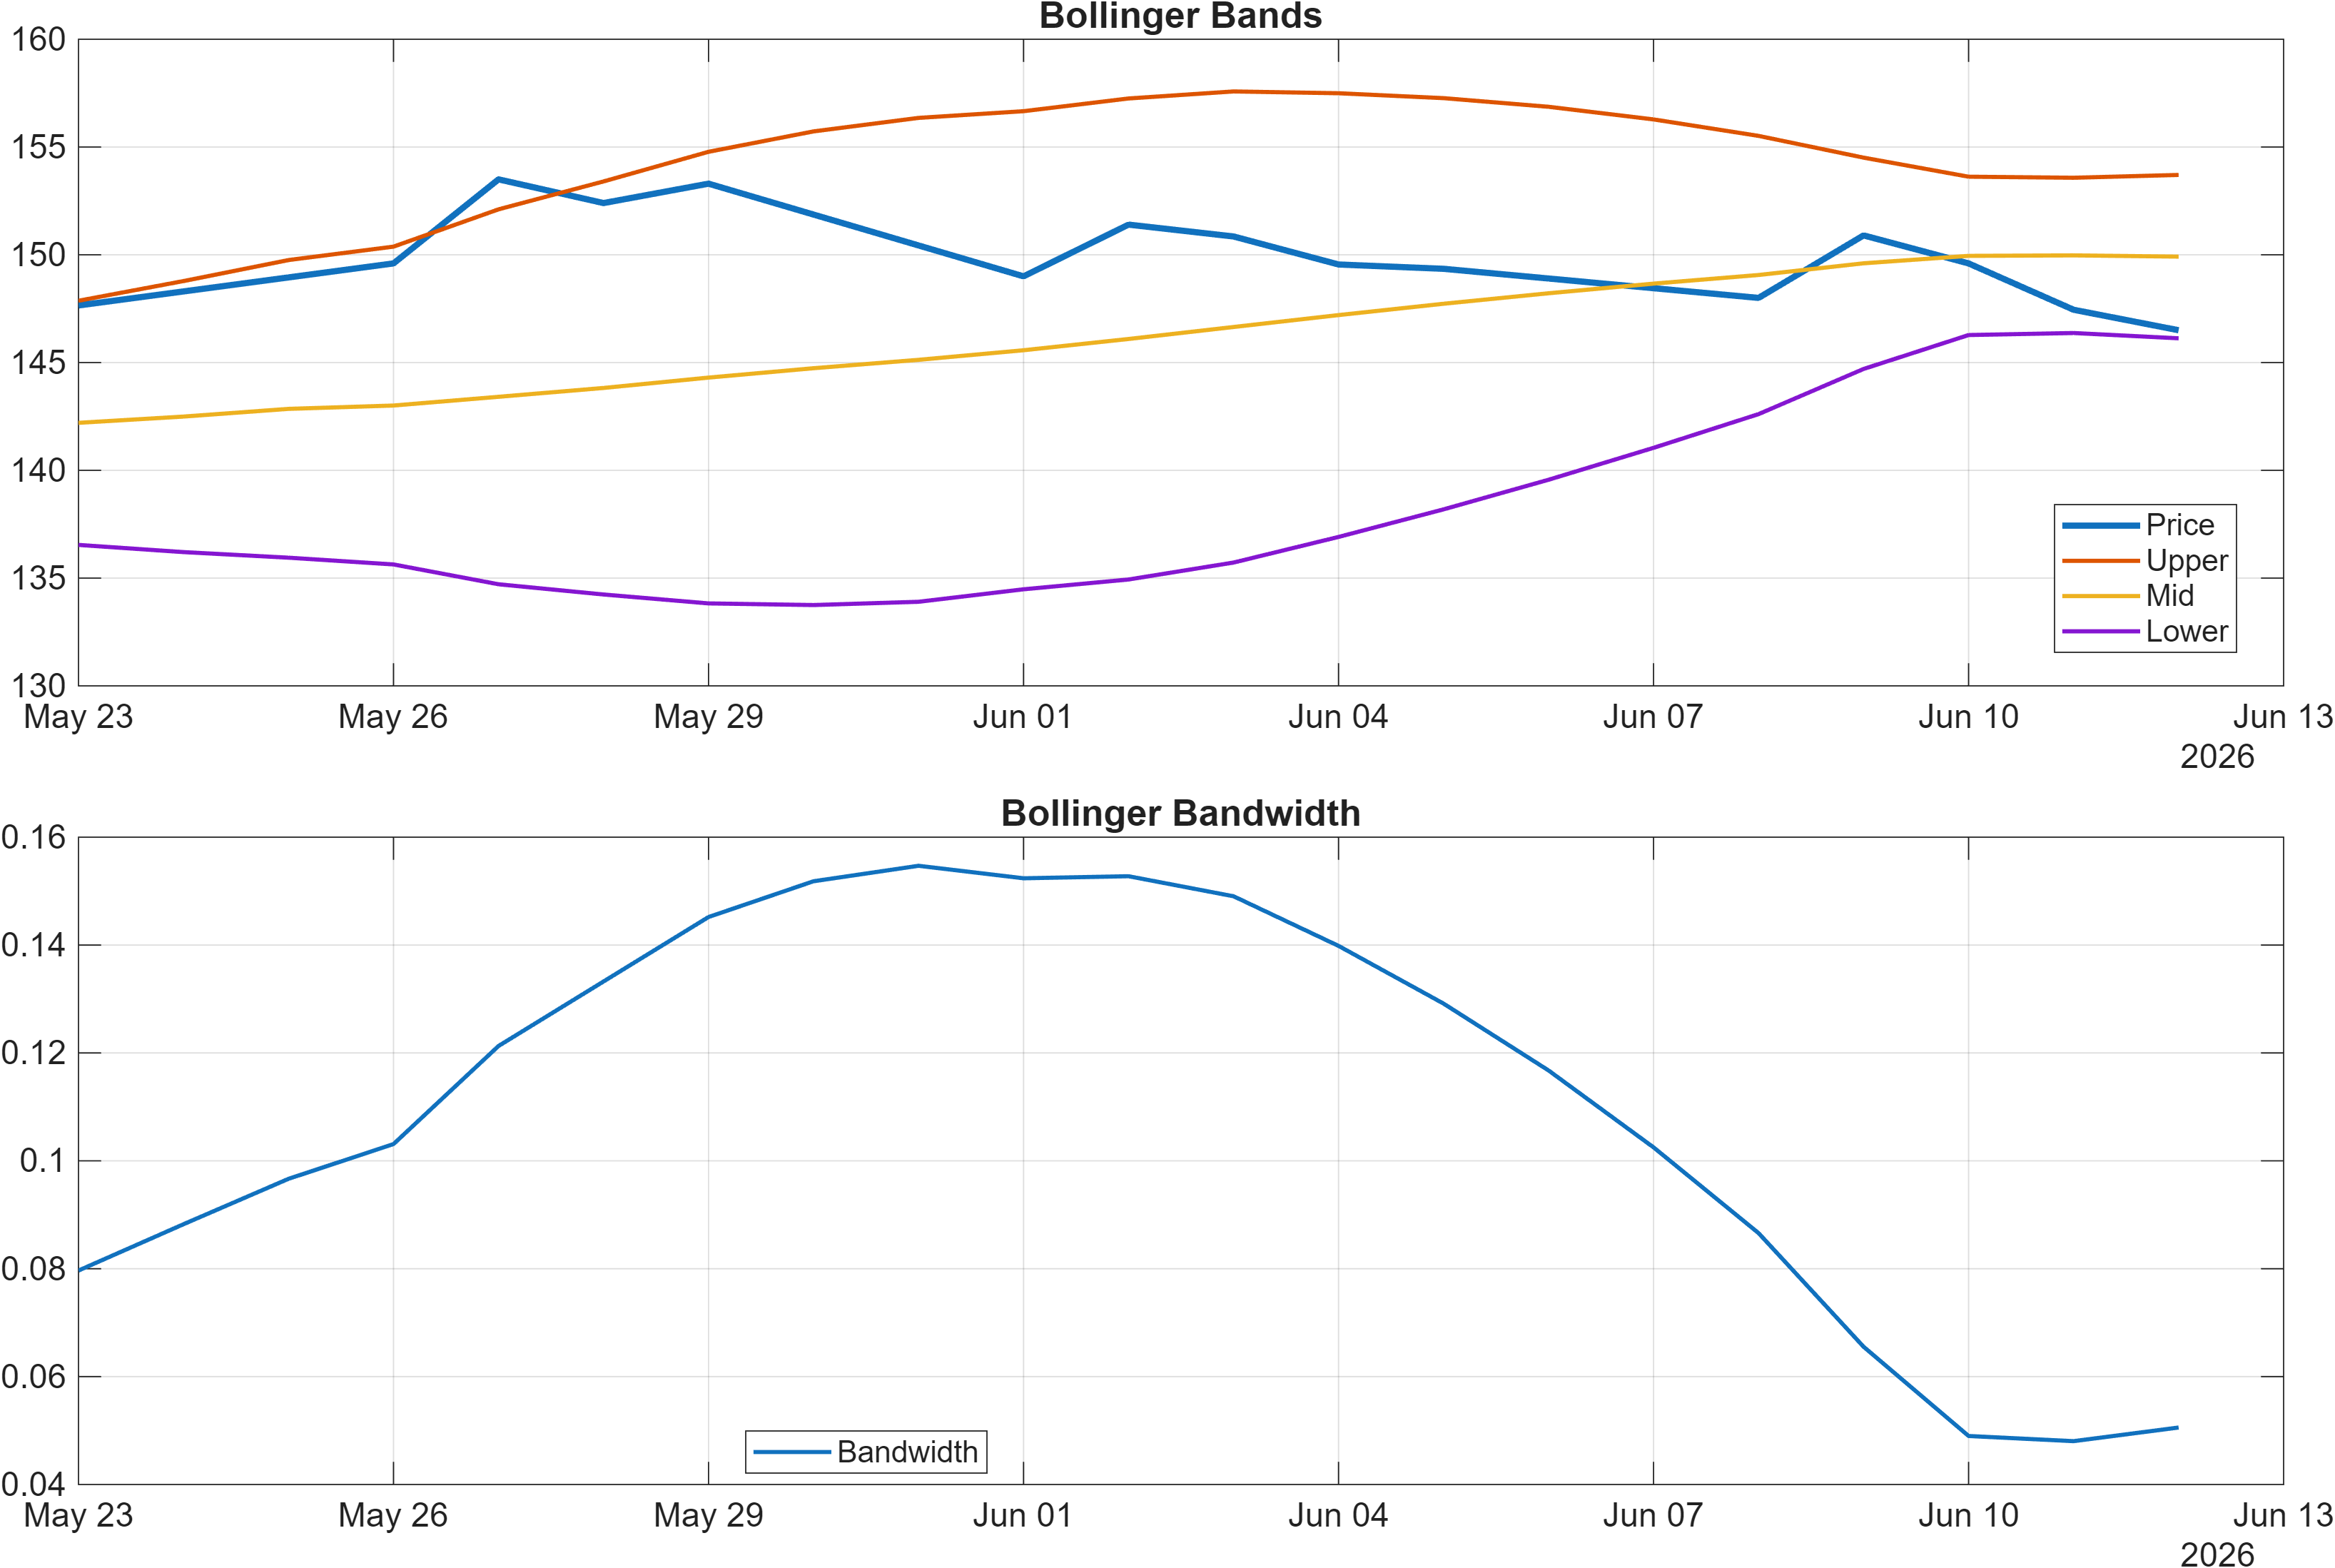
Volatility conditions are comparatively restrained, with bandwidth (0.0506). Compression in Bollinger bandwidth often signals that the market is transitioning from directional movement into consolidation, or that it is “quietly” building energy for a larger move. In this context, the combination of bearish momentum and low bandwidth can be read as a market that has sold off but is not yet expanding volatility in a capitulation-style way.
The analytical focus becomes whether momentum deterioration continues without volatility expansion (a grinding drift) or whether volatility expansion emerges near key levels—typically the point where support/resistance zones start to matter more than oscillator readings.
Interpretation: RSI bias = Bearish, MACD hist = -0.5412.
Interpretation: Bandwidth (volatility regime) latest = 0.0506.
4) Support / Resistance zones
Support ~ 138.0000 | Resistance ~ 154.7333
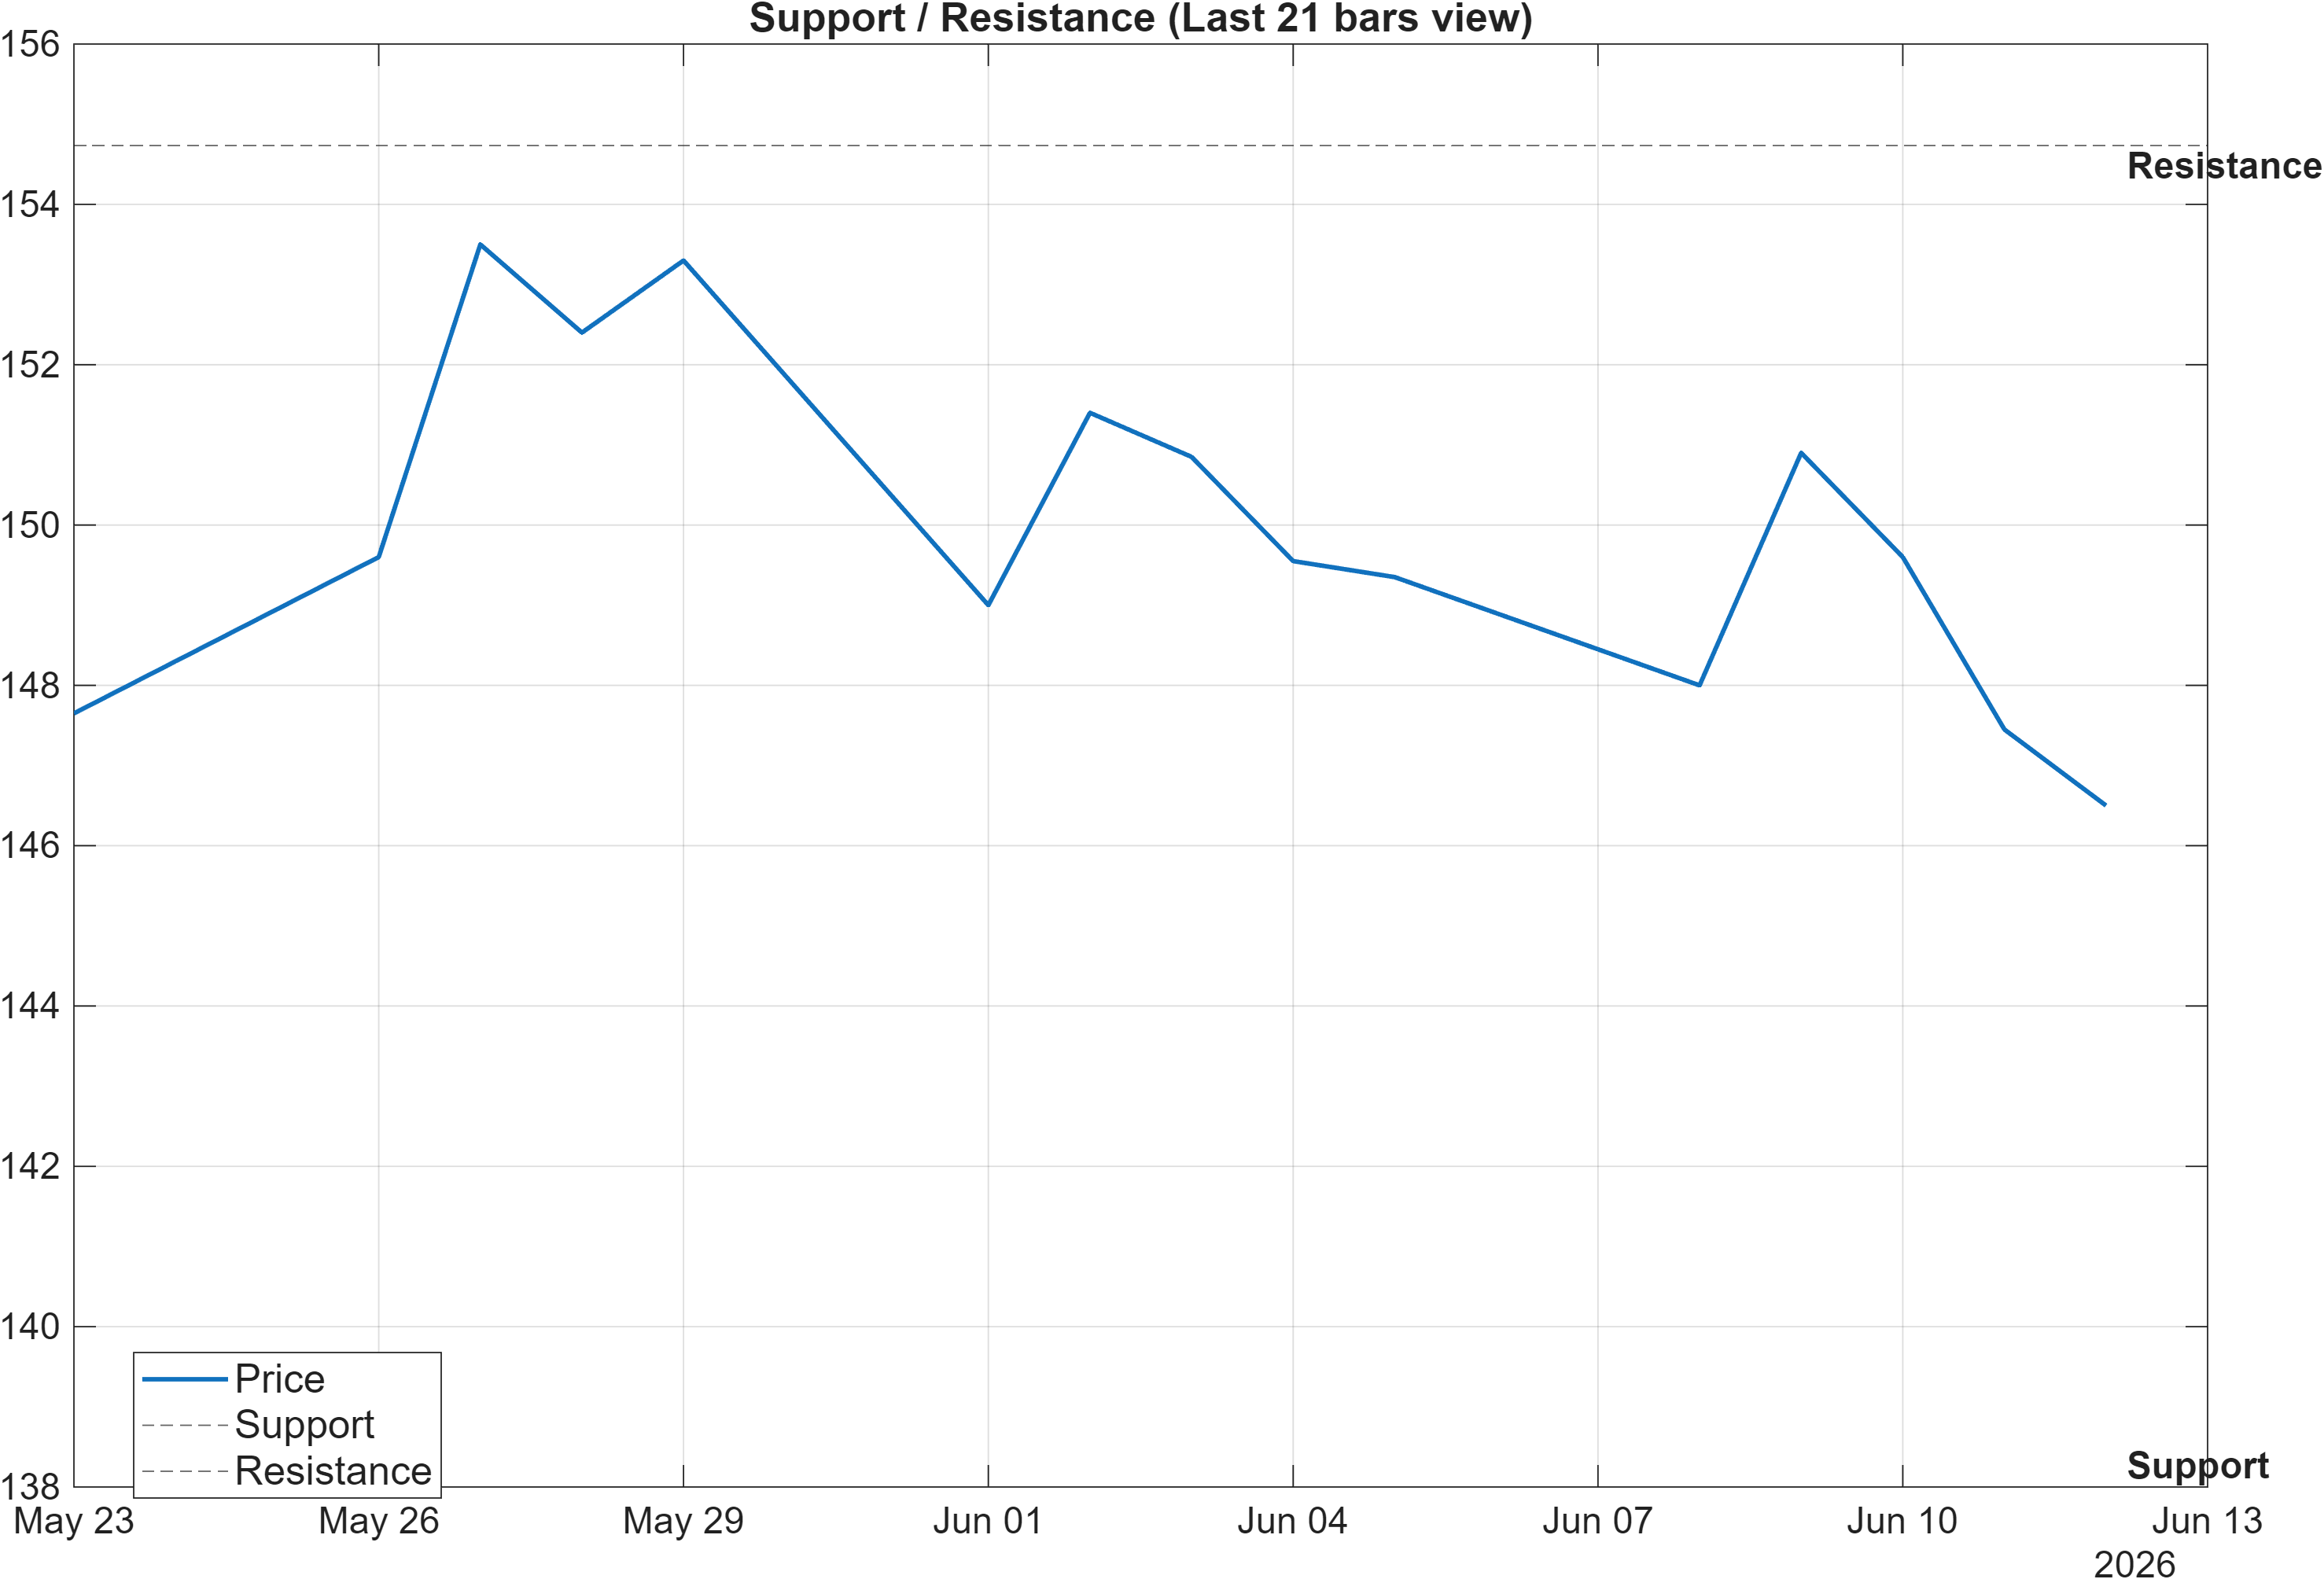
The level map is relatively clean, with support near 138.0000 and resistance near 154.7333. Given the momentum backdrop (e.g., RSI(14) 30.46, MACD hist -0.5412), the support zone is not just a price reference; it is the primary risk-definition boundary for the current regime. Markets that are momentum-weak but volatility-compressed (bandwidth 0.0506) often respect nearby support until they do not—making the first decisive close below support disproportionately informative.
On the upside, resistance near 154.7333 functions as the key “repair” threshold. With the trend read split (Close vs MA50 bearish; MA50 vs MA200 bullish), a move through resistance is more meaningful if it occurs alongside improving participation/flow measures, which are partially captured in the broader technical dashboard (next section). Importantly, the rank mismatch—weak Daily (#1207) vs strong 3-Monthly (#206)—implies that upside confirmation needs to be observable in the tape rather than inferred from longer-horizon positioning.
The practical implication is a two-zone framework: 138.0000 as the deterioration line and 154.7333 as the continuation/repair line. Between them, the probability mass tends to concentrate in range behavior, where signals can whipsaw and where confluence across indicators becomes more valuable than any single reading.
Scenario view: Break above resistance with volume → continuation. Close below support → signal deterioration risk.
5) Quant Technical Dashboard (18 Signals)
KGNAI AI Technical Analysis Score (Deep Reinforcement Learning): Rank #1225 out of 1396 (Rank 1 represents the strongest technical positioning and a higher probability of favorable price behavior. As ranks increase toward the maximum, the probability of favorable outcomes weakens and bearish positioning becomes more dominant.) | Label: Bearish | Score: -0.755
18-Signal Technical Confluence Score: -0.333 (Bearish)
Overall Technical Score (18-signal confluence + DRL rank blend): -0.460 (Bearish)
Note: The blended score reflects signal strength weighted against broader AI technical ranking, which may temporarily diverge.
Blended technical score breakdown: -0.460 (Bearish | Bull 4 / Bear 10 / Neutral 4)
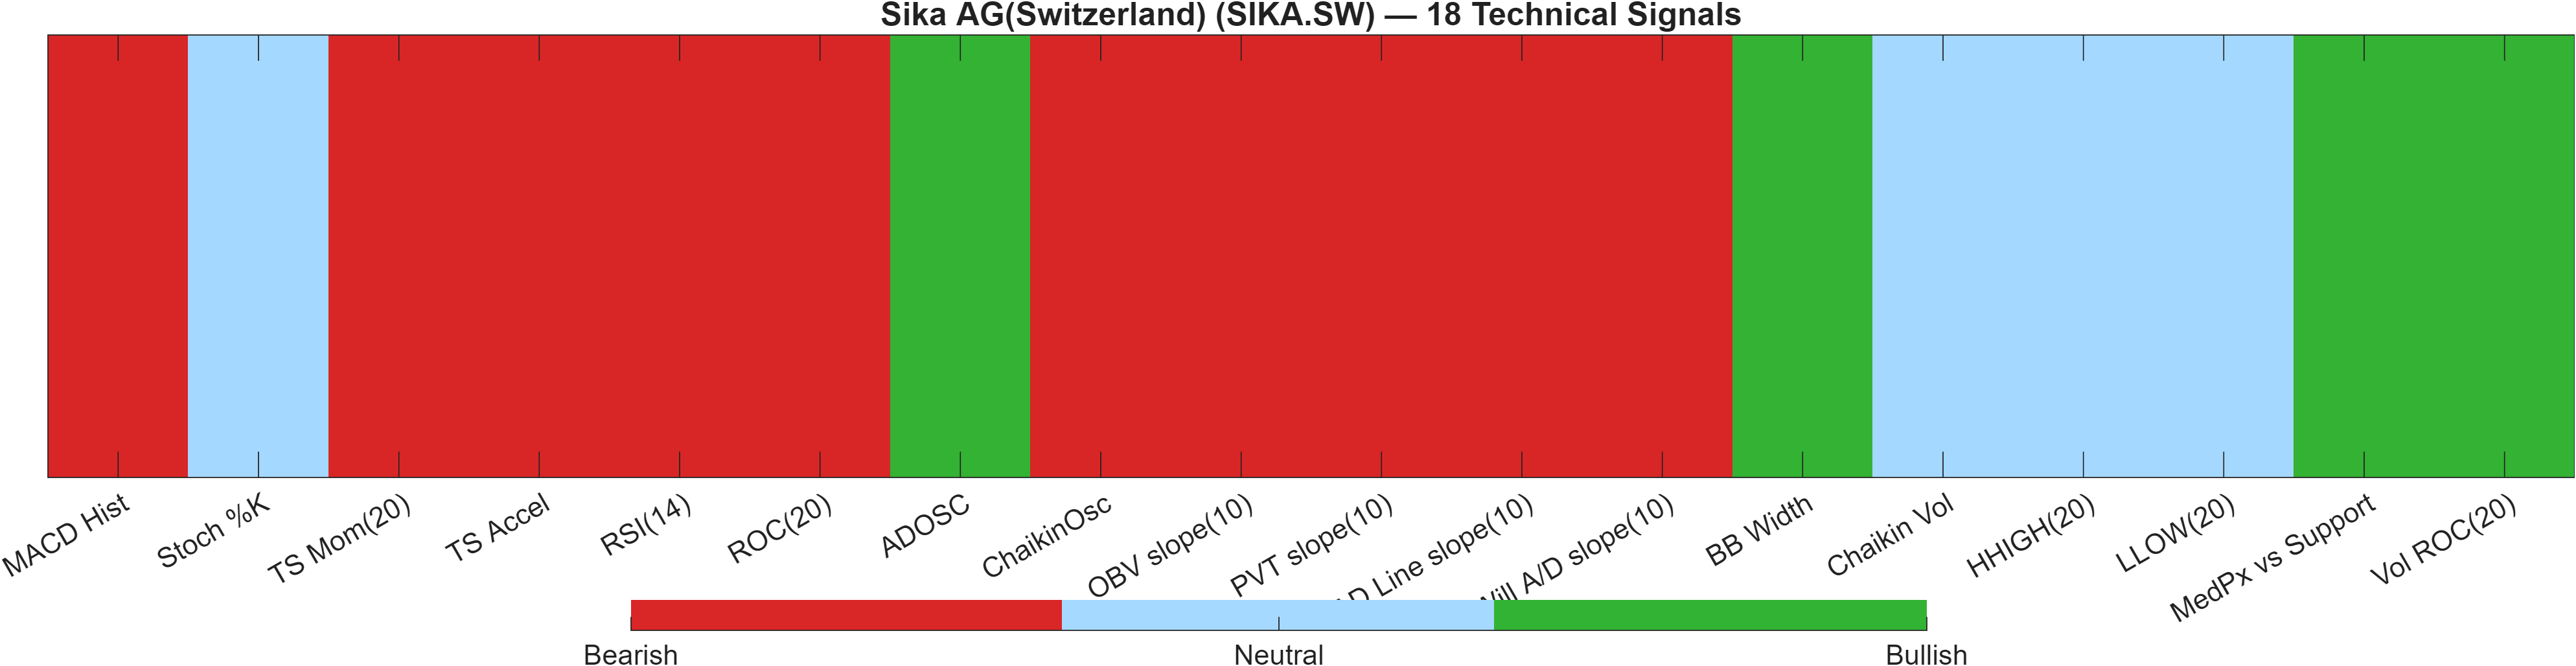
The technical dashboard depicts breadth of weakness rather than an isolated indicator issue. The DRL technical rank (#1225 of 1396) sits in the weaker tail of the universe, consistent with the short-horizon KGNAI rank pressure. Against that, the 18-signal confluence score (-0.333) and the overall blended technical score (-0.460) both remain bearish, with a distribution of Bear 10 / Bull 4 / Neutral 4. This is the profile of a market where multiple independent lenses are pointing in the same cautionary direction.
Within the signal mix, momentum and rate-of-change pressures are a key contributor: MACD histogram -0.5412 and RSI(14) 30.46 align with the broader bearish label. That said, the dashboard is not uniformly negative. The presence of a few bullish elements (e.g., BB Width 0.05056 flagged bullish and certain volume/flow measures showing supportive readings) suggests compression with selective participation support, not a high-volatility breakdown signature.
This is where confluence is most useful: a bearish blended score does not require every component to be bearish—rather, it indicates that the aggregate balance is negative after weighting. In a low-volatility regime (bandwidth near 0.0506), a modest improvement in just a few high-impact momentum/price-structure signals can shift the composite meaningfully. Until then, the most defensible interpretation is that SIKA.SW remains in a technical repair phase, where rallies are more likely to be evaluated against resistance (154.7333) than treated as immediate trend resumption.
Signal table (Bull/Bear/Neutral)
| Indicator | Value | Signal |
|---|---|---|
| MACD Hist | -0.5412 | Bearish |
| Stoch %K | 21.77 | Neutral |
| TS Mom(20) | -0.85 | Bearish |
| TS Accel | -7.35 | Bearish |
| RSI(14) | 30.46 | Bearish |
| ROC(20) | -1.214 | Bearish |
| ADOSC | 35.71 | Bullish |
| ChaikinOsc | -2.907e+05 | Bearish |
| OBV slope(10) | -3.275e+06 | Bearish |
| PVT slope(10) | -1.472e+04 | Bearish |
| AD Line slope(10) | -6.601e+05 | Bearish |
| Will A/D slope(10) | -10.75 | Bearish |
| BB Width | 0.05056 | Bullish |
| Chaikin Vol | -25.93 | Neutral |
| HHIGH(20) | 155.6 | Neutral |
| LLOW(20) | 145.3 | Neutral |
| MedPx vs Support | 9.9 | Bullish |
| Vol ROC(20) | 26.37 | Bullish |
Interpretation: Indicator-level signals form the base confluence, which is then adjusted using a separate AI-driven technical ranking model. The final technical score summarizes this combined view.
6) News sentiment + extractive gist
Sentiment score (avg): 0.143 | Positive: 39% | Neutral: 56% | Negative: 6%
KGNAI AI News Sentiment Score (normalized -1 to +1): 1.00 (as of 2026-06-09) | Label: Bullish | Overall news score: 0.98
Positive Developments
Recent coverage across major financial outlets indicates a constructive narrative around Sika’s operational execution and expansion activity. The tone is supported by the sentiment mix showing 39% positive items and a positive average sentiment score of 0.143. In parallel, the normalized news sentiment score of 1.00 (as of 2026-06-09) frames the aggregated flow as notably supportive despite a market tape that remains technically heavy. The positive angle is largely centered on execution progress, capacity and footprint expansion themes, and strategic actions intended to strengthen positioning across geographies. For investors who weight narrative as a secondary input, the key observation is not that sentiment “overrides” price—rather, it potentially reduces the probability that current weakness is being driven by a uniformly negative information set.
Neutral / Mixed Developments
The dominant distribution remains 56% neutral, which is consistent with informational updates and corporate communications that are directionally ambiguous for near-term price. This neutral majority helps explain why the sentiment posture can look constructive in score terms while still not translating into immediate technical improvement (e.g., RSI(14) 30.46 and MACD histogram -0.5412). Neutral flows tend to reinforce a “wait-for-confirmation” environment: market participants digest updates without materially repricing risk until new information changes expectations or the tape itself turns. In this setting, sentiment is best treated as a contextual stabilizer rather than an outright catalyst, with attention kept on whether the market respects support ~138.0000 during consolidation.
Negative / Risk Signals
Negative coverage appears limited in proportion (6% negative), but it still matters because it tends to focus on the observable outcome that investors can directly verify: weak share performance and the reassessment that can accompany it. This intersects with the model’s short-term stress signals—such as the weak Daily rank (#1207) and bearish blended technical posture (-0.460)—and can reinforce cautious positioning even when fundamental or strategic narratives are not overtly adverse. The main risk signal in the current mix is therefore less about a single discrete headline and more about the feedback loop between price weakness and investor framing. If price fails to stabilize near 138.0000, the negative narrative can gain persistence even without a large increase in negative article share.
- Whether price behavior improves alongside momentum repair (MACD histogram moving toward 0 from -0.5412 and RSI lifting from 30.46).
- Reaction quality at 138.0000 support and any acceleration toward 154.7333 resistance.
- Whether the constructive news score (1.00) persists while technical confluence remains bearish (-0.460), or begins to converge.
Sources referenced: Reuters, Bloomberg, Yahoo Finance, MarketWatch, Investing.com
Snapshot: AI Rank (Short–Mid–Long): Mixed (Bearish–Neutral–Neutral) · Technical Confluence: Bearish · Key Levels: Support ~138.00 | Resistance ~154.73 · News Sentiment: Neutral
7) Sources
Source URLs are not reproduced in this section. See the News sentiment section for the consolidated source list.
You may also like: How KGNAI AI ranks instruments across global markets
Disclaimer: KGNAI provides AI-generated analytics and educational market commentary only. This is not financial advice. Markets involve risk. Always do your own research.