
LPP S.A. (LPP.WAR) Technical, Rank & Sentiment Analysis — 31-May-2026 (Balanced, Bullish Structure with Near-Term Overbought Watch)
LPP S.A. (LPP.WAR) enters 31-May-2026 with a broadly constructive multi-horizon profile, where cross-sectional ranks and technical confluence point in the same direction even as select fast-oscillators hint at late-stage momentum. Across a 1397-instrument European universe, the 6-Monthly rank at #7 and 3-Monthly rank at #19 place LPP.WAR in the top decile for relative positioning, while the shorter windows remain supportive (Daily #66, Weekly #45). Technically, the blended framework stays Bullish with an Overall Technical Score of 0.725 and a strong breadth skew (Bull 13 / Bear 1 / Neutral 4). The key tactical question is less “direction” and more “quality of continuation”: price structure is bullish versus moving averages, but momentum is elevated with RSI(14) at 69.5 and Stoch %K at 94.32 (Bearish). Support and resistance remain well-defined at 20273.3333 and 24030.0000, respectively, while news sentiment is currently Neutral due to the absence of instrument-specific matches in the provided data.
Key Takeaways
- Rank stance (Short / Mid / Long): Bullish / Bullish / Bullish (top-decile strength highlighted by #7 (6-Month) and #19 (3-Month)).
- Technical confluence: Bullish (Overall Technical Score 0.725; DRL rank #97).
- Key levels: Support ~ 20273.3333 | Resistance ~ 24030.0000.
- News sentiment bias: Neutral (Sentiment score avg 0.000; 100% neutral).
- Confirmation / invalidation: Strength is best confirmed on a break above 24030.0000 with volume; risk increases on a close below 20273.3333.
What KGNAI Measures
KGNAI evaluates assets using large cross-sectional datasets built from millions of structured data points. Inputs incorporate fundamental metrics, technical structures, and systematically processed news sentiment. Statistical models, machine learning, and AI frameworks are used to assess relative positioning, signal alignment, and probabilistic behavior across broad universes.
How to Read This Report
- Ranks are comparative across the tracked universe, not absolute price targets.
- Confluence reflects alignment among independent signal groups.
- Support/resistance levels are probabilistic decision zones, not guarantees.
- Sentiment provides contextual bias within the broader analytical framework.
1) KGNAI AI Analysis
Region: EUROPE
Total universe size: 1397 ranked instruments
- Daily rank: #66 out of 1397 — Bullish
- Weekly rank: #45 out of 1397 — Bullish
- Monthly rank: #47 out of 1397 — Bullish
- 3-Monthly rank: #19 out of 1397 — Bullish
- 6-Monthly rank: #7 out of 1397 — Bullish
- Yearly rank: #201 out of 1397 — Bullish
LPP.WAR’s rank stack shows an unusually consistent upper-quartile to top-decile profile across most horizons, with the clearest concentration of strength in the intermediate windows. The #7 (6-Month) and #19 (3-Month) readings indicate that, within the 1397-instrument universe, LPP.WAR sits among the strongest relative regimes observed by the KGNAI tests over the last two quarters. Importantly, the shorter-term ranks (#66 Daily, #45 Weekly, #47 Monthly) remain bullish rather than fading—suggesting that the stronger mid-term impulse is not currently being “rejected” by short-horizon behavior.
The one area that tempers the otherwise uniform signal is the Yearly rank at #201. While still labeled Bullish, it sits outside the top decile and implies that the longer-run comparative advantage is less dominant than the recent 3–6 month window. In practical market-structure terms, this pattern often coincides with a regime that has improved meaningfully versus peers in recent months but has not yet fully “caught up” on a one-year relative basis.
Netting the stack together, the model’s stated term view remains Short-term: Bullish, Mid-term: Bullish, Long-term: Bullish. The analytical implication is not a guarantee of continuation, but a higher-confidence baseline that should be evaluated against technical confirmation (trend, momentum) and level-based invalidation (support/resistance) rather than narrative.
Want the full universe and complete rank tables? Unlock full access on KGNAI: https://www.kgnai.com/pricing
2) Price & trend overview
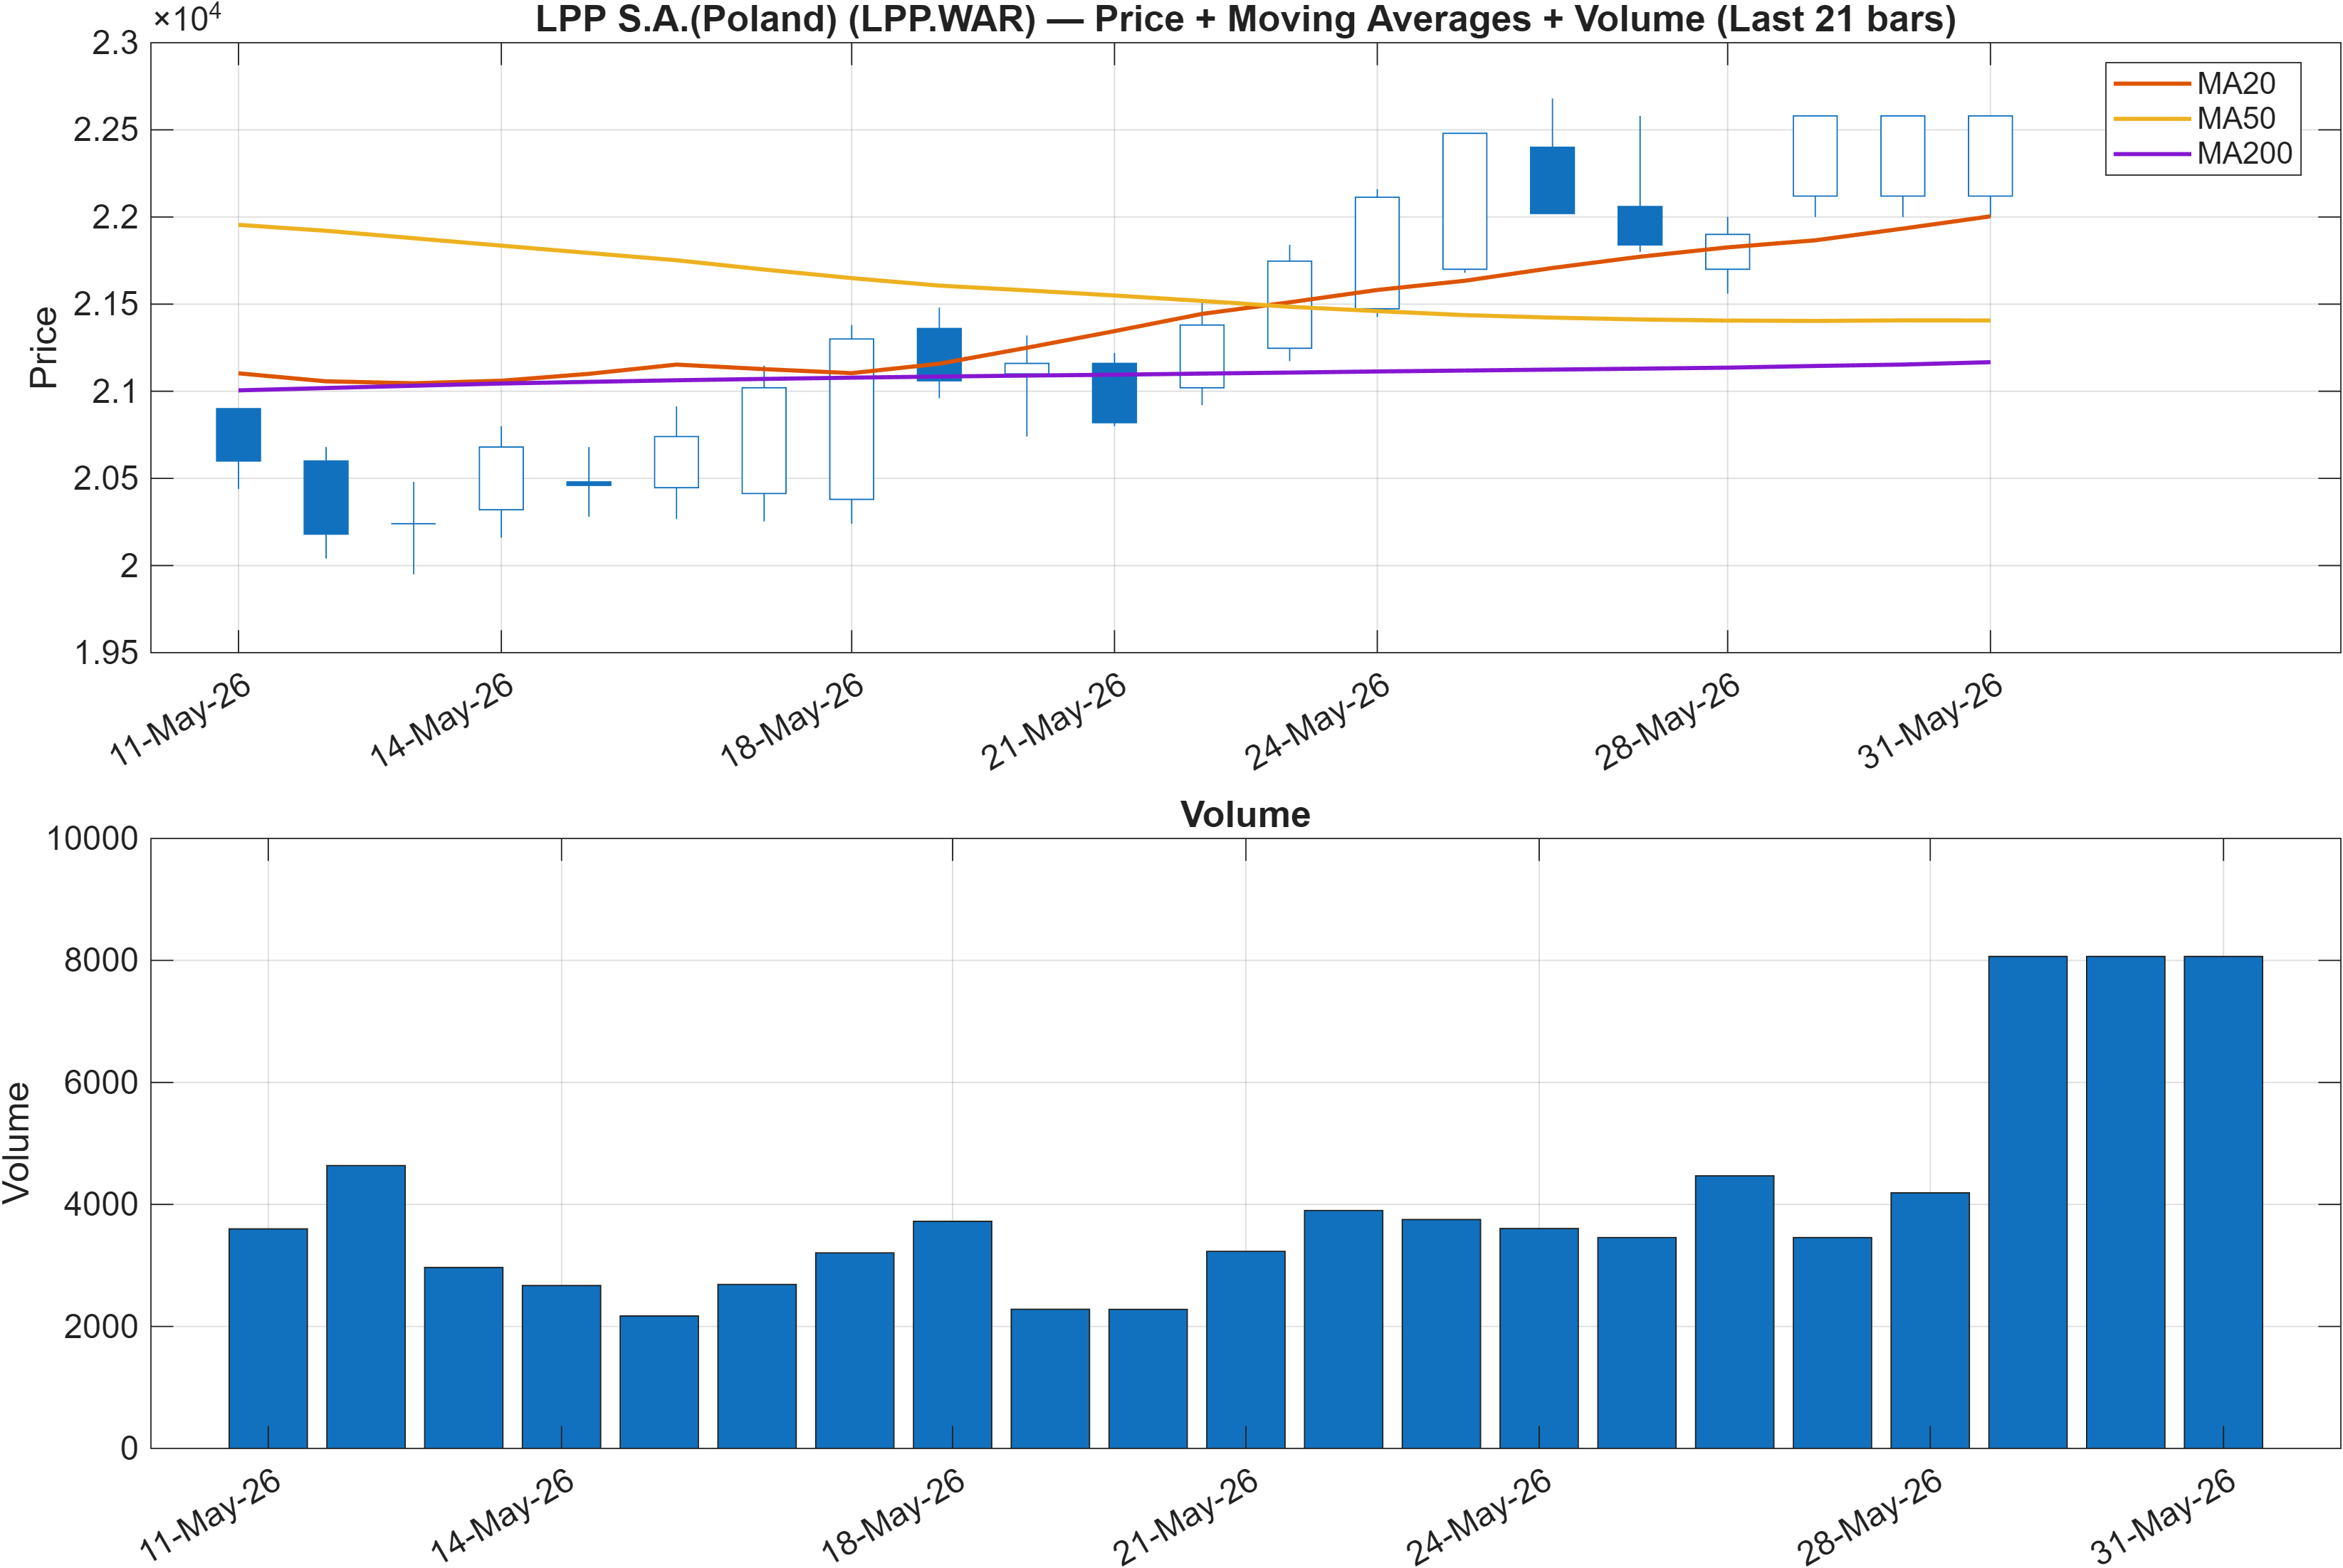
The trend read is clean: the provided interpretation flags Close vs MA50 = Bullish and MA50 vs MA200 = Bullish. That combination typically reflects two things simultaneously—price is holding above the intermediate trend gauge, and the intermediate trend is positioned above the long-term baseline. When both conditions hold, pullbacks tend to be evaluated as tests of trend integrity rather than immediate reversals, with attention shifting to whether participation (volume) confirms directional moves.
What makes this trend configuration more actionable in the KGNAI context is its agreement with the cross-sectional ranks: the intermediate ranks (#19 over 3 months, #7 over 6 months) align with a bullish moving-average structure, which reduces the probability that the trend signal is merely a short-lived spike. The Daily rank at #66 adds a constructive near-term overlay: it implies the short-horizon model is not materially deteriorating even as momentum indicators (covered next) approach elevated territory.
Trend integrity vs. late-stage behavior
A bullish MA stack can persist through multiple volatility regimes, but continuation quality often depends on whether momentum is accelerating or beginning to compress. The later sections highlight a mixed late-stage note: while momentum breadth is strong (technical confluence remains bullish), the dashboard includes an overbought-sensitive oscillator showing stress (Stoch %K at 94.32 is Bearish). In this setup, the higher-probability approach is to treat trend as intact unless level-based invalidation occurs, while recognizing that upside can become less linear as oscillators saturate.
3) Momentum & volatility dashboard
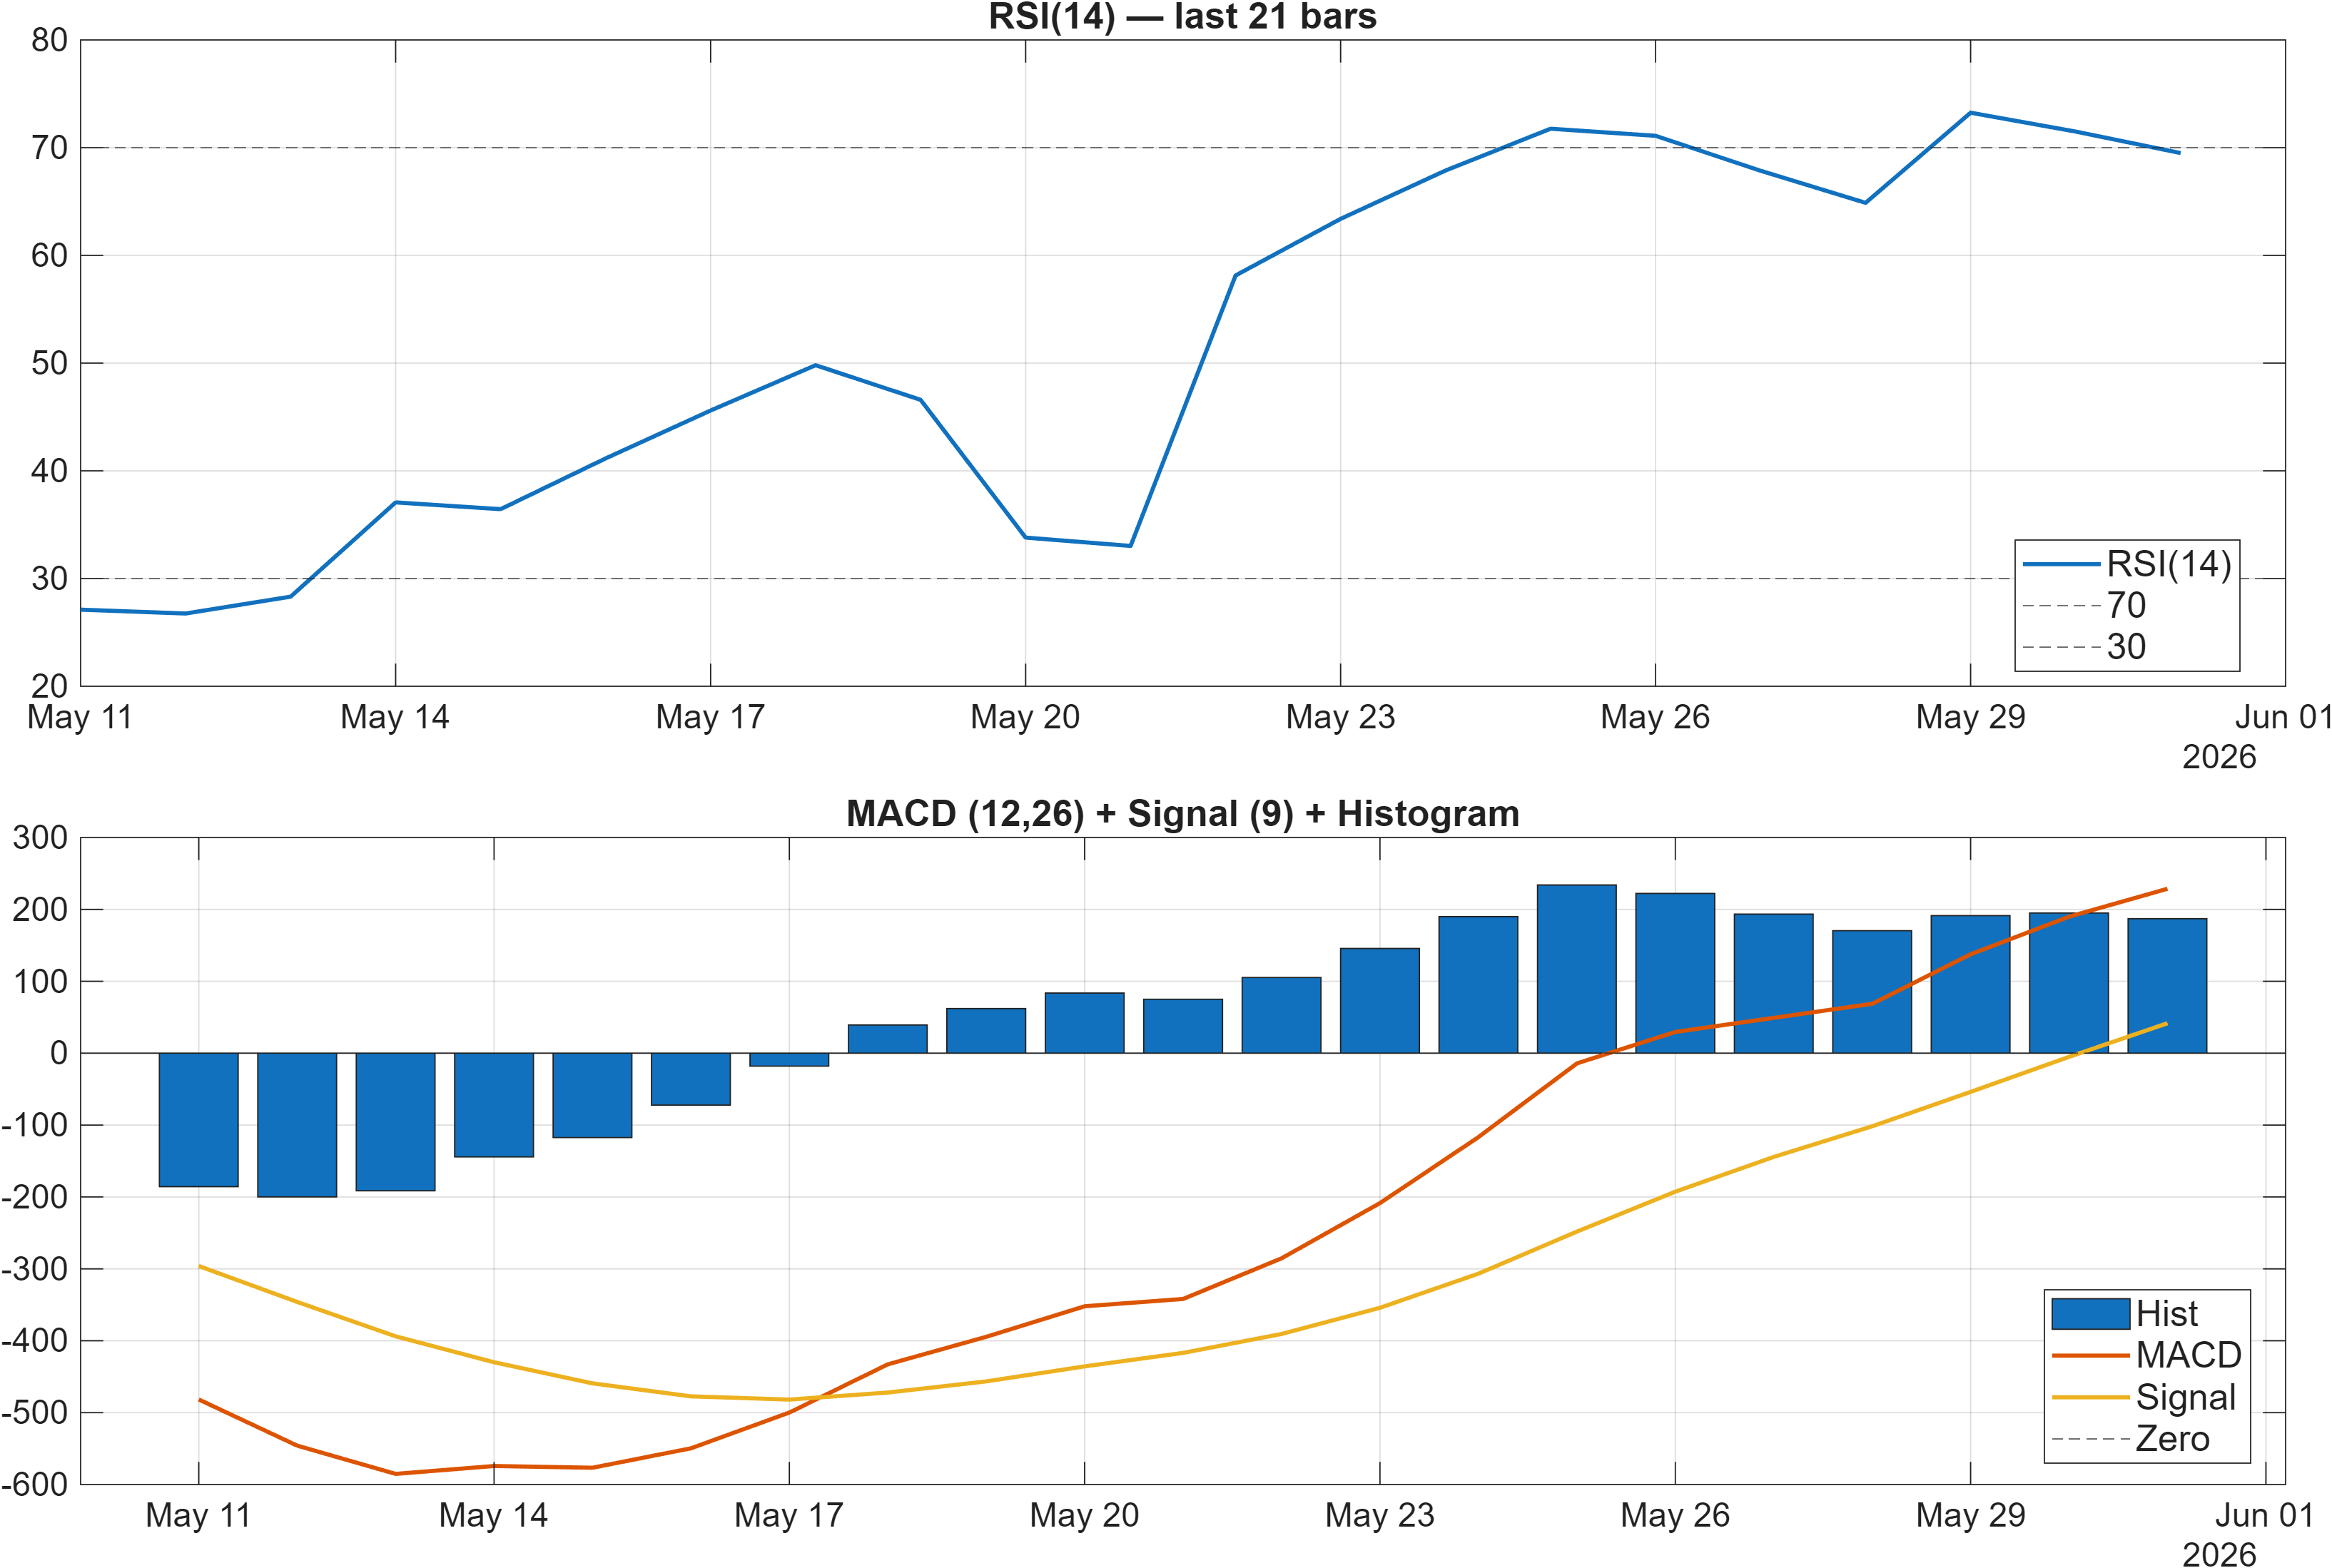
Momentum is supportive but increasingly “sensitive” to mean-reversion. The dashboard indicates RSI bias = Bullish with RSI(14) at 69.5, which is consistent with strong upside pressure while approaching the zone where marginal buyers can become less incremental. At the same time, the MACD layer remains constructive, with MACD hist = 187.0455 (also reflected as 187 in the signal table), reinforcing that positive momentum is not isolated to a single oscillator.
Expansion vs. compression in the volatility regime
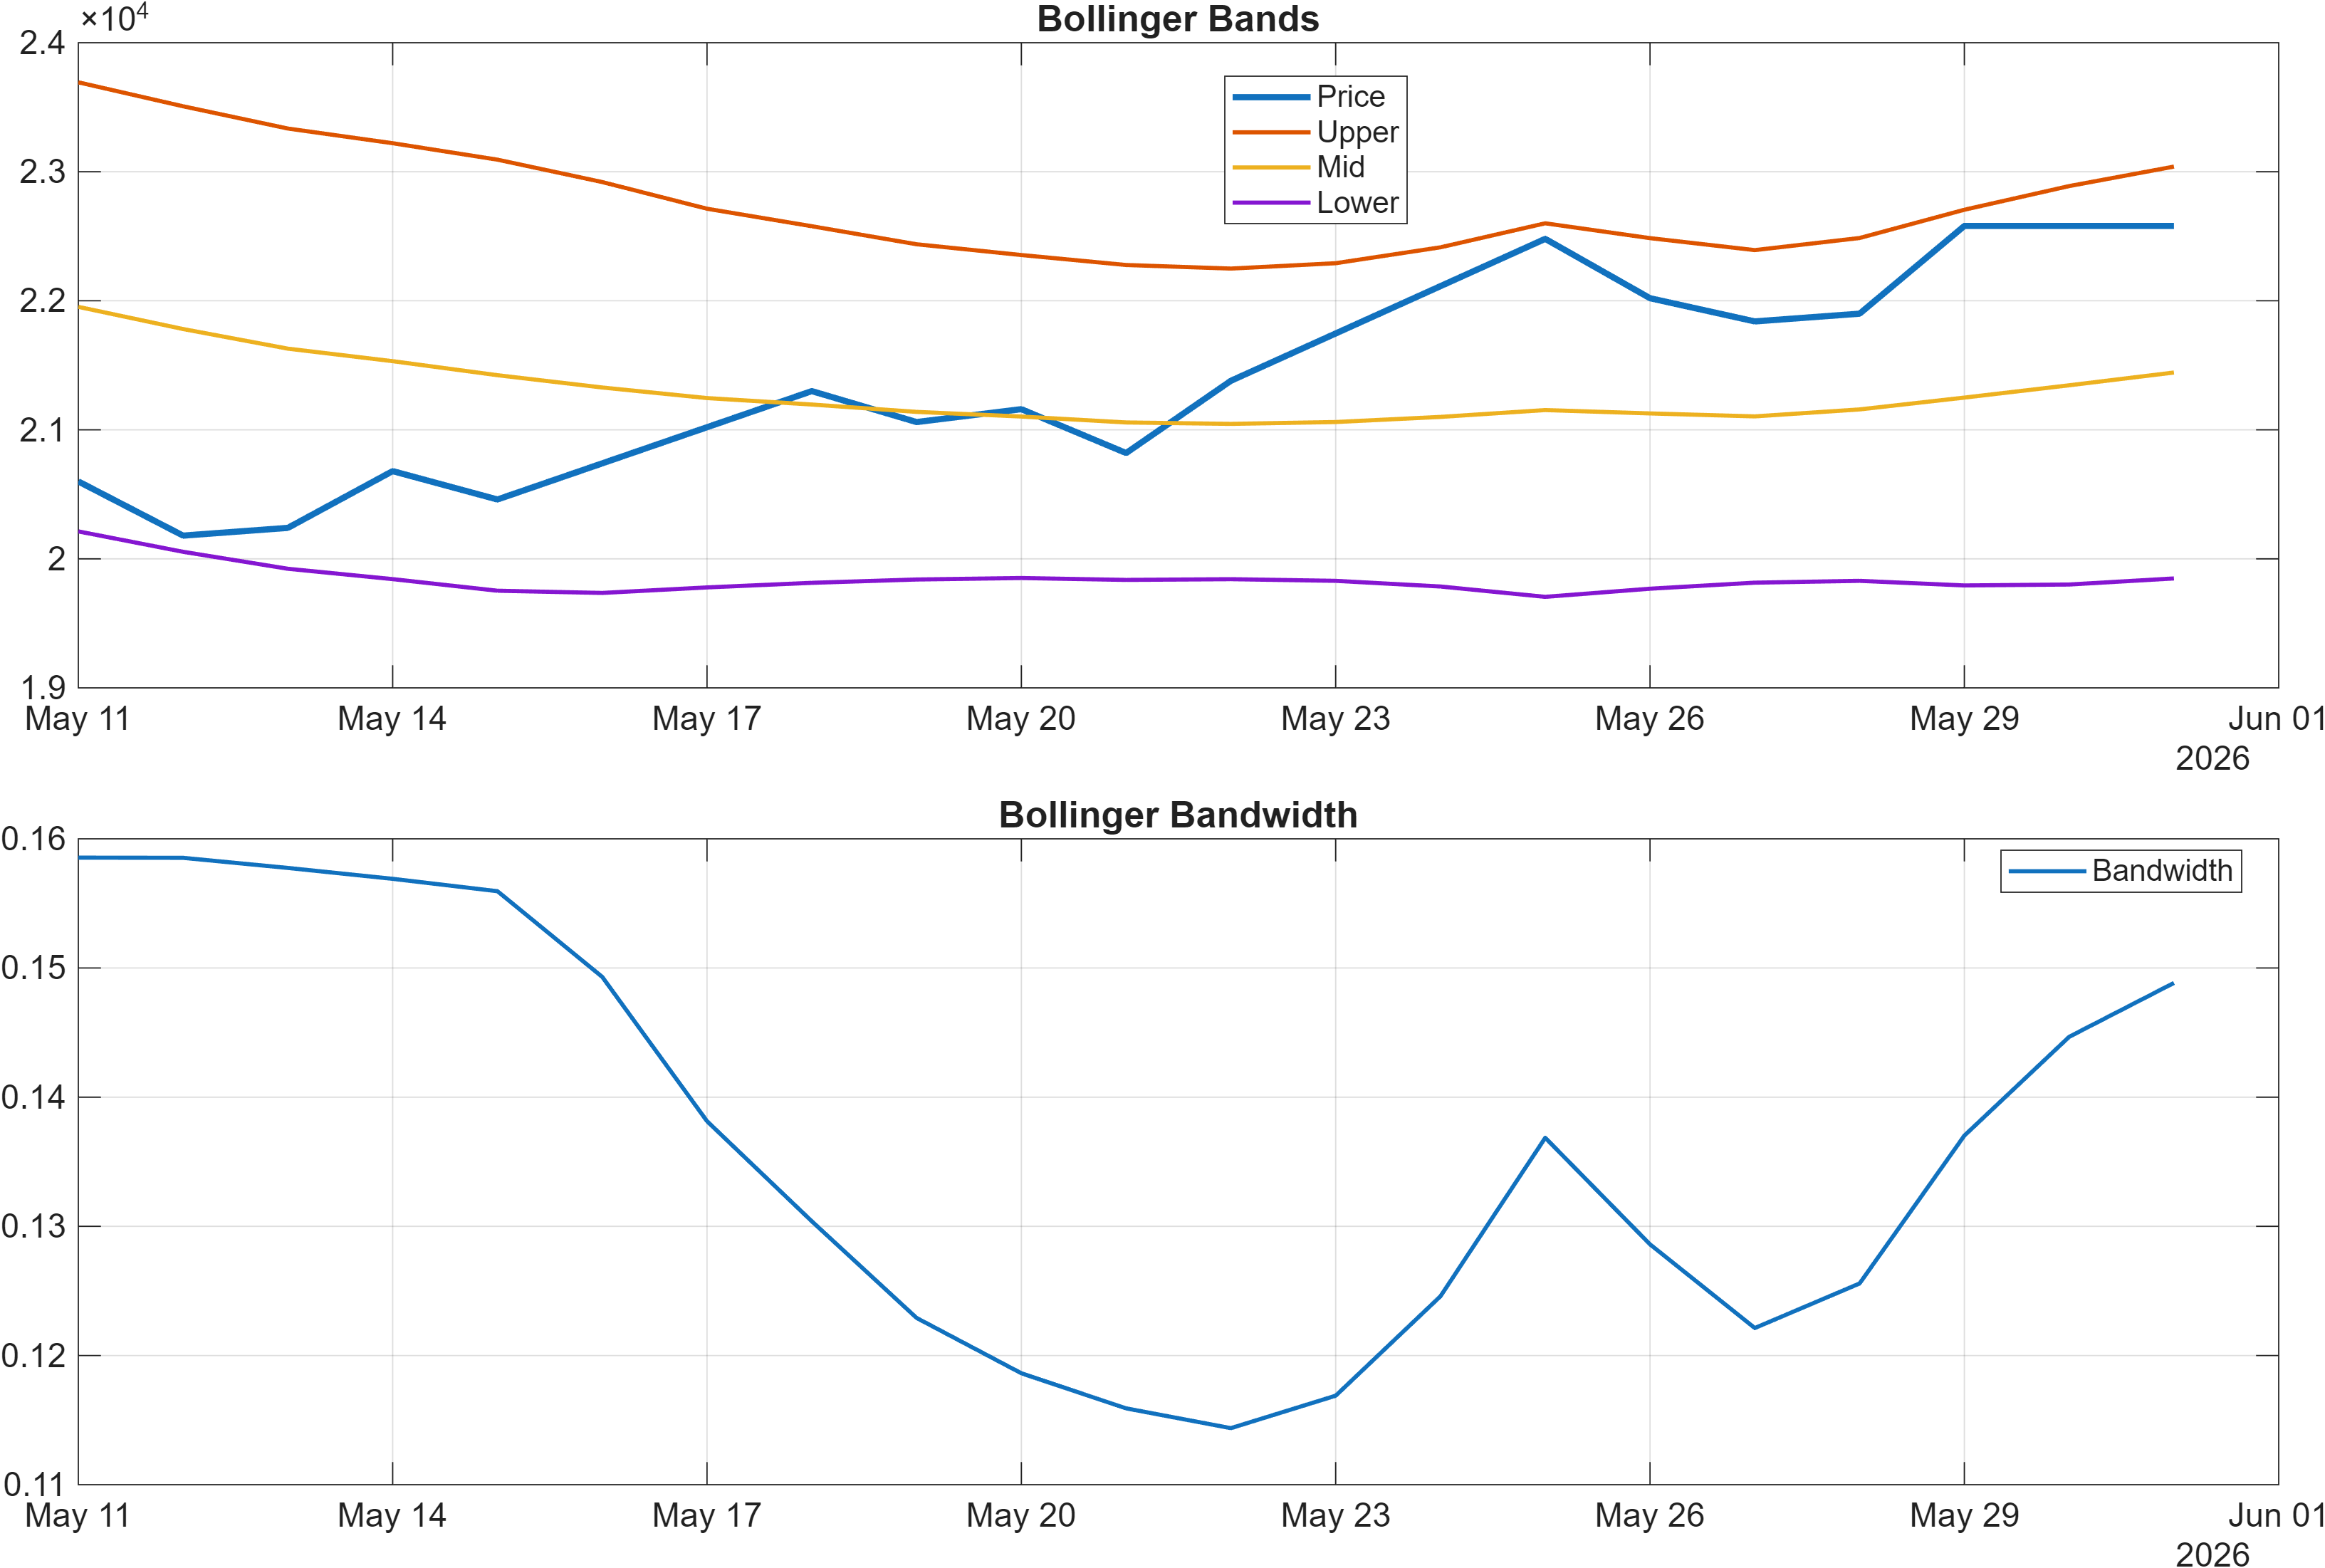
Volatility, as proxied by Bollinger bandwidth, is not signaling an extreme condition: Bandwidth latest = 0.1488 and is labeled Neutral in the 18-signal stack. That matters because strong trends often break down not at the first overbought reading, but when volatility expands aggressively while momentum diverges. Here, the picture is closer to “momentum strong, volatility controlled,” which tends to support orderly continuation—provided breadth remains intact.
Momentum divergence to watch
The main tension sits between trend-following momentum and the fastest oscillator: Stoch %K at 94.32 is flagged Bearish, implying short-horizon overheating risk even while MACD and RSI remain bullish. In similar configurations, momentum can stay positive but become more path-dependent—favorable outcomes often require either consolidation (time) or a shallow pullback (price) rather than immediate further acceleration.
4) Support / Resistance zones
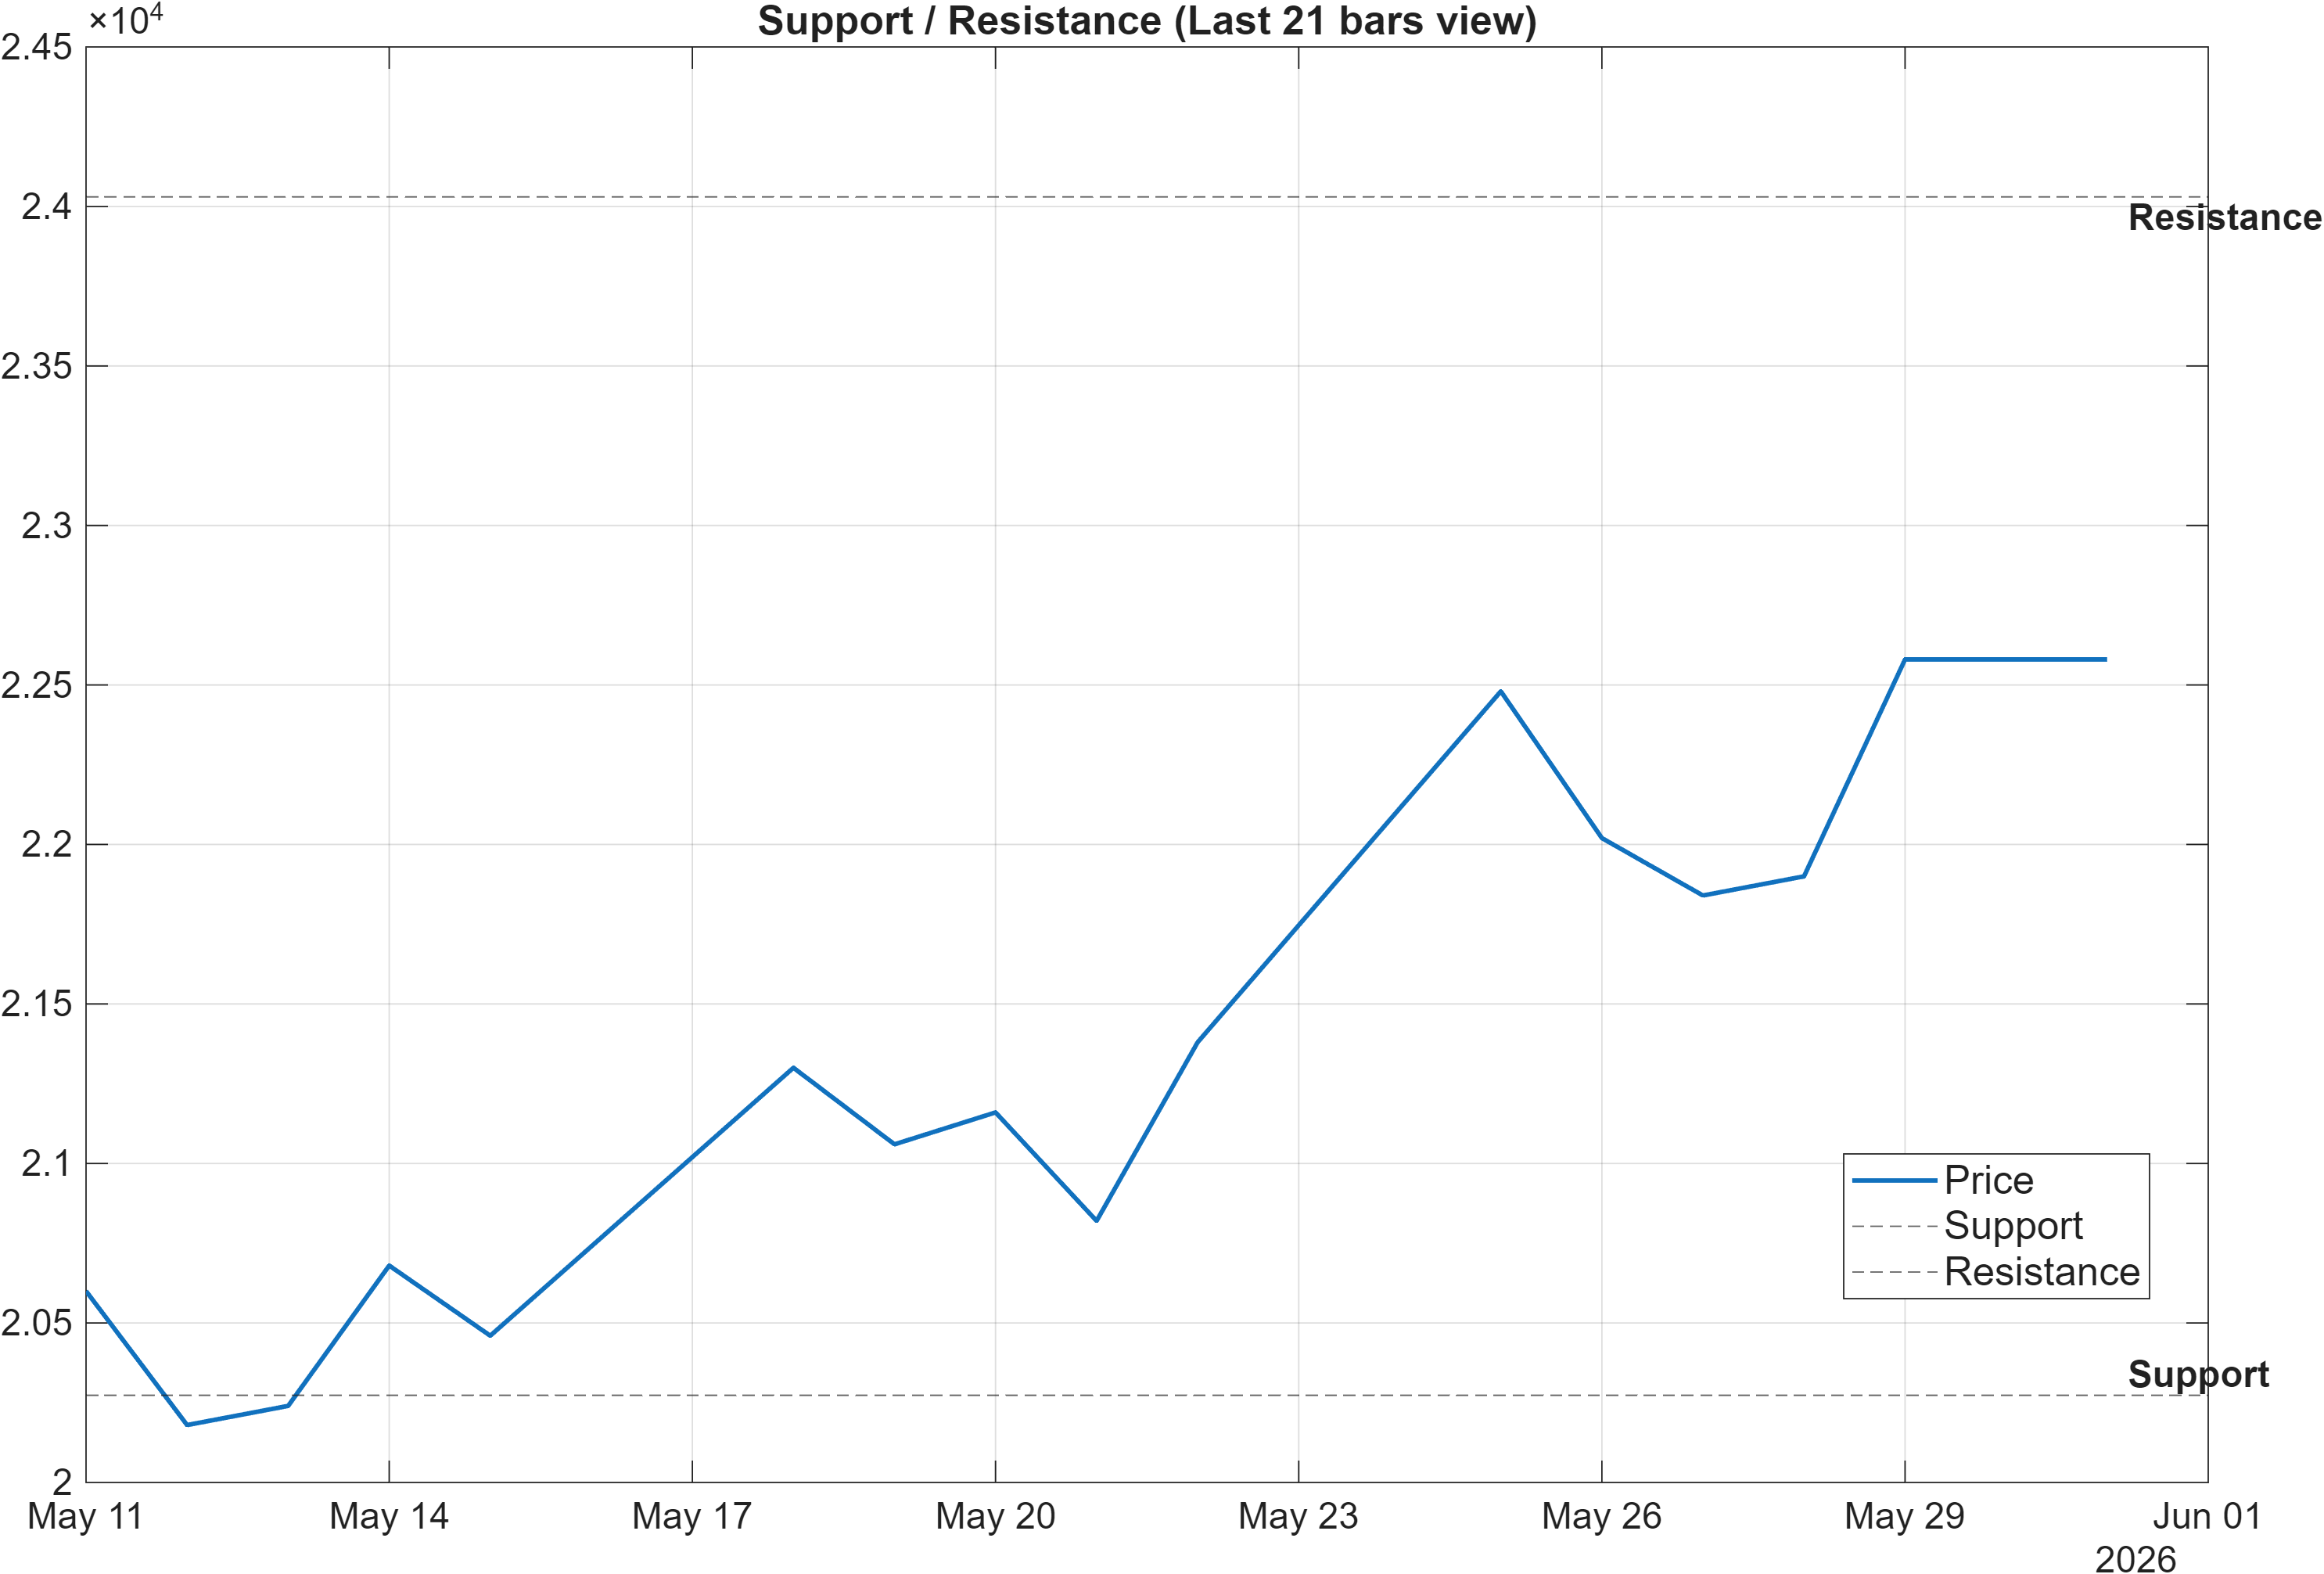
Support and resistance define the decision framework more clearly than any single indicator reading in this setup. The key zones are Support ~ 20273.3333 and Resistance ~ 24030.0000. With trend readings already bullish versus MA50 and MA200, these levels function as the practical boundaries for assessing whether strength is being accepted (continuation) or challenged (deterioration).
Continuation conditions vs. failure conditions
The scenario guidance is explicit: a break above resistance with volume supports continuation, while a close below support increases signal-deterioration risk. This is particularly relevant given the mixed momentum tone—RSI(14) at 69.5 remains bullish, but the oscillator overheat signal (Stoch %K 94.32 bearish) raises the probability of short-term swings around levels.
Level discipline in a bullish regime
When multi-horizon ranks are as strong as #7 (6-Month) and technical breadth is skewed bullish (discussed next), the more common failure mode is not an immediate trend reversal but a breakdown that begins with repeated inability to convert resistance into acceptance. Conversely, a clean acceptance above 24030.0000 helps resolve the “late-cycle oscillator” tension by letting price confirm what the broader rank and trend structure already implies.
5) Quant Technical Dashboard (18 Signals)
KGNAI AI Technical Analysis Score (Deep Reinforcement Learning): Rank #97 out of 1397 (Rank 1 represents the strongest technical positioning and a higher probability of favorable price behavior. As ranks increase toward the maximum, the probability of favorable outcomes weakens and bearish positioning becomes more dominant.) | Label: Bullish | Score: 0.861
18-Signal Technical Confluence Score: 0.667 (Bullish)
Overall Technical Score (18-signal confluence + DRL rank blend): 0.725 (Bullish)
Note: The blended score reflects signal strength weighted against broader AI technical ranking, which may temporarily diverge.
Blended technical score breakdown: 0.725 (Bullish | Bull 13 / Bear 1 / Neutral 4)
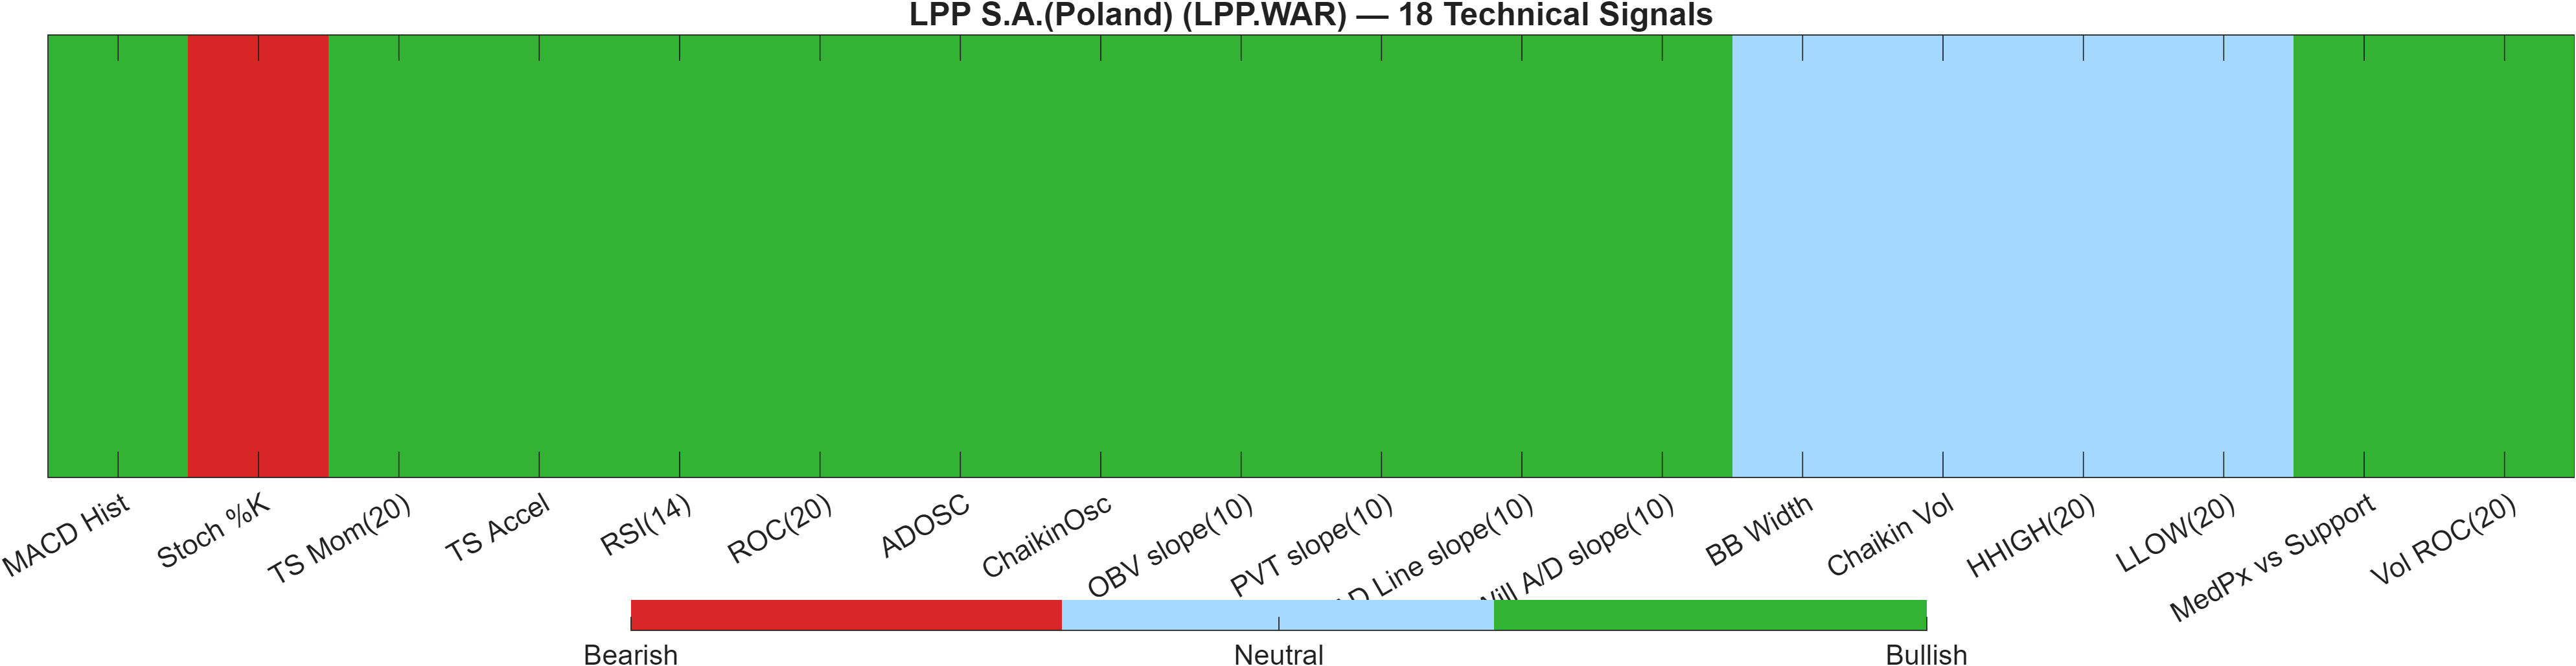
The technical layer is defined by breadth and agreement. The 18-Signal Technical Confluence Score of 0.667 and the Overall Technical Score of 0.725 both carry Bullish labels, and the composition (Bull 13 / Bear 1 / Neutral 4) indicates the bullish case is not dependent on a single family of indicators. The DRL model reinforces this with a #97 rank across 1397 instruments and a score of 0.861, which is consistent with upper-quartile technical positioning in cross-section.
Signal clustering: momentum + participation
Within the signal set, positive momentum and participation metrics appear to cluster together. Momentum strength is reflected in MACD Hist (187) and ROC(20) at 11.89, while volume/flow measures support the move with ADOSC at 89.66 and a strongly positive Vol ROC(20) at 73.93. When price action is supported by multiple participation proxies, continuation attempts tend to be more resilient because pullbacks are less likely to be purely liquidity-driven.
Where the dashboard is cautious
The caution is concentrated rather than broad: Stoch %K at 94.32 is the lone bearish flag, consistent with near-term overbought pressure rather than structural weakness. Meanwhile, volatility is not registering as a bullish tailwind or bearish headwind—BB Width at 0.1488 remains neutral—suggesting the market is not currently pricing an abrupt regime shift through volatility expansion.
Level-based alignment with the technical stack
With a bullish blend and strong breadth, the most analytical way to manage disagreement (bullish breadth vs. overbought oscillator) is through levels. The support at 20273.3333 becomes the key invalidation reference for the bullish thesis, while acceptance above 24030.0000 helps confirm that strength remains more than a short-term momentum burst.
Signal table (Bull/Bear/Neutral)
| Indicator | Value | Signal |
|---|---|---|
| MACD Hist | 187 | Bullish |
| Stoch %K | 94.32 | Bearish |
| TS Mom(20) | 2400 | Bullish |
| TS Accel | 5500 | Bullish |
| RSI(14) | 69.5 | Bullish |
| ROC(20) | 11.89 | Bullish |
| ADOSC | 89.66 | Bullish |
| ChaikinOsc | 9983 | Bullish |
| OBV slope(10) | 1.904e+04 | Bullish |
| PVT slope(10) | 429.6 | Bullish |
| AD Line slope(10) | 3.03e+04 | Bullish |
| Will A/D slope(10) | 2240 | Bullish |
| BB Width | 0.1488 | Neutral |
| Chaikin Vol | -4.601 | Neutral |
| HHIGH(20) | 2.268e+04 | Neutral |
| LLOW(20) | 1.995e+04 | Neutral |
| MedPx vs Support | 2017 | Bullish |
| Vol ROC(20) | 73.93 | Bullish |
Interpretation: Indicator-level signals form the base confluence, which is then adjusted using a separate AI-driven technical ranking model. The final technical score summarizes this combined view.
6) News sentiment + extractive gist
Note: Instrument-specific news matches were not found, so the digest includes broader market/sector headlines. Links are provided for verification.
Sentiment score (avg): 0.000 | Positive: 0% | Neutral: 100% | Negative: 0%
KGNAI AI News Sentiment Score (normalized -1 to +1): Not available (as of —) | Label: Not available | Overall news score: 0.00
Positive Developments
Recent coverage across major financial outlets leans toward broadly constructive themes for European technology and investment capacity, with a particular emphasis on large-scale AI infrastructure commitments and the downstream ecosystem they can enable. In this report’s data, the quantified outcome is not a positive skew in scoring—sentiment remains 0.000 with 100% Neutral—but the surrounding backdrop is not presenting an adverse tone. For LPP.WAR specifically, the relevance is contextual rather than causal: when broader risk appetite and capital formation narratives are constructive, technically strong equities (such as those with bullish ranks and moving-average structure) often find it easier to maintain trend persistence. The key discipline is to separate this ambient tone from instrument-specific catalysts, which are not available in the provided data.
Neutral / Mixed Developments
The dominant feature of the news dataset here is neutrality: the sentiment composition is 0% positive, 100% neutral, and 0% negative, and the normalized news sentiment score is explicitly Not available. That combination typically indicates insufficient instrument-level matching rather than a balanced flow of clearly offsetting headlines. From an analytical standpoint, neutral sentiment reduces the likelihood that price is being driven by fresh narrative pressure. As a result, the technical framework—trend vs moving averages, momentum gauges, and the support/resistance map around 20273.3333 and 24030.0000—should carry more weight in near-term decision-making than attempts to infer directional bias from the news tape presented.
Negative / Risk Signals
The dataset does not register explicit negative sentiment (0% negative), but risk should not be interpreted as absent. The more relevant “risk signal” in this section is informational: because the feed lacks instrument-specific matches, headline-driven shocks—if they occur—may not be captured by this digest in a timely or targeted manner. That limitation elevates the importance of market-based controls already present in the technical work: the overbought-sensitive oscillator (Stoch %K 94.32 bearish) can amplify drawdowns when liquidity thins, and a close below 20273.3333 is explicitly framed as deterioration risk. Until instrument-specific coverage appears, treat sentiment as a low-information input and rely on price/participation confirmation.
- Whether price acceptance develops above 24030.0000 with confirming participation.
- Whether momentum cools without breaking structure (watch RSI(14) 69.5 vs. the overbought-sensitive Stoch %K 94.32).
- Whether any instrument-specific news matching emerges (currently Not available in the provided data).
Sources referenced: Reuters, Bloomberg, Yahoo Finance, MarketWatch, Investing.com
7) Sources
The following items appeared in the provided dataset and are included for transparency of the news backdrop; instrument-specific matches were not found in the provided data.
- SoftBank pledges €75bn to build Europe’s biggest AI facility in France — https://www.ft.com/content/1022f9bd-5b6d-44a5-9303-c8b05b8c6463
- Should AI steal your job? — https://www.ft.com/content/aceabeb1-1152-43d1-ad76-e1531cd37f39
- Trump, Texas and the risk of a Pyrrhic victory — https://www.ft.com/content/437dae98-dc36-432e-a2f6-3eab2eb1bb84
- The floor versus the ceiling — https://www.ft.com/content/7d3ea5eb-8b5c-4282-af95-3b305d4a25f3
- India’s ‘city of glass’ under pressure as Gulf crisis chokes off energy — https://www.ft.com/content/54e7ad62-03ab-4c55-9f22-1102539b415f
- Jes Staley to appear before Congress over ties to Jeffrey Epstein — https://www.ft.com/content/376237d6-64ca-4804-90c5-2f83d78ed288
- Hegseth says US-China ties are ‘better than in years’ — https://www.ft.com/content/0a601b2b-aeba-439d-8915-359f44cecf09
- Paris Saint-Germain retain Champions League with victory over Arsenal — https://www.ft.com/content/42a9a9f3-3cb2-40dd-bab2-9c3d7f7e2554
You may also like: How KGNAI AI ranks instruments across global markets
Disclaimer: KGNAI provides AI-generated analytics and educational market commentary only. This is not financial advice. Markets involve risk. Always do your own research.