UNT.WAR (Unimot S.A.) — 14-Jun-2026 Neutral stance with long-horizon strength vs near-term technical pressure
Unimot S.A. (UNT.WAR) sits in a mixed regime as of 14-Jun-2026: KGNAI’s cross-universe ranks show neutral short- and mid-term positioning (daily #282, weekly #783, monthly #637 out of 1396), while the longer horizon remains decisively strong (3-month #5, 6-month #13, yearly #8). This creates a workable framework for investors who separate time-horizon thesis from tactical execution. On the technical layer, the blended view is Bearish (overall score -0.402) even though the 18-signal confluence alone reads Neutral (-0.278), indicating that the AI technical rank is the main drag (DRL rank #1182). Momentum indicators reinforce caution with RSI(14) at 30.77 and MACD histogram -0.7143. Key levels frame the decision zones: support ~151.4000 and resistance ~170.6000. News sentiment is broadly positive (avg 0.397), but it should be treated as context rather than confirmation.
- Short / Mid / Long rank stance: Neutral / Neutral / Bullish (long-horizon ranks include 3-month #5 and yearly #8 out of 1396).
- Technical confluence label: 18-signal confluence is Neutral (-0.278), but the blended technical view is Bearish (-0.402) due to DRL rank #1182.
- Key levels: Support ~151.4000; Resistance ~170.6000 (probabilistic zones, not guarantees).
- News sentiment bias: Positive (avg sentiment 0.397; positive share 100%).
- Confirmation / invalidation: Strength is better confirmed on a break above 170.6000 with volume; deterioration risk increases on a close below 151.4000.
What KGNAI Measures
KGNAI evaluates assets using large cross-sectional datasets built from millions of structured data points. Inputs incorporate fundamental metrics, technical structures, and systematically processed news sentiment. Statistical models, machine learning, and AI frameworks are used to assess relative positioning, signal alignment, and probabilistic behavior across broad universes.
How to Read This Report
- Ranks are comparative across the tracked universe, not absolute price targets.
- Confluence reflects alignment among independent signal groups.
- Support/resistance levels are probabilistic decision zones, not guarantees.
- Sentiment provides contextual bias within the broader analytical framework.
1) KGNAI AI Analysis
Region: EUROPE
Total universe size: 1396 ranked instruments
- Daily rank: #282 out of 1396 — Neutral
- Weekly rank: #783 out of 1396 — Neutral
- Monthly rank: #637 out of 1396 — Neutral
- 3-Monthly rank: #5 out of 1396 — Bullish
- 6-Monthly rank: #13 out of 1396 — Bullish
- Yearly rank: #8 out of 1396 — Bullish
The rank curve across horizons shows a clear regime split: UNT.WAR is in the upper quartile on the daily view (#282/1396), but drops into the lower half on weekly (#783) and remains mid-pack monthly (#637). In isolation, that short-to-mid profile leans toward stalling momentum or a consolidation phase rather than a clean trend.
The long-horizon profile is materially different. A 3-month rank of #5 and yearly rank of #8 place the instrument in the top decile of the tracked universe, consistent with persistent relative strength over longer windows. When a name is strong on 3–12 month ranks but neutral on daily/weekly ranks, the practical interpretation is often distribution vs reset: long-term trend leadership may still be intact, but near-term positioning is no longer providing confirmation.
KGNAI’s stated term view—Short-term: Neutral; Mid-term: Neutral; Long-term: Bullish—is consistent with that split. For process-driven investors, this argues for separating the strategic bias (supported by #5, #13, #8 ranks) from the timing layer (where weekly #783 suggests weaker tactical edge). The next sections clarify whether this is simple digestion or early trend deterioration by testing price structure, momentum, and level-based confirmation.
2) Price & trend overview
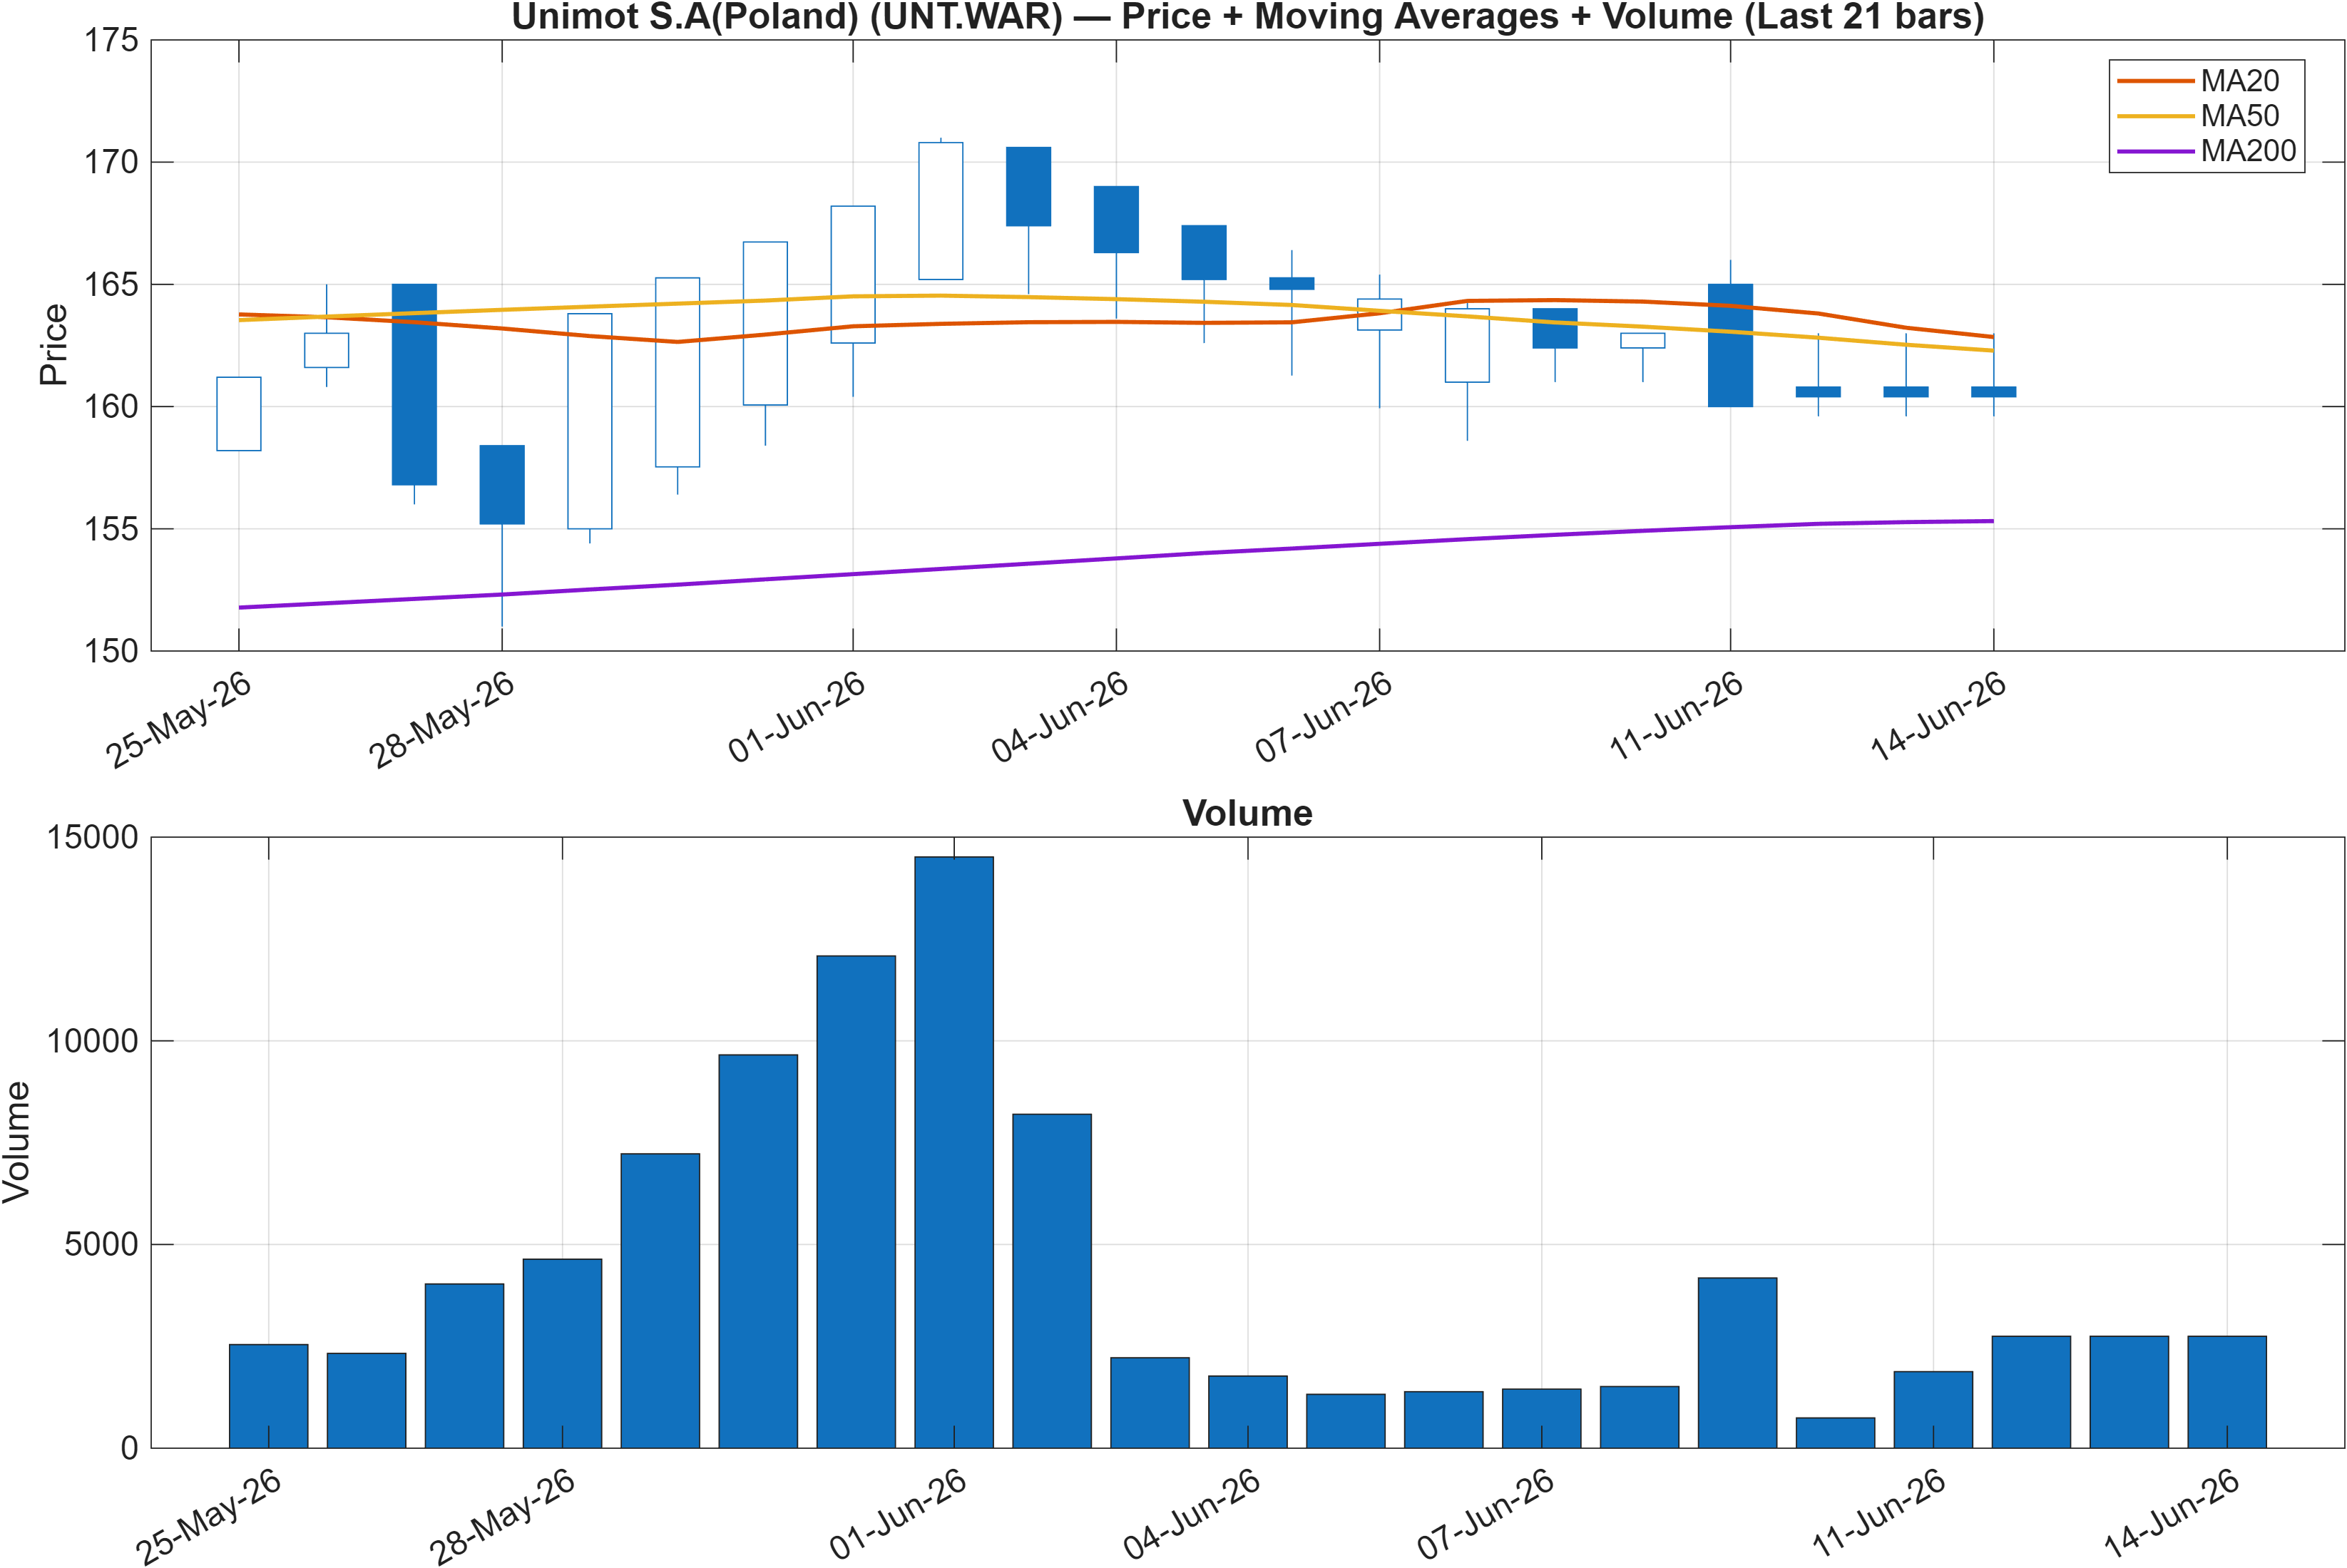
Interpretation: Close vs MA50 = Bearish, MA50 vs MA200 = Bullish.
The moving-average configuration highlights a trend-within-pullback setup. The longer structure remains constructive because MA50 vs MA200 is Bullish, which typically aligns with a broader uptrend or at least a still-supportive medium-term base. However, the shorter signal is currently not confirming: Close vs MA50 is Bearish, indicating that price is trading below a key intermediate reference.
This combination tends to matter most when it persists. A bearish close relative to MA50 can be a normal retracement in an uptrend, but if it coincides with broader momentum weakness (see MACD histogram -0.7143 and RSI 30.77 in the next section), it can also indicate trend fatigue. In other words, the market is not rejecting the longer-term trend outright, yet it is requiring evidence that buyers can reassert control above intermediate averages.
From a market-structure perspective, the more the price oscillates below MA50 while MA50 stays above MA200, the more the chart behaves like a compression phase—a battleground between longer-horizon positioning (consistent with the strong 3–12 month ranks: #5 and #8) and shorter-horizon risk control (more consistent with weekly rank #783). The practical implication is that confirmation is less about forecasting and more about watching whether price can regain intermediate trend control without violating key downside zones.
3) Momentum & volatility dashboard
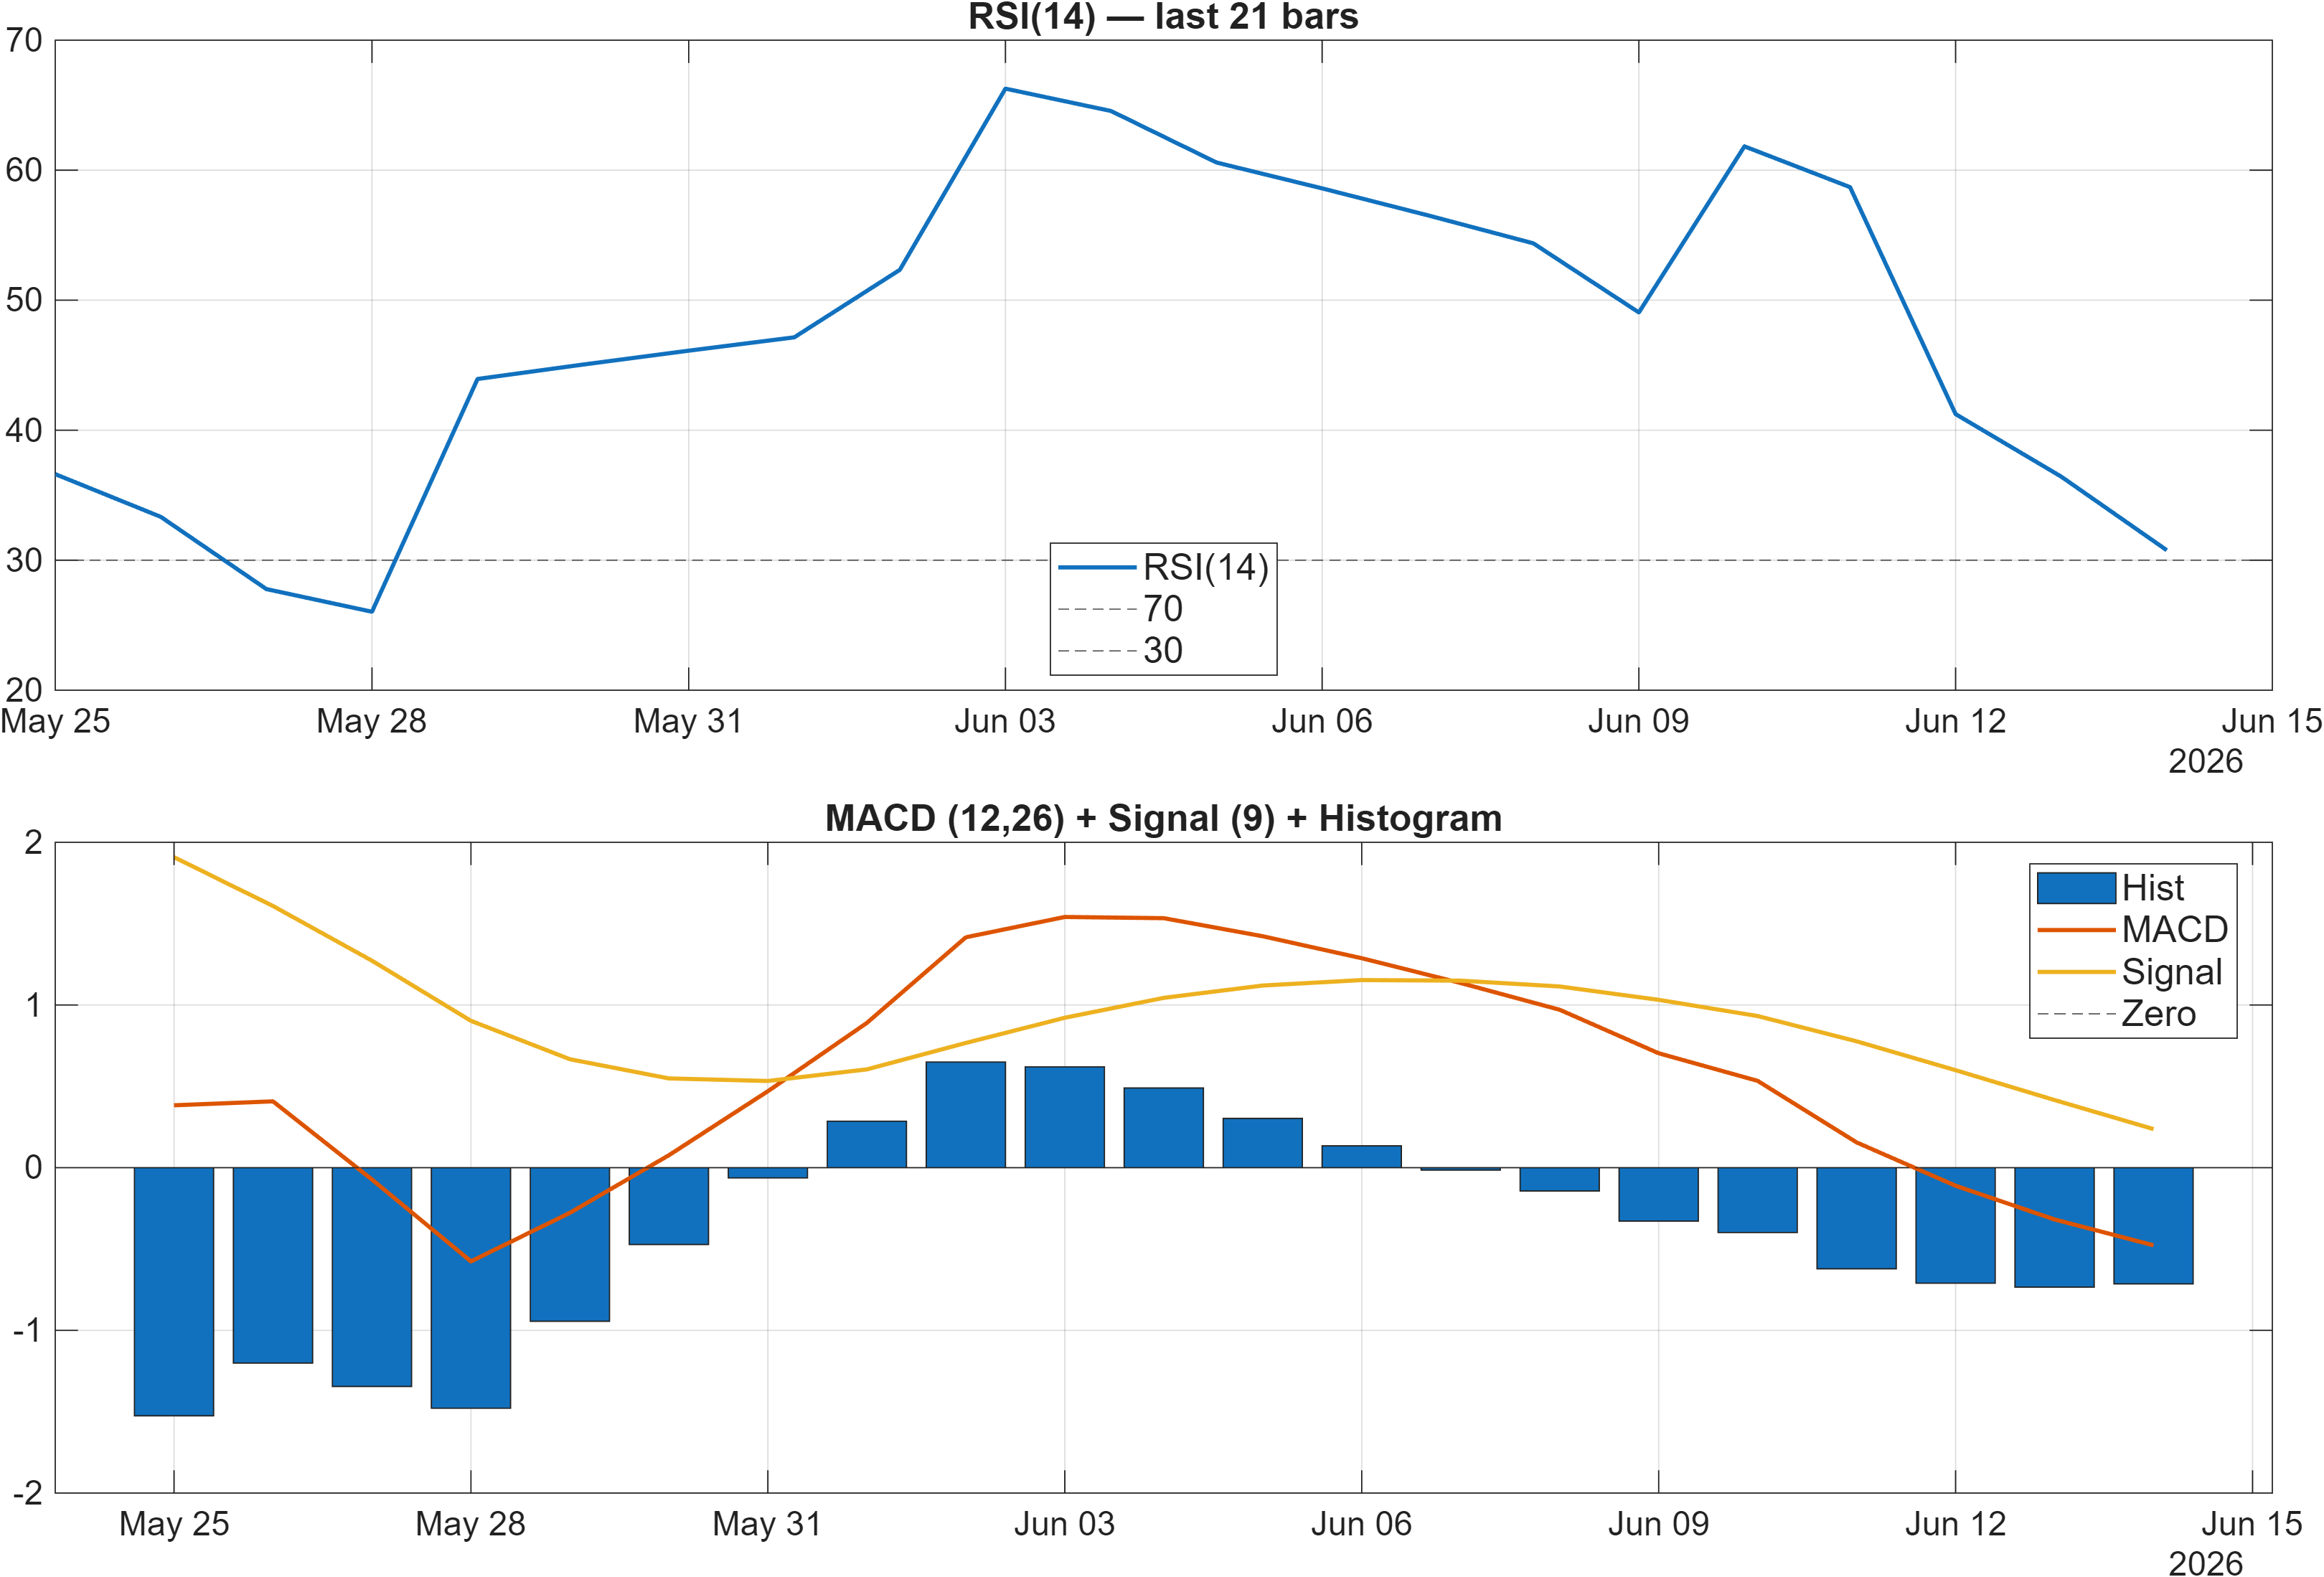
Interpretation: RSI bias = Bearish, MACD hist = -0.7143.
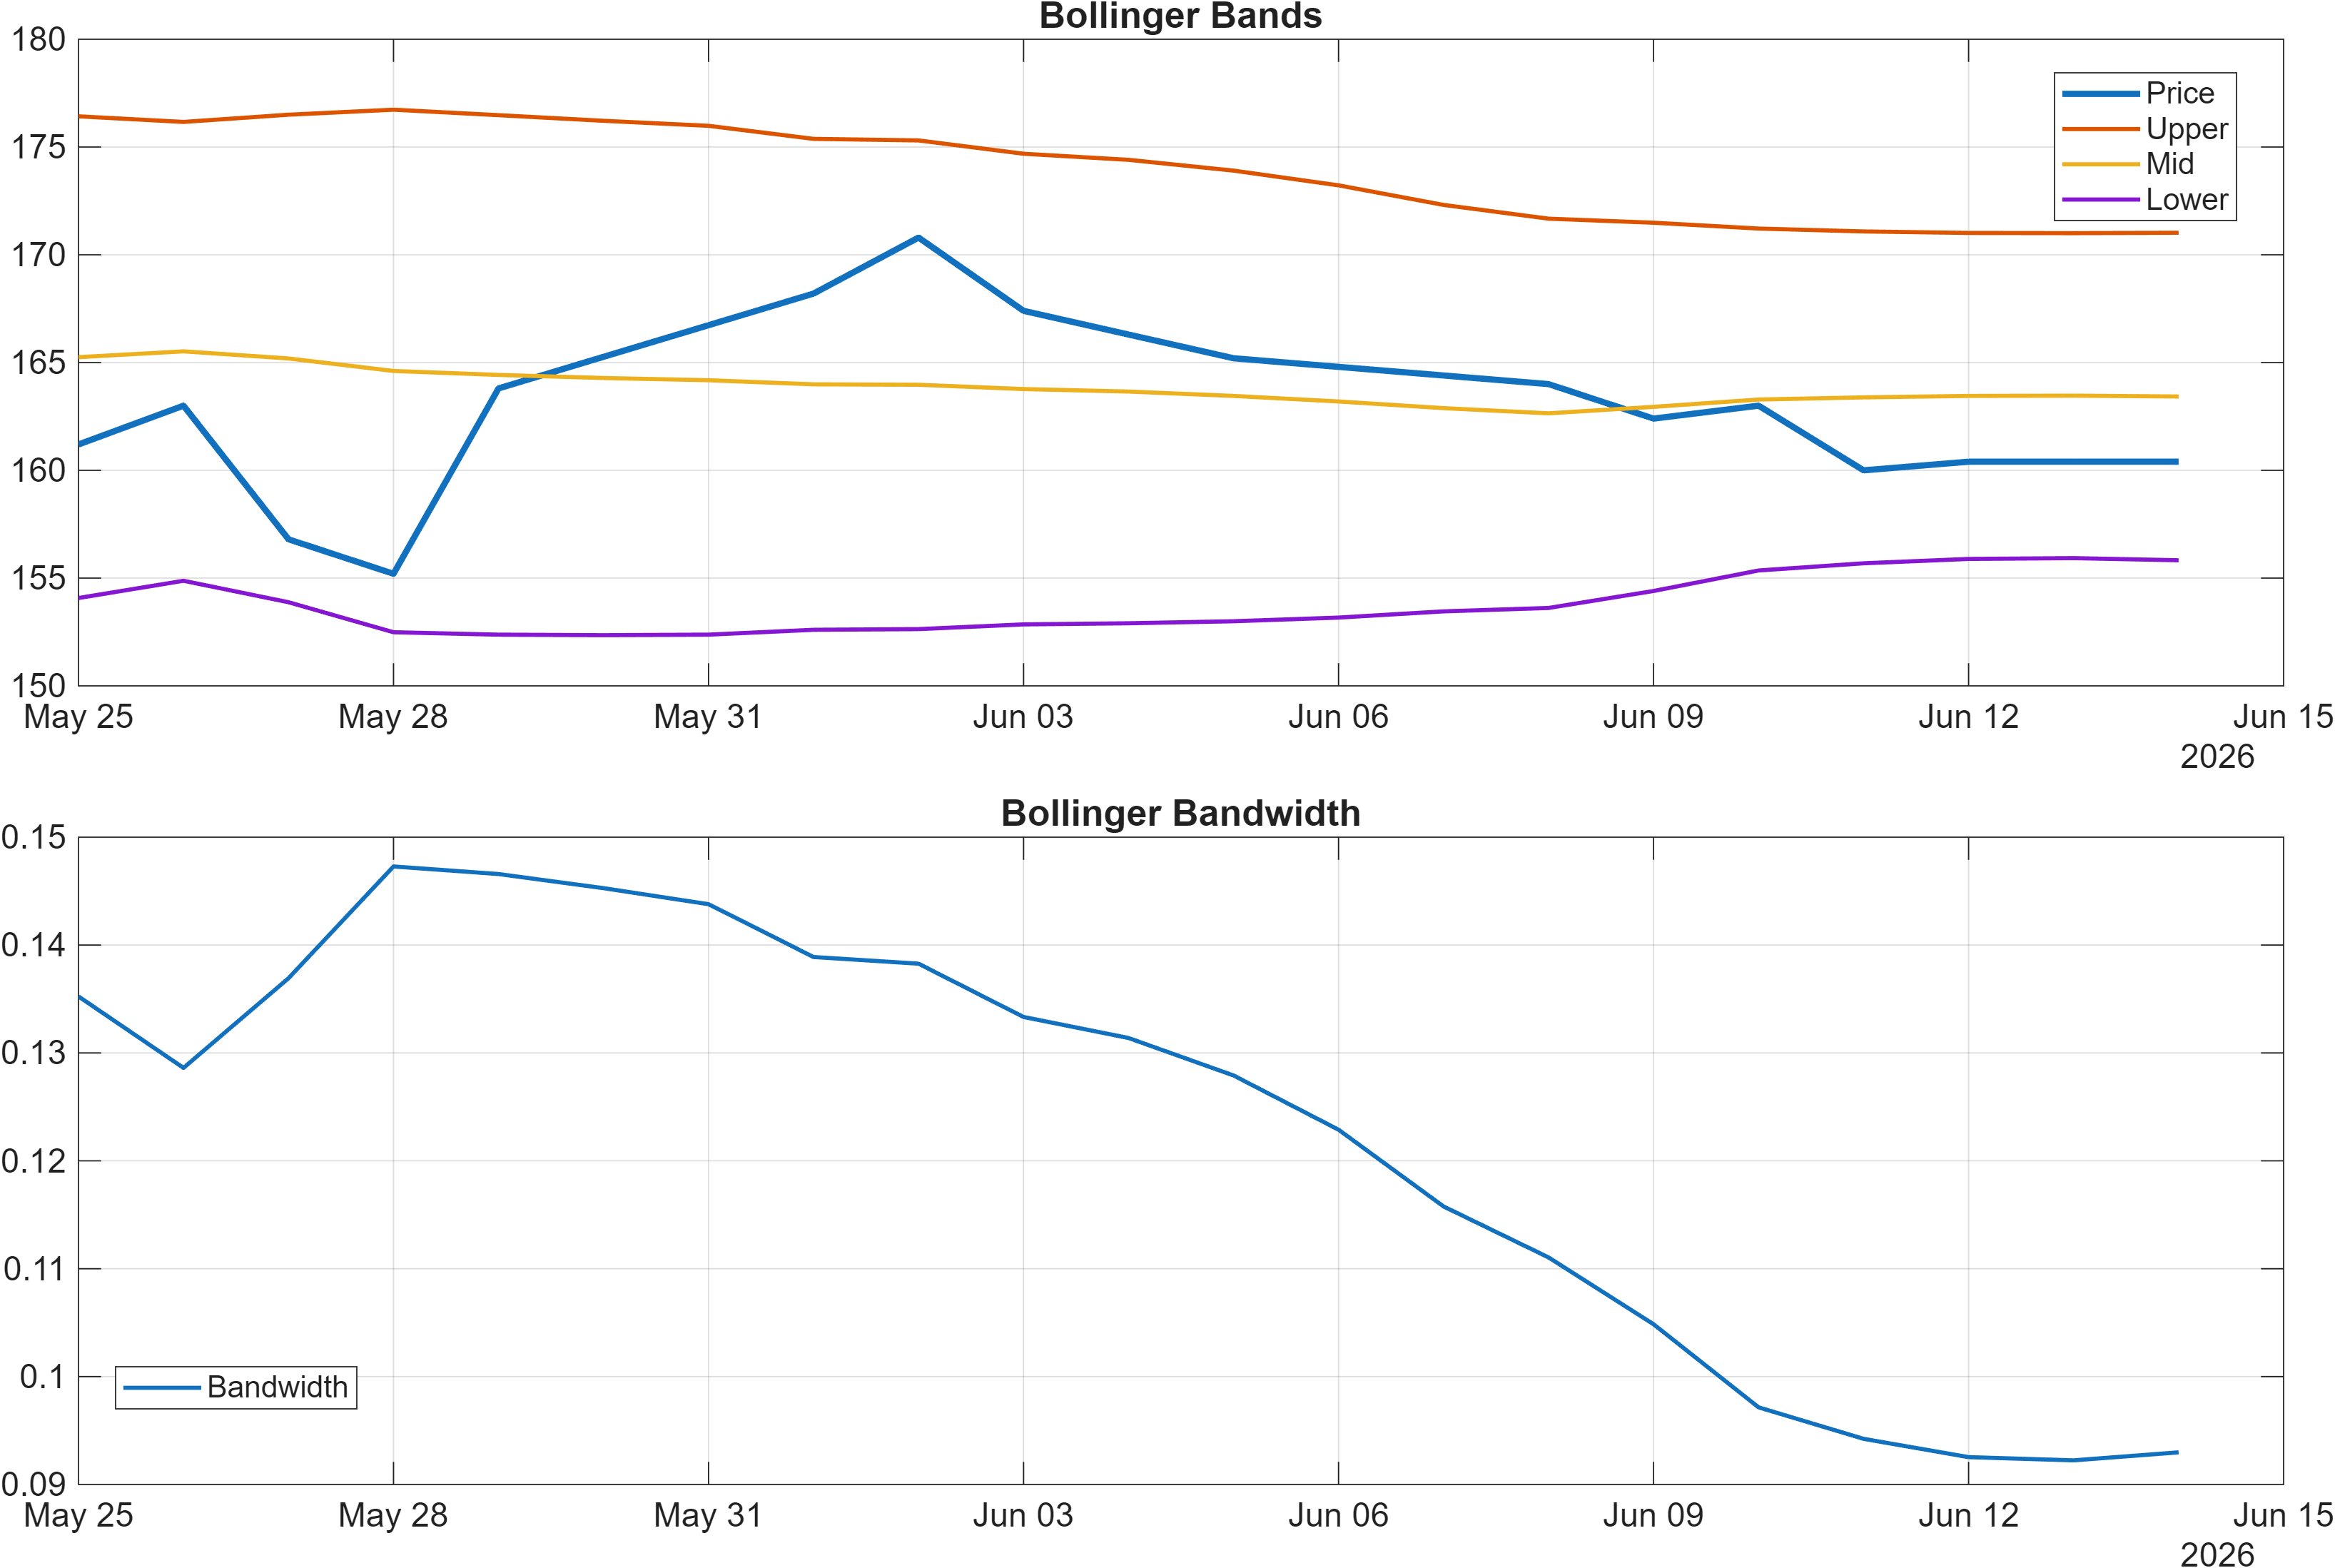
Interpretation: Bandwidth (volatility regime) latest = 0.0930.
Momentum readings are skewed toward downside pressure rather than sideways neutrality. The RSI signal is explicitly bearish, with RSI(14) at 30.77, a level that often coincides with late-stage selloffs or oversold-adjacent conditions. Oversold does not imply reversal by itself; it mainly indicates that the recent move has been directionally persistent and may require either stabilization or a sharp counter-move to reset.
The trend-following momentum measure is also negative: MACD histogram at -0.7143. When RSI is depressed and MACD histogram is negative, rallies can behave like mean-reversion bounces unless the MACD profile starts improving (less negative histogram readings) and price regains intermediate references (consistent with the Close vs MA50 being bearish).
Volatility context helps interpret whether weakness is likely to be disorderly or controlled. The latest Bollinger Bandwidth is 0.0930 (also consistent with BB Width 0.09298 in the signal table), pointing to a moderate volatility regime rather than an extreme expansion. That matters because moderate bandwidth often accompanies either a grinding trend or a stabilizing range; it is less consistent with panic conditions.
The combined read is a momentum drawdown inside a not-yet-broken longer structure. For tactical decision-making, improvement would generally require momentum to stop deteriorating (MACD histogram stabilizing from -0.7143, RSI recovering from ~30.77) while volatility remains contained near the current bandwidth regime (~0.0930).
4) Support / Resistance zones
Support ~ 151.4000 | Resistance ~ 170.6000
Scenario view: Break above resistance with volume → continuation. Close below support → signal deterioration risk.
The level map is tight enough to be decision-relevant: 151.4000 defines the primary support zone, and 170.6000 defines the primary resistance zone. With momentum currently weak (RSI 30.77; MACD histogram -0.7143), the market’s reaction around support is likely to carry more informational value than minor swings in-between.
In a regime where longer-horizon ranks are strong (3-month #5, yearly #8) but shorter-horizon ranks are neutral (weekly #783), support tends to function as the invalidation boundary for the longer-term thesis. A close below 151.4000 would align the price structure with the already bearish tactical indicators and would increase the probability that the drawdown is transitioning from a pullback into a broader deterioration phase.
Conversely, resistance at 170.6000 is the principal confirmation zone. The scenario guidance explicitly highlights that a break above resistance with volume would support continuation. In the current setup, that would also act as a reconciliation point between conflicting layers: it would help offset the bearish blended technical reading (-0.402) and would be more consistent with the long-horizon rank leadership.
Between these zones, the expectation is not directional certainty but range governance. The higher the frequency of failed attempts to reclaim resistance, the more weight shifts toward the bearish technical layer (DRL rank #1182). The more cleanly support holds, the more the long-horizon ranking signal retains credibility despite short-term weakness.
5) Quant Technical Dashboard (18 Signals)
KGNAI AI Technical Analysis Score (Deep Reinforcement Learning): Rank #1182 out of 1396 (Rank 1 represents the strongest technical positioning and a higher probability of favorable price behavior. As ranks increase toward the maximum, the probability of favorable outcomes weakens and bearish positioning becomes more dominant.) | Label: Bearish | Score: -0.693
18-Signal Technical Confluence Score: -0.278 (Neutral)
Overall Technical Score (18-signal confluence + DRL rank blend): -0.402 (Bearish)
Note: The blended score reflects signal strength weighted against broader AI technical ranking, which may temporarily diverge.
Blended technical score breakdown: -0.402 (Bearish | Bull 4 / Bear 9 / Neutral 5)
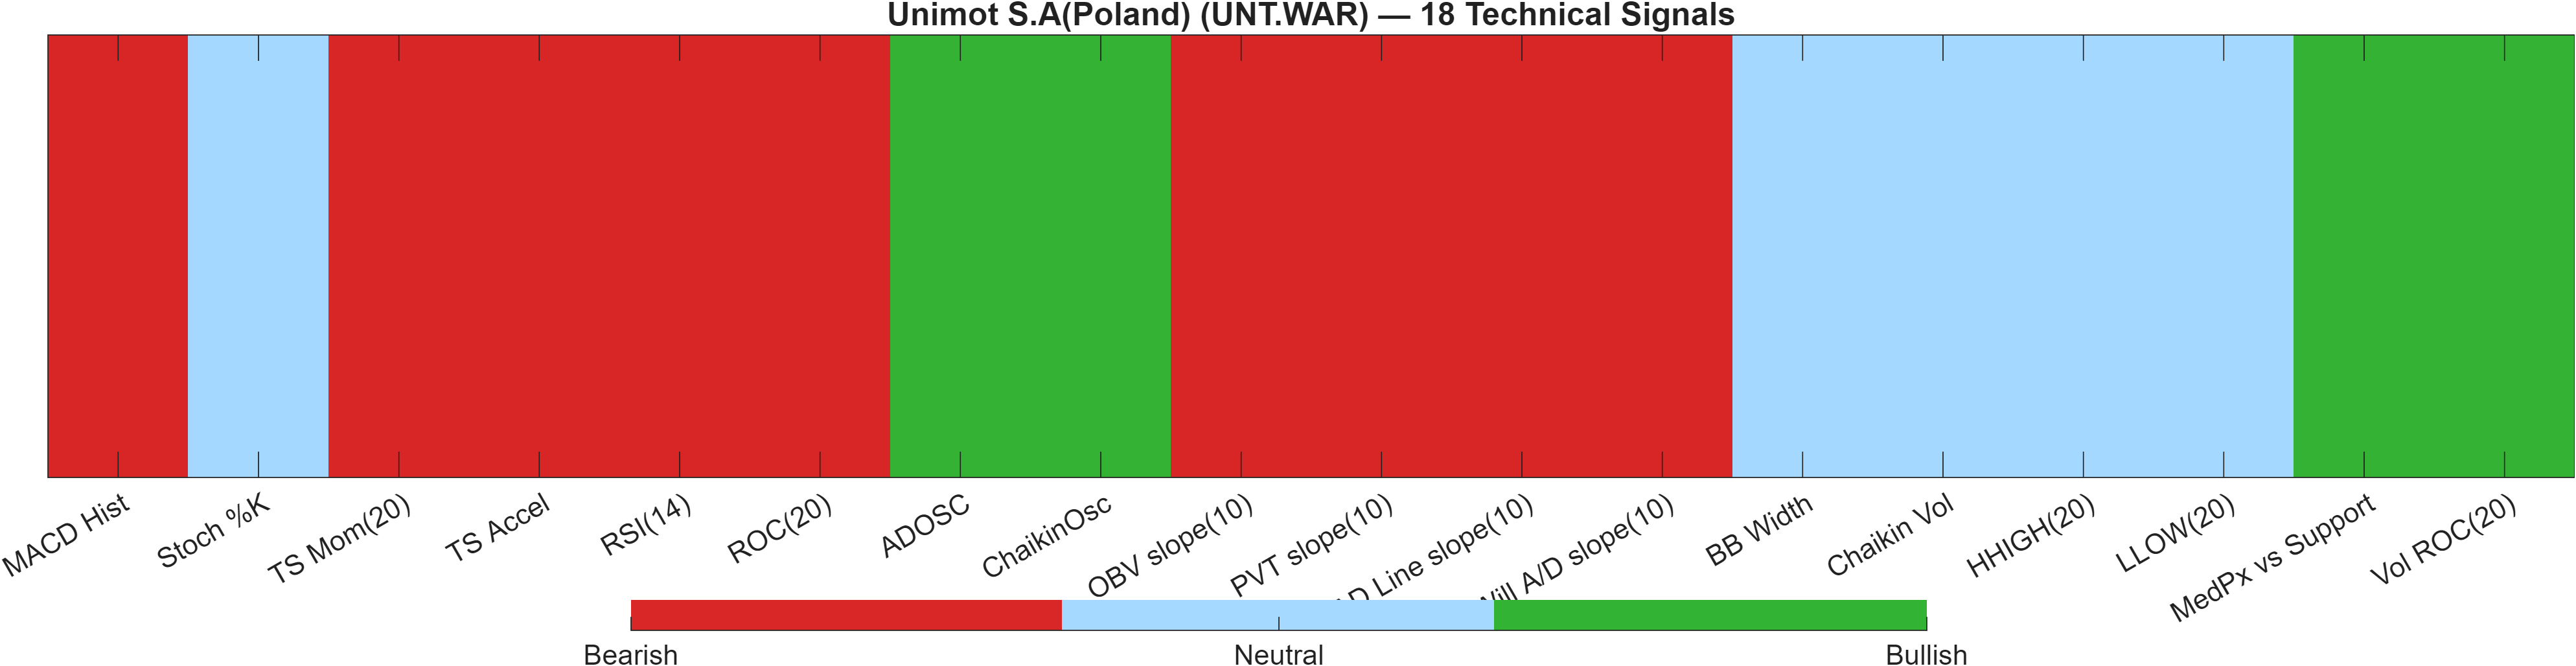
Signal table (Bull/Bear/Neutral)
| Indicator | Value | Signal |
|---|---|---|
| MACD Hist | -0.7143 | Bearish |
| Stoch %K | 20.45 | Neutral |
| TS Mom(20) | -2.6 | Bearish |
| TS Accel | -2.2 | Bearish |
| RSI(14) | 30.77 | Bearish |
| ROC(20) | -1.595 | Bearish |
| ADOSC | 44.12 | Bullish |
| ChaikinOsc | 1049 | Bullish |
| OBV slope(10) | -8241 | Bearish |
| PVT slope(10) | -85.04 | Bearish |
| AD Line slope(10) | -2920 | Bearish |
| Will A/D slope(10) | -10 | Bearish |
| BB Width | 0.09298 | Neutral |
| Chaikin Vol | -31.65 | Neutral |
| HHIGH(20) | 171 | Neutral |
| LLOW(20) | 151 | Neutral |
| MedPx vs Support | 9.9 | Bullish |
| Vol ROC(20) | 18.05 | Bullish |
Interpretation: Indicator-level signals form the base confluence, which is then adjusted using a separate AI-driven technical ranking model. The final technical score summarizes this combined view.
The technical dashboard is best read as a divergence between “local” signals and “global” technical rank. The 18-signal confluence is Neutral (-0.278), but the overall blended score moves to Bearish (-0.402) because the deep reinforcement learning technical rank is weak (#1182 out of 1396, score -0.693). That pattern suggests the broader technical state—relative to the universe—looks worse than what a narrow indicator set alone would imply.
Within the signals, the momentum cluster is consistently negative: RSI(14) 30.77 and MACD histogram -0.7143 are both bearish, and the trend-statistics measures (TS Mom(20) -2.6, TS Accel -2.2) also point down. This coherence often matters more than any single indicator because it reflects multiple ways of measuring the same underlying behavior—weakness that is persistent rather than random.
There are, however, select offsets that keep the confluence from turning fully bearish. Accumulation-style indicators such as ChaikinOsc 1049 and ADOSC 44.12 are bullish, and Vol ROC(20) 18.05 indicates volume change is supportive rather than absent. This mix can be consistent with rotation and position adjustment: sellers have controlled momentum, while some measures of participation still show constructive undertones.
The practical synthesis is that UNT.WAR is not in a clean, high-confidence technical uptrend at present (consistent with the blended bearish score), yet it also exhibits enough mixed inputs to justify why the confluence alone remains neutral—and why level-based confirmation (151.4000 / 170.6000) should carry more weight than indicator micromanagement.
6) News sentiment + extractive gist
Note: Some headlines were matched using a looser (title-only) rule to avoid missing relevant coverage.
Sentiment score (avg): 0.397 | Positive: 100% | Neutral: 0% | Negative: 0%
KGNAI AI News Sentiment Score (normalized -1 to +1): Not available (as of —) | Label: Not available | Overall news score: 0.40
Positive Developments
Recent coverage across major financial outlets skews constructive in the available dataset, consistent with the average sentiment score of 0.397 and a 100% positive distribution. In isolation, that creates a supportive backdrop for risk appetite and can help explain why longer-horizon positioning remains strong (for example, the 3-month rank #5 and yearly rank #8). However, the more investable takeaway is not “good news” itself, but whether sentiment can coincide with stabilization in technicals—particularly as momentum remains soft (RSI 30.77; MACD histogram -0.7143). In mixed regimes, positive narrative flow often matters most when it reduces uncertainty and improves follow-through on breakouts, especially around key price decision zones.
Neutral / Mixed Developments
The news extraction quality note—some items matched using a looser title-only rule—supports treating the news layer as context rather than a stand-alone driver. Additionally, the platform’s normalized news sentiment score is not available in the provided data, leaving the analysis dependent on the summarized overall news score (0.40) and distribution statistics. That limitation increases the importance of cross-checking news bias against market-based confirmation, such as whether price can reclaim intermediate trend structure (Close vs MA50 is bearish) or whether volatility conditions remain controlled (bandwidth 0.0930). In this setup, a positive sentiment backdrop without technical confirmation should be interpreted as non-binding rather than decisive.
Negative / Risk Signals
The principal risk signal in the dataset is not a negative sentiment reading (negative share is 0%), but a potential sentiment–price conflict: news tone is positive while the blended technical state is bearish (-0.402) and the AI technical rank is weak (#1182). That mismatch can occur when market participants have already discounted positive narrative factors, or when price action is responding to constraints not captured in the limited news slice. From a risk-control standpoint, the most concrete deterioration condition remains structural: a close below 151.4000 would align weak momentum with a breakdown of the primary support zone. Until then, risk is better framed as tactical fragility rather than confirmed trend failure.
- What to monitor next: Whether price behavior improves into and above 170.6000 with volume.
- What to monitor next: Whether RSI(14) 30.77 and MACD hist -0.7143 start to stabilize rather than deepen.
- What to monitor next: Whether price holds 151.4000 on closes as momentum cycles reset.
Sources referenced: Reuters, Bloomberg, Yahoo Finance, MarketWatch, Investing.com
Snapshot: AI Rank (Short–Mid–Long): Mixed (Neutral–Neutral–Bullish) · Technical Confluence: Neutral · Key Levels: Support ~151.40 | Resistance ~170.60 · News Sentiment: Positive
7) Sources
Source links are listed below as provided in the draft.
- Paramount takeover of Warner Bros won't harm competition or consumers, DOJ says - Sky News — https://news.google.com/rss/articles/CBMiswFBVV95cUxQQnphUmU0NTlIUkVINVNSNnFnLWp0SFVQaG5jd0p2eVdvdHpPd1l2NzVXbUdWVVpjM1FKQm9keXllbFBoZDJYRC1LYzM2MnpsVmJTUnVwYUpOVlpVcDZsbndzX2RQNmhqYktreEdIWlVabzBrLWFLMXE1ZWwzcmV3S3N3ZnRBcWczcTh3dG1sMXlXRS1UQ1czcjRSM3hwWWhjM0RyODFBcWw0bTJ0TU5mdEx2SQ?oc=5
- Stock Market Today, June 12: Bull rally on D-Street! Sensex zooms 1695 pts, Nifty above 23600; reasons behind the surge | Closing Bell - Dailyhunt — https://news.google.com/rss/articles/CBMirwJBVV95cUxPQ3A1QXRxaG9TcV94SXA4bTg0bm4zNjBvUzdqOXRMVUFydnRCUVp0U28yazBrSVZQVjMtYnViR01IZ0xOWFhMbmhReWpNZEU1TjNkQ0JCQlNVMWRMOXhnbjZCYkx3emNLRFZza1ZTWkF3dlEwQWMxZDlnOWpKeWVuZmI5VTVZSE1VRDlCNWF3SXltSF9DTlplQUxYS2NBdU1Cc0VfalZVUF9MT0g3Wk4zaUg3MnpSNFdheGsxSzc3ZG1XNmpyNktMRk9JUE1DYS01RDZ4QUNIelFaWGN6SlRpOFVORWtmMy1JNmsxQkFiM3JuMnE1TUhRR2FROHNma0ItT3l6VUgwSFM2NEhrU3pvMXNnTTlQczRXVjRqajVtSjZ6c1E2V2pUazdLb2lpYk0?oc=5
You may also like: How KGNAI AI ranks instruments across global markets
Disclaimer: KGNAI provides AI-generated analytics and educational market commentary only. This is not financial advice. Markets involve risk. Always do your own research.