688363 — Bloomage Biotechnology Corp Ltd (14-Jun-2026) | Consolidation With Bullish Technical Confluence but Mixed Ranks
Bloomage Biotechnology Corp Ltd (688363) is currently presenting a split-profile setup: the AI rank stack is mixed across horizons (short-term neutral, mid-term bearish, long-term neutral), while the technical layer remains constructively biased. The 18-signal framework prints a Bullish confluence score of 0.556, and the blended technical score rises to 0.629 alongside a strong DRL technical rank of #129 (out of 1292), suggesting the market is not broadly weak on structure. At the same time, momentum is not decisively one-directional: RSI(14) at 51.3 reads neutral even as MACD histogram at 0.4672 remains positive. Volatility conditions appear moderate with Bollinger bandwidth at 0.1562, consistent with a consolidation regime where follow-through typically requires confirmation. Key decision levels remain clearly defined at support ~34.2700 and resistance ~43.5600, providing practical zones for validation or deterioration.
- Rank stance: Short Neutral | Mid Bearish | Long Neutral
- Technical confluence: Bullish (18-signal 0.556; blended 0.629; DRL rank #129)
- Key levels: Support 34.2700 | Resistance 43.5600
- News sentiment bias: Slightly negative-to-neutral (avg -0.026; Positive 12%, Neutral 63%, Negative 25%)
- Confirmation / invalidation: Strength is better supported on a sustained push above 43.5600 with volume; a close below 34.2700 increases deterioration risk.
KGNAI evaluates assets using large cross-sectional datasets built from millions of structured data points. Inputs incorporate fundamental metrics, technical structures, and systematically processed news sentiment. Statistical models, machine learning, and AI frameworks are used to assess relative positioning, signal alignment, and probabilistic behavior across broad universes.
- Ranks are comparative across the tracked universe, not absolute price targets.
- Confluence reflects alignment among independent signal groups.
- Support/resistance levels are probabilistic decision zones, not guarantees.
- Sentiment provides contextual bias within the broader analytical framework.
1) KGNAI AI Analysis
Region: CHINA
Total universe size: 1292 ranked instruments
- Daily rank: #966 out of 1292 — Neutral
- Weekly rank: #446 out of 1292 — Neutral
- Monthly rank: #1052 out of 1292 — Bearish
- 3-Monthly rank: #22 out of 1292 — Bullish
- 6-Monthly rank: #141 out of 1292 — Bullish
- Yearly rank: #721 out of 1292 — Neutral
The rank stack for 688363 is best read as a regime transition signal rather than a single-direction verdict. The 3-month rank of #22 places the instrument in the top decile of the tracked universe, and the 6-month rank of #141 remains in the upper cohort—evidence that the intermediate trend window has been comparatively resilient versus peers.
That strength is not uniform across horizons. The monthly rank of #1052 sits in the weaker tail of the distribution, while the daily rank of #966 is neutral-to-soft. This combination often appears when earlier trend strength is being digested: longer-window structure can remain constructive even as shorter windows experience consolidation, mean reversion, or rotational underperformance.
From a portfolio construction perspective, the key is the dispersion across horizons. When a top-decile 3-month profile coexists with a weak monthly reading, the probability-weighted takeaway is usually “support intact, but timing risk elevated.” The weekly rank of #446 (neutral) supports this interpretation: the market is not strongly confirming either continuation or breakdown.
Term view: Short-term: Neutral. Mid-term: Bearish. Long-term: Neutral. These labels align with a setup where confirmation is better sought at defined decision levels rather than through extrapolation from any single horizon.
Want the full universe and complete rank tables? Unlock full access on KGNAI: https://www.kgnai.com/pricing
2) Price & trend overview
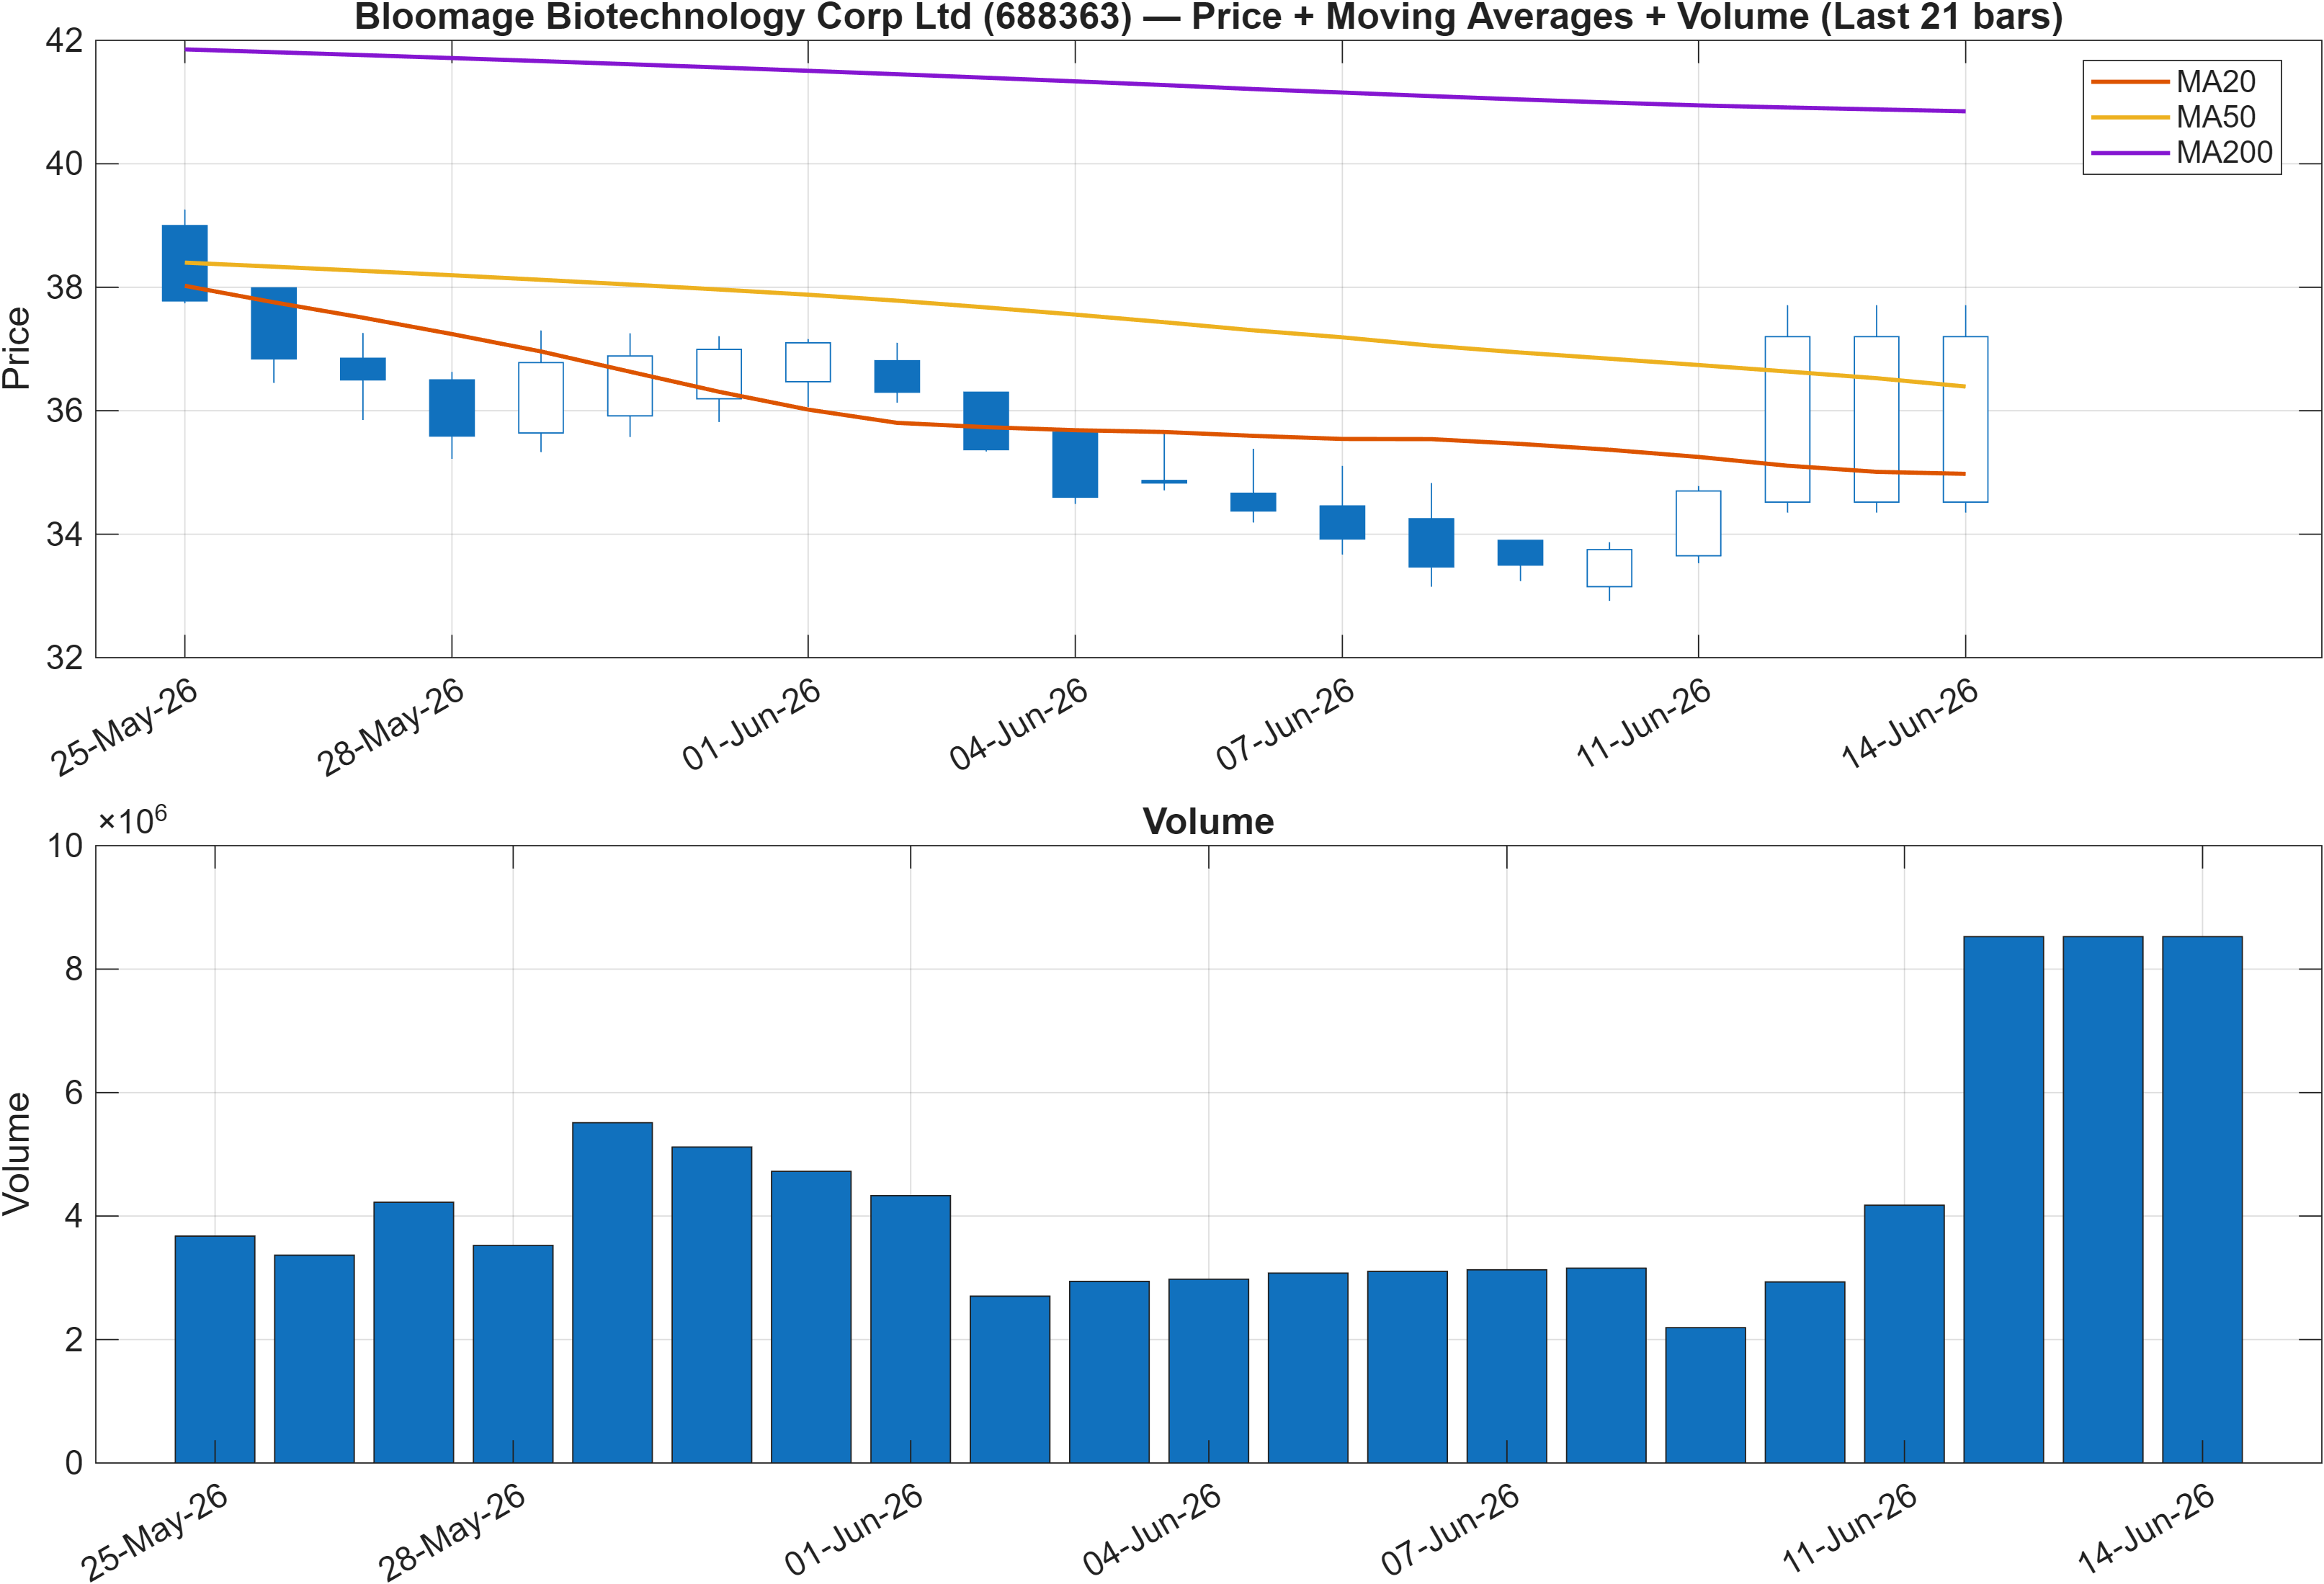
Interpretation: Close vs MA50 = Bullish, MA50 vs MA200 = Bearish.
Trend alignment vs. regime friction
The moving-average state is explicitly mixed: close vs MA50 is Bullish, while MA50 vs MA200 is Bearish. That is a classic “near-term recovery within a larger, not-yet-repaired trend” configuration. In practice, it typically maps to a market that can rally tactically yet still face overhead supply when attempting to extend.
This helps reconcile the ranking contradictions: the strong 3-month rank (#22) can coexist with a weak monthly rank (#1052) when price is moving above intermediate trend proxies but the longer baseline (often captured by MA200 structure) remains a headwind. In that regime, trend continuation tends to be conditional—requiring evidence of persistence rather than a single upswing.
The price structure should be monitored for trend persistence vs. exhaustion around clearly defined boundaries. The report’s resistance level (43.5600) becomes the most relevant “repair” threshold because a sustained move above that zone is more consistent with resolving the longer-trend friction implied by MA50<MA200. Conversely, failure to hold above support (34.2700) would be consistent with the weaker short-to-mid rank tone.
With technical confluence still bullish overall (0.629 blended), the main analytical emphasis is not on calling direction, but on recognizing that the trend model is presently two-speed: shorter windows suggest constructive stabilization, while the longer filter is still restrictive.
3) Momentum & volatility dashboard
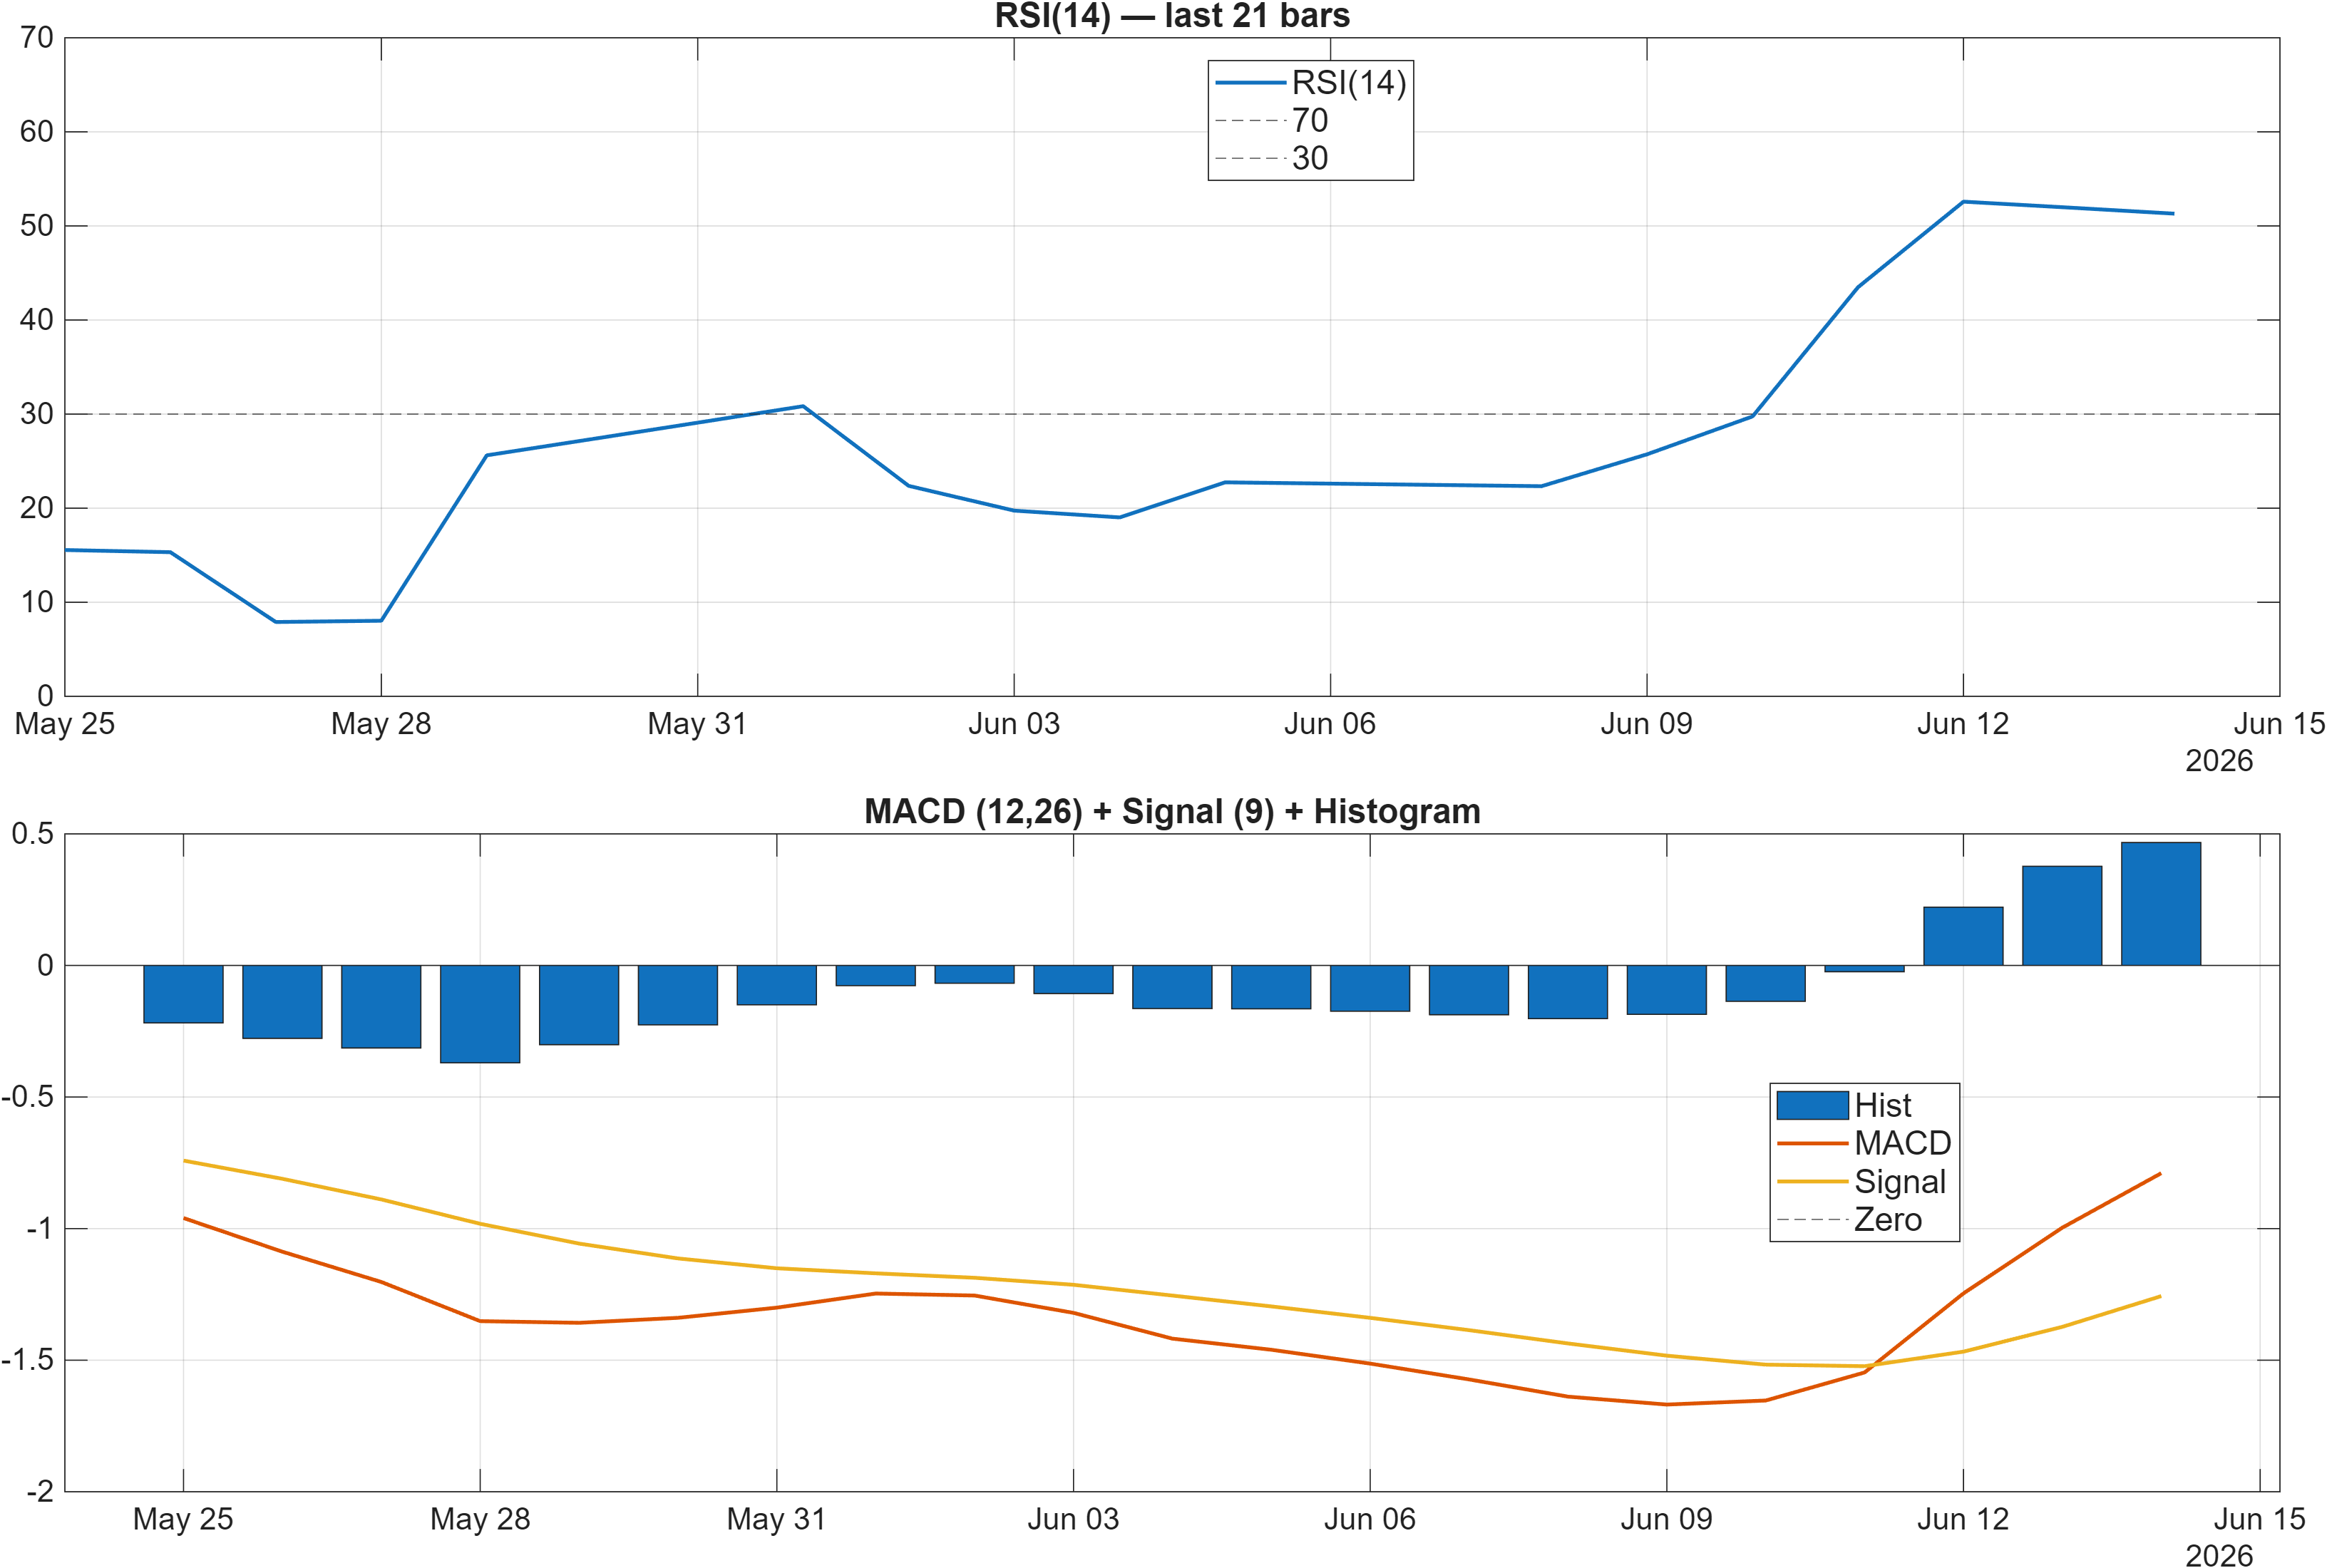
Interpretation: RSI bias = Neutral, MACD hist = 0.4672.
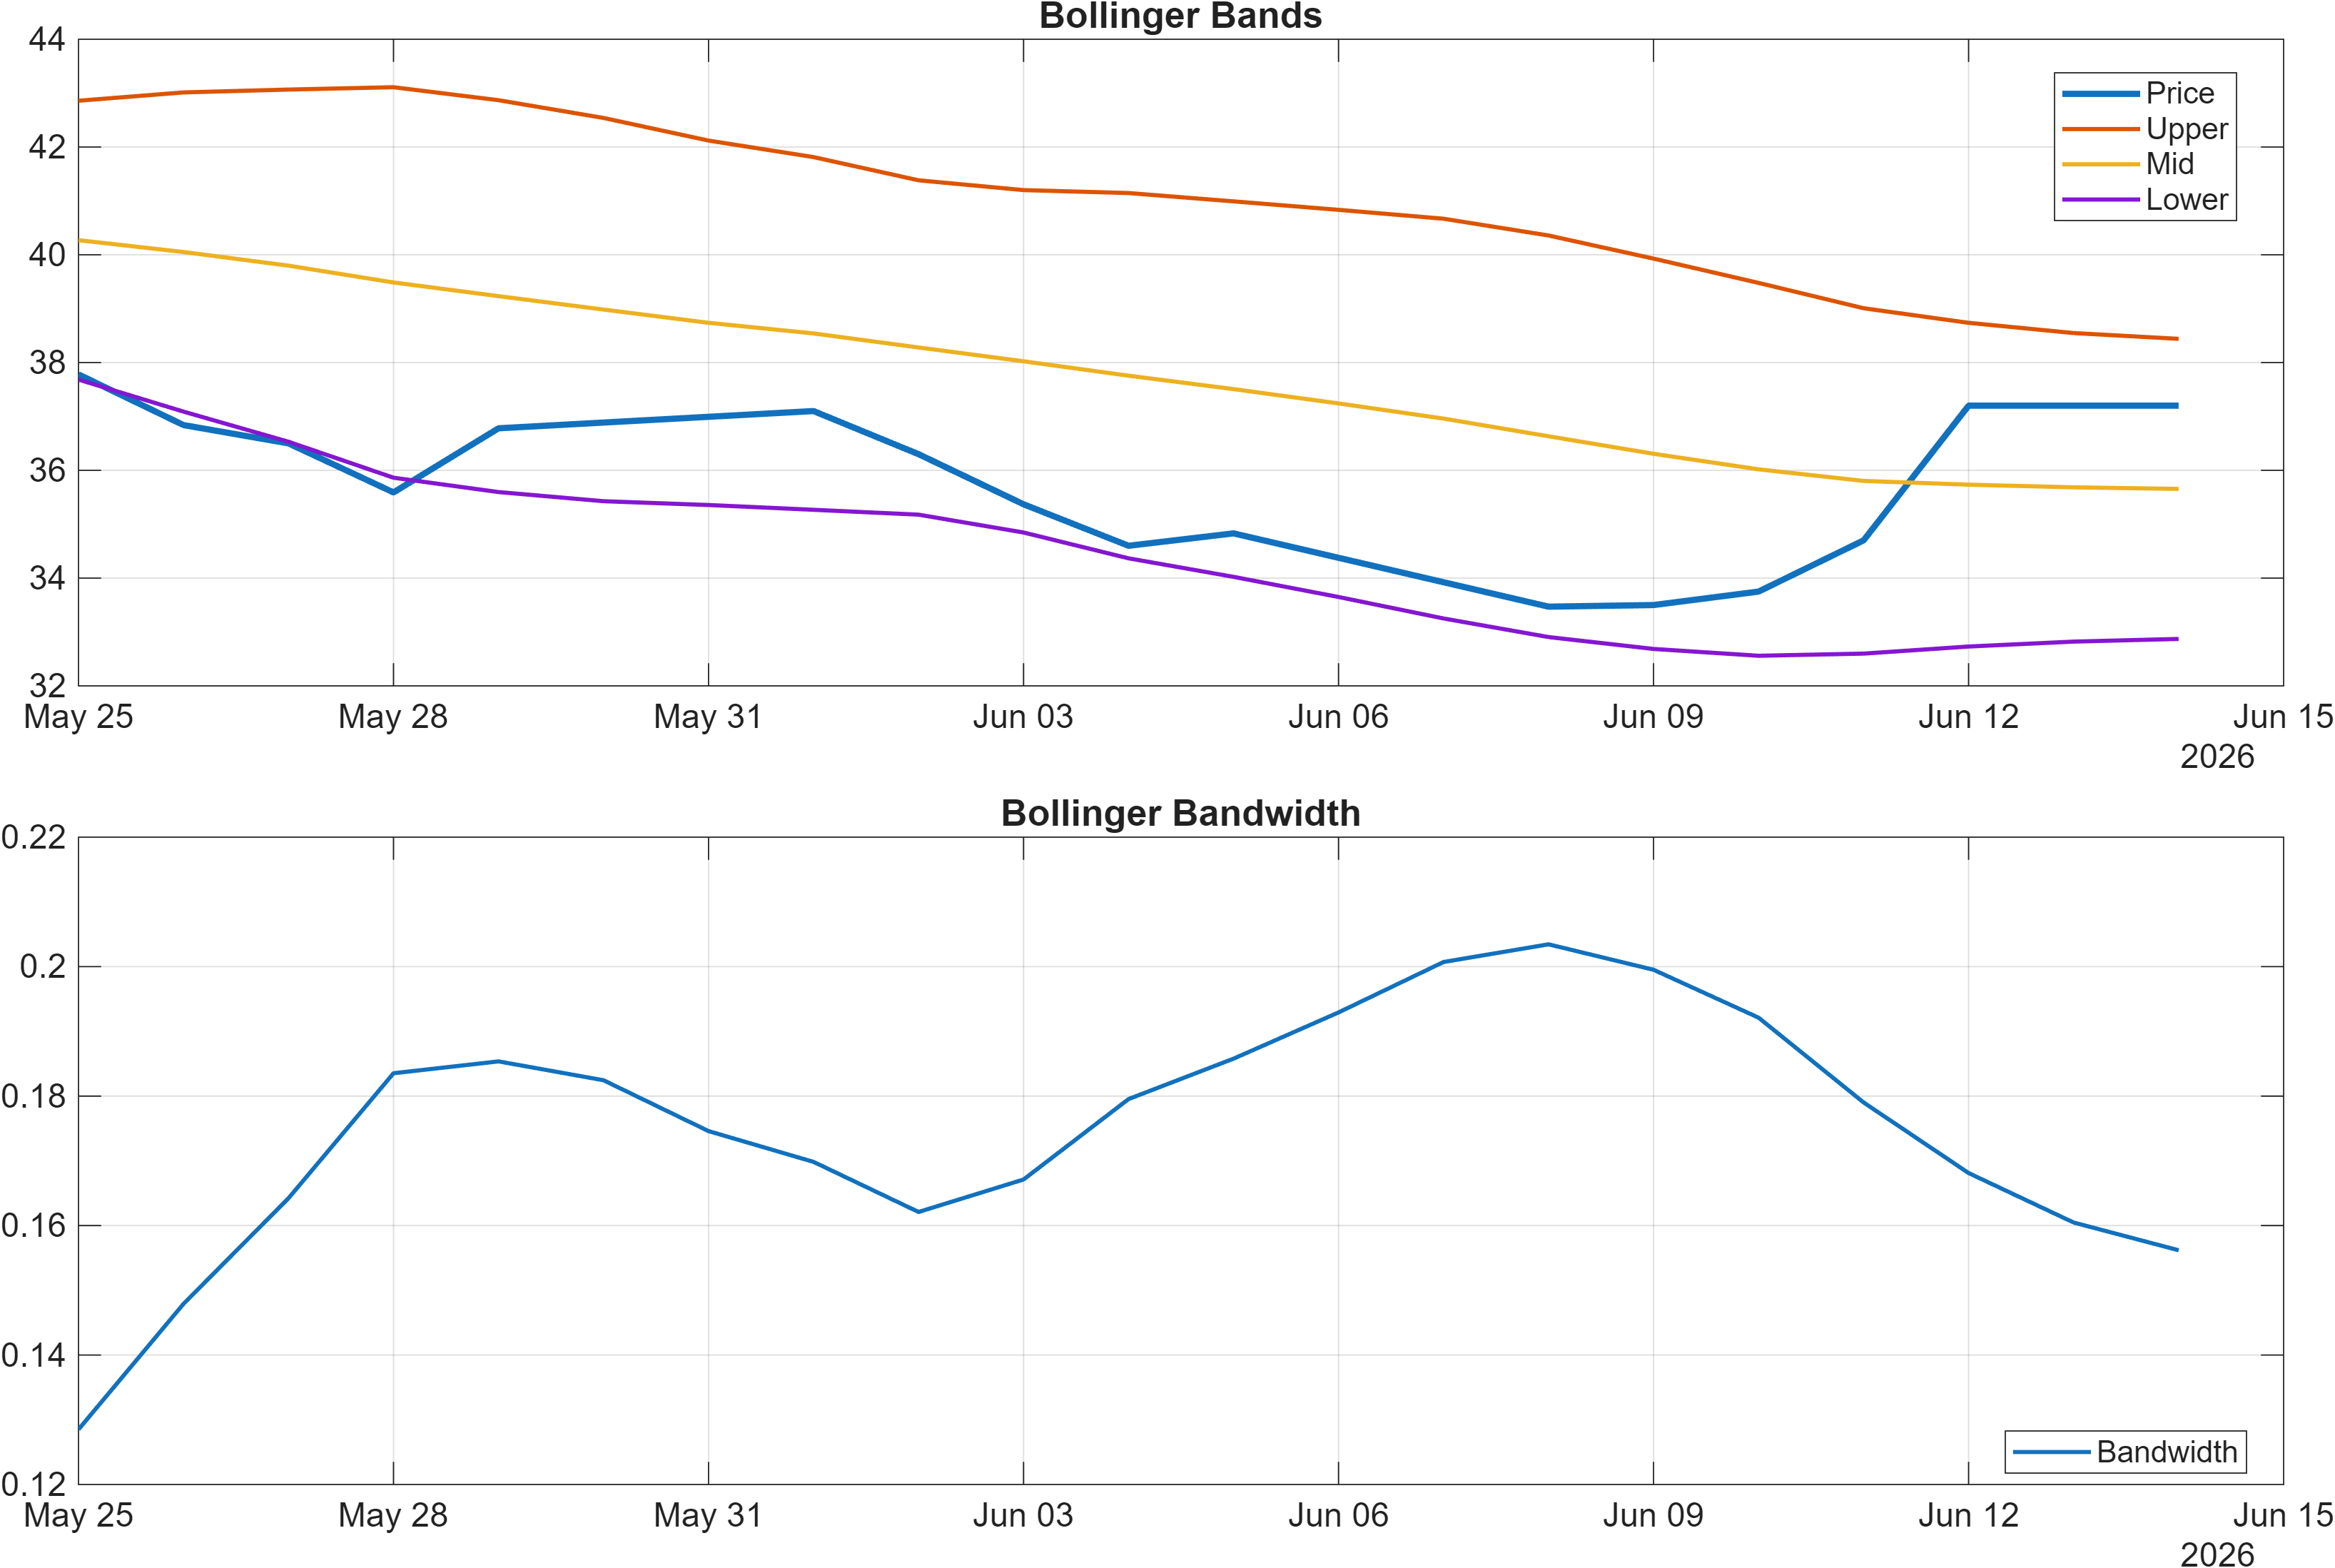
Interpretation: Bandwidth (volatility regime) latest = 0.1562.
Momentum: constructive impulse without overbought confirmation
Momentum indicators are signaling controlled participation rather than a crowded extension. RSI(14) at 51.3 is neutral—consistent with consolidation and a market not stretched—while the MACD histogram at 0.4672 remains positive, indicating that upward impulse has not fully faded.
The key nuance is internal divergence within oscillators. The signal table flags Stoch %K at 89.35 as bearish, which frequently occurs when short-cycle momentum becomes overheated inside a broader sideways range. That is not automatically a bearish macro verdict, but it can explain why the daily rank (#966) is not confirming the stronger intermediate ranks: shorter-cycle mean reversion pressure can temporarily dominate tape behavior.
Volatility regime: moderate bandwidth, higher need for price-level confirmation
Volatility is not signaling a high-conviction breakout environment at present. Bollinger Bandwidth at 0.1562 sits in a moderate regime—neither highly compressed nor aggressively expanding—supporting the interpretation that this is a range-management phase. In such conditions, indicator positives (like MACD histogram) often require validation through price acceptance above resistance rather than through indicator readings alone.
This also aligns with the framework’s probabilistic stance: when momentum is modest (RSI ~50) and volatility is moderate, the highest-quality inferences come from signal clustering plus level-based confirmation, not from any single oscillator.
4) Support / Resistance zones
Support ~ 34.2700 | Resistance ~ 43.5600
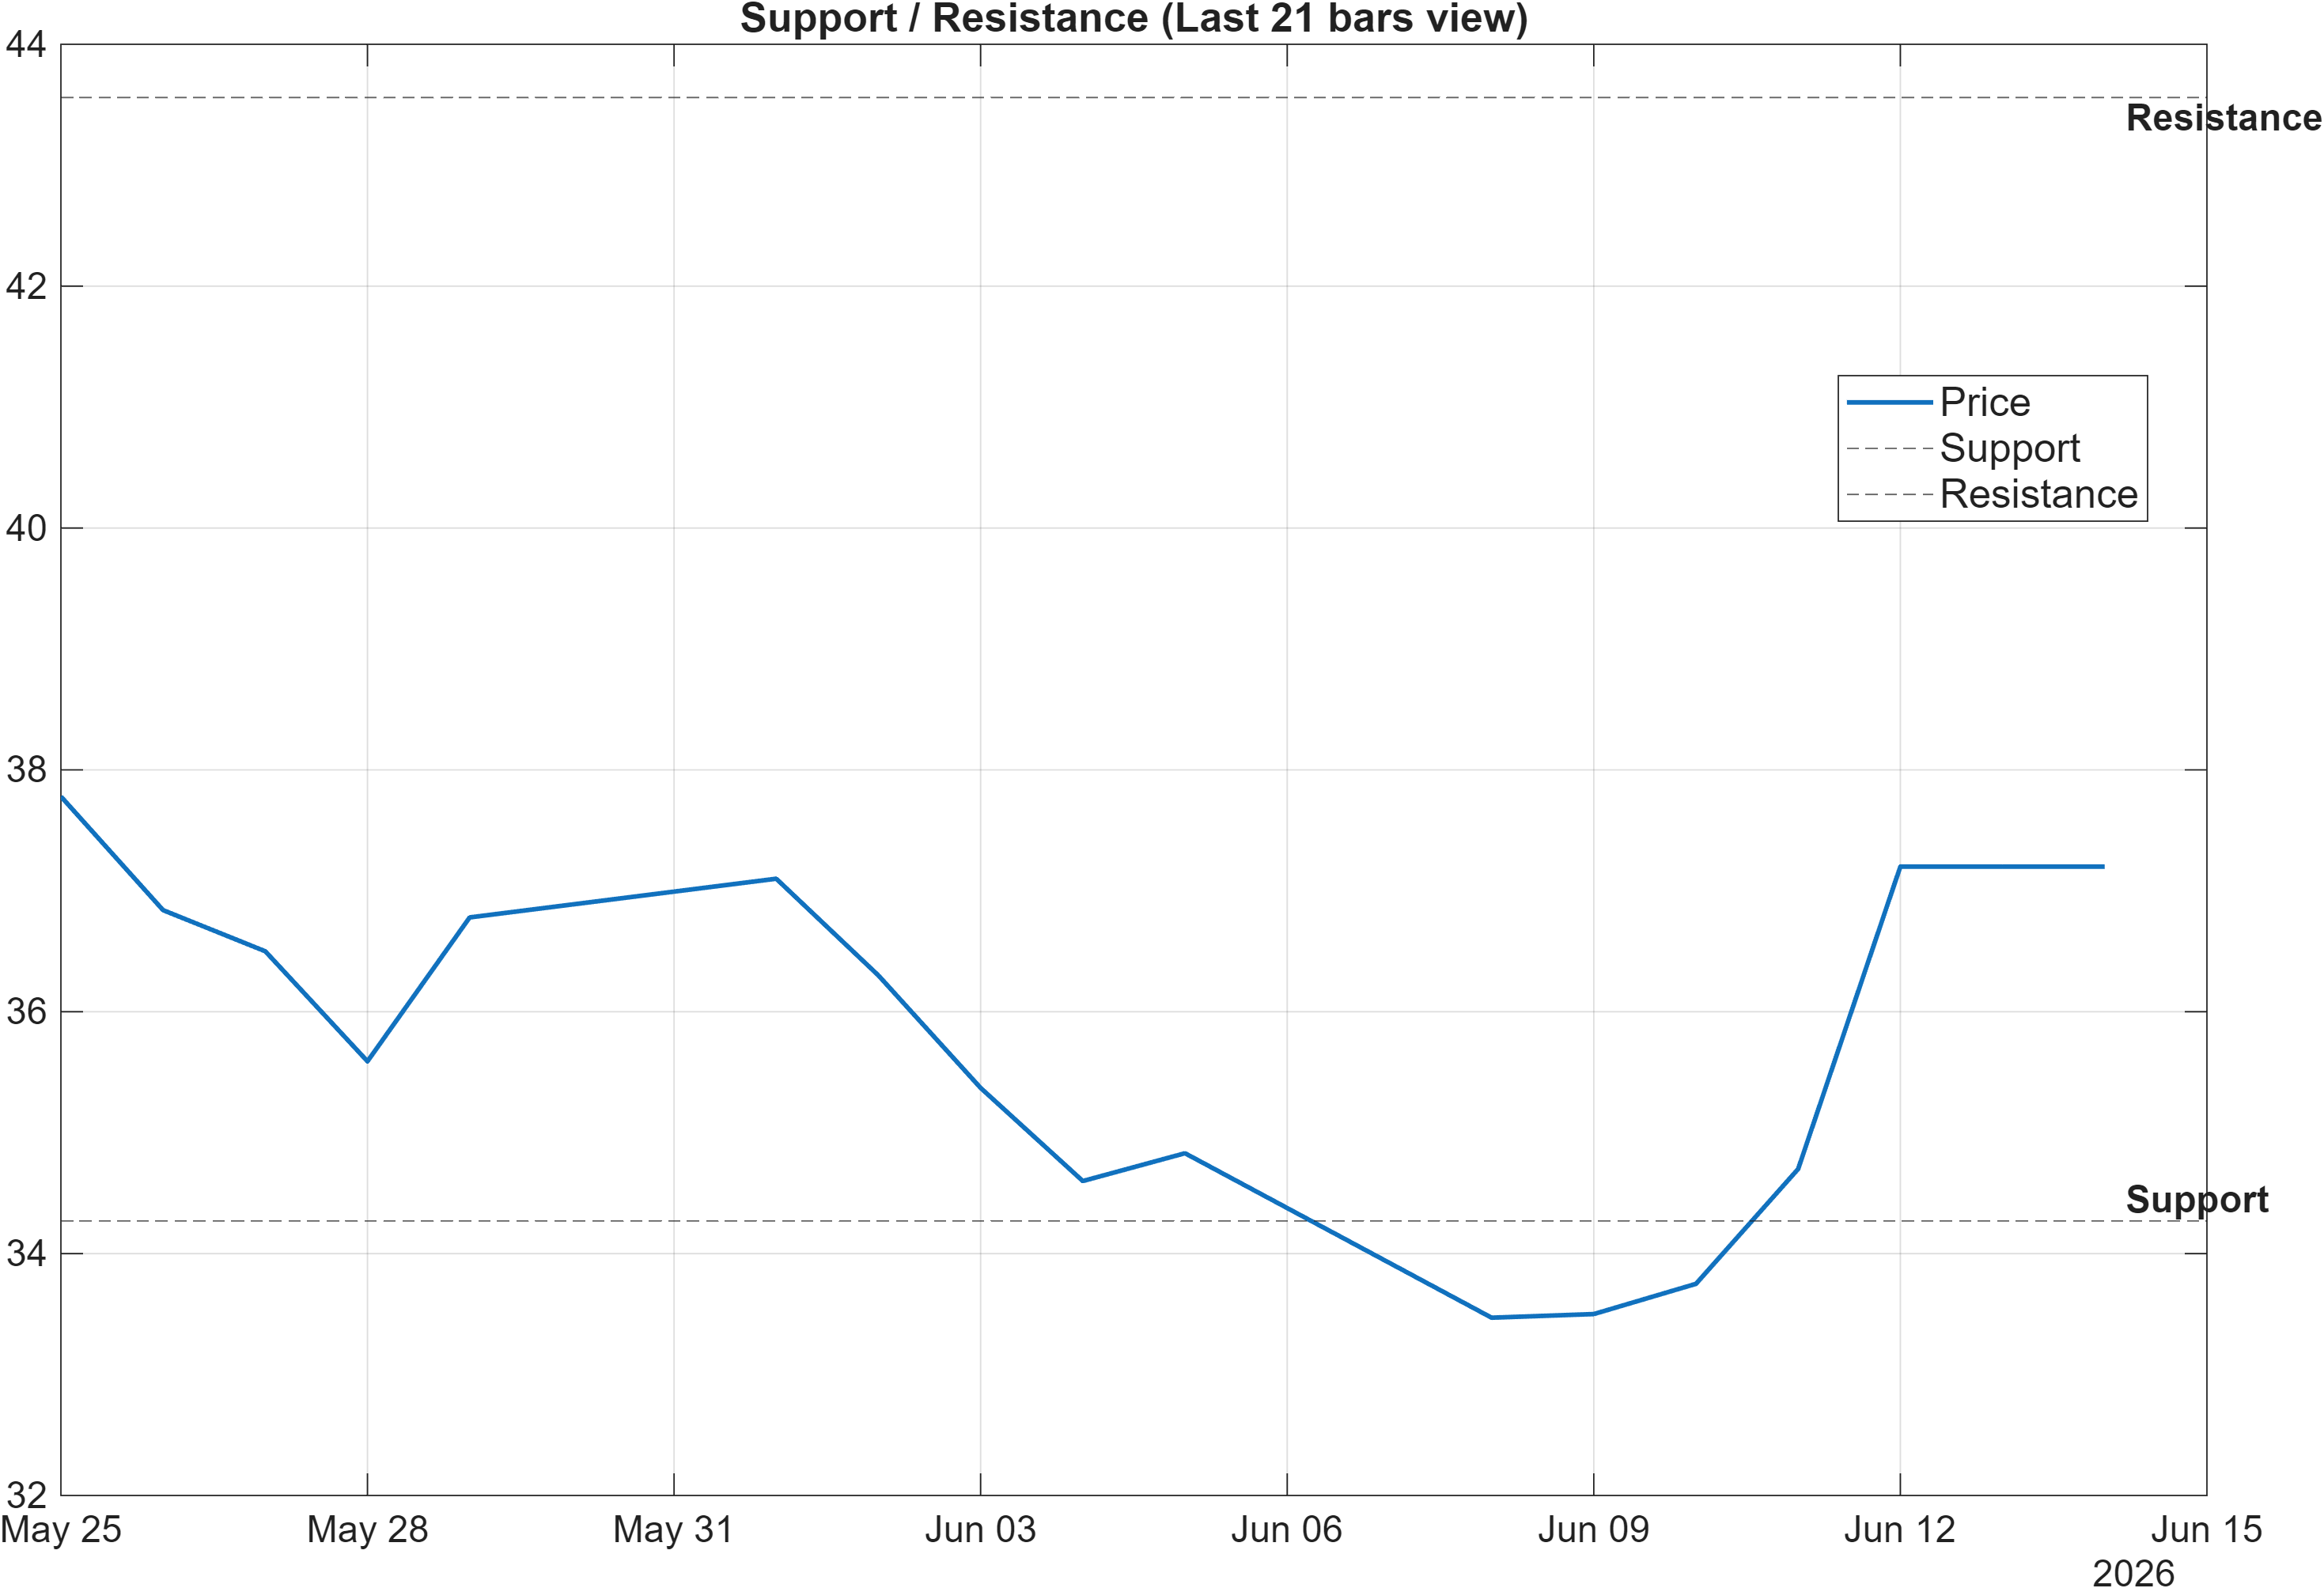
Scenario view: Break above resistance with volume → continuation. Close below support → signal deterioration risk.
Decision zones: where consolidation turns into continuation or deterioration
The level map is clean and offers an efficient way to arbitrate the current “bullish confluence vs mixed ranks” profile. 34.2700 functions as the principal support zone: a sustained hold above this level is consistent with the constructive technical stack (blended score 0.629) and with the stronger intermediate ranks (notably #22 on a 3-month basis).
On the upside, 43.5600 is the primary resistance gate. Given that the moving-average configuration remains conflicted (close>MA50 bullish, but MA50<MA200 bearish), a breakout attempt is best evaluated not merely by an intraday print, but by acceptance—i.e., sustained trading above the zone with confirming participation. This is consistent with the report’s own scenario framing: “break above resistance with volume → continuation.”
The most analytically relevant risk is not “volatility spike” but range failure. A close below 34.2700 would shift probability toward deterioration, aligning more closely with the weaker monthly rank (#1052) and the softer short-horizon posture (daily #966). In that event, bullish indicator readings (e.g., MACD histogram 0.4672) would be interpreted as lagging or failing to translate into price-level confirmation.
In short, levels are the arbitration tool: bullish structure is credible while support holds; bullish continuation becomes more credible only with proven acceptance above resistance.
5) Quant Technical Dashboard (18 Signals)
KGNAI AI Technical Analysis Score (Deep Reinforcement Learning): Rank #129 out of 1292 (Rank 1 represents the strongest technical positioning and a higher probability of favorable price behavior. As ranks increase toward the maximum, the probability of favorable outcomes weakens and bearish positioning becomes more dominant.) | Label: Bullish | Score: 0.800
18-Signal Technical Confluence Score: 0.556 (Bullish)
Overall Technical Score (18-signal confluence + DRL rank blend): 0.629 (Bullish)
Note: The blended score reflects signal strength weighted against broader AI technical ranking, which may temporarily diverge.
Blended technical score breakdown: 0.629 (Bullish | Bull 12 / Bear 2 / Neutral 4)
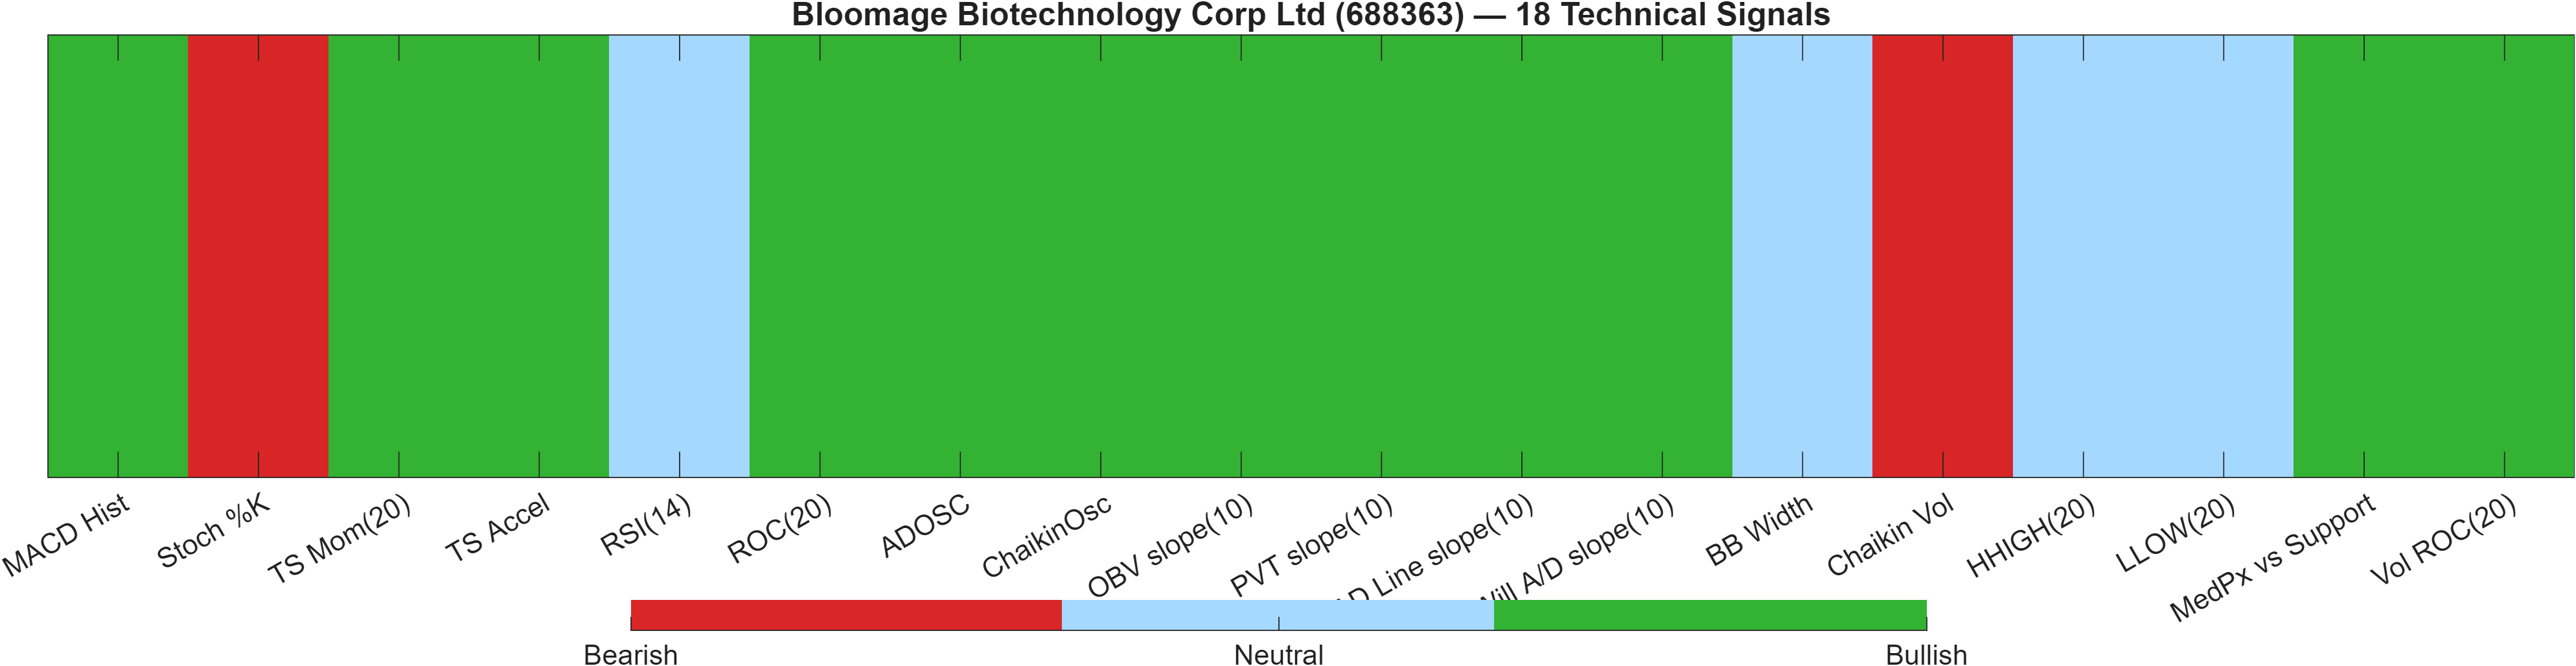
Confluence vs. contradictions inside the signal stack
The dashboard is notable for breadth of supportive signals rather than reliance on a single driver. The blended technical score of 0.629 and DRL rank #129 indicate the model is detecting relatively favorable technical positioning versus the broader universe, consistent with a market that has stabilized despite mixed higher-level ranks.
Under the hood, the contradiction is specific and interpretable: momentum and accumulation measures skew constructive while certain short-cycle/volatility components introduce friction. For example, MACD histogram 0.4672 and ROC(20) 0.9772 support ongoing positive impulse, while RSI(14) 51.3 remains neutral—typical of a consolidation that has not yet transitioned into a strong trend. Meanwhile, Stoch %K 89.35 is flagged bearish, consistent with short-cycle overheating that can cap near-term follow-through inside a range.
Participation indicators also matter here because they often decide whether breakouts stick. Several volume/flow-based signals are bullish (e.g., ADOSC 89.88 and Vol ROC(20) 153.3), which helps explain why the confluence score is positive even with mixed rank horizons. In a consolidation regime, that kind of participation tilt can act as a stabilizer—yet it still requires level confirmation at 43.5600 to move from “constructive” to “validated continuation.”
Signal table (Bull/Bear/Neutral)
| Indicator | Value | Signal |
|---|---|---|
| MACD Hist | 0.4672 | Bullish |
| Stoch %K | 89.35 | Bearish |
| TS Mom(20) | 0.36 | Bullish |
| TS Accel | 5.08 | Bullish |
| RSI(14) | 51.3 | Neutral |
| ROC(20) | 0.9772 | Bullish |
| ADOSC | 89.88 | Bullish |
| ChaikinOsc | 7.111e+06 | Bullish |
| OBV slope(10) | 1.151e+07 | Bullish |
| PVT slope(10) | 6.522e+05 | Bullish |
| AD Line slope(10) | 1.477e+07 | Bullish |
| Will A/D slope(10) | 1.79 | Bullish |
| BB Width | 0.1562 | Neutral |
| Chaikin Vol | 83.56 | Bearish |
| HHIGH(20) | 37.99 | Neutral |
| LLOW(20) | 32.92 | Neutral |
| MedPx vs Support | 1.76 | Bullish |
| Vol ROC(20) | 153.3 | Bullish |
Interpretation: Indicator-level signals form the base confluence, which is then adjusted using a separate AI-driven technical ranking model. The final technical score summarizes this combined view.
6) News sentiment + extractive gist
Note: Instrument-specific news matches were not found, so the digest includes broader market/sector headlines. Links are provided for verification.
Sentiment score (avg): -0.026 | Positive: 12% | Neutral: 63% | Negative: 25%
KGNAI AI News Sentiment Score (normalized -1 to +1): Not available (as of —) | Label: Not available | Overall news score: -0.03
Positive Developments
Recent coverage across major financial outlets indicates a backdrop with some constructive angles, primarily tied to broader discussions of innovation capacity, industrial efficiency, and shifting demand patterns in energy-adjacent and technology-linked areas. While these items are not instrument-specific, they can influence sector risk appetite and positioning—especially for names trading in consolidation. In this report, the technical layer is already leaning constructive (overall technical score 0.629), so even modestly supportive macro/industry tone can help explain why downside momentum has not dominated despite mixed KGNAI ranks. With the sentiment mix showing 12% positive and 63% neutral, the positive component appears more like a marginal tailwind than a primary driver. The practical implication is that supportive narratives may assist follow-through only if price confirms above the key resistance zone (43.5600).
Neutral / Mixed Developments
The dominant informational tone remains neutral, consistent with a sentiment average of -0.026 and a majority 63% neutral distribution. Broad geopolitical and policy-related items can introduce cross-asset volatility, but in many cases they function as context rather than direct catalysts for an individual China-listed instrument. This neutral-heavy mix aligns with what the technicals are communicating: RSI(14) at 51.3 and Bollinger bandwidth 0.1562 both point to a market that is not currently in an extreme state. In that environment, “mixed” news flow tends to reinforce range behavior, making level-based confirmation more informative than narrative interpretation.
Negative / Risk Signals
Risk-oriented coverage across major outlets highlights policy, regulatory, and geopolitical frictions that can periodically pressure Chinese equities via sentiment and positioning channels. The news distribution includes 25% negative items and an overall score near -0.03, which is not deeply risk-off but can still contribute to hesitation when the price is testing important decision points. In a consolidation regime, negative contextual headlines often do not “break” a chart by themselves, but they can reduce breakout quality by limiting participation. For 688363, the relevant translation is straightforward: if resistance (43.5600) fails repeatedly, the mild negative bias can amplify mean reversion back toward support (34.2700), aligning with the weaker monthly rank (#1052).
- Whether price acceptance develops above 43.5600 alongside improving participation.
- Whether support at 34.2700 remains intact during broader market volatility.
- Whether sentiment remains near-neutral or drifts more negative as events evolve.
Sources referenced: Reuters, Bloomberg, Yahoo Finance, MarketWatch, Investing.com
Snapshot: AI Rank (Short–Mid–Long): Mixed (Neutral–Bearish–Neutral) · Technical Confluence: Bullish · Key Levels: Support ~34.27 | Resistance ~43.56 · News Sentiment: Neutral
7) Sources
Not available in the provided data.
You may also like: How KGNAI AI ranks instruments across global markets
Disclaimer: KGNAI provides AI-generated analytics and educational market commentary only. This is not financial advice. Markets involve risk. Always do your own research.