
Stadler Rail AG (SRAIL.SW) — 03-Jun-2026 Technical/Rank Alignment Skews Cautious Despite Select Bullish Signals
Stadler Rail AG (SRAIL.SW) sits in a notably weak relative position within KGNAI’s EUROPE universe (1,397 instruments) as of 03-Jun-2026. The cross-horizon rank profile is broadly bearish, with the daily rank #1283 and monthly rank #1273 placing the name in the lower tier of the tracked universe, while the weekly rank #499 is comparatively less negative and points to a shorter-term stabilization attempt. Technically, the picture is more nuanced: moving-average structure is flagged as bullish (close vs MA50 bullish; MA50 vs MA200 bullish), and the blended technical framework reads 0.349 (Bullish) even as the 18-signal confluence sits at 0.167 (Neutral). With support near 20.6267 and resistance near 23.4133, the report’s core question is whether constructive technical pockets can persist while relative ranking remains pressured.
Key Takeaways
- Rank stance (Short / Mid / Long): Bearish / Bearish / Bearish (daily #1283; monthly #1273; yearly #1268 out of 1397).
- Technical confluence label: Neutral (18-signal confluence 0.167), while blended technical score is Bullish (0.349).
- Key levels: Support ~ 20.6267 | Resistance ~ 23.4133.
- News sentiment bias: Neutral distribution (avg 0.000; 71% neutral; 14% positive; 14% negative) with an AI news label Bullish (normalized 1.00, as of 2026-03-26).
- Confirmation / invalidation condition: A break above 23.4133 with volume supports continuation; a close below 20.6267 increases deterioration risk.
What KGNAI Measures
KGNAI evaluates assets using large cross-sectional datasets built from millions of structured data points. Inputs incorporate fundamental metrics, technical structures, and systematically processed news sentiment. Statistical models, machine learning, and AI frameworks are used to assess relative positioning, signal alignment, and probabilistic behavior across broad universes.
How to Read This Report
- Ranks are comparative across the tracked universe, not absolute price targets.
- Confluence reflects alignment among independent signal groups.
- Support/resistance levels are probabilistic decision zones, not guarantees.
- Sentiment provides contextual bias within the broader analytical framework.
1) KGNAI AI Analysis
Region: EUROPE
Total universe size: 1397 ranked instruments
- Daily rank: #1283 out of 1397 — Bearish
- Weekly rank: #499 out of 1397 — Neutral
- Monthly rank: #1273 out of 1397 — Bearish
- 3-Monthly rank: #1273 out of 1397 — Bearish
- 6-Monthly rank: #1273 out of 1397 — Bearish
- Yearly rank: #1268 out of 1397 — Bearish
The rank stack is consistently weak across most horizons, with #1283 daily and #1268 yearly placing SRAIL.SW in the lower tail of the 1,397-instrument universe. In a comparative framework, that concentration of high (unfavorable) rank numbers typically signals under-selection by cross-sectional models rather than a single-timeframe issue.
The notable exception is the weekly rank #499, which sits closer to the middle of the distribution and carries a Neutral label. This divergence suggests that shorter-horizon behavior has improved relative to the longer-term profile, but it has not (yet) translated into comparable strength at the monthly, 3-month, or 6-month levels (all #1273 and bearish).
From a regime perspective, the rank configuration reads as attempted stabilization inside a broader weak relative trend. When weekly improves while monthly and yearly remain deeply bearish, the burden of proof typically shifts to persistence: the weekly improvement needs reinforcement through continued favorable technical behavior and avoidance of key-level breakdowns (see support at 20.6267).
Term view remains Bearish across short-, mid-, and long-term classifications in the provided data, so any tactical strength should be evaluated against that higher-level constraint rather than treated as a resolved regime change.
2) Price & trend overview
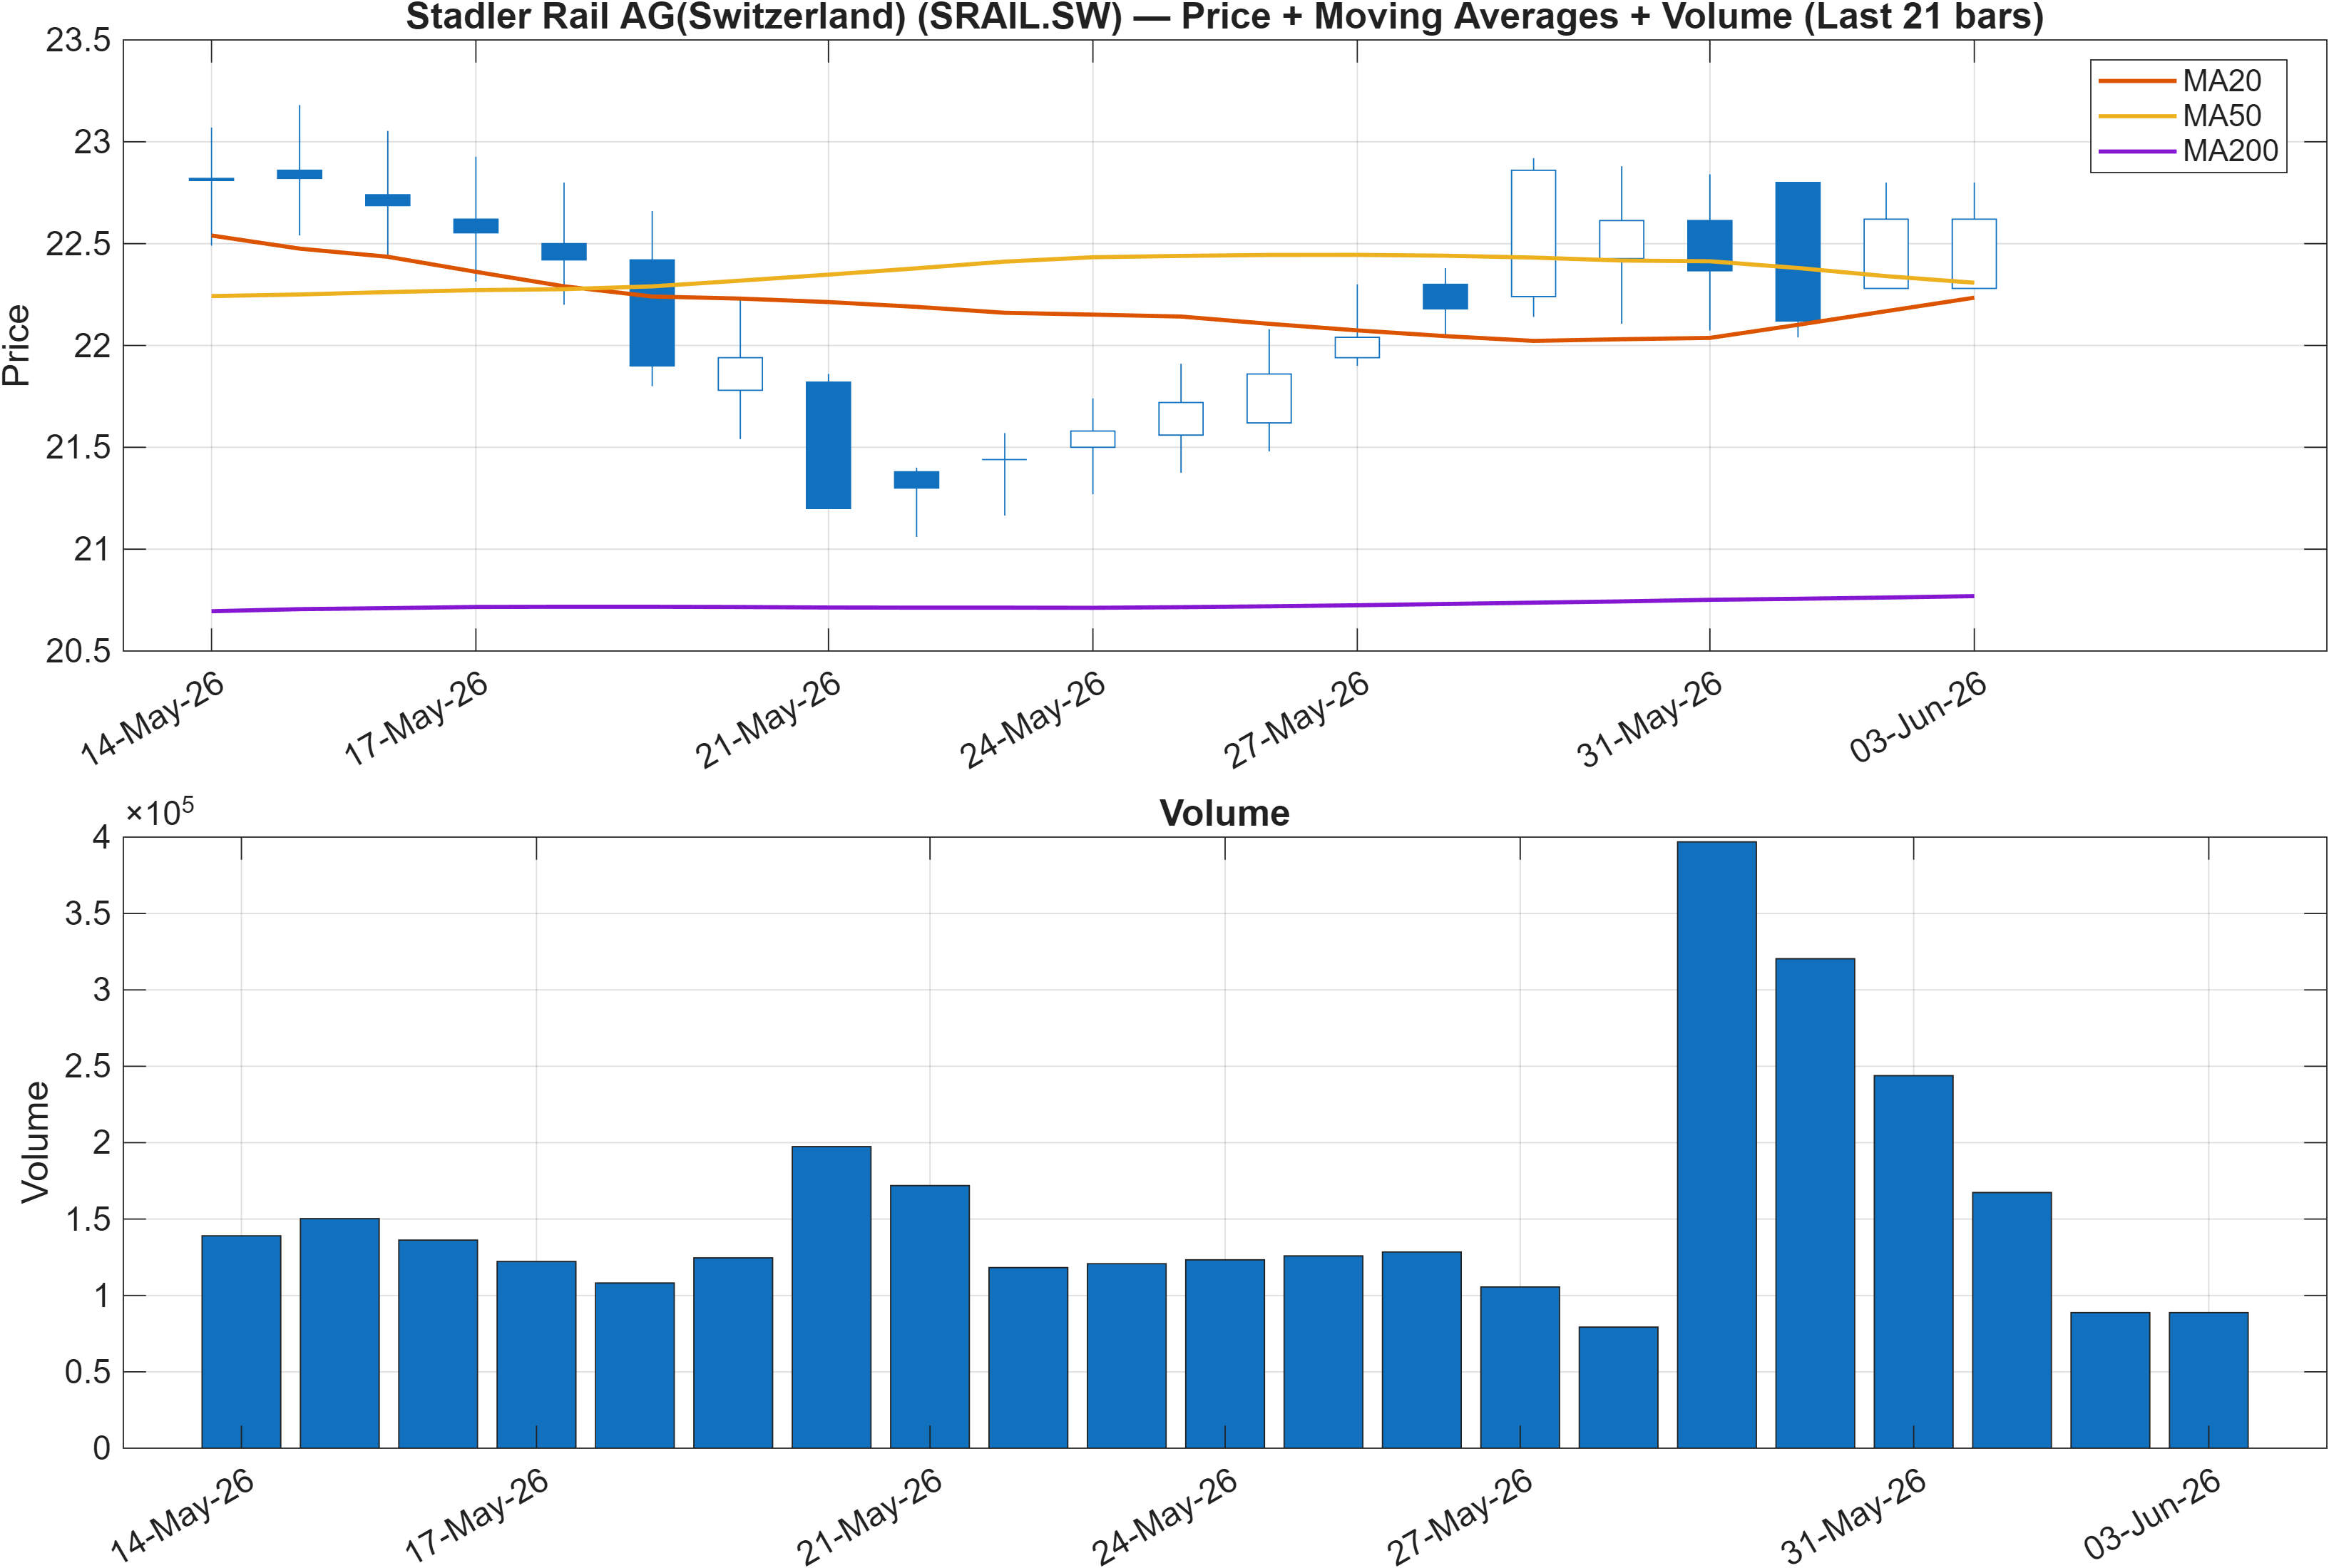
Trend structure is the clearest area of constructive evidence in the dataset: the interpretation flags both close vs MA50 = Bullish and MA50 vs MA200 = Bullish. In classical trend diagnostics, that combination often aligns with a market that has either transitioned into, or is attempting to sustain, a positive intermediate trend.
Alignment vs. divergence: trend signals vs. cross-sectional ranks
The key analytical tension is that this bullish moving-average configuration coexists with strongly bearish longer-horizon ranks (for example, monthly #1273 and yearly #1268). Practically, this can occur when price has improved from a depressed relative state but has not accrued enough time or breadth of confirmation to re-rank favorably against peers.
Participation sensitivity into key levels
While Figure 1 presents volume alongside price and averages, the broader signal set indicates potential participation fragility: the 18-signal table later flags Vol ROC(20) = -40.94 as bearish. When trend structure is positive but volume rate-of-change contracts, upside follow-through can become more dependent on discrete bursts of activity near inflection zones—particularly around 23.4133 resistance.
Within this setup, trend continuation is best treated as a conditional outcome: the moving averages support the constructive case, but the rank regime implies that the market has not fully repriced SRAIL.SW into a stronger relative cohort. Monitoring whether price can sustain above key supports while pressuring resistance becomes the practical test of trend persistence.
3) Momentum & volatility dashboard
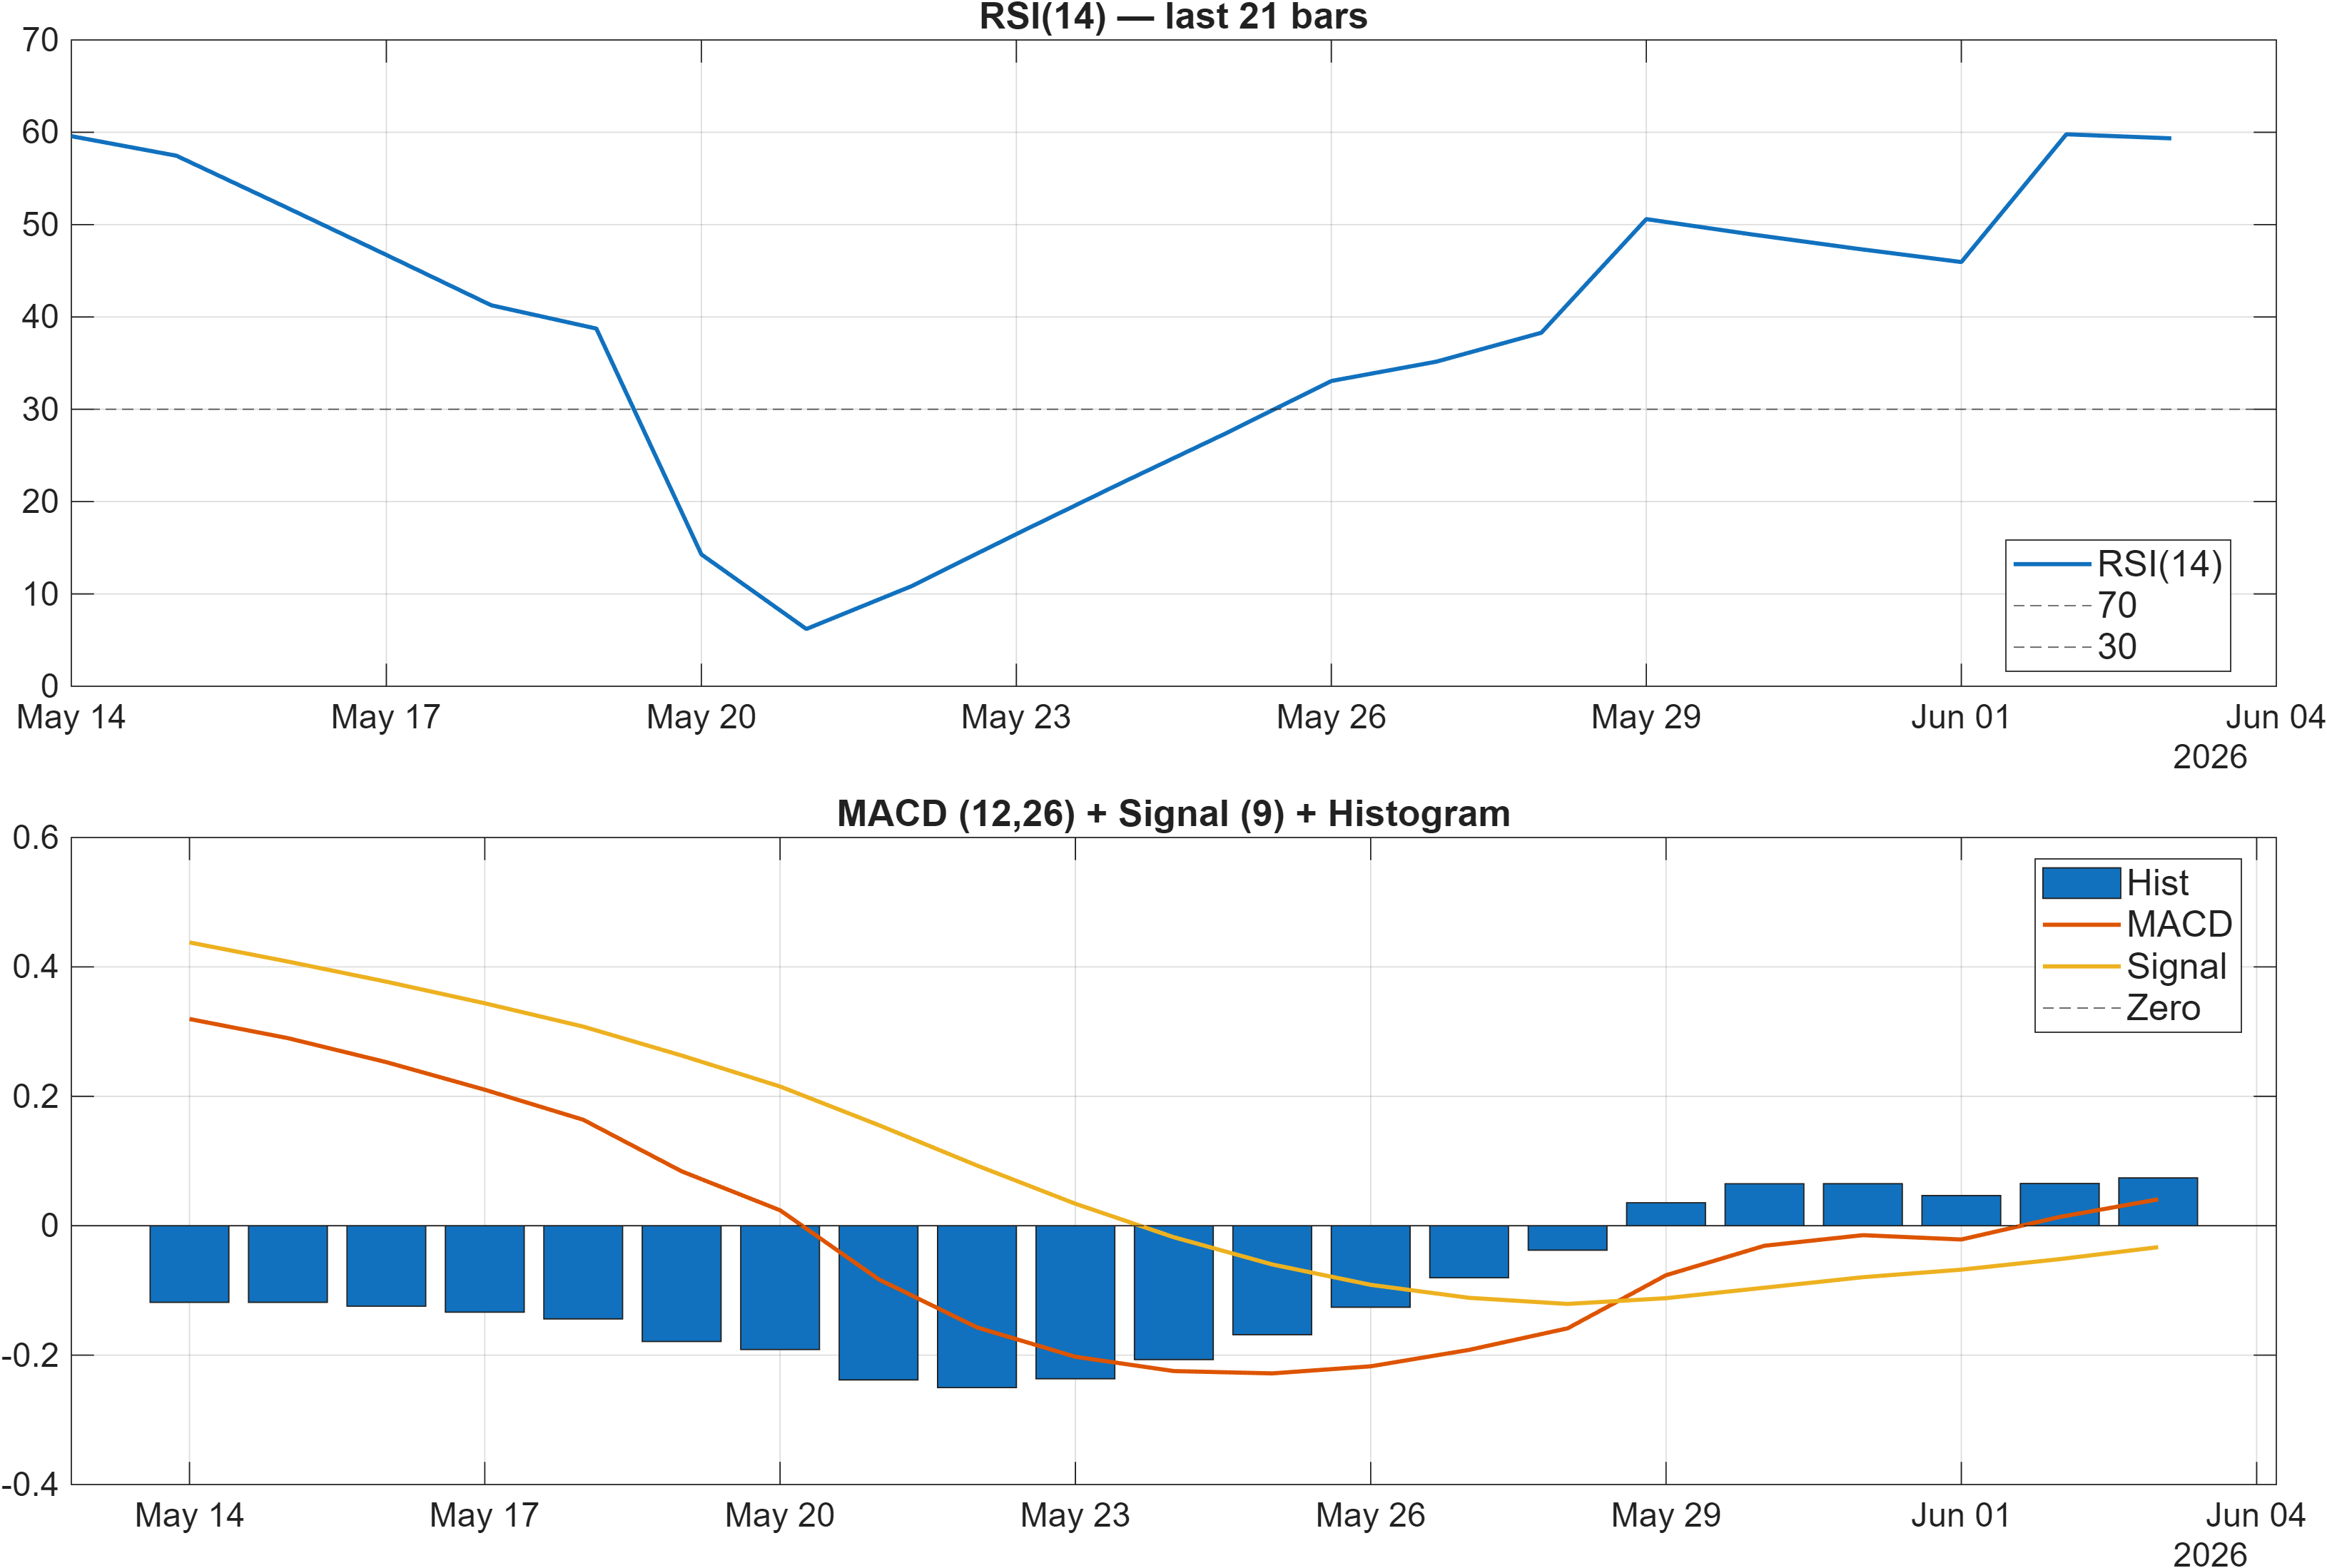
Interpretation: RSI bias = Neutral, MACD hist = 0.0739.
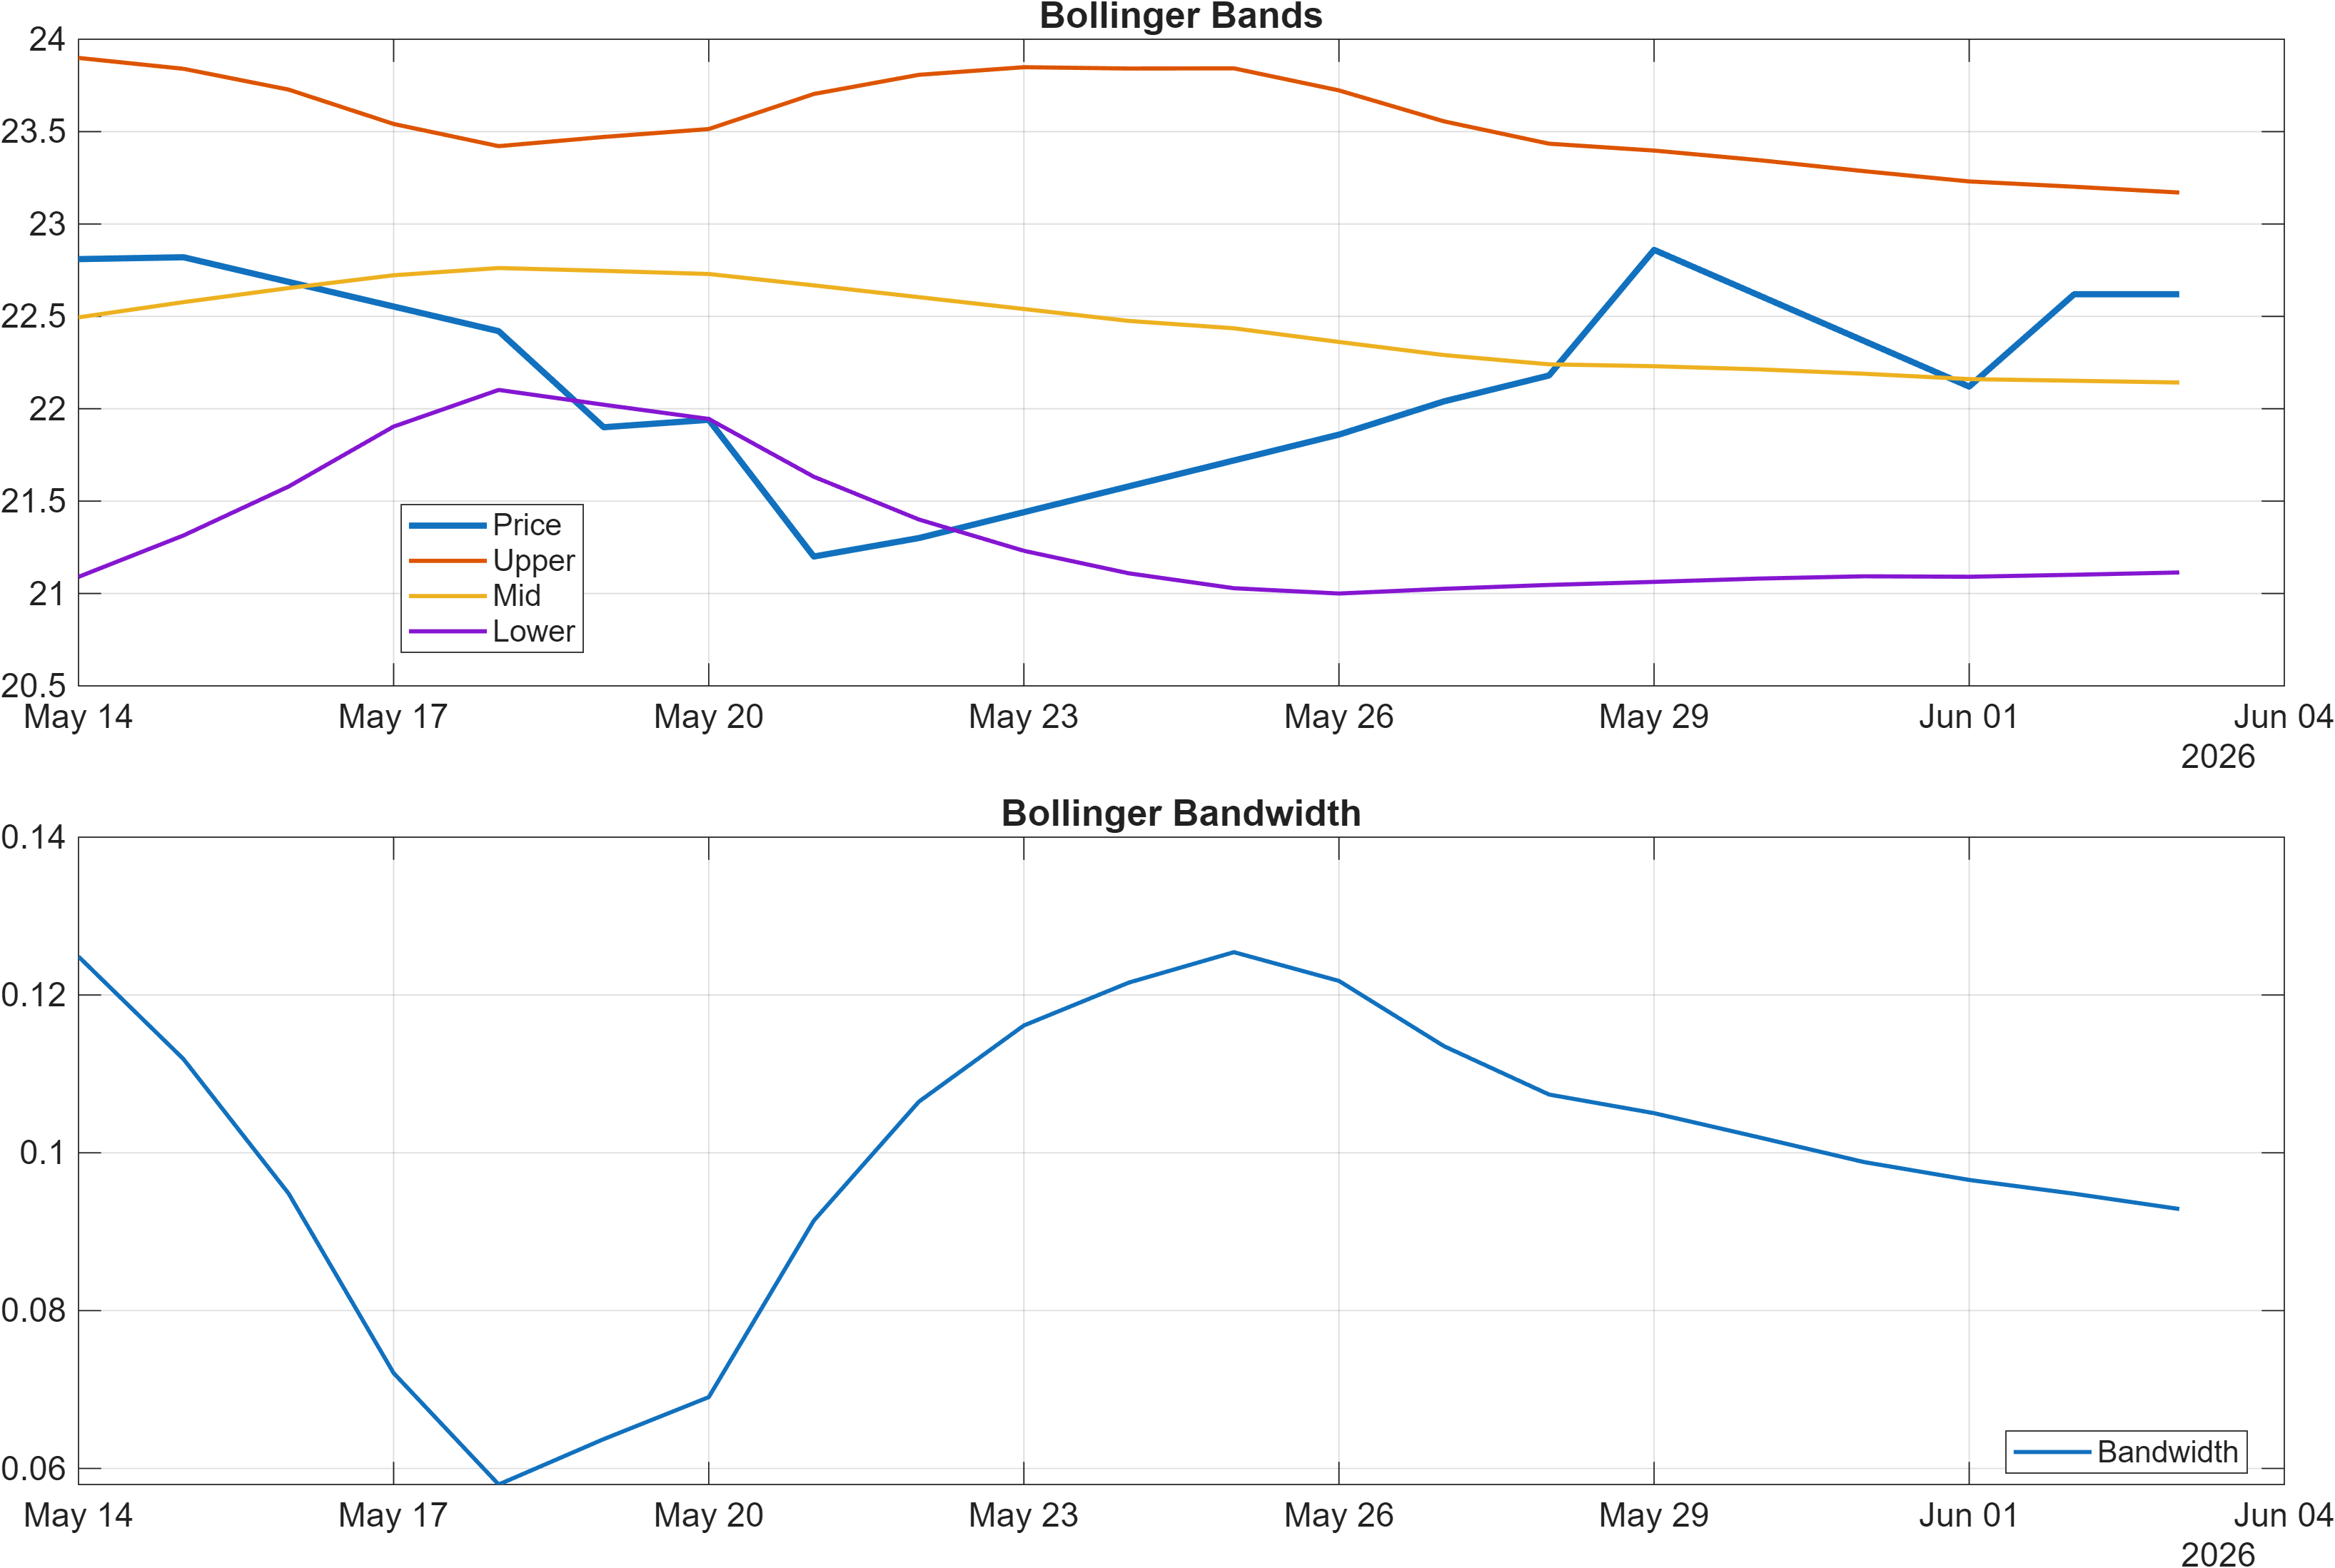
Interpretation: Bandwidth (volatility regime) latest = 0.0929.
Momentum: constructive MACD vs mixed rate-of-change
Momentum is not one-directional in the provided indicators. On one hand, MACD histogram at 0.0739 points to positive momentum impulse in the MACD framework. On the other, the signal table later records ROC(20) = -0.8764 (bearish) alongside TS Mom(20) = -0.2 and TS Accel = -1.4 (both bearish), a combination consistent with decelerating price change even when MACD remains above a neutral line.
RSI posture and exhaustion risk
The RSI read is balanced rather than stretched. Figure 2 labels RSI bias as neutral, while the signal table shows RSI(14) = 59.34 with a bullish label. This is a zone that can support trend continuation without immediately implying overbought conditions; however, it can also mean momentum lacks the “pressure” typically associated with strong breakout phases unless accompanied by rising participation.
Volatility regime: contained expansion potential
With Bollinger Bandwidth at 0.0929 (and BB Width 0.09288 neutral in the table), volatility appears contained rather than explosively expanding. In practical signal terms, compressed-to-moderate bandwidth often makes level breaks more important: moves beyond 23.4133 (resistance) or below 20.6267 (support) can carry outsized informational value because they may occur from a relatively stable regime.
4) Support / Resistance zones
Support ~ 20.6267 | Resistance ~ 23.4133
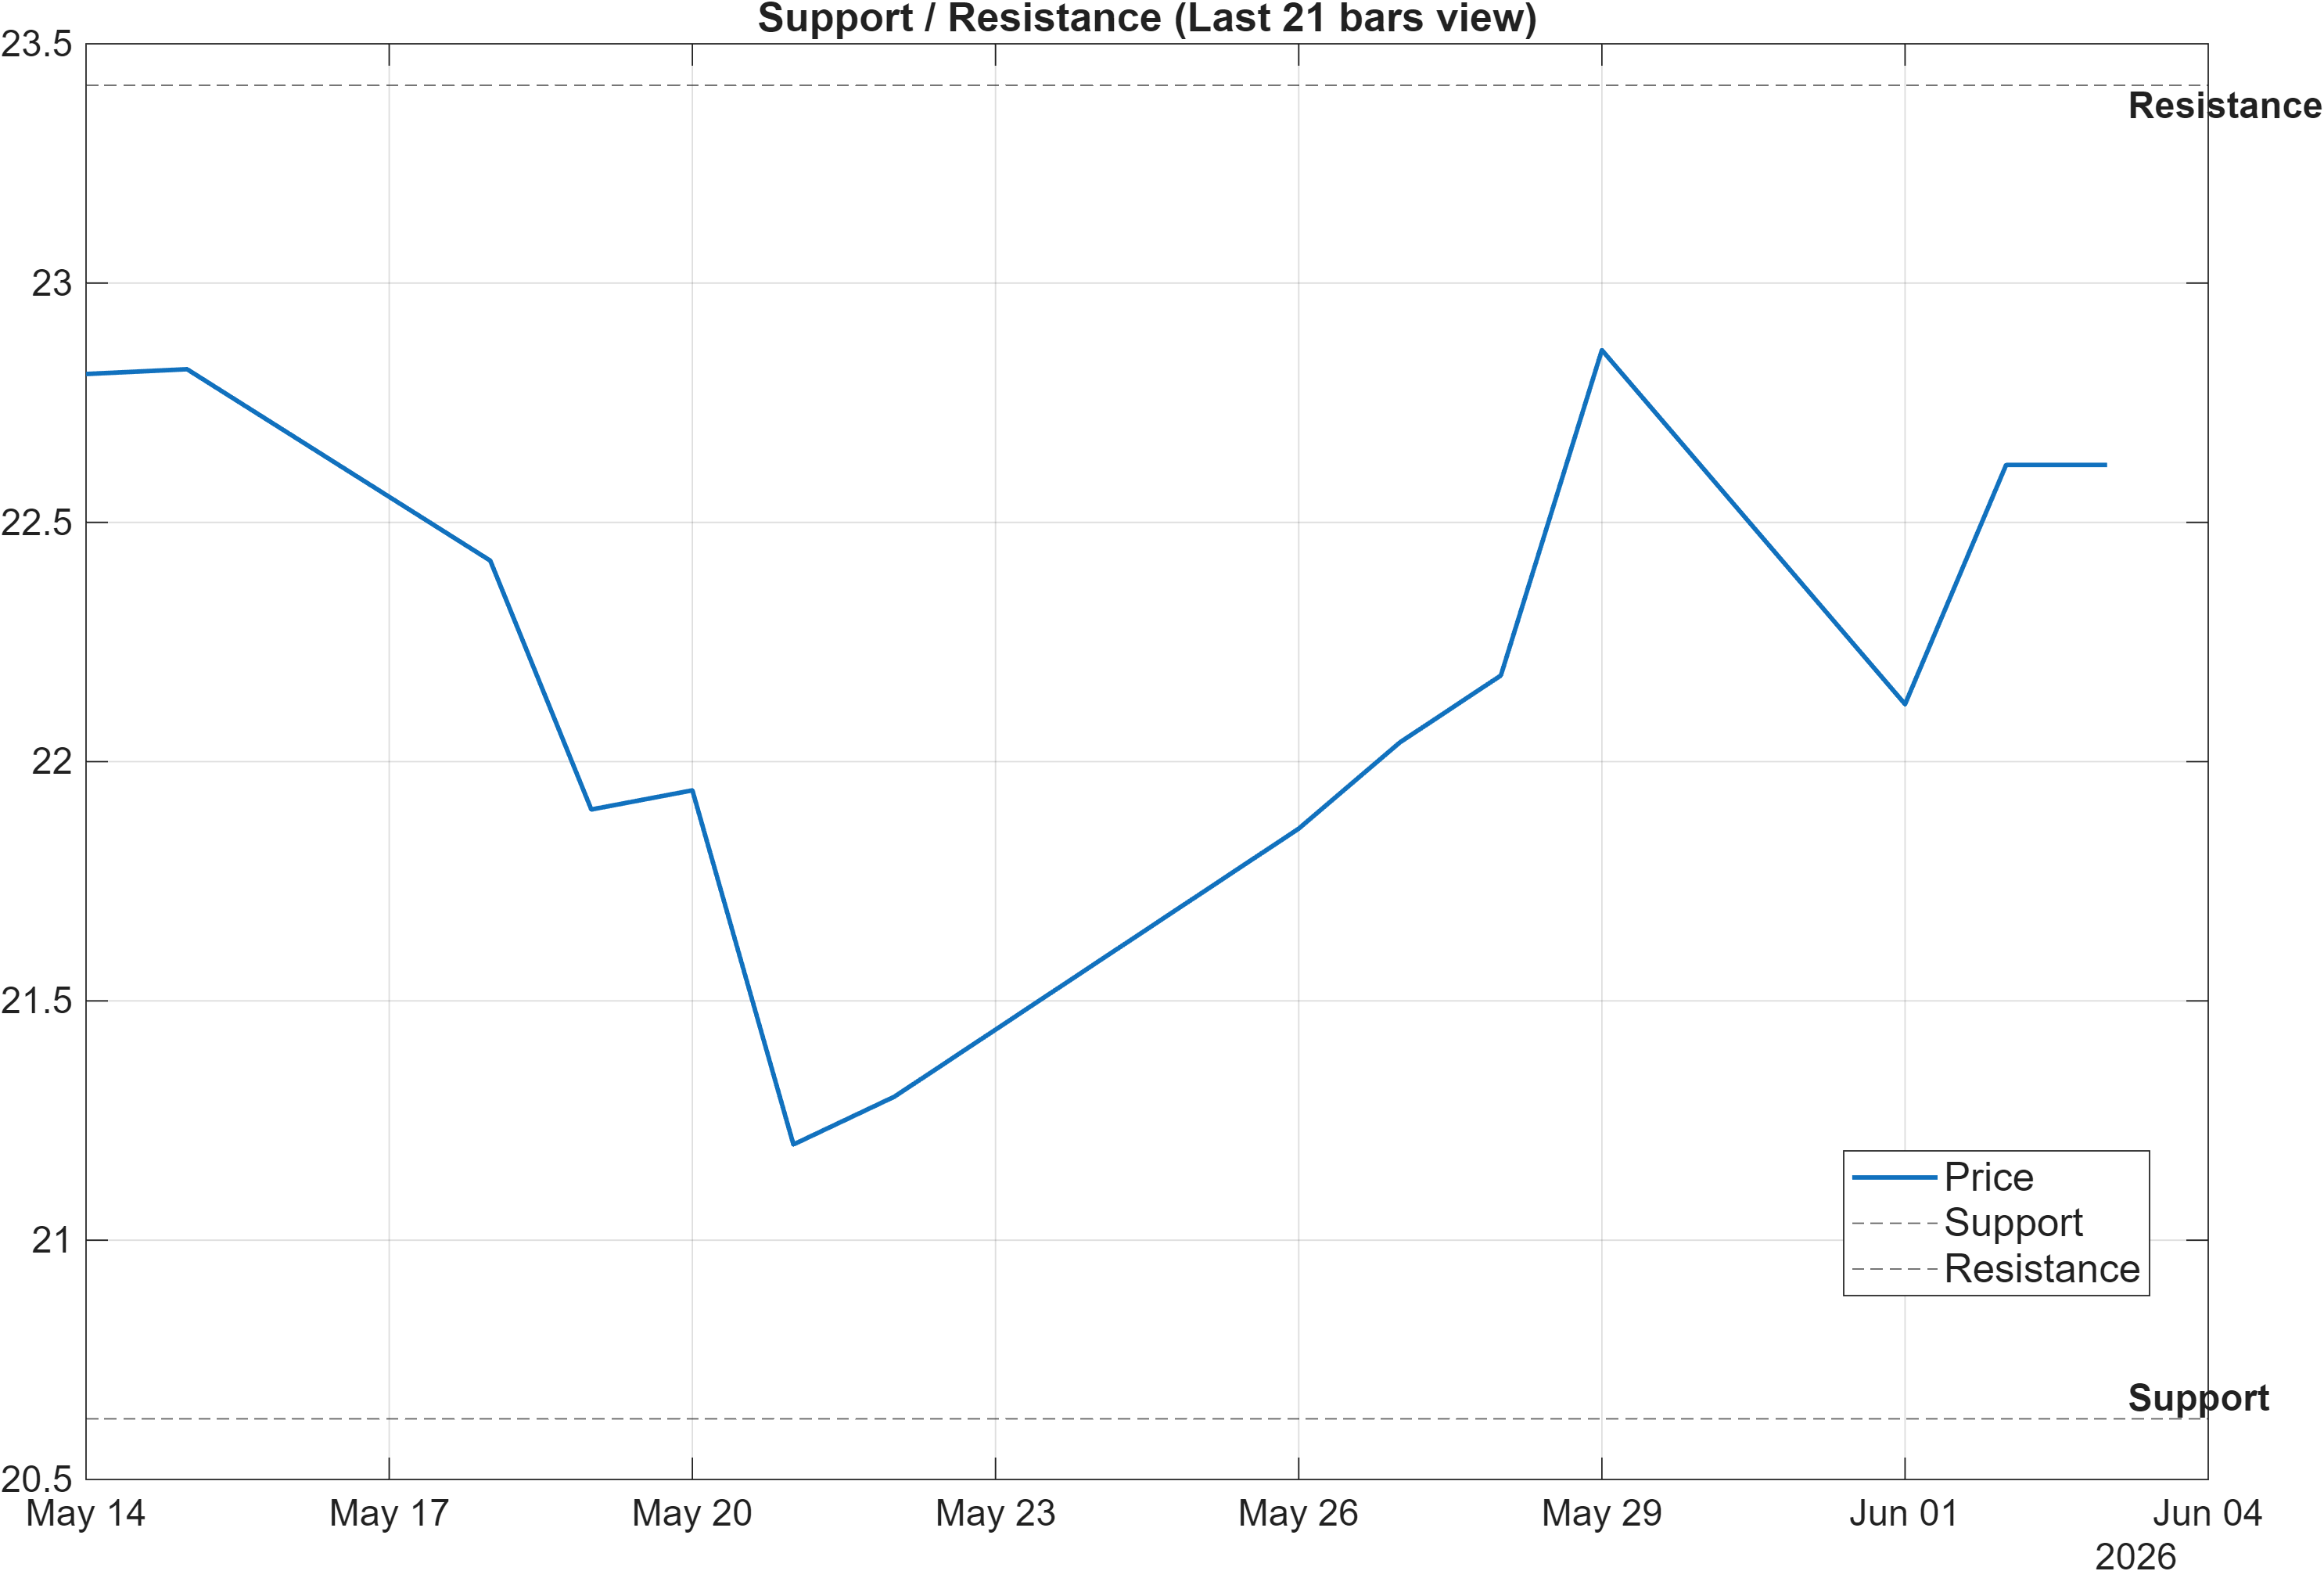
The level map is tight enough to frame a clear decision corridor: 20.6267 as the downside pivot and 23.4133 as the upside ceiling. The scenario guidance in the provided data is explicit—break above resistance with volume favors continuation, while a close below support raises deterioration risk—so the analytical focus becomes the quality of approach into these zones.
Regime continuation vs transition
Given the longer-horizon ranks remain bearish (monthly and 3-/6-month all at #1273), a sustained hold above support is not merely defensive; it is the first requirement for any transition away from the weak relative regime. The signal table provides one supportive micro-confirmation: MedPx vs Support = 1.913 is labeled bullish, consistent with price residing above (or respecting) the computed support structure.
Resistance as a filter for signal quality
Resistance near 23.4133 should be treated as a filter for whether bullish technical elements are robust or merely tactical. Several indicators hint at mixed follow-through conditions—e.g., Stoch %K = 80.58 is bearish, and Vol ROC(20) = -40.94 is bearish—so a resistance breach that occurs without improved participation would tend to be a lower-confidence confirmation within this framework.
In short, the support/resistance envelope is the practical reconciliation point between a bullish moving-average structure and bearish cross-sectional ranks: holding 20.6267 preserves stabilization, while acceptance above 23.4133 is the cleaner pathway to improving technical confirmation quality.
5) Quant Technical Dashboard (18 Signals)
KGNAI AI Technical Analysis Score (Deep Reinforcement Learning): Rank #158 out of 1397 (Rank 1 represents the strongest technical positioning and a higher probability of favorable price behavior. As ranks increase toward the maximum, the probability of favorable outcomes weakens and bearish positioning becomes more dominant.) | Label: Bullish | Score: 0.774
18-Signal Technical Confluence Score: 0.167 (Neutral)
Overall Technical Score (18-signal confluence + DRL rank blend): 0.349 (Bullish)
Note: The blended score reflects signal strength weighted against broader AI technical ranking, which may temporarily diverge.
Blended technical score breakdown: 0.349 (Bullish | Bull 9 / Bear 6 / Neutral 3)
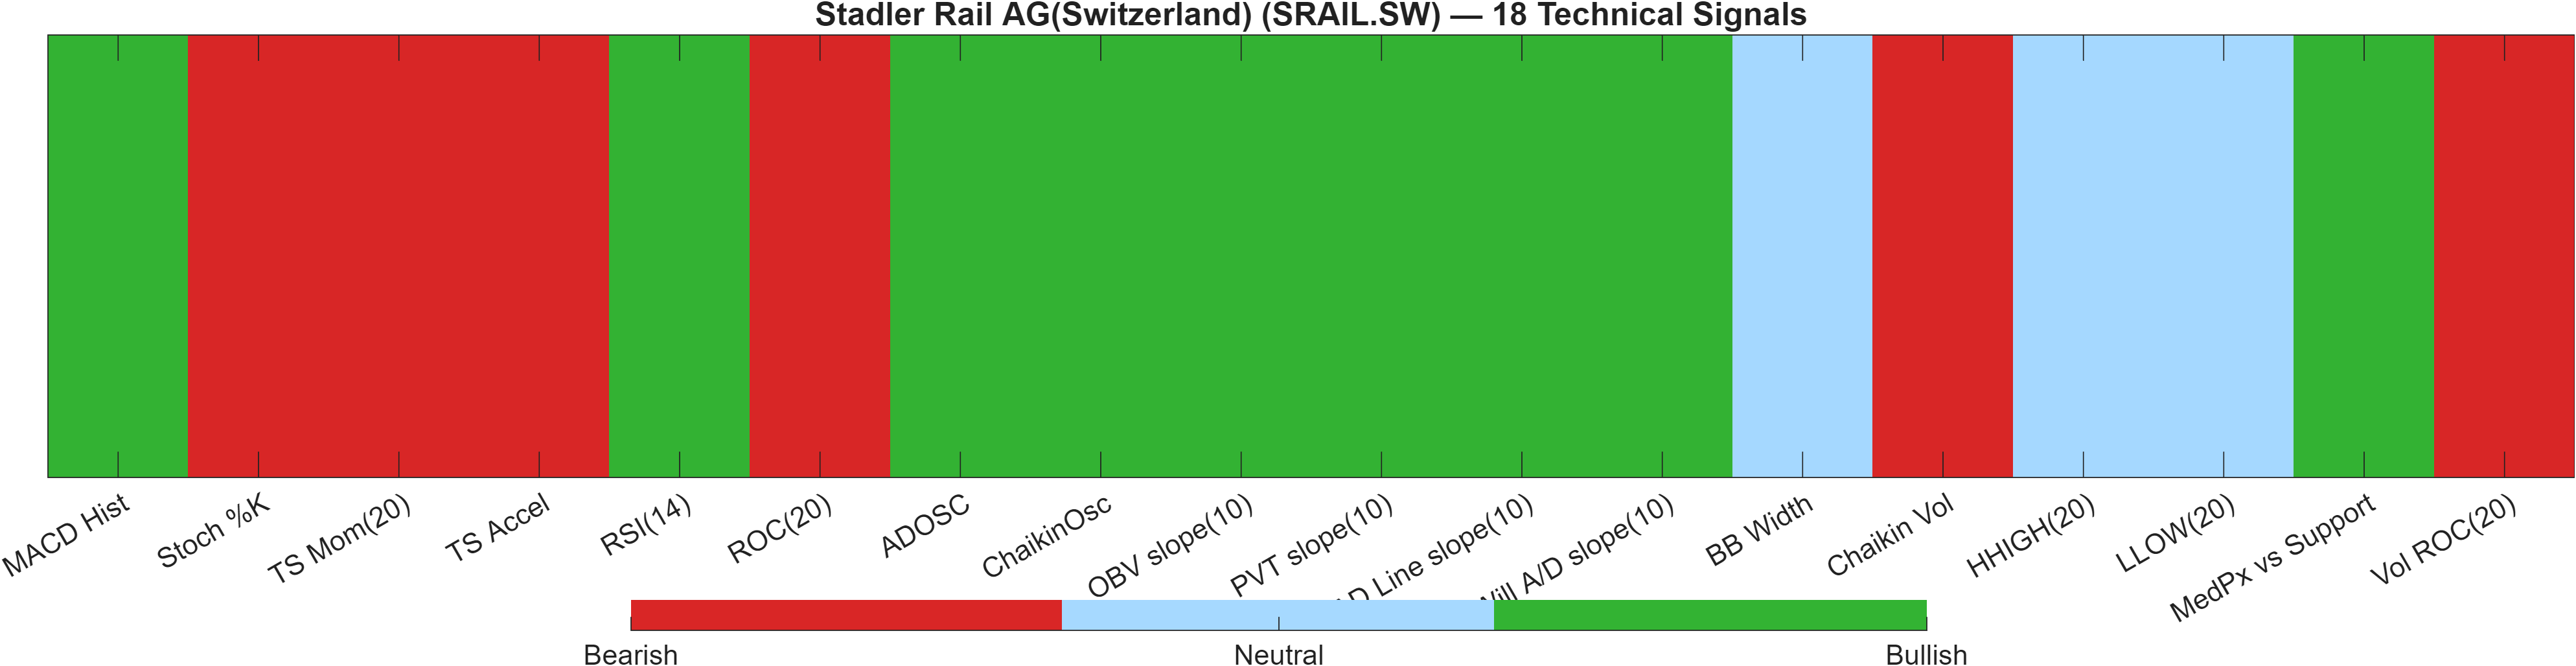
Composite reading: bullish AI technical rank vs neutral confluence
The most important nuance in the technical dashboard is the internal split between model layers. The Deep Reinforcement Learning technical read is strong (rank #158 of 1,397; score 0.774, bullish), while the 18-signal confluence score is 0.167 and labeled Neutral. The blended outcome (0.349, bullish) indicates the AI rank component is doing meaningful “lifting” relative to the simpler indicator vote.
Where the indicator layer agrees (and where it does not)
The indicator mix is not chaotic; it is segmented. Accumulation/participation style measures are broadly constructive—e.g., ADOSC = 82.69 bullish and OBV slope(10) = 1.931e+05 bullish—supporting the idea that buying pressure has been present. Momentum and rate-of-change signals are more conflicted: MACD Hist = 0.07388 is bullish, yet ROC(20) = -0.8764 and TS Accel = -1.4 are bearish.
Signal compression and decision utility
With 9 bull / 6 bear / 3 neutral, the technical state is not a one-way consensus; it is a lean. In these “lean but not unanimous” regimes, levels tend to matter more than single-indicator flips. The neutral volatility read (BB Width ~0.09288) further supports a framework where the next informational upgrade likely comes from price accepting above 23.4133 or failing below 20.6267, rather than from incremental oscillator drift.
Signal table (Bull/Bear/Neutral)
| Indicator | Value | Signal |
|---|---|---|
| MACD Hist | 0.07388 | Bullish |
| Stoch %K | 80.58 | Bearish |
| TS Mom(20) | -0.2 | Bearish |
| TS Accel | -1.4 | Bearish |
| RSI(14) | 59.34 | Bullish |
| ROC(20) | -0.8764 | Bearish |
| ADOSC | 82.69 | Bullish |
| ChaikinOsc | 6.9e+04 | Bullish |
| OBV slope(10) | 1.931e+05 | Bullish |
| PVT slope(10) | 9228 | Bullish |
| AD Line slope(10) | 3.255e+05 | Bullish |
| Will A/D slope(10) | 0.845 | Bullish |
| BB Width | 0.09288 | Neutral |
| Chaikin Vol | 11.18 | Bearish |
| HHIGH(20) | 23.18 | Neutral |
| LLOW(20) | 21.06 | Neutral |
| MedPx vs Support | 1.913 | Bullish |
| Vol ROC(20) | -40.94 | Bearish |
Interpretation: Indicator-level signals form the base confluence, which is then adjusted using a separate AI-driven technical ranking model. The final technical score summarizes this combined view.
6) News sentiment + extractive gist
Sentiment score (avg): 0.000 | Positive: 14% | Neutral: 71% | Negative: 14%
KGNAI AI News Sentiment Score (normalized -1 to +1): 1.00 (as of 2026-03-26) | Label: Bullish | Overall news score: 0.99
Positive Developments
Recent coverage across major financial outlets indicates a constructive thread centered on earnings-related discussion and short-term market reaction dynamics. In the provided sentiment distribution, positives represent 14% of observed items, which is not dominant but still meaningful given the heavily neutral baseline (71%). The normalized AI news sentiment reading is 1.00 (labelled Bullish), suggesting the model’s extraction is skewing toward supportive language or interpretations during the sampled period (as of 2026-03-26). In context, that constructive tilt can help explain why parts of the technical layer—such as bullish accumulation signals and a bullish MA structure—remain intact even while longer-horizon ranks stay bearish.
Neutral / Mixed Developments
The dominant informational tone is still neutral, with 71% of items categorized as such and an average sentiment score of 0.000. That combination often corresponds to coverage focused on framing, shareholder structure commentary, and retrospective performance discussions rather than incremental new catalysts. For market microstructure, a high neutral share typically maps to lower headline-driven volatility, which aligns with the observed volatility framing (Bollinger bandwidth 0.0929). In practical analytical terms, this kind of news backdrop tends to shift attention back to price/level behavior: whether the market can challenge 23.4133 or protect 20.6267 may carry more immediate information than day-to-day sentiment drift.
Negative / Risk Signals
Negative items also account for 14%, matching the positive share and reinforcing a “balanced but not benign” backdrop. The risk messaging in the provided data clusters around cautionary framing of earnings quality and longer-term performance narratives rather than a single acute event. That matters because it can contribute to persistent relative-rank pressure—consistent with bearish longer-horizon ranks such as #1273 on monthly/3-month/6-month and #1268 yearly—without necessarily forcing immediate technical breakdowns. Where negative tone can become actionable is when it coincides with weakening participation signals; the technical table already flags Vol ROC(20) = -40.94 as bearish, so a renewed negative skew could amplify sensitivity around the 20.6267 support zone.
What to monitor next:
- Whether sentiment distribution remains centered at 0.000 or shifts materially away from the 71% neutral balance.
- Any synchronization between a more negative tone and a failure to hold 20.6267 support.
- Whether improved coverage tone coincides with a credible push through 23.4133 resistance.
Sources referenced: Reuters, Bloomberg, Yahoo Finance, MarketWatch, Investing.com
7) Sources
Not available in the provided data.
You may also like: How KGNAI AI ranks instruments across global markets
Disclaimer: KGNAI provides AI-generated analytics and educational market commentary only. This is not financial advice. Markets involve risk. Always do your own research.