
SANGHVIMOV (Sanghvi Movers Ltd.) — 14-Jun-2026 Technical Confluence, No Directional Commitment
Sanghvi Movers Ltd. (SANGHVIMOV) currently sits in a mixed regime where stronger intermediate ranking strength contrasts with a more neutral near-term and longer-horizon profile. Across a 1220-instrument universe, the monthly rank (#25) and weekly rank (#69) point to upper-quartile positioning, while the daily rank (#440) and yearly rank (#643) reflect a more tempered cross-sectional stance. Technically, the model snapshot leans constructive: price structure is described as bullish versus the MA50, with MA50 above MA200, and the dashboard shows supportive momentum via RSI(14) at 69.98 and a MACD histogram of 0.2963. Volatility context is moderate with Bollinger Bandwidth at 0.1316, while key decision zones are defined at support ~297.8667 and resistance ~388.1500. News sentiment is positive-tilted (0.192) but is based on broader market/sector coverage rather than instrument-specific matches.
- Rank stance: Short Neutral (daily #440); Mid Neutral (3-month #492 / 6-month #394); Long Neutral (yearly #643), with notable strength on weekly #69 and monthly #25.
- Technical confluence label: Bullish (18-signal confluence 0.500; overall technical score 0.627; DRL technical rank #46, score 0.925).
- Key levels: Support ~297.8667 | Resistance ~388.1500.
- News sentiment bias: Positive (avg 0.192; 56% positive / 44% neutral / 0% negative).
- Confirmation / invalidation condition: A break above 388.1500 with volume aligns with continuation framing; a close below 297.8667 raises deterioration risk per the scenario view.
KGNAI evaluates assets using large cross-sectional datasets built from millions of structured data points. Inputs incorporate fundamental metrics, technical structures, and systematically processed news sentiment. Statistical models, machine learning, and AI frameworks are used to assess relative positioning, signal alignment, and probabilistic behavior across broad universes.
- Ranks are comparative across the tracked universe, not absolute price targets.
- Confluence reflects alignment among independent signal groups.
- Support/resistance levels are probabilistic decision zones, not guarantees.
- Sentiment provides contextual bias within the broader analytical framework.
1) KGNAI AI Analysis
Region: INDIA | Total universe size: 1220 ranked instruments
- Daily rank: #440 out of 1220 — Neutral
- Weekly rank: #69 out of 1220 — Bullish
- Monthly rank: #25 out of 1220 — Bullish
- 3-Monthly rank: #492 out of 1220 — Neutral
- 6-Monthly rank: #394 out of 1220 — Neutral
- Yearly rank: #643 out of 1220 — Neutral
The rank stack signals timeframe divergence rather than a unified trend across horizons. SANGHVIMOV’s monthly rank (#25) places it in the top decile of the 1220-instrument universe, and the weekly rank (#69) supports that near-intermediate strength. In contrast, the daily rank (#440) sits closer to the middle of the distribution, implying short-horizon positioning is less decisive and potentially more sensitive to tactical mean reversion.
The longer-range measures are not confirming the monthly/weekly strength. The 3-month rank (#492) and 6-month rank (#394) both read neutral, and the yearly rank (#643) shifts the long-horizon assessment into the lower half of the universe. This combination often appears when an instrument is improving from a weaker prior regime but has not yet established durable cross-sectional leadership across a full market cycle.
KGNAI’s term summary remains Neutral across short-, mid-, and long-term views, which is consistent with the rank dispersion: strong pockets exist (weekly/monthly), but the full stack does not yet present a clean, monotonic improvement pattern. From a portfolio construction perspective, this profile typically warrants tighter verification from price/volume behavior and technical confirmation, particularly around the major decision zones highlighted later (297.8667 support and 388.1500 resistance).
Term view: Short-term: Neutral. Mid-term: Neutral. Long-term: Neutral.
Want the full universe and complete rank tables? Unlock full access on KGNAI: https://www.kgnai.com/pricing
2) Price & trend overview
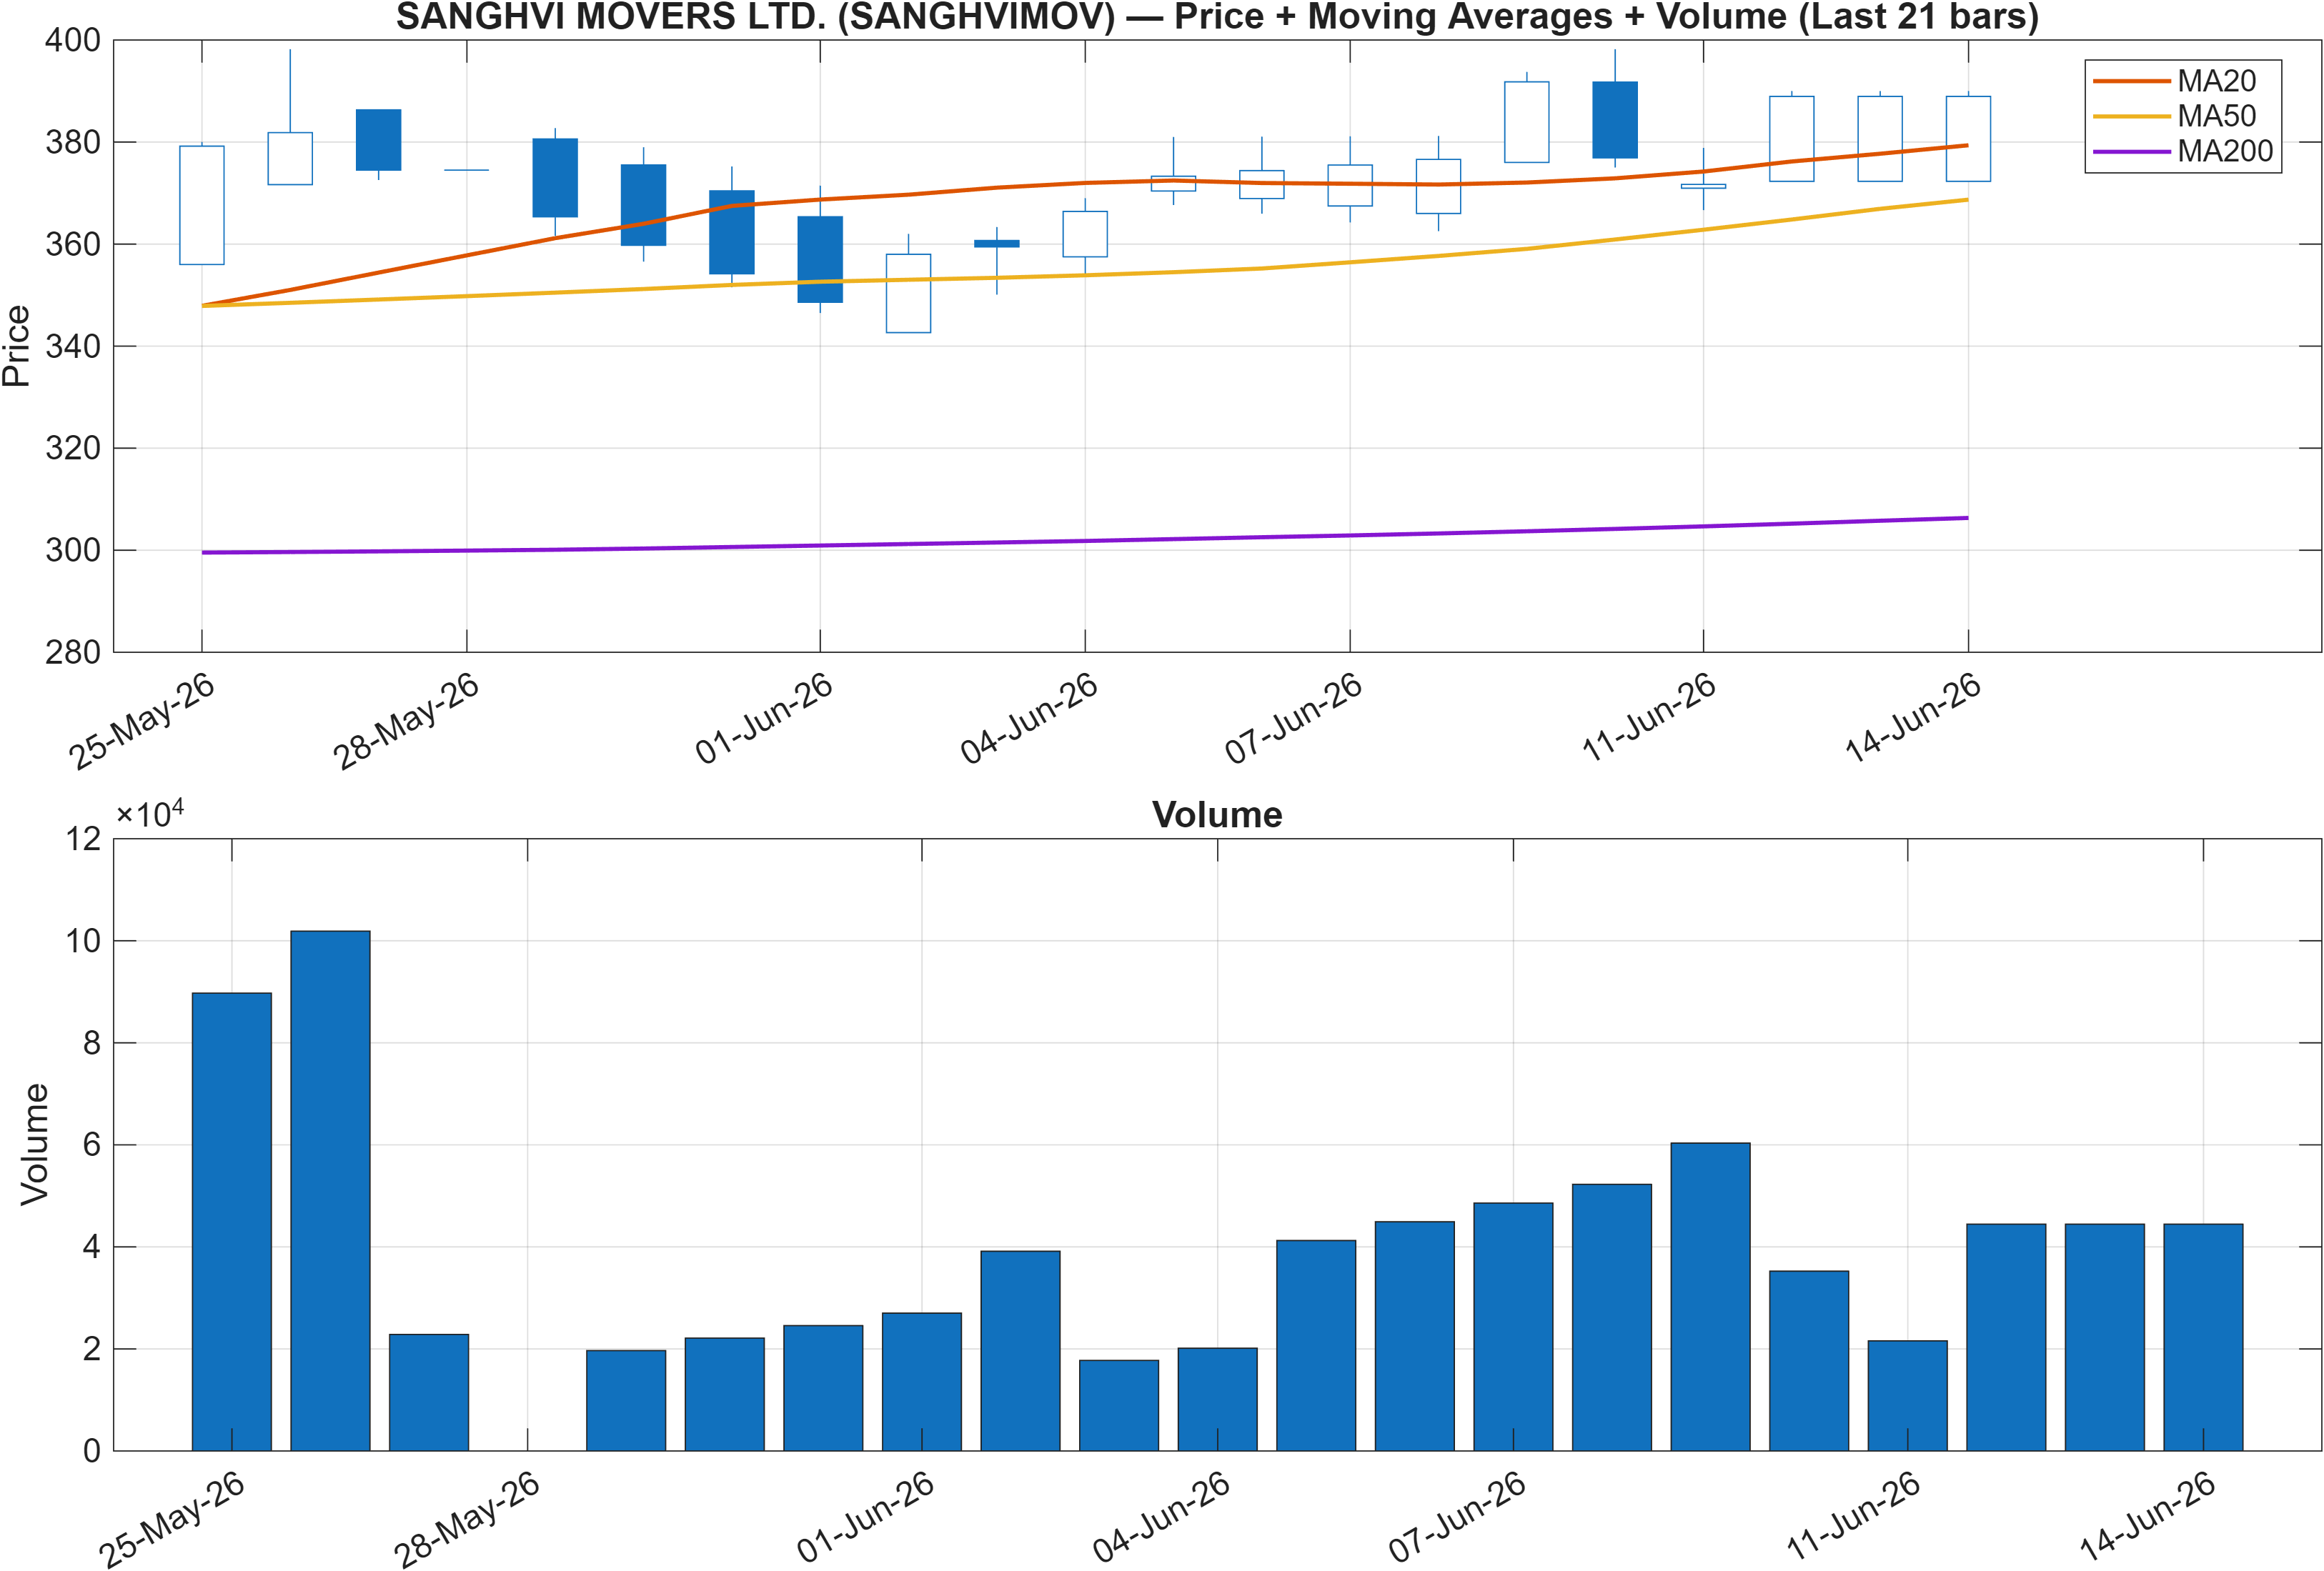
The trend read-through is constructive on the standard moving-average framework: close vs MA50 is Bullish and MA50 vs MA200 is Bullish. That pairing typically indicates the market is sustaining prices above a medium-term trend filter while the medium-term trend remains above the longer-term baseline—an alignment that often supports trend persistence if momentum and participation remain coherent.
However, the broader KGNAI rank stack introduces a constraint: while monthly and weekly ranks are strong (#25 and #69), the daily rank (#440) and yearly rank (#643) do not confirm a clean, single-direction regime. In practice, that mix can correspond to an advancing structure that is still vulnerable to range expansion and pullback cycles, especially as price approaches higher reference zones.
The support/resistance framework adds a practical map for interpreting the moving-average signal. With support ~297.8667 acting as the key downside decision area and resistance ~388.1500 as the primary upside boundary, the trend assessment is most robust when price action respects the support area and successfully works through resistance with credible participation. Absent that, the moving-average bullish read can coexist with a consolidation regime where the market repeatedly tests boundaries without follow-through.
This section therefore reads as trend-positive but commitment-constrained: the moving-average alignment is supportive, yet the rank dispersion argues for treating breakouts and breakdowns as conditional outcomes rather than foregone conclusions.
3) Momentum & volatility dashboard
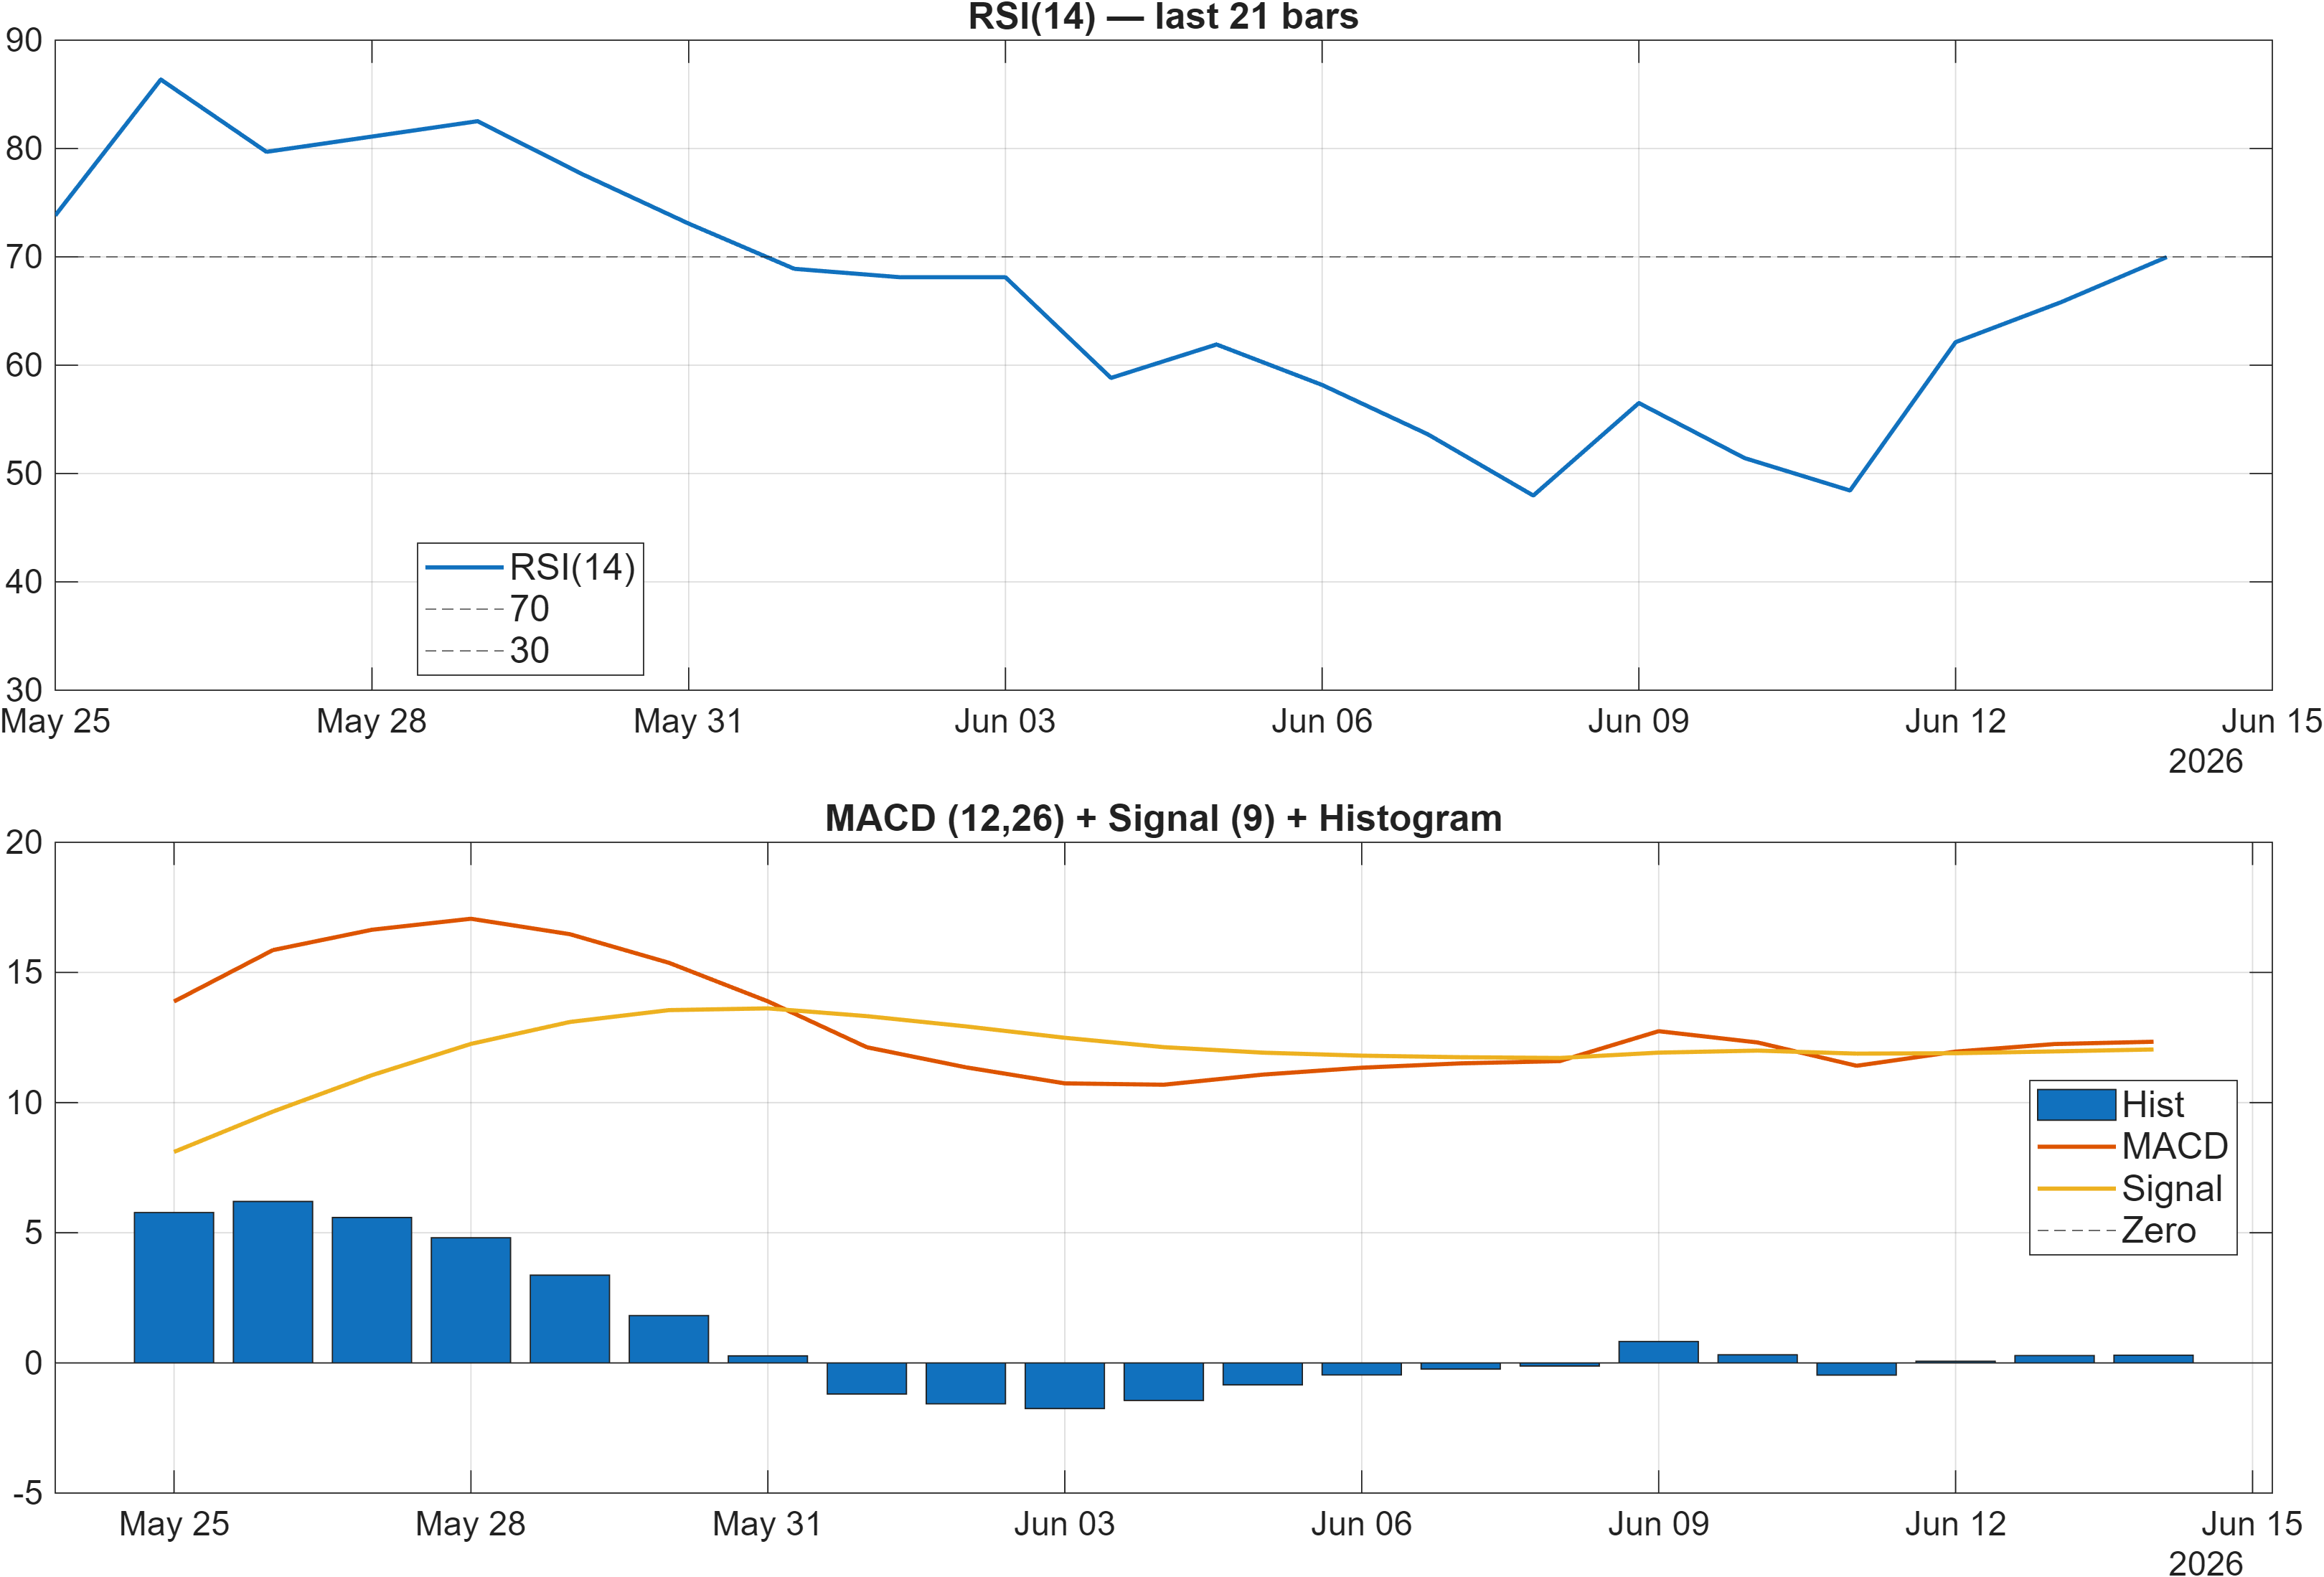
Momentum signals are broadly constructive, but with signs that the market may be closer to trend maturity than early-stage acceleration. The RSI(14) at 69.98 is flagged bullish, and its proximity to the commonly watched 70 region can coincide with strong directional control—yet it also raises the bar for continuation, as incremental gains often require fresh participation rather than just residual momentum.
The MACD histogram at 0.2963 supports positive momentum, indicating the faster trend component remains above the slower component with a favorable spread. When MACD strength persists alongside an elevated RSI, markets can either extend or rotate into a controlled consolidation; distinguishing between the two generally depends on whether pullbacks remain shallow and whether upside attempts occur on improving participation.
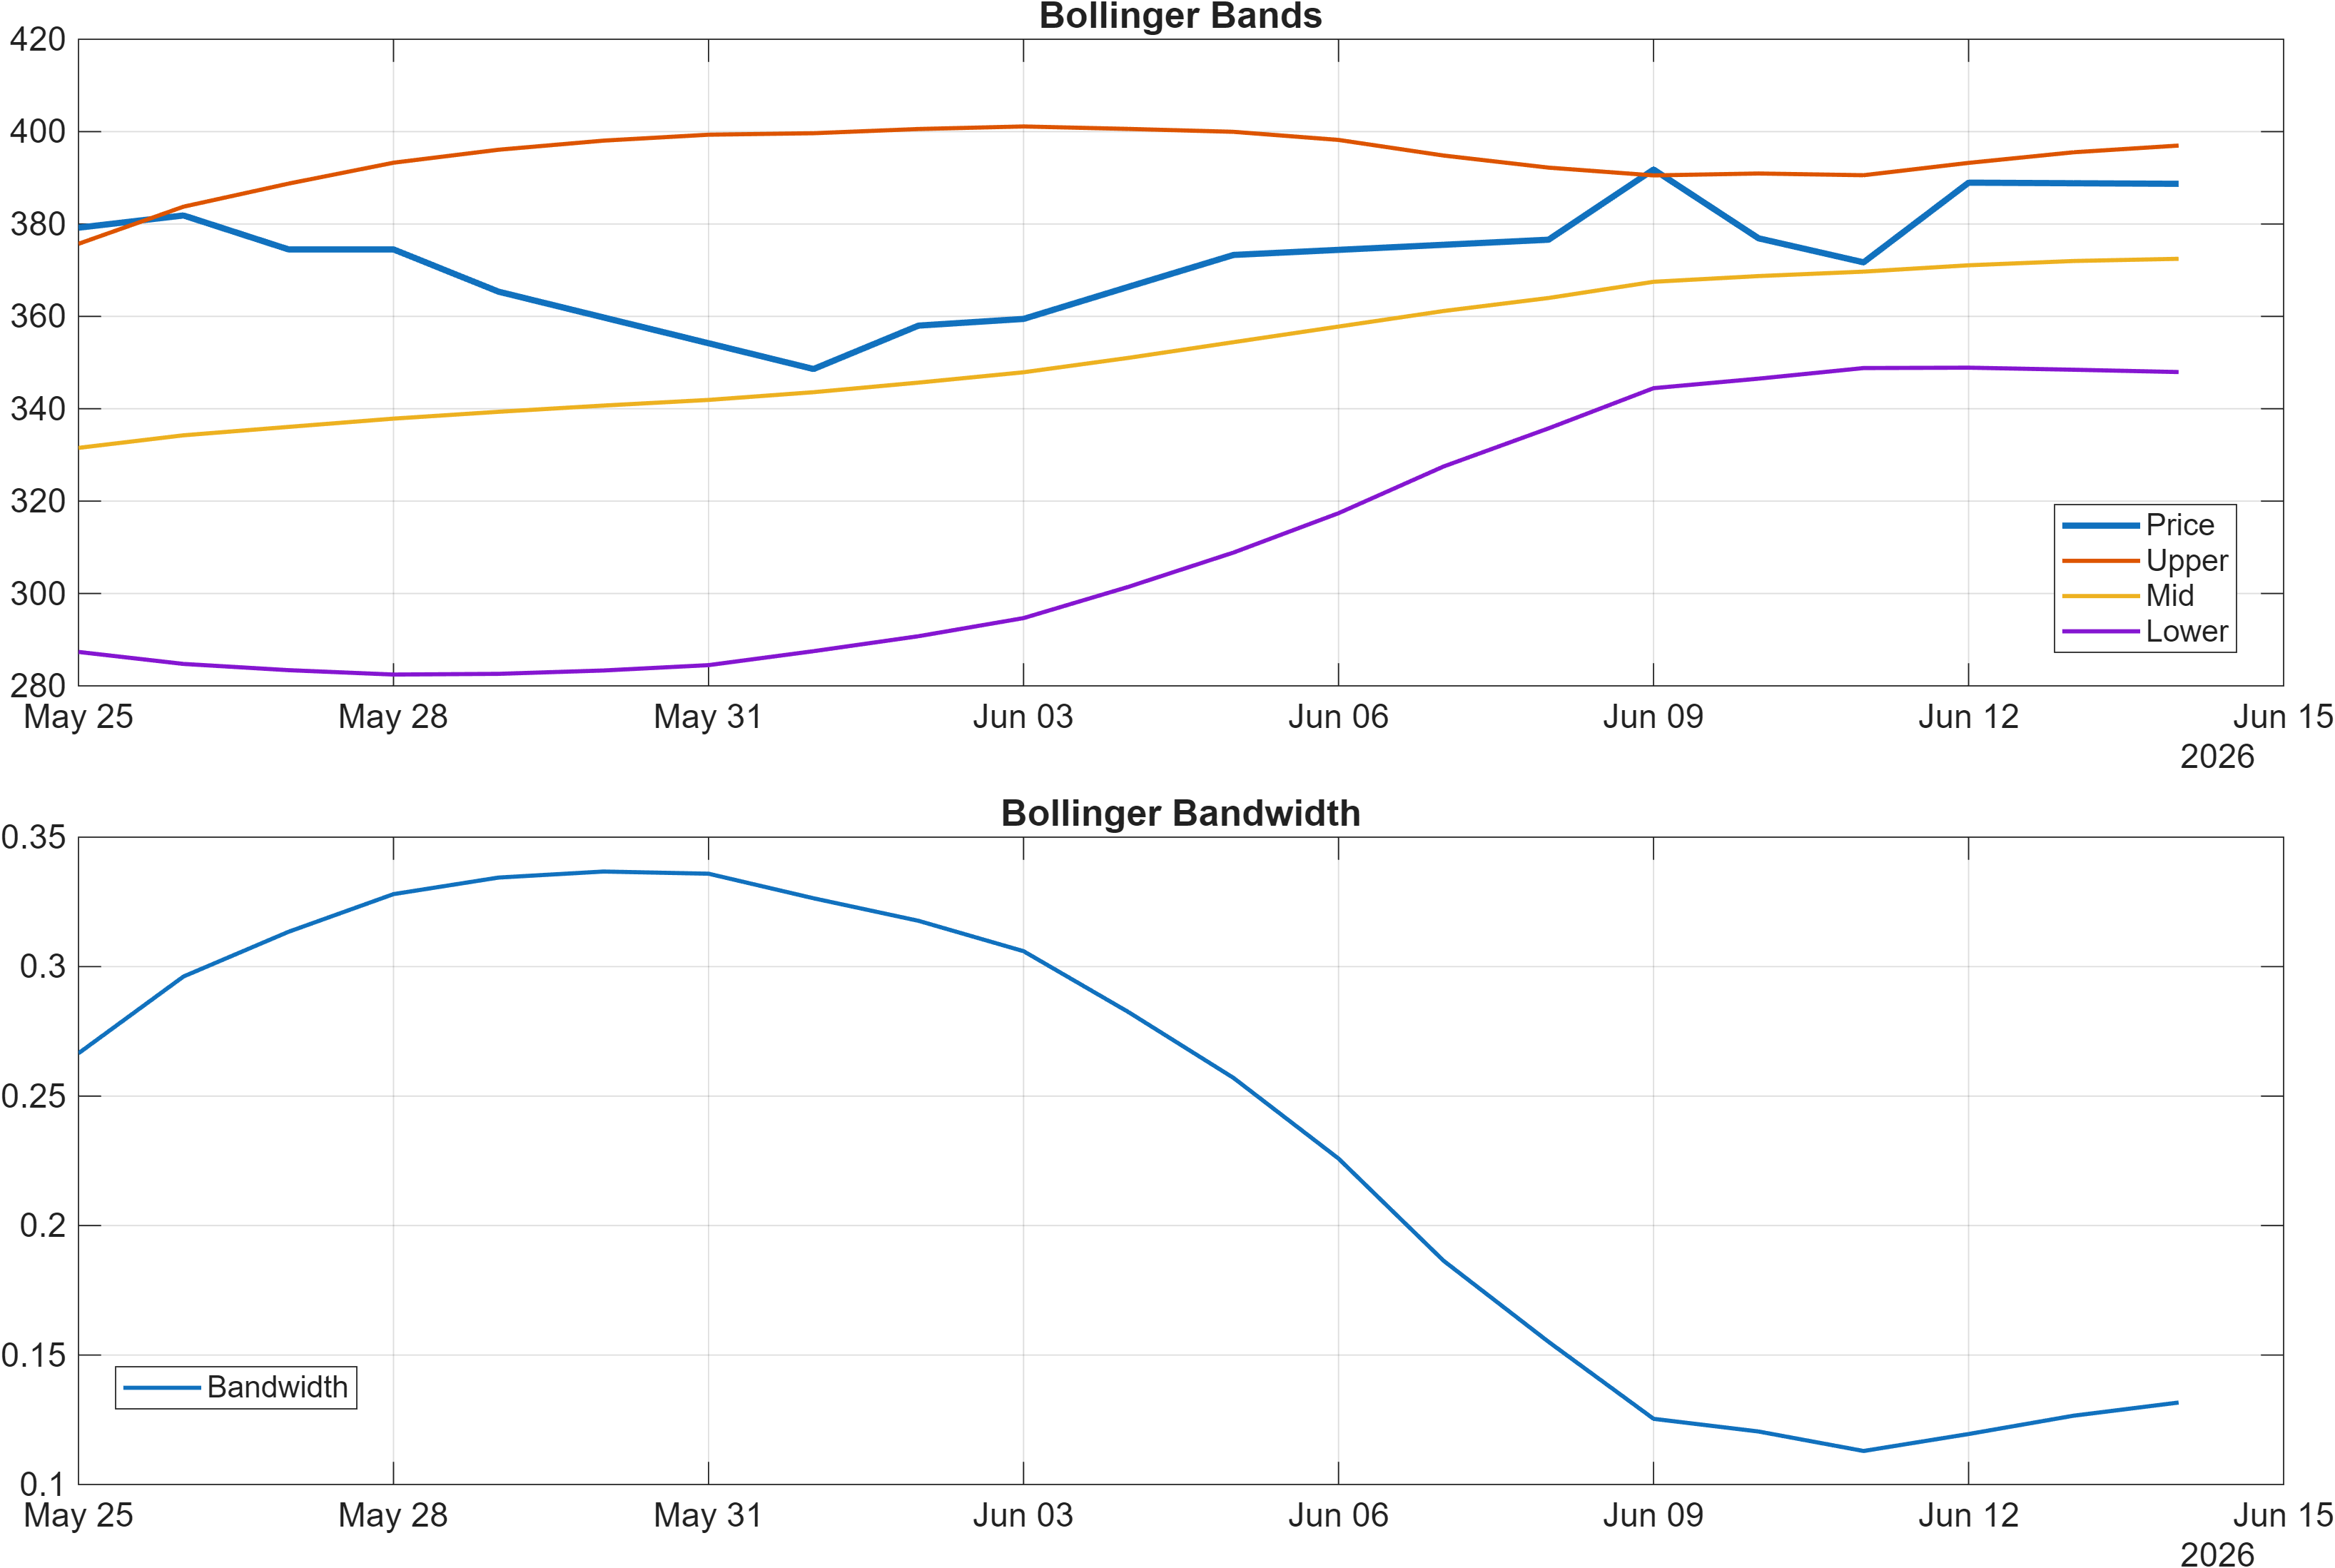
Volatility context is defined by Bollinger Bandwidth at 0.1316, which places emphasis on whether the next move is driven by volatility expansion (bandwidth rising) or a continued grind within the existing envelope. In environments where bandwidth is not aggressively expanding, breakout attempts can be prone to false starts unless they are accompanied by clear follow-through.
Taken together, RSI and MACD lean bullish, while the bandwidth reading frames the move as potentially more controlled than explosive. That blend aligns with the report’s broader stance: constructive technicals, but not yet a fully unambiguous directional commitment when reconciled with the neutral longer-horizon ranks.
4) Support / Resistance zones
Support ~ 297.8667 | Resistance ~ 388.1500
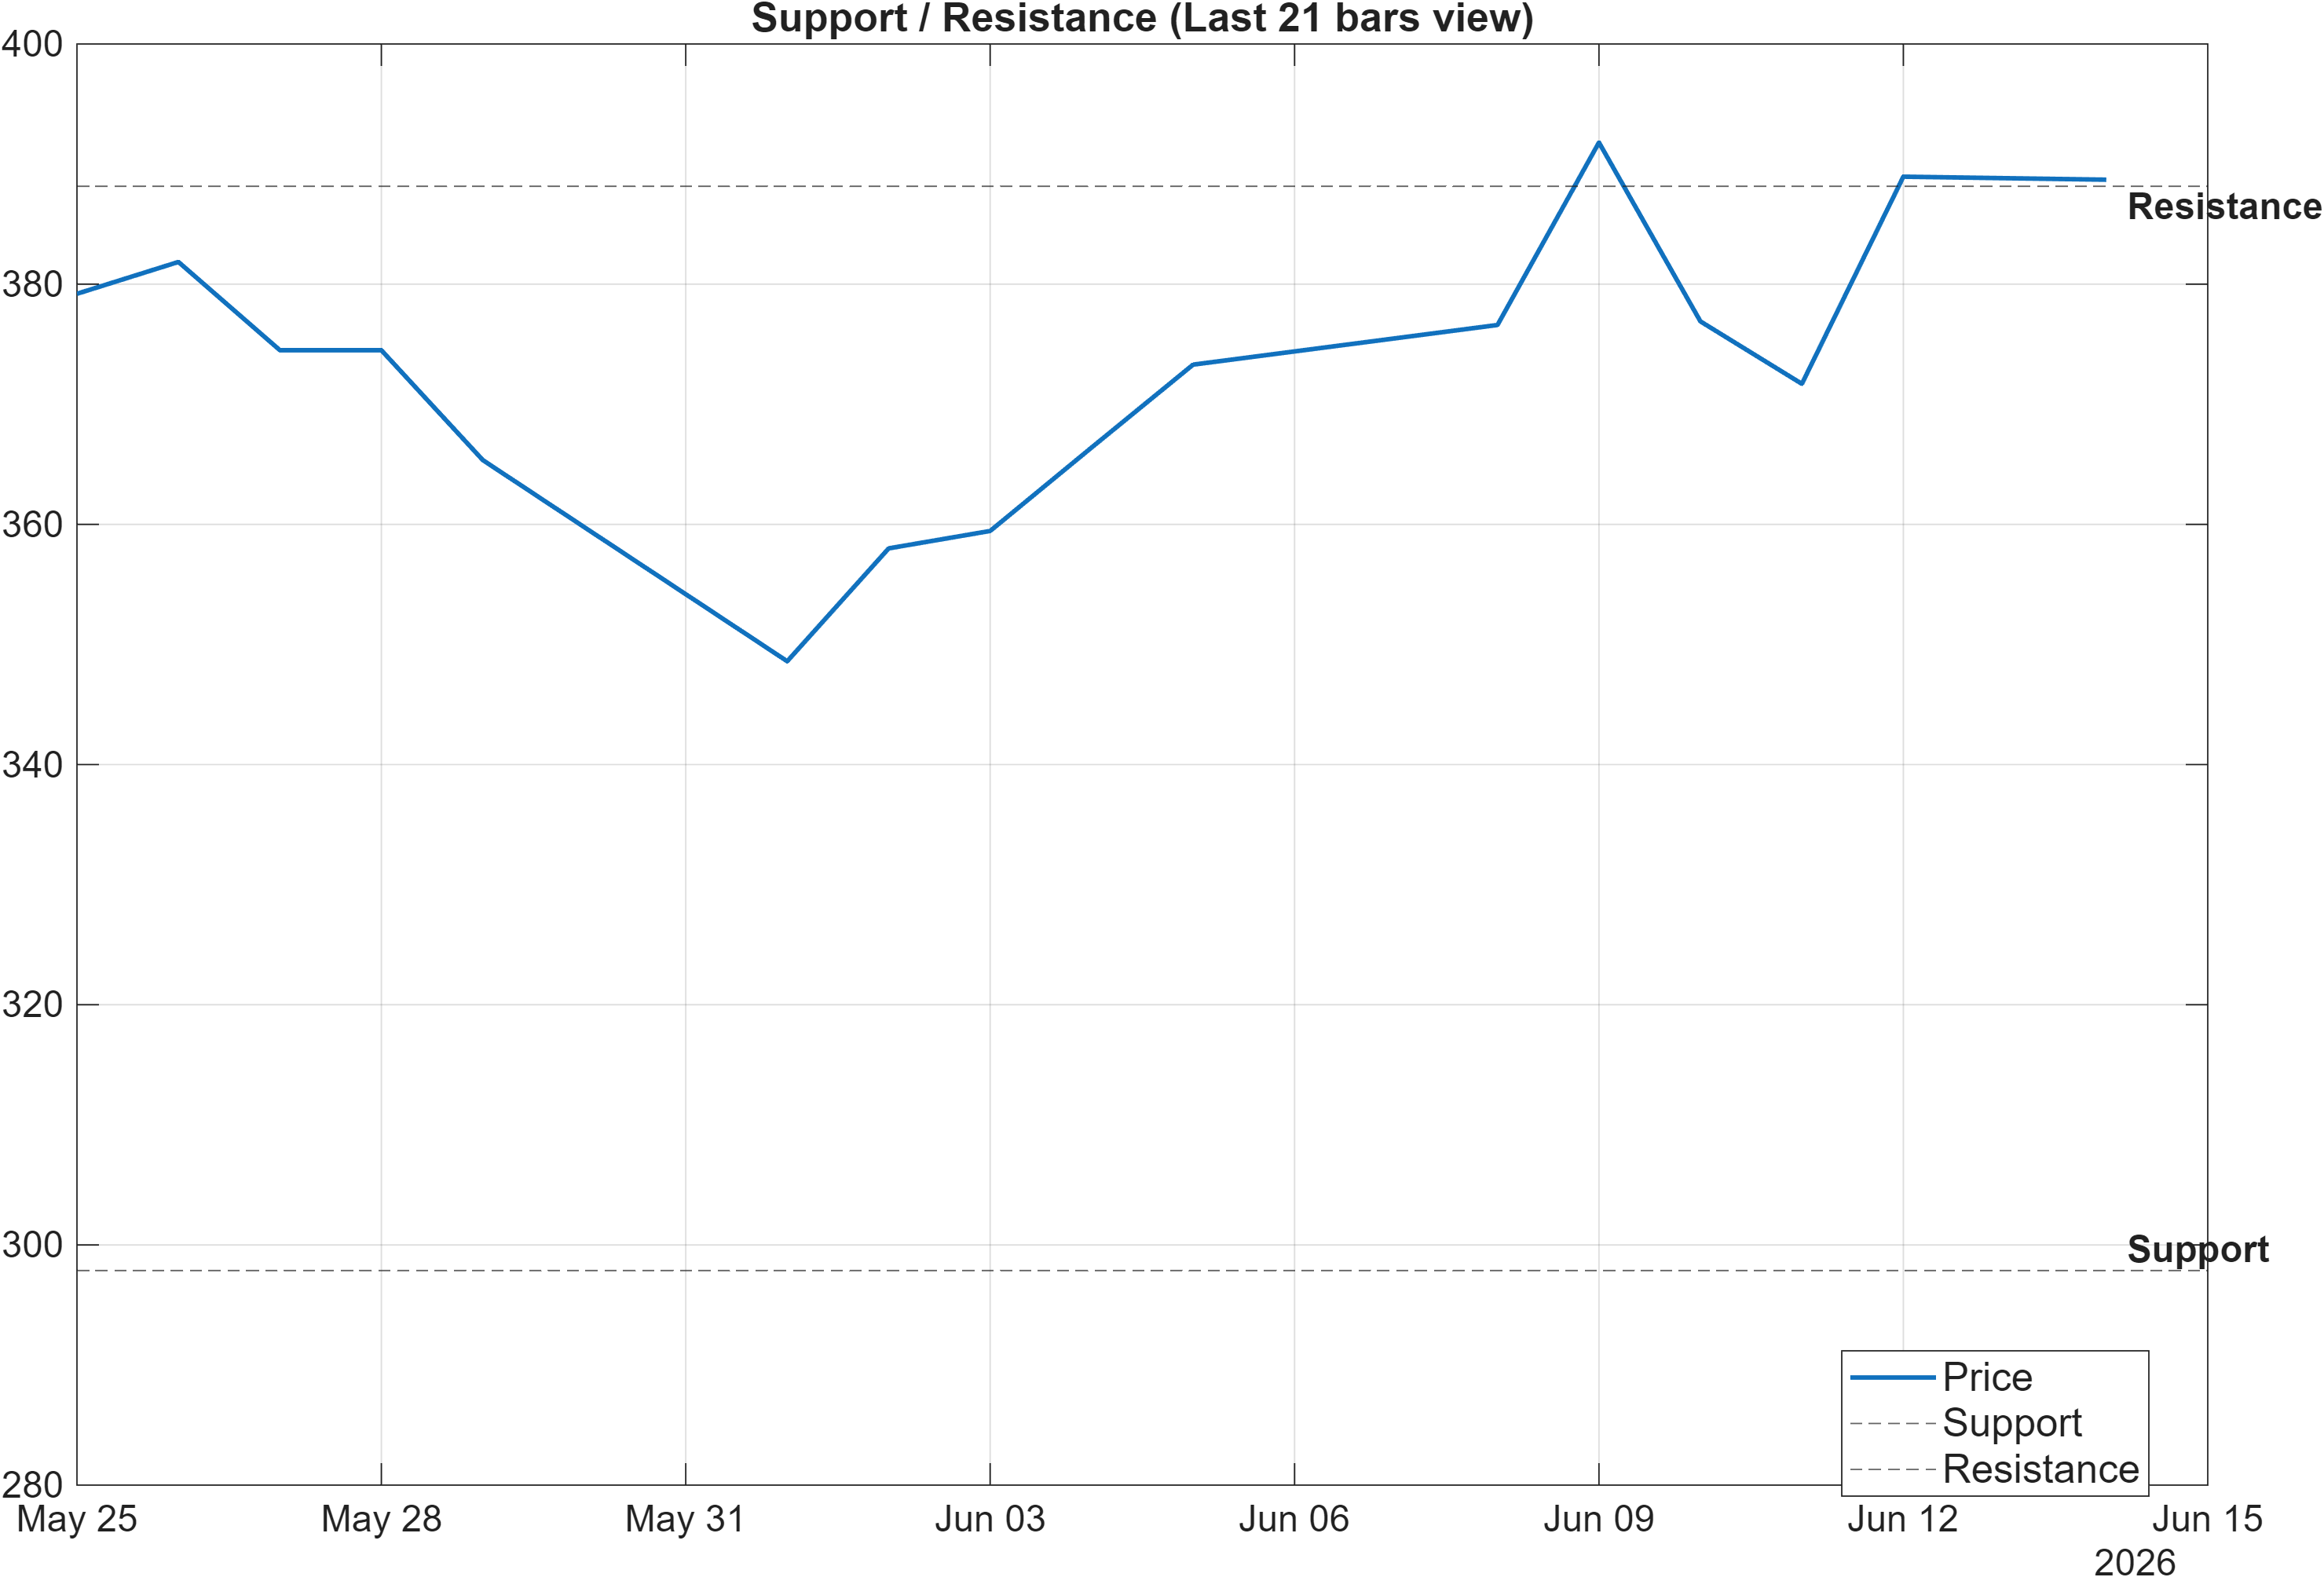
The level structure is cleanly defined, which helps translate the otherwise mixed timeframe picture into actionable decision zones. 297.8667 functions as the principal support reference: sustained acceptance below that area would be consistent with the report’s stated signal deterioration risk. Conversely, 388.1500 is the key resistance boundary where the market must demonstrate persistence to convert constructive signals into a more durable continuation profile.
This mapping is particularly relevant given the weekly (#69) and monthly (#25) ranks are strong, while the broader term view is still neutral. In that context, the resistance area becomes a practical “proof point” for whether cross-sectional strength is translating into a stable price regime. A breakout without credible follow-through can leave the instrument vulnerable to a rotation back toward the middle of its recent range.
From a risk-control perspective, the distance between support and resistance frames the current setup as a range-defined regime until proven otherwise. Trend indicators (MA structure, RSI, MACD) can remain positive while price compresses beneath resistance; the key analytical question is whether market behavior begins to accept higher prices (break/hold above 388.1500) or rejects them and migrates back toward 297.8667.
The report’s scenario logic remains conditional by design: break above resistance with volume supports continuation framing; close below support would undermine the constructive technical read and increase the probability that the neutral longer-horizon ranks reassert.
5) Quant Technical Dashboard (18 Signals)
KGNAI AI Technical Analysis Score (Deep Reinforcement Learning): Rank #46 out of 1220 (Rank 1 represents the strongest technical positioning and a higher probability of favorable price behavior. As ranks increase toward the maximum, the probability of favorable outcomes weakens and bearish positioning becomes more dominant.) | Label: Bullish | Score: 0.925
18-Signal Technical Confluence Score: 0.500 (Bullish)
Overall Technical Score (18-signal confluence + DRL rank blend): 0.627 (Bullish)
Note: The blended score reflects signal strength weighted against broader AI technical ranking, which may temporarily diverge.
Blended technical score breakdown: 0.627 (Bullish | Bull 12 / Bear 3 / Neutral 3)
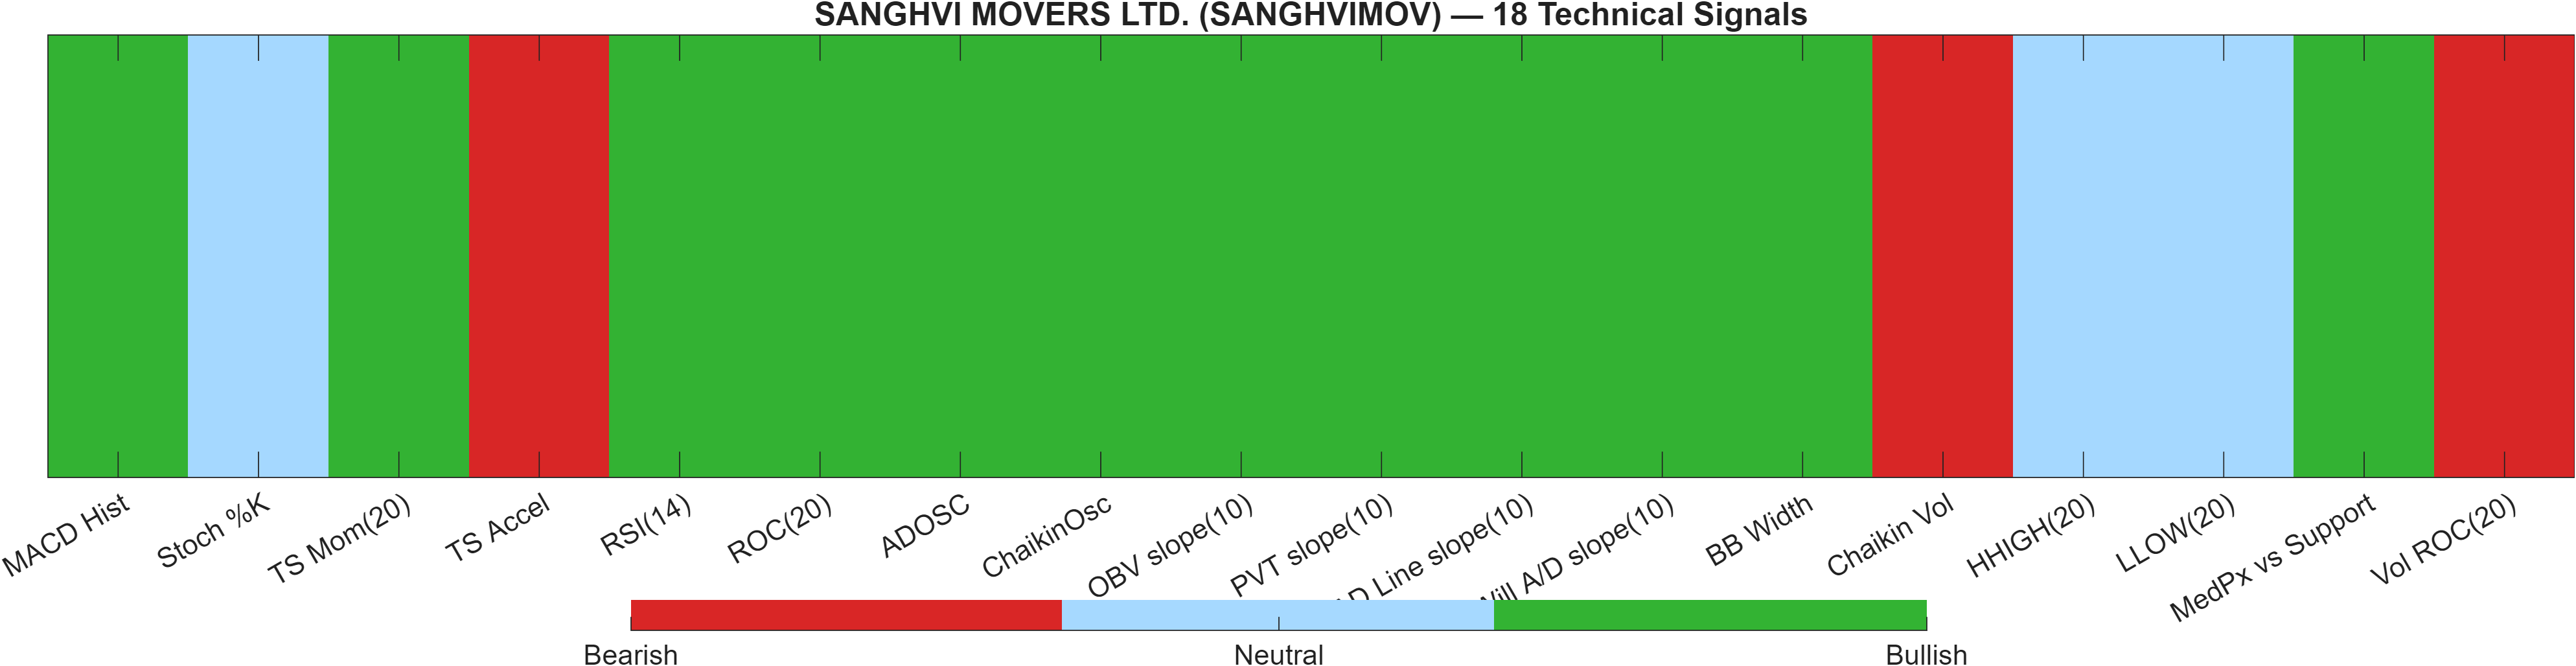
The technical dashboard is internally constructive and, importantly, strong enough to withstand some disagreement at the indicator level. The DRL technical rank (#46 of 1220) is consistent with upper-quartile technical positioning, and the DRL score (0.925) reinforces that the model’s pattern-recognition layer is seeing favorable structure. At the same time, the classic confluence layer is more measured: the 18-signal confluence score is 0.500, which is bullish but not extreme.
The blended outcome (overall technical score 0.627, bullish) is supported by breadth: 12 bullish signals versus 3 bearish and 3 neutral. Rather than treating this as a simple “green light,” the mix is best interpreted as positive alignment with contained friction. For example, the report shows bullish momentum via MACD histogram 0.2963 and elevated strength via RSI(14) 69.98, but it also flags bearish elements such as TS Accel at -36.65 and Vol ROC(20) at -56.37, which can be consistent with slowing incremental thrust or uneven participation.
This is where the technical stack complements the rank dispersion seen earlier: conditions can remain bullish on a blended basis, while still requiring validation around key levels (388.1500 resistance) to reduce the probability of a momentum fade. In other words, the dashboard supports constructive bias, but it does not override the “no directional commitment” stance implied by the broader horizon ranks.
Signal table (Bull/Bear/Neutral)
| Indicator | Value | Signal |
|---|---|---|
| MACD Hist | 0.2963 | Bullish |
| Stoch %K | 74.05 | Neutral |
| TS Mom(20) | 7.1 | Bullish |
| TS Accel | -36.65 | Bearish |
| RSI(14) | 69.98 | Bullish |
| ROC(20) | 1.794 | Bullish |
| ADOSC | 97.03 | Bullish |
| ChaikinOsc | 5.619e+04 | Bullish |
| OBV slope(10) | 2.35e+05 | Bullish |
| PVT slope(10) | 4066 | Bullish |
| AD Line slope(10) | 1.731e+05 | Bullish |
| Will A/D slope(10) | 45.25 | Bullish |
| BB Width | 0.1316 | Bullish |
| Chaikin Vol | 1.862 | Bearish |
| HHIGH(20) | 398.2 | Neutral |
| LLOW(20) | 342.6 | Neutral |
| MedPx vs Support | 83.28 | Bullish |
| Vol ROC(20) | -56.37 | Bearish |
Interpretation: Indicator-level signals form the base confluence, which is then adjusted using a separate AI-driven technical ranking model. The final technical score summarizes this combined view.
6) News sentiment + extractive gist
Note: Instrument-specific news matches were not found, so the digest includes broader market/sector headlines. Links are provided for verification.
Sentiment score (avg): 0.192 | Positive: 56% | Neutral: 44% | Negative: 0%
KGNAI AI News Sentiment Score (normalized -1 to +1): Not available (as of —) | Label: Not available | Overall news score: 0.19
Positive Developments
Recent coverage across major financial outlets indicates a constructive risk tone with a tilt toward stock-selection narratives and broad market optimism. The sentiment mix—56% positive and 0% negative—aligns with a backdrop where investors appear more willing to engage with discretionary ideas and tactical positioning. Importantly, because instrument-specific matches were not found, this positive skew should be treated as context rather than a direct catalyst for SANGHVIMOV. Still, supportive macro-risk appetite can reduce friction for technically constructive setups, particularly when the instrument’s own indicators (e.g., MACD histogram 0.2963 and bullish moving-average alignment) are already leaning favorable. In that sense, the news layer is best viewed as a tailwind to overall market behavior rather than a company-specific driver.
Neutral / Mixed Developments
The neutral share (44%) suggests a meaningful portion of the flow is informational rather than directional, consistent with markets that can oscillate between momentum continuation and consolidation. Broader coverage reflects mixed signals across risk assets—supportive elements that can stabilize sentiment alongside discussions that invite valuation and positioning debate. For SANGHVIMOV, this neutrality matters because the model already highlights rank dispersion (strong weekly/monthly versus neutral longer horizon). In such conditions, neutral news flow often coincides with range-defined trading where technical levels (notably support ~297.8667 and resistance ~388.1500) do more analytical work than narratives.
Negative / Risk Signals
Even with 0% negative in the provided sentiment breakdown, risk signals remain relevant due to the digest’s broader-market focus and the absence of instrument-specific items. Coverage that touches on speculative excess, regulatory scrutiny, or compliance burdens in other risk segments can still tighten overall liquidity conditions, which may surface as lower-quality breakouts or faster reversals in individual equities. This interacts with the technical picture: with RSI(14) at 69.98 and a key resistance zone at 388.1500, the market may be more sensitive to any incremental deterioration in risk appetite. In that setting, downside violations—particularly a close below 297.8667—become more meaningful as confirmation that risk conditions are feeding through to price behavior.
- Whether broader risk sentiment remains supportive enough for price to challenge 388.1500 with follow-through.
- Any shift in tone that coincides with volatility expansion beyond BB Width 0.1316.
- Whether news flow remains generalized (sector/macro) or becomes instrument-specific (currently: Not available in the provided data.)
Sources referenced: Reuters, Bloomberg, Yahoo Finance, MarketWatch, Investing.com
Snapshot: AI Rank (Short–Mid–Long): Neutral (Neutral–Neutral–Neutral) · Technical Confluence: Bullish · Key Levels: Support ~297.87 | Resistance ~388.15 · News Sentiment: Positive
7) Sources
- CLSA set to vanish as brand after 40 years in Asian brokerage: Report — https://economictimes.indiatimes.com/markets/stocks/news/clsa-set-to-vanish-as-brand-after-40-years-in-asian-brokerage-report/articleshow/131702491.cms
- F&O Talk: Bullish Nifty charts; Sudeep Shah picks 7 stocks, outlines HDFC Bank, Sterlite Tech strategy — https://economictimes.indiatimes.com/markets/expert-view/fo-talk-bullish-nifty-charts-sudeep-shah-picks-7-stocks-outlines-hdfc-bank-sterlite-tech-strategy/articleshow/131700445.cms
- Ashish Kacholia's picks: 12 stocks rally up to 130% in CY26, 3 turned multibaggers; 2 new Q4 bets — https://economictimes.indiatimes.com/markets/stocks/news/ashish-kacholias-picks-12-stocks-rally-up-to-130-in-cy26-3-turned-multibaggers-2-new-q4-bets/slideshow/131700249.cms
- Concurrent Gainers: 11 stocks gain for 5 straight sessions, rally up to 20% — https://economictimes.indiatimes.com/markets/stocks/news/concurrent-gainers-11-stocks-gain-for-5-straight-sessions-rally-up-to-20/slideshow/131699943.cms
- Bitcoin holds near $64,000 as falling oil prices and US-Iran peace hopes lift risk sentiment — https://economictimes.indiatimes.com/markets/cryptocurrency/crypto-news/bitcoin-holds-near-64000-as-falling-oil-prices-and-us-iran-peace-hopes-lift-risk-sentiment/articleshow/131699535.cms
- Uday Kotak questions SpaceX valuation, says only time will tell if we're in ‘mega bubble' — https://economictimes.indiatimes.com/markets/stocks/news/uday-kotak-questions-spacex-valuation-says-only-time-will-tell-if-were-in-mega-bubble/articleshow/131699475.cms
- What crypto investors need to know for tax season 2026 — https://economictimes.indiatimes.com/markets/cryptocurrency/crypto-news/what-crypto-investors-need-to-know-for-tax-season-2026/articleshow/131699289.cms
- FCNR(B): Revisiting a proven crisis management tool — https://economictimes.indiatimes.com/markets/stocks/news/fcnrb-revisiting-a-proven-crisis-management-tool/articleshow/131699247.cms
You may also like: How KGNAI AI ranks instruments across global markets
Disclaimer: KGNAI provides AI-generated analytics and educational market commentary only. This is not financial advice. Markets involve risk. Always do your own research.