SGD/ARS (SGDARS) Technical Outlook — 14-Jun-2026 | Bullish Rank Structure With Neutral Signal Confluence
SGD/ARS (SGDARS) enters 14-Jun-2026 with a decisively constructive cross-horizon rank profile inside KGNAI’s 967-instrument FX universe, while the nearer-term technical stack reads more mixed/neutral. Weekly, monthly, and multi-month ranks sit at the very top of the distribution, consistent with a regime that has remained relatively supported across timeframes. At the same time, the indicator dashboard shows momentum leadership that is not uniformly confirmed: RSI is constructive at 58.1, yet MACD histogram remains negative at -0.6740, a combination that often reflects continuation risk if follow-through weakens. Volatility conditions also remain contained, with Bollinger bandwidth at 0.0269, implying that breakouts—if they occur—may be more level-driven around the defined decision zones. The primary map for validation remains the support/resistance framework at 1078.6755 and 1118.8521, respectively, with news sentiment broadly neutral and low-friction in tone.
- Short / Mid / Long rank stance: Bullish (daily #34; weekly #4; monthly #1; 3-month #2; 6-month #6; yearly #28 out of 967).
- Technical confluence label: Neutral (18-signal confluence 0.167; blended overall technical score -0.031).
- Key levels: Support 1078.6755 | Resistance 1118.8521.
- News sentiment bias: Neutral (avg 0.050; 19% positive, 81% neutral, 0% negative).
- Confirmation / invalidation condition: A break above 1118.8521 with volume supports continuation; a close below 1078.6755 elevates deterioration risk.
KGNAI evaluates assets using large cross-sectional datasets built from millions of structured data points. Inputs incorporate fundamental metrics, technical structures, and systematically processed news sentiment. Statistical models, machine learning, and AI frameworks are used to assess relative positioning, signal alignment, and probabilistic behavior across broad universes.
- Ranks are comparative across the tracked universe, not absolute price targets.
- Confluence reflects alignment among independent signal groups.
- Support/resistance levels are probabilistic decision zones, not guarantees.
- Sentiment provides contextual bias within the broader analytical framework.
1) KGNAI AI Analysis
Region: FOREX
Total universe size: 967 ranked instruments
- Daily rank: #34 out of 967 — Bullish
- Weekly rank: #4 out of 967 — Bullish
- Monthly rank: #1 out of 967 — Bullish
- 3-Monthly rank: #2 out of 967 — Bullish
- 6-Monthly rank: #6 out of 967 — Bullish
- Yearly rank: #28 out of 967 — Bullish
The defining feature of SGDARS in this dataset is the timeframe consistency. Monthly rank at #1 and 3-month at #2 place the pair at the very top of the universe, while weekly at #4 signals that the strongest relative behavior is not confined to a single lookback. This type of stack typically points to persistent statistical leadership rather than a one-off burst.
The daily rank at #34 is still firmly in the upper slice of the 967-instrument universe, but it is less extreme than the weekly/monthly readings. That shape matters: it can be interpreted as short-horizon digestion occurring within a broader bullish regime. When the shortest horizon is merely “good” while the intermediate horizons are “elite,” the tactical question becomes whether the market is consolidating to re-accelerate or gradually losing marginal momentum.
In KGNAI’s framework, the stated term view remains Bullish across short-, mid-, and long-term. From a regime perspective, this aligns with the idea that the instrument’s relative position has remained favorable even as some technical sub-signals (covered later) register neutral/bearish pockets. The analytical takeaway is that rank leadership is present, but it should be cross-checked against the level map and momentum confirmation to avoid over-reliance on any single lens.
2) Price & trend overview
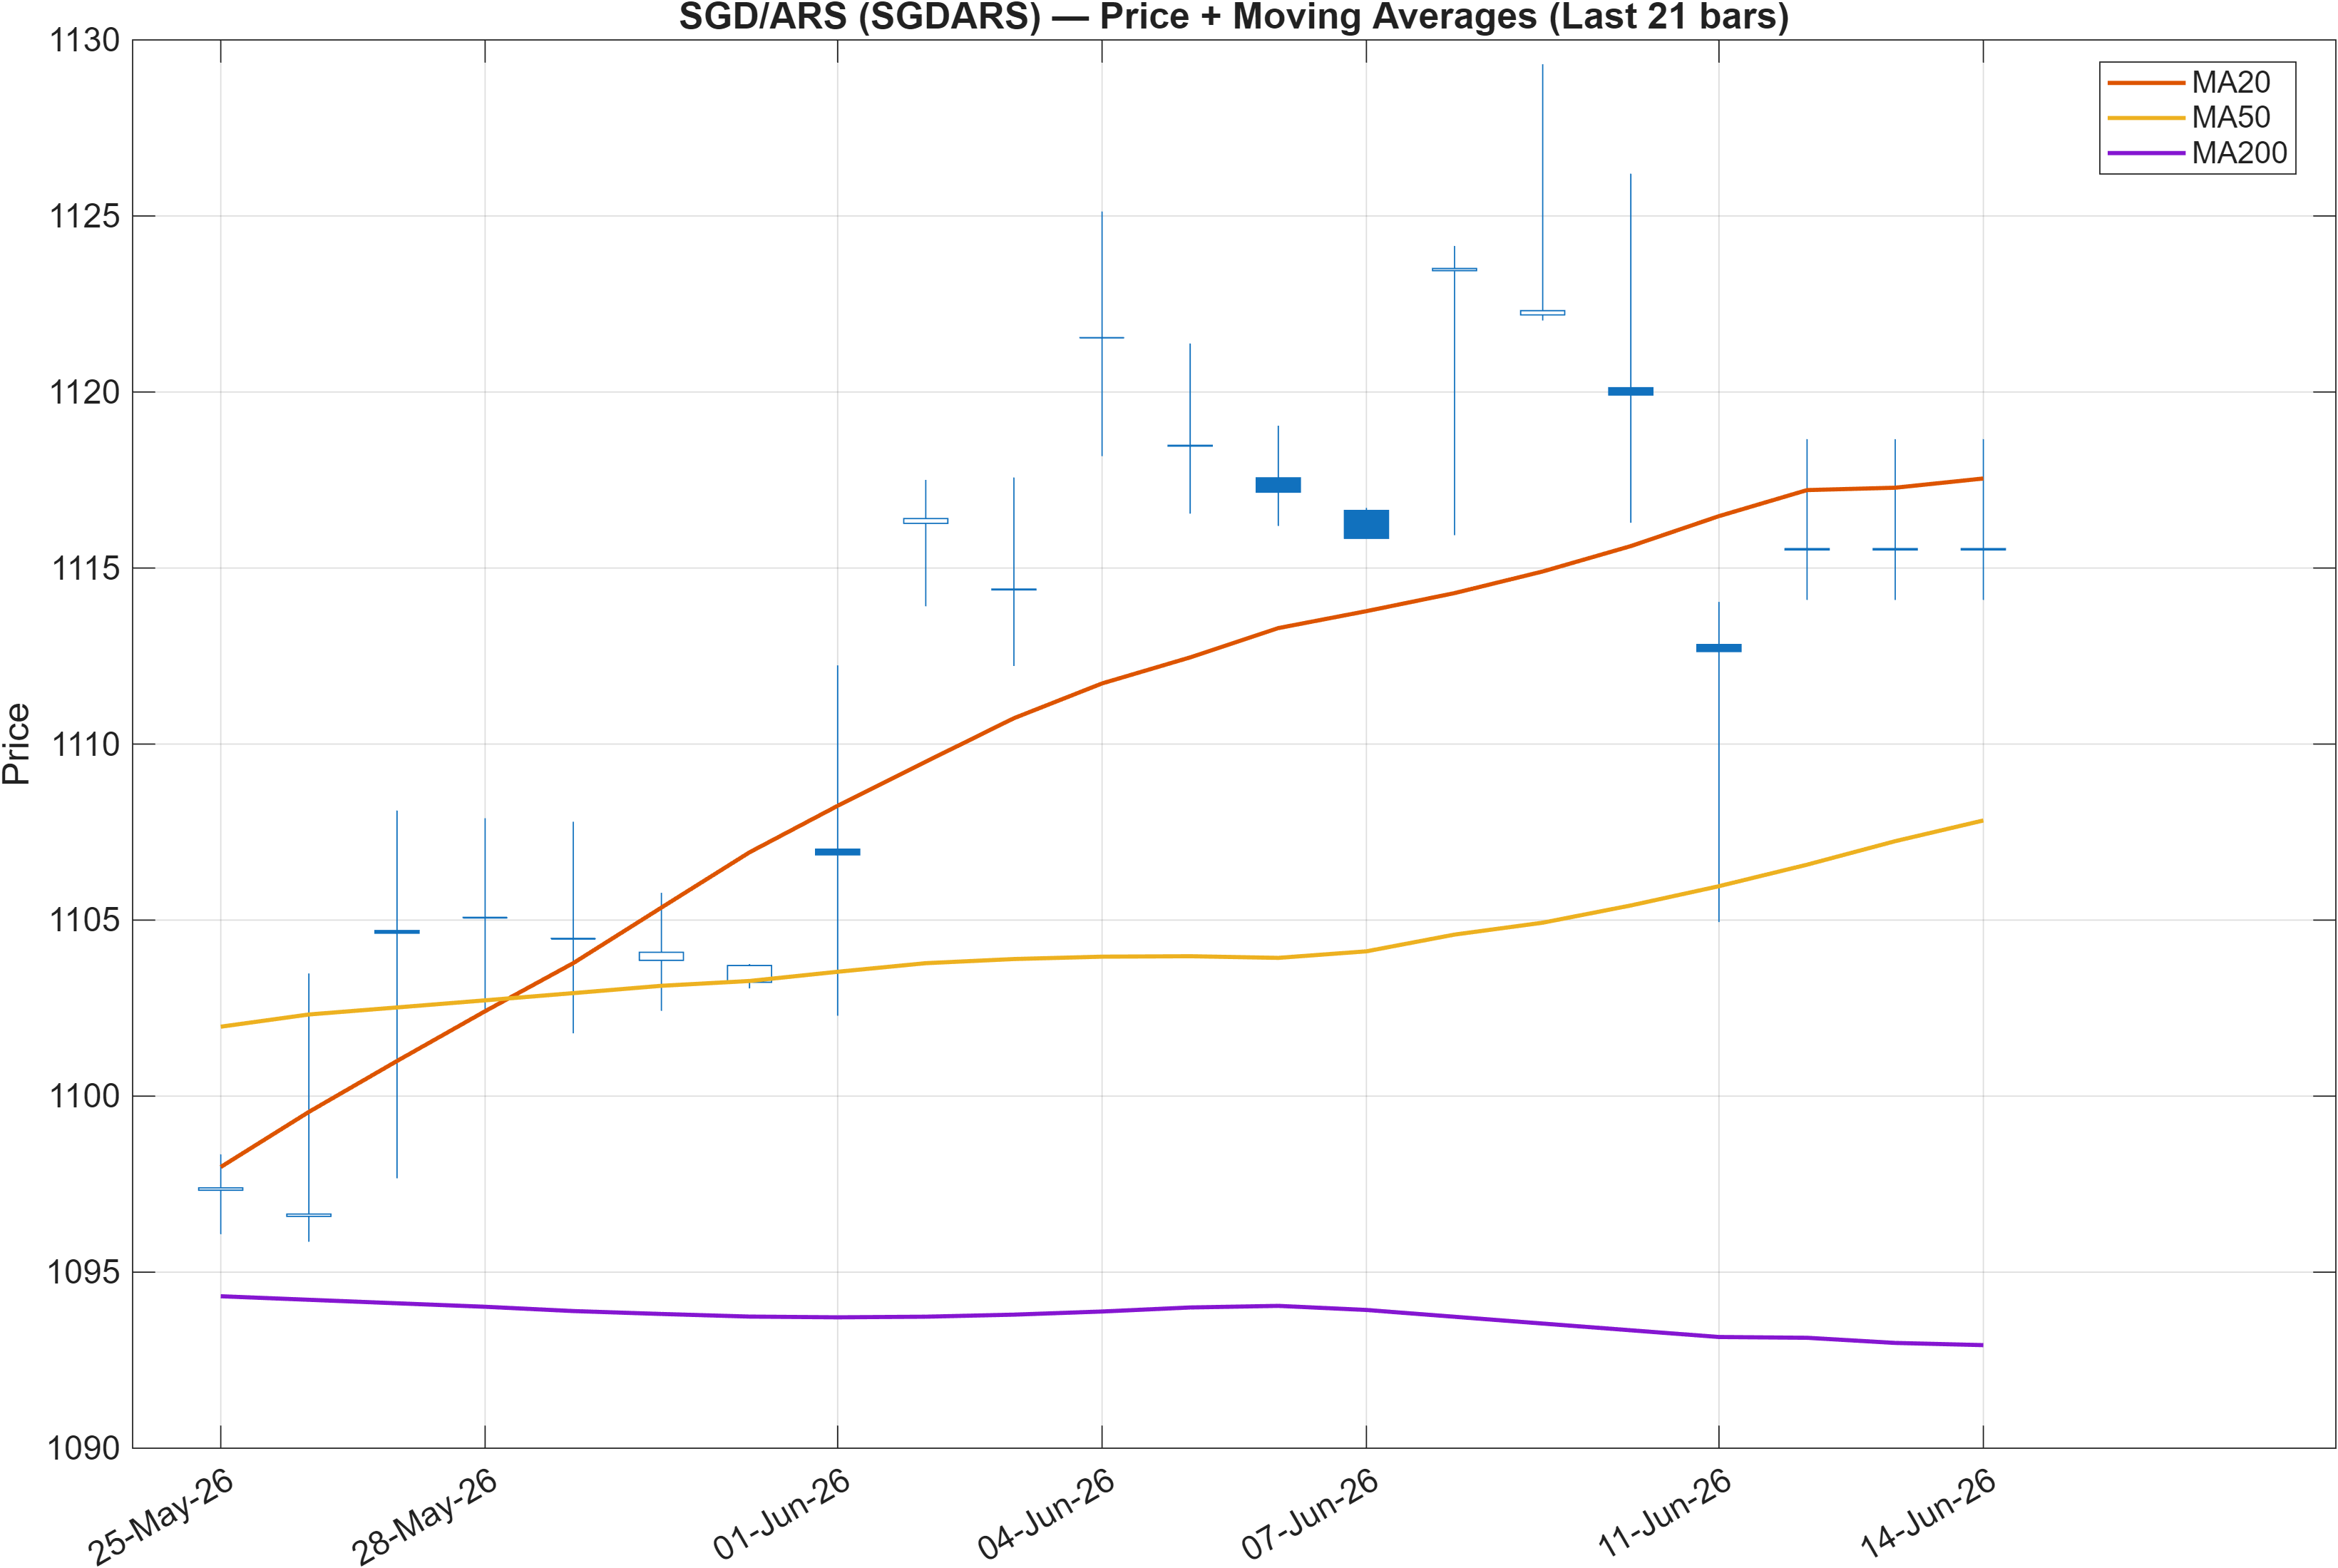
Interpretation: Close vs MA50 = Bullish, MA50 vs MA200 = Bullish.
The trend layer presents a clean baseline: price is above the MA50, and the MA50 is above the MA200. This dual confirmation generally characterizes an environment where pullbacks are more often treated as mean-reversion within trend rather than immediate reversal signals. In rank terms, that fits the broader leadership implied by weekly (#4) and monthly (#1) positioning.
Still, trend confirmation does not guarantee smooth continuation. When intermediate ranks are very strong but the blended technical score later shows -0.031 (Neutral), it often indicates that trend structure is intact while shorter-cycle indicators are uneven. Practically, this makes the market more susceptible to range expansion around known levels rather than steady directional drift.
The practical anchor for trend risk management is the support/resistance framework in Section 4—specifically 1078.6755 as the key support reference and 1118.8521 as the proximate resistance barrier. With the trend filter bullish, these levels become less about calling a top and more about determining whether the prevailing structure is being respected. A failure to hold key support would be more meaningful here because it would contradict a trend regime that the moving averages currently endorse.
3) Momentum & volatility dashboard
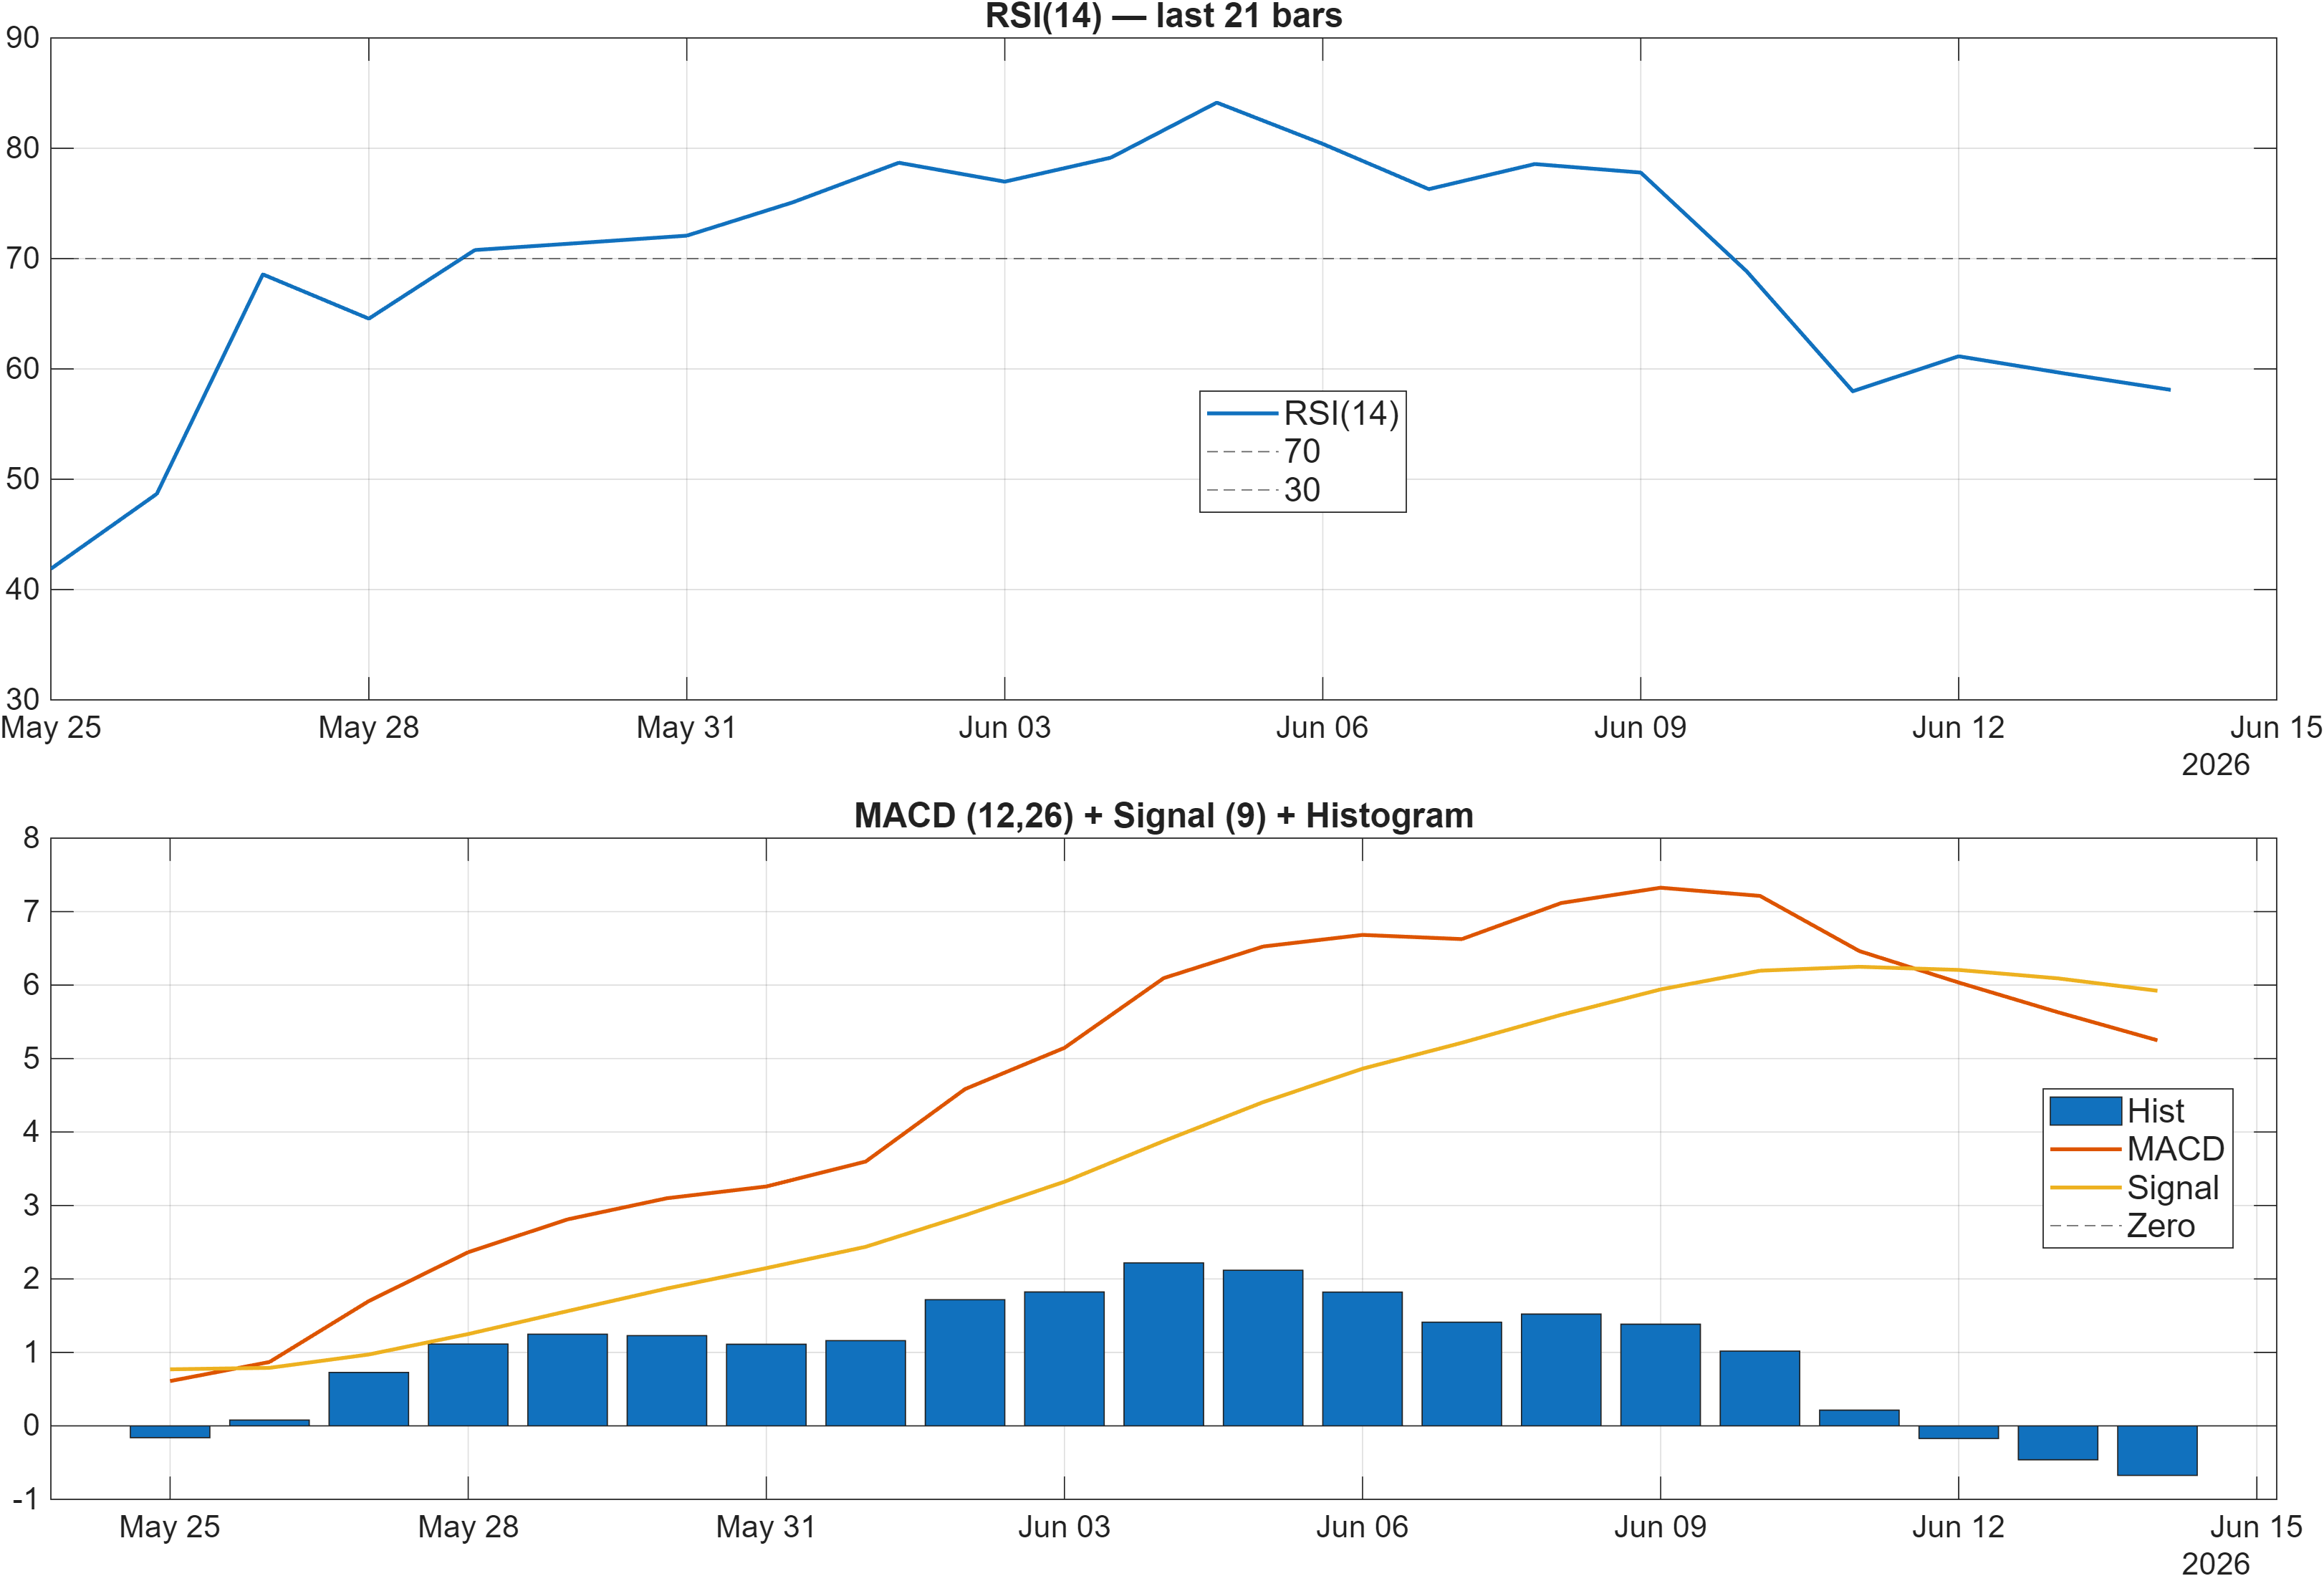
Interpretation: RSI bias = Neutral, MACD hist = -0.6740.
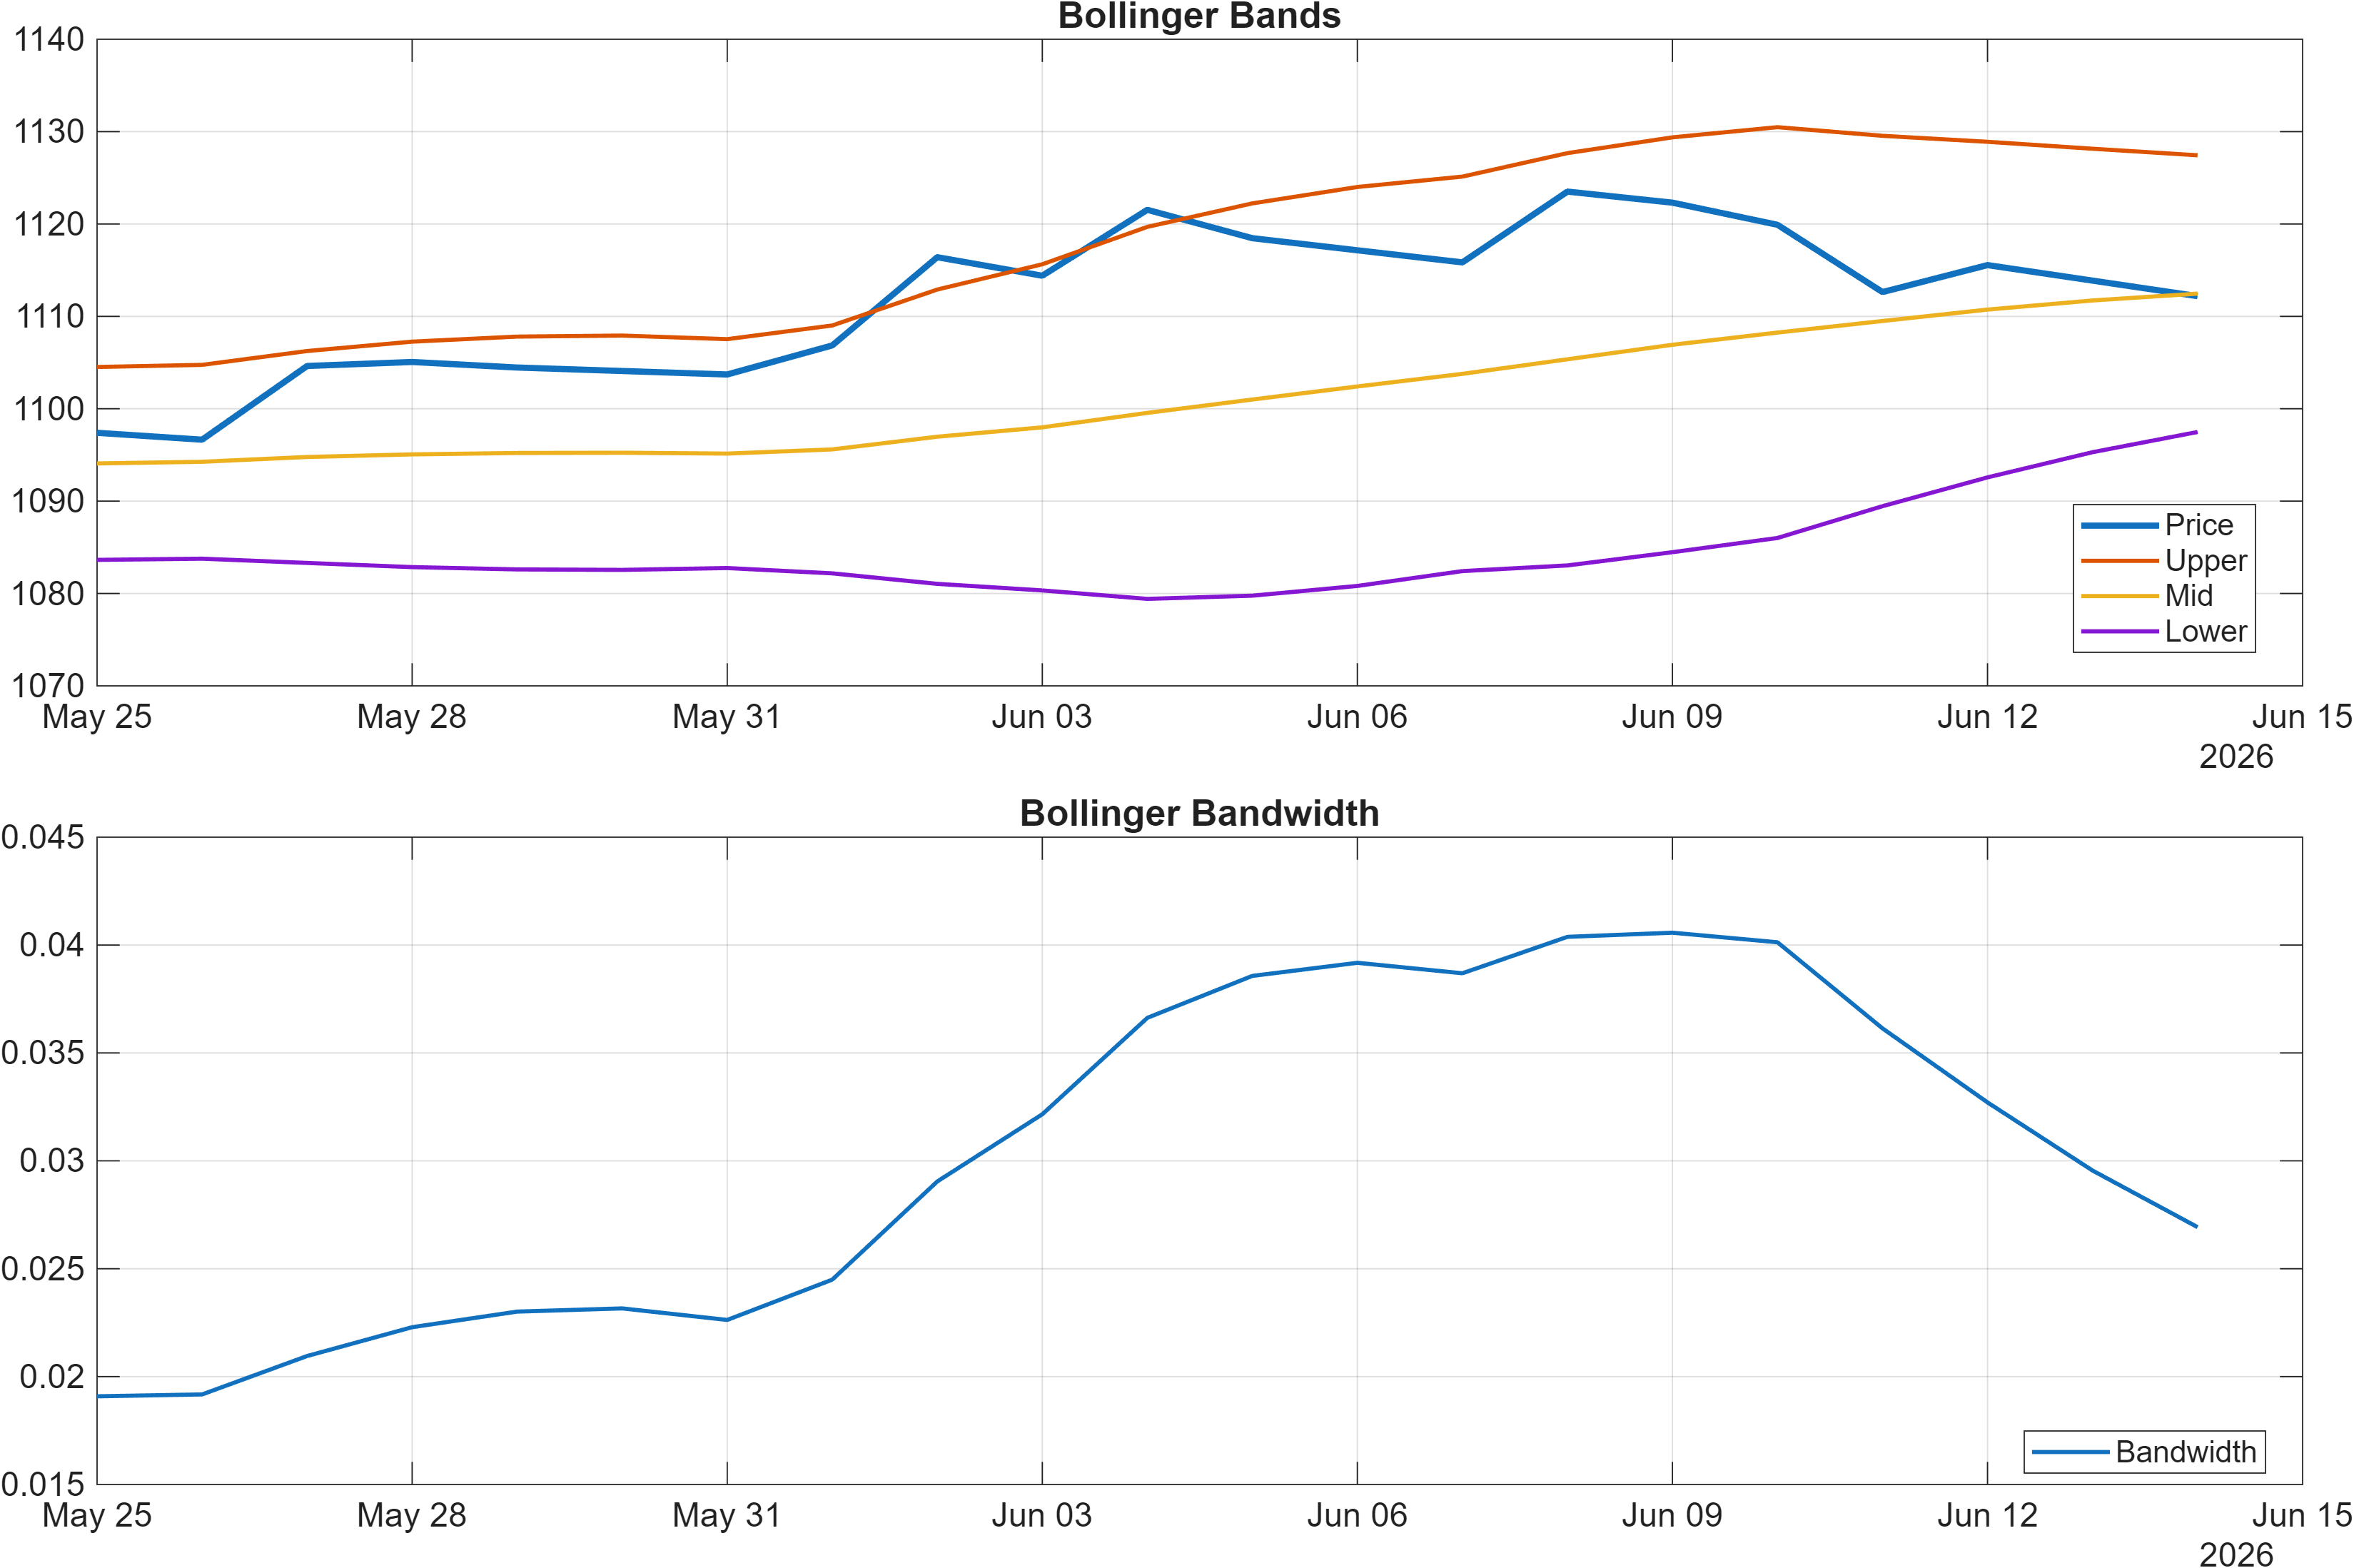
Interpretation: Bandwidth (volatility regime) latest = 0.0269.
The momentum picture is defined by divergent confirmation. RSI(14) is shown as constructive elsewhere at 58.1 (Bullish in the signal table), yet the dashboard flags the RSI bias as Neutral, while MACD histogram remains negative at -0.6740. That combination commonly reflects a market that is holding its trend posture but lacks broad-based impulse confirmation—i.e., strength that is present but not accelerating uniformly.
Volatility conditions add context. Bollinger bandwidth at 0.0269 indicates a tightened volatility regime relative to typical expansion phases. In compressed regimes, markets can oscillate with fewer directional clues until a catalyst or level break triggers range expansion. In other words, the probability of level-driven moves rises, which places additional importance on the resistance at 1118.8521 and support at 1078.6755.
From a signal-behavior perspective, the presence of bullish momentum components (e.g., ROC(20) at 1.417 and TS Mom(20) at 18.9 in the broader dashboard) alongside a negative MACD histogram suggests a market that may be experiencing late-stage impulse cooling rather than outright reversal. Confirmation would typically show up as improving MACD histogram behavior and a volatility expansion that follows through beyond the defined resistance zone, rather than repeated rejections within the current bandwidth constraint.
4) Support / Resistance zones
Support ~ 1078.6755 | Resistance ~ 1118.8521
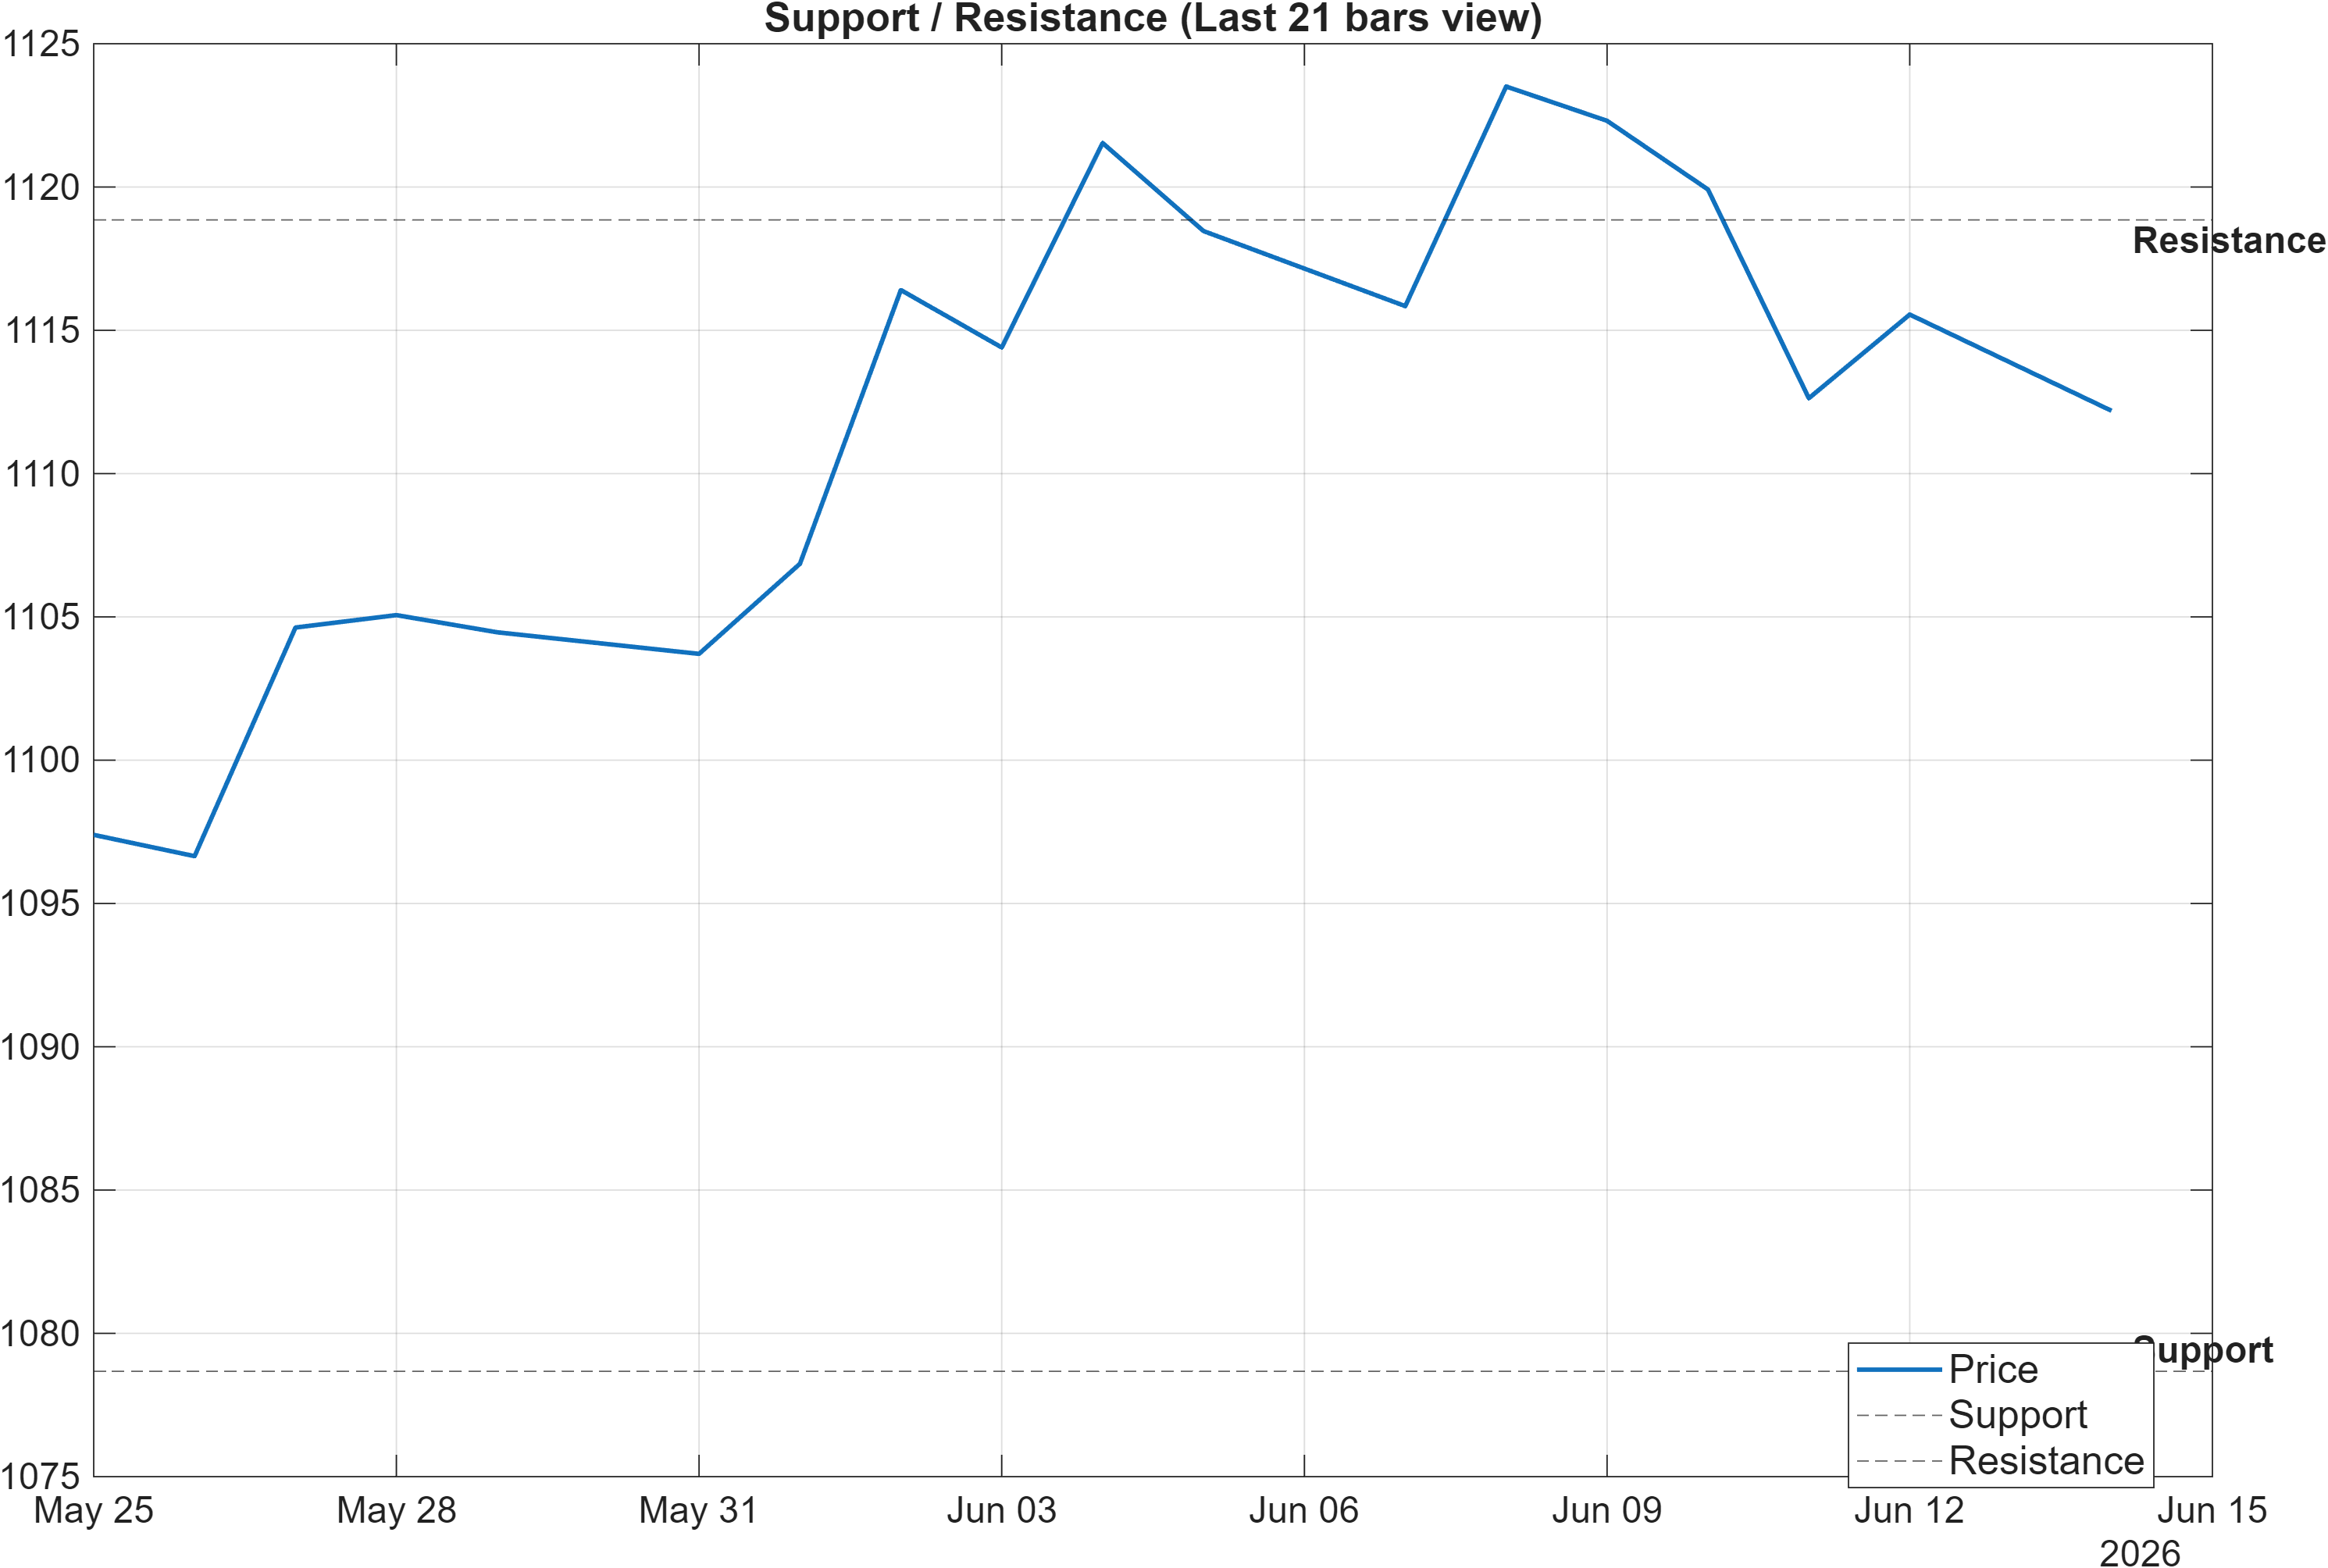
Scenario view: Break above resistance with volume → continuation. Close below support → signal deterioration risk.
The level structure is relatively tight and therefore analytically useful: 1078.6755 defines the primary downside decision zone, while 1118.8521 caps the upside. With trend filters bullish (close above MA50; MA50 above MA200), these zones function as validation points for whether the broader regime remains intact or transitions into deterioration.
A clean break above 1118.8521 is framed as a continuation trigger, but the qualifier “with volume” matters because the technical dashboard shows a Neutral blended score (-0.031) and a negative MACD histogram at -0.6740. In practice, that combination often rewards waiting for confirmation through participation rather than assuming a breakout will hold in a compressed volatility context (bandwidth 0.0269).
On the downside, a close below 1078.6755 would do more than violate a single line—it would likely force reconciliation between the very strong intermediate ranks (monthly #1, 3-month #2) and the more mixed indicator stack. Because the daily rank is “only” #34 (still strong, but less extreme), the support level becomes the tactical fulcrum: holding it keeps the interpretation in the realm of consolidation; losing it raises the probability that the bullish rank regime is being challenged by a genuine shift in price behavior.
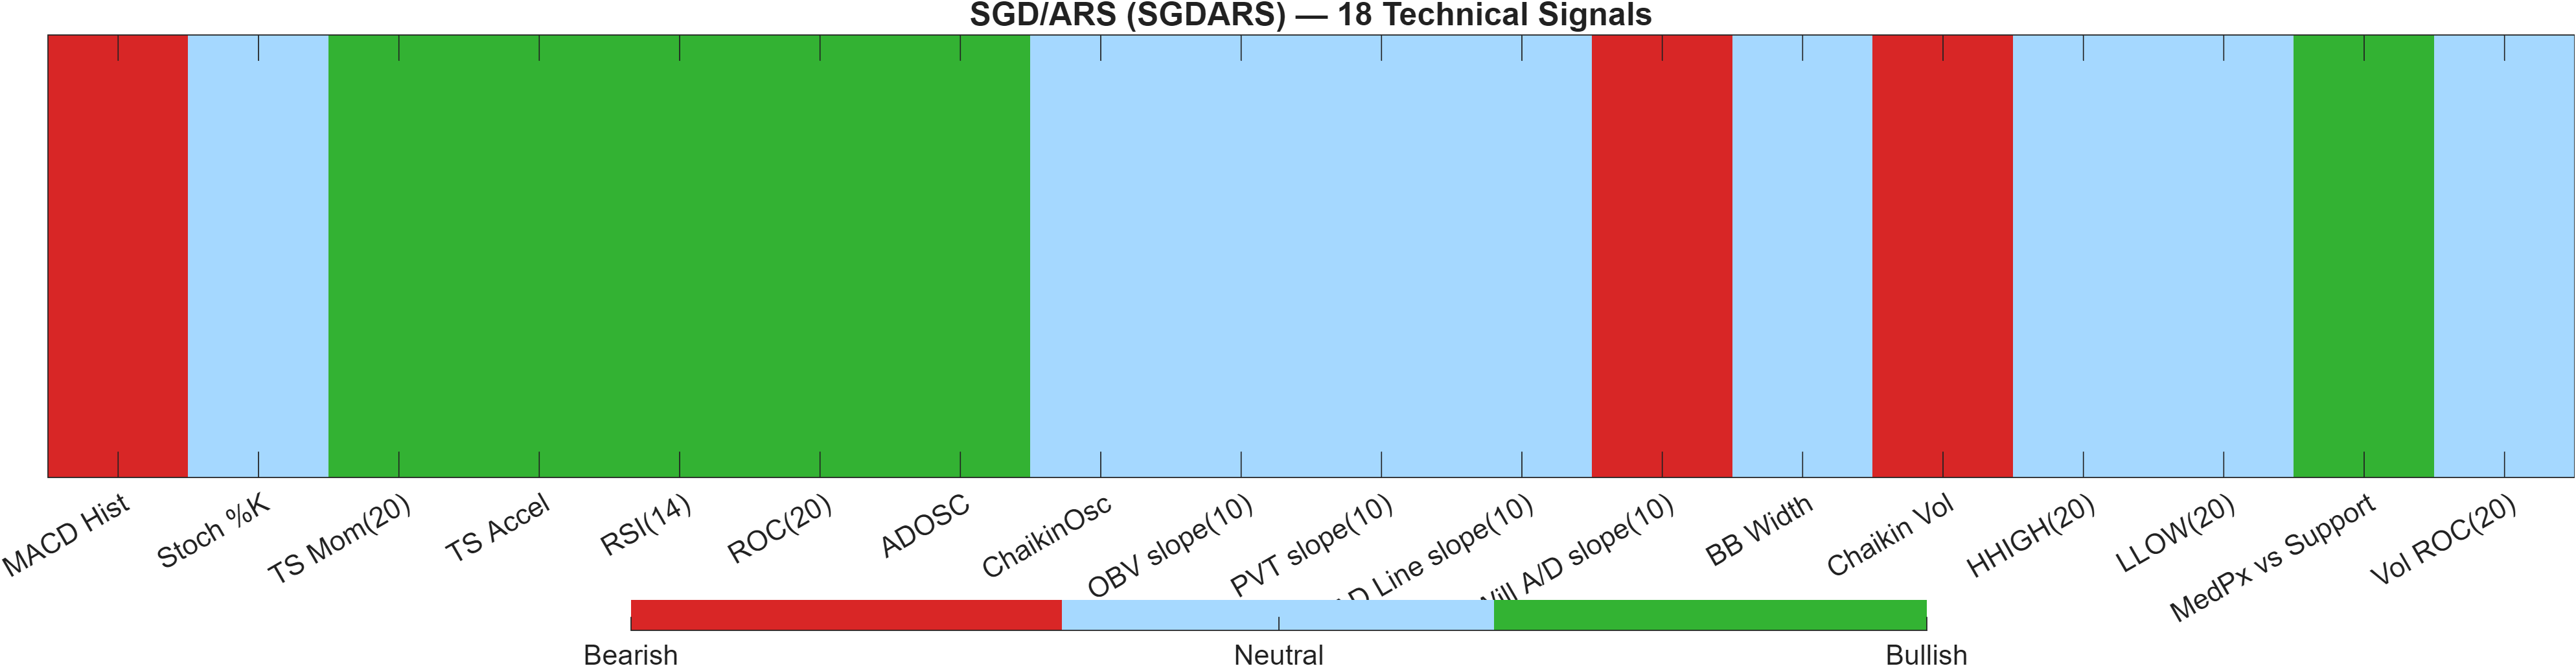
5) Quant Technical Dashboard (18 Signals)
KGNAI AI Technical Analysis Score (Deep Reinforcement Learning): Rank #722 out of 967 (Rank 1 represents the strongest technical positioning and a higher probability of favorable price behavior. As ranks increase toward the maximum, the probability of favorable outcomes weakens and bearish positioning becomes more dominant.) | Label: Neutral | Score: -0.493
18-Signal Technical Confluence Score: 0.167 (Neutral)
Overall Technical Score (18-signal confluence + DRL rank blend): -0.031 (Neutral)
Note: The blended score reflects signal strength weighted against broader AI technical ranking, which may temporarily diverge.
Blended technical score breakdown: -0.031 (Neutral | Bull 6 / Bear 3 / Neutral 9)
Signal-level alignment vs model divergence
The most notable feature in this section is the internal split between confluence and model rank. The 18-signal confluence score is 0.167 (Neutral), while the DRL technical rank is #722 out of 967 with a score of -0.493—also labeled Neutral, but positioned in the weaker part of the distribution. The blend lands at -0.031, describing a market where headline trend can remain constructive while technical “quality” signals are not uniformly supportive.
Within the indicator set, there are clear bullish elements—RSI(14) at 58.1 and ROC(20) at 1.417 support a constructive bias, and TS Mom(20) at 18.9 reinforces that positive drift has been present. However, the bearish cluster is not negligible: MACD histogram at -0.674 flags momentum that is still negative on that oscillator, and Will A/D slope(10) at -16.26 points to a pocket of distribution/flow weakness inside the set.
The score composition—Bull 6 / Bear 3 / Neutral 9—is consistent with a market that is neither broadly overbought nor broadly washed out, but rather waiting for direction under a still-bullish higher-level regime (ranks). In that structure, the technical dashboard becomes less about “strong buy/strong sell” and more about watching for whether bearish signals (notably MACD histogram) improve as price approaches 1118.8521, or whether weakness grows as price pressures 1078.6755.
Signal table (Bull/Bear/Neutral)
| Indicator | Value | Signal |
|---|---|---|
| MACD Hist | -0.674 | Bearish |
| Stoch %K | 43.53 | Neutral |
| TS Mom(20) | 18.9 | Bullish |
| TS Accel | 16.51 | Bullish |
| RSI(14) | 58.1 | Bullish |
| ROC(20) | 1.417 | Bullish |
| ADOSC | 50.39 | Bullish |
| ChaikinOsc | 0 | Neutral |
| OBV slope(10) | 0 | Neutral |
| PVT slope(10) | 0 | Neutral |
| AD Line slope(10) | 0 | Neutral |
| Will A/D slope(10) | -16.26 | Bearish |
| BB Width | 0.02693 | Neutral |
| Chaikin Vol | 6.311 | Bearish |
| HHIGH(20) | 1129 | Neutral |
| LLOW(20) | 1096 | Neutral |
| MedPx vs Support | 37.7 | Bullish |
| Vol ROC(20) | — | Neutral |
Interpretation: Indicator-level signals form the base confluence, which is then adjusted using a separate AI-driven technical ranking model. The final technical score summarizes this combined view.
6) News sentiment + extractive gist
Note: Instrument-specific news matches were not found, so the digest includes broader market/sector headlines. Links are provided for verification.
Sentiment score (avg): 0.050 | Positive: 19% | Neutral: 81% | Negative: 0%
KGNAI AI News Sentiment Score (normalized -1 to +1): Not available (as of —) | Label: Not available | Overall news score: 0.05
Positive Developments
Recent coverage across major financial outlets indicates a modestly constructive macro backdrop for parts of FX, centered on relative growth resilience in developed markets and periodic support for select Asian FX via equity performance. In this digest, the positive tone primarily reflects policy and growth narratives that can reduce tail-risk pricing and stabilize cross-asset risk appetite. While these themes are not SGD/ARS-specific, they can influence the broader environment in which EM and cross rates trade—particularly when volatility is already contained, as suggested by Bollinger bandwidth at 0.0269. In a low-bandwidth regime, incremental “better-than-feared” news flow can matter more because it may be sufficient to move markets from compression into expansion, especially around a nearby technical inflection such as 1118.8521. The current sentiment mix—19% positive and 81% neutral—supports the view that the news tape is not aggressively skewed, but it is not broadly adverse either.
Neutral / Mixed Developments
The dominant neutral tone is consistent with a market awaiting event clustering, particularly around central-bank decision cycles and cross-currency funding considerations. This type of backdrop tends to produce range-defined trading unless a policy surprise breaks the equilibrium. In the present readout, that aligns with the technical blend being Neutral (-0.031) despite bullish higher-timeframe ranks (monthly #1, 3-month #2). Neutral sentiment also fits the idea that confirmation will likely need to come from price behavior around levels rather than from a one-directional news impulse. As such, sentiment provides context but not a standalone edge in this update.
Negative / Risk Signals
The main risk signals in the aggregated coverage relate to geopolitical sensitivity and the possibility of abrupt shifts in risk appetite or funding stress narratives. Even when headline risk appears to be easing, markets can reprice quickly if conditions change, and FX tends to transmit that repricing efficiently. In a technically compressed regime (bandwidth 0.0269), adverse surprises can be associated with gap-style moves that test support faster than momentum indicators can adjust—making the 1078.6755 level especially relevant as a deterioration threshold. Importantly, the sentiment distribution shows 0% negative in this specific scoring snapshot, so the “risk” category is best treated as conditional rather than currently dominant; it is the type of factor that becomes consequential if price breaks key levels while momentum remains conflicted (e.g., MACD histogram -0.6740).
- What to monitor next: Whether price action resolves above 1118.8521 or rejects and rotates back into the range.
- What to monitor next: Any shift in risk tone that coincides with volatility expansion from the current bandwidth regime (0.0269).
- What to monitor next: Momentum confirmation—especially whether MACD histogram (-0.6740) improves as RSI holds near the constructive zone (58.1).
Sources referenced: Reuters, Bloomberg, Yahoo Finance, MarketWatch, Investing.com
Snapshot: AI Rank (Short–Mid–Long): Bullish (Bullish–Bullish–Bullish) · Technical Confluence: Neutral · Key Levels: Support ~1078.68 | Resistance ~1118.85 · News Sentiment: Neutral
7) Sources
- Forecasting the upcoming week: Fed, BoJ, BoE and RBA decisions take center stage — https://www.fxstreet.com/news/forecasting-the-upcoming-week-fed-boj-boe-and-rba-decisions-take-center-stage-202606122039
- South Korean Won: Authorities step up FX stabilisation push – Societe Generale — https://www.fxstreet.com/news/south-korean-won-authorities-step-up-fx-stabilisation-push-societe-generale-202606121957
- US Senior Official: Iran deal secures Hormuz reopening, nuclear material — https://www.fxstreet.com/news/us-senior-official-iran-accord-secures-hormuz-reopening-nuclear-material-202606121913
- United Kingdom: Growth resilience but softer inflation – Deutsche Bank — https://www.fxstreet.com/news/united-kingdom-growth-resilience-but-softer-inflation-deutsche-bank-202606121911
- Gold clears $4,200 as optimism on Middle East deal dents inflation woes — https://www.fxstreet.com/news/gold-clears-4-200-as-optimism-on-middle-east-deal-dents-inflation-woes-202606121850
- South Korean Won: Supported by equities and hawkish BoK – BBH — https://www.fxstreet.com/news/south-korean-won-supported-by-equities-and-hawkish-bok-bbh-202606121825
- USD/CAD Price Forecast: RSI enters overbought territory as bears defend 1.4000 — https://www.fxstreet.com/news/usd-cad-price-forecast-rsi-enters-overbought-territory-as-bears-defend-14000-202606121817
- Japanese Yen: Weakness raises intervention concerns – Scotiabank — https://www.fxstreet.com/news/japanese-yen-weakness-raises-intervention-concerns-scotiabank-202606121744
You may also like: How KGNAI AI ranks instruments across global markets
Disclaimer: KGNAI provides AI-generated analytics and educational market commentary only. This is not financial advice. Markets involve risk. Always do your own research.