Anhui Expressway Co Ltd (600012) — 21-Jun-2026 Technical Snapshot: Stability Bias, Neutral Expansion Signals
As of 21-Jun-2026, Anhui Expressway Co Ltd (600012) screens as a mixed-structure setup: shorter-horizon ranks are constructive, while the broader term view remains neutral and price behavior appears more “stable” than expanding. Within a 1292-instrument China universe, the strongest placement is concentrated in the 3-month rank (#22), while weekly and monthly ranks sit in the mid-pack, reflecting a market that has not fully converted relative strength into persistent trend acceleration. Technically, moving-average relationships are split (close vs MA50 bearish, MA50 vs MA200 bullish), and momentum readings lean subdued with a MACD histogram at -0.0476 and RSI(14) at 53.6. Volatility is moderate with Bollinger Bandwidth at 0.1009, consistent with consolidation rather than breakout. Key decision zones are clearly defined at support ~15.5000 and resistance ~17.0333, framing invalidation and confirmation conditions.
- Rank stance (Short / Mid / Long): Neutral / Neutral / Neutral, with the strongest relative placement concentrated in the 3-month window (#22).
- Technical confluence label: Neutral (18-signal confluence 0.000; overall technical score 0.233).
- Key levels: Support ~15.5000 | Resistance ~17.0333.
- News sentiment bias: Neutral (avg sentiment -0.013; 81% neutral share).
- Confirmation / invalidation: Strength is better validated on a break above 17.0333 with volume; deterioration risk increases on a close below 15.5000.
What KGNAI Measures
KGNAI evaluates assets using large cross-sectional datasets built from millions of structured data points. Inputs incorporate fundamental metrics, technical structures, and systematically processed news sentiment. Statistical models, machine learning, and AI frameworks are used to assess relative positioning, signal alignment, and probabilistic behavior across broad universes.
How to Read This Report
- Ranks are comparative across the tracked universe, not absolute price targets.
- Confluence reflects alignment among independent signal groups.
- Support/resistance levels are probabilistic decision zones, not guarantees.
- Sentiment provides contextual bias within the broader analytical framework.
1) KGNAI AI Analysis
Region: CHINA
Total universe size: 1292 ranked instruments
- Daily rank: #110 out of 1292 — Bullish
- Weekly rank: #359 out of 1292 — Neutral
- Monthly rank: #355 out of 1292 — Neutral
- 3-Monthly rank: #22 out of 1292 — Bullish
- 6-Monthly rank: #114 out of 1292 — Bullish
- Yearly rank: #454 out of 1292 — Neutral
The rank stack shows a time-horizon asymmetry: the 3-month rank (#22) sits in the top decile of the tracked universe, while weekly and monthly ranks (#359 and #355) remain closer to the middle. That spread typically indicates that the instrument has exhibited favorable behavior over a medium window but has not maintained the same dominance in the most recent trading cadence. The daily rank (#110) supports near-term resilience, yet the yearly rank (#454) tempers the conclusion by framing the broader regime as more range-like than trend-like.
In this context, “neutral” term views (Short/Mid/Long all Neutral) are consistent with a market that is selectively constructive rather than broadly directional. The actionable takeaway is not a single rank, but the persistence question: can the short-horizon improvement (daily #110) translate into sustained weekly/monthly strengthening, or does it remain a localized burst inside a longer neutral regime?
For readers using ranks as a probabilistic filter, the configuration argues for confirmation from price structure and volume-based participation rather than relying on rank alone. The universe context (1292 instruments) matters: moving from mid-pack ranks into upper-quartile territory requires consistent alignment across multiple signal groups, not just an isolated window.
Term view: Short-term: Neutral. Mid-term: Neutral. Long-term: Neutral.
Want the full universe and complete rank tables? Unlock full access on KGNAI: https://www.kgnai.com/pricing
2) Price & trend overview
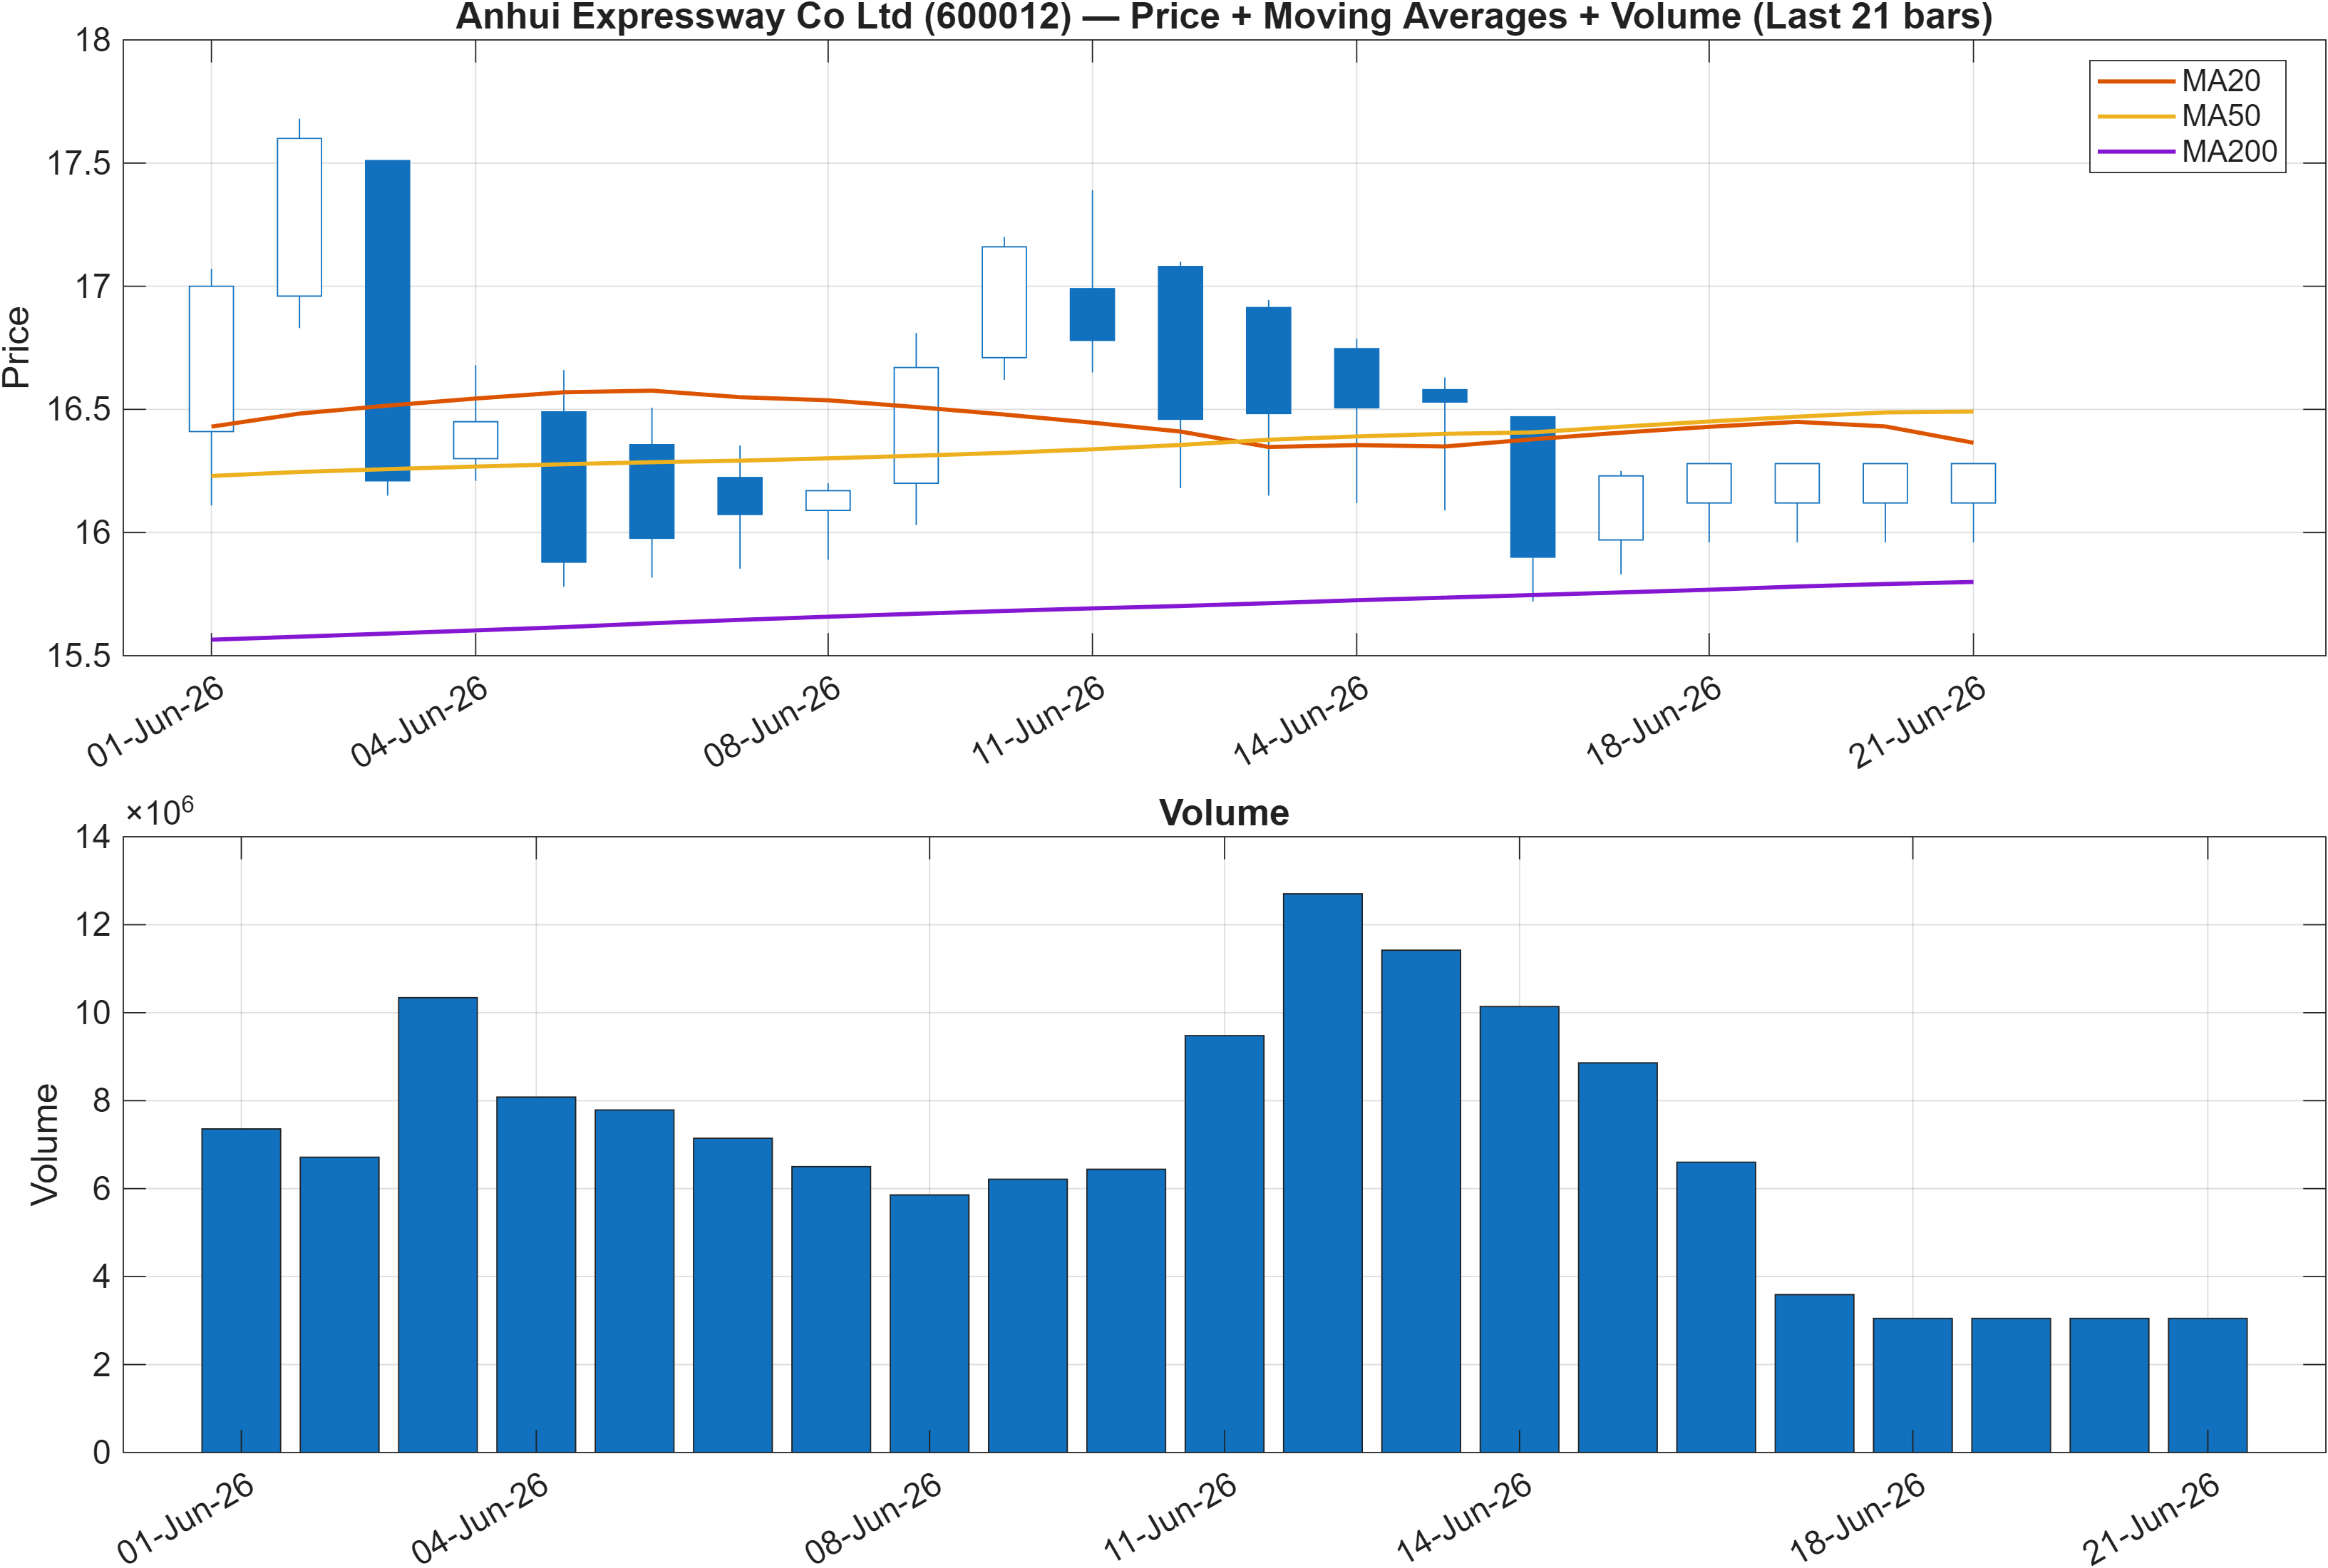
The moving-average read is split by design: close vs MA50 = Bearish, while MA50 vs MA200 = Bullish. This combination typically characterizes a market in pullback within a broader constructive structure, rather than a clean uptrend or downtrend. It aligns with the rank profile where medium-horizon strength (3-month #22; 6-month #114) exists, but near-term action has not fully re-accelerated.
From a market-structure perspective, that split often leads to compression—price oscillates around intermediate trend measures until either demand reasserts above the MA50 or weakness persists long enough to degrade the longer-term slope relationships. Because the instrument’s technical summary later shows a perfectly balanced signal count (Bull 6 / Bear 6 / Neutral 6), the trend section should be read as “supportive but not decisive.”
Practically, traders and longer-horizon allocators often treat this configuration as a conditional regime: continuation setups generally require price to regain the intermediate average while maintaining the longer-term trend backbone. Invalidation tends to be defined not by a single moving average, but by the inability to hold key horizontal levels—here explicitly mapped at 15.5000 support. Until price proves directional intent, this remains a stability-biased tape where patience and level discipline can matter more than trend-chasing.
Interpretation: Close vs MA50 = Bearish, MA50 vs MA200 = Bullish.
3) Momentum & volatility dashboard
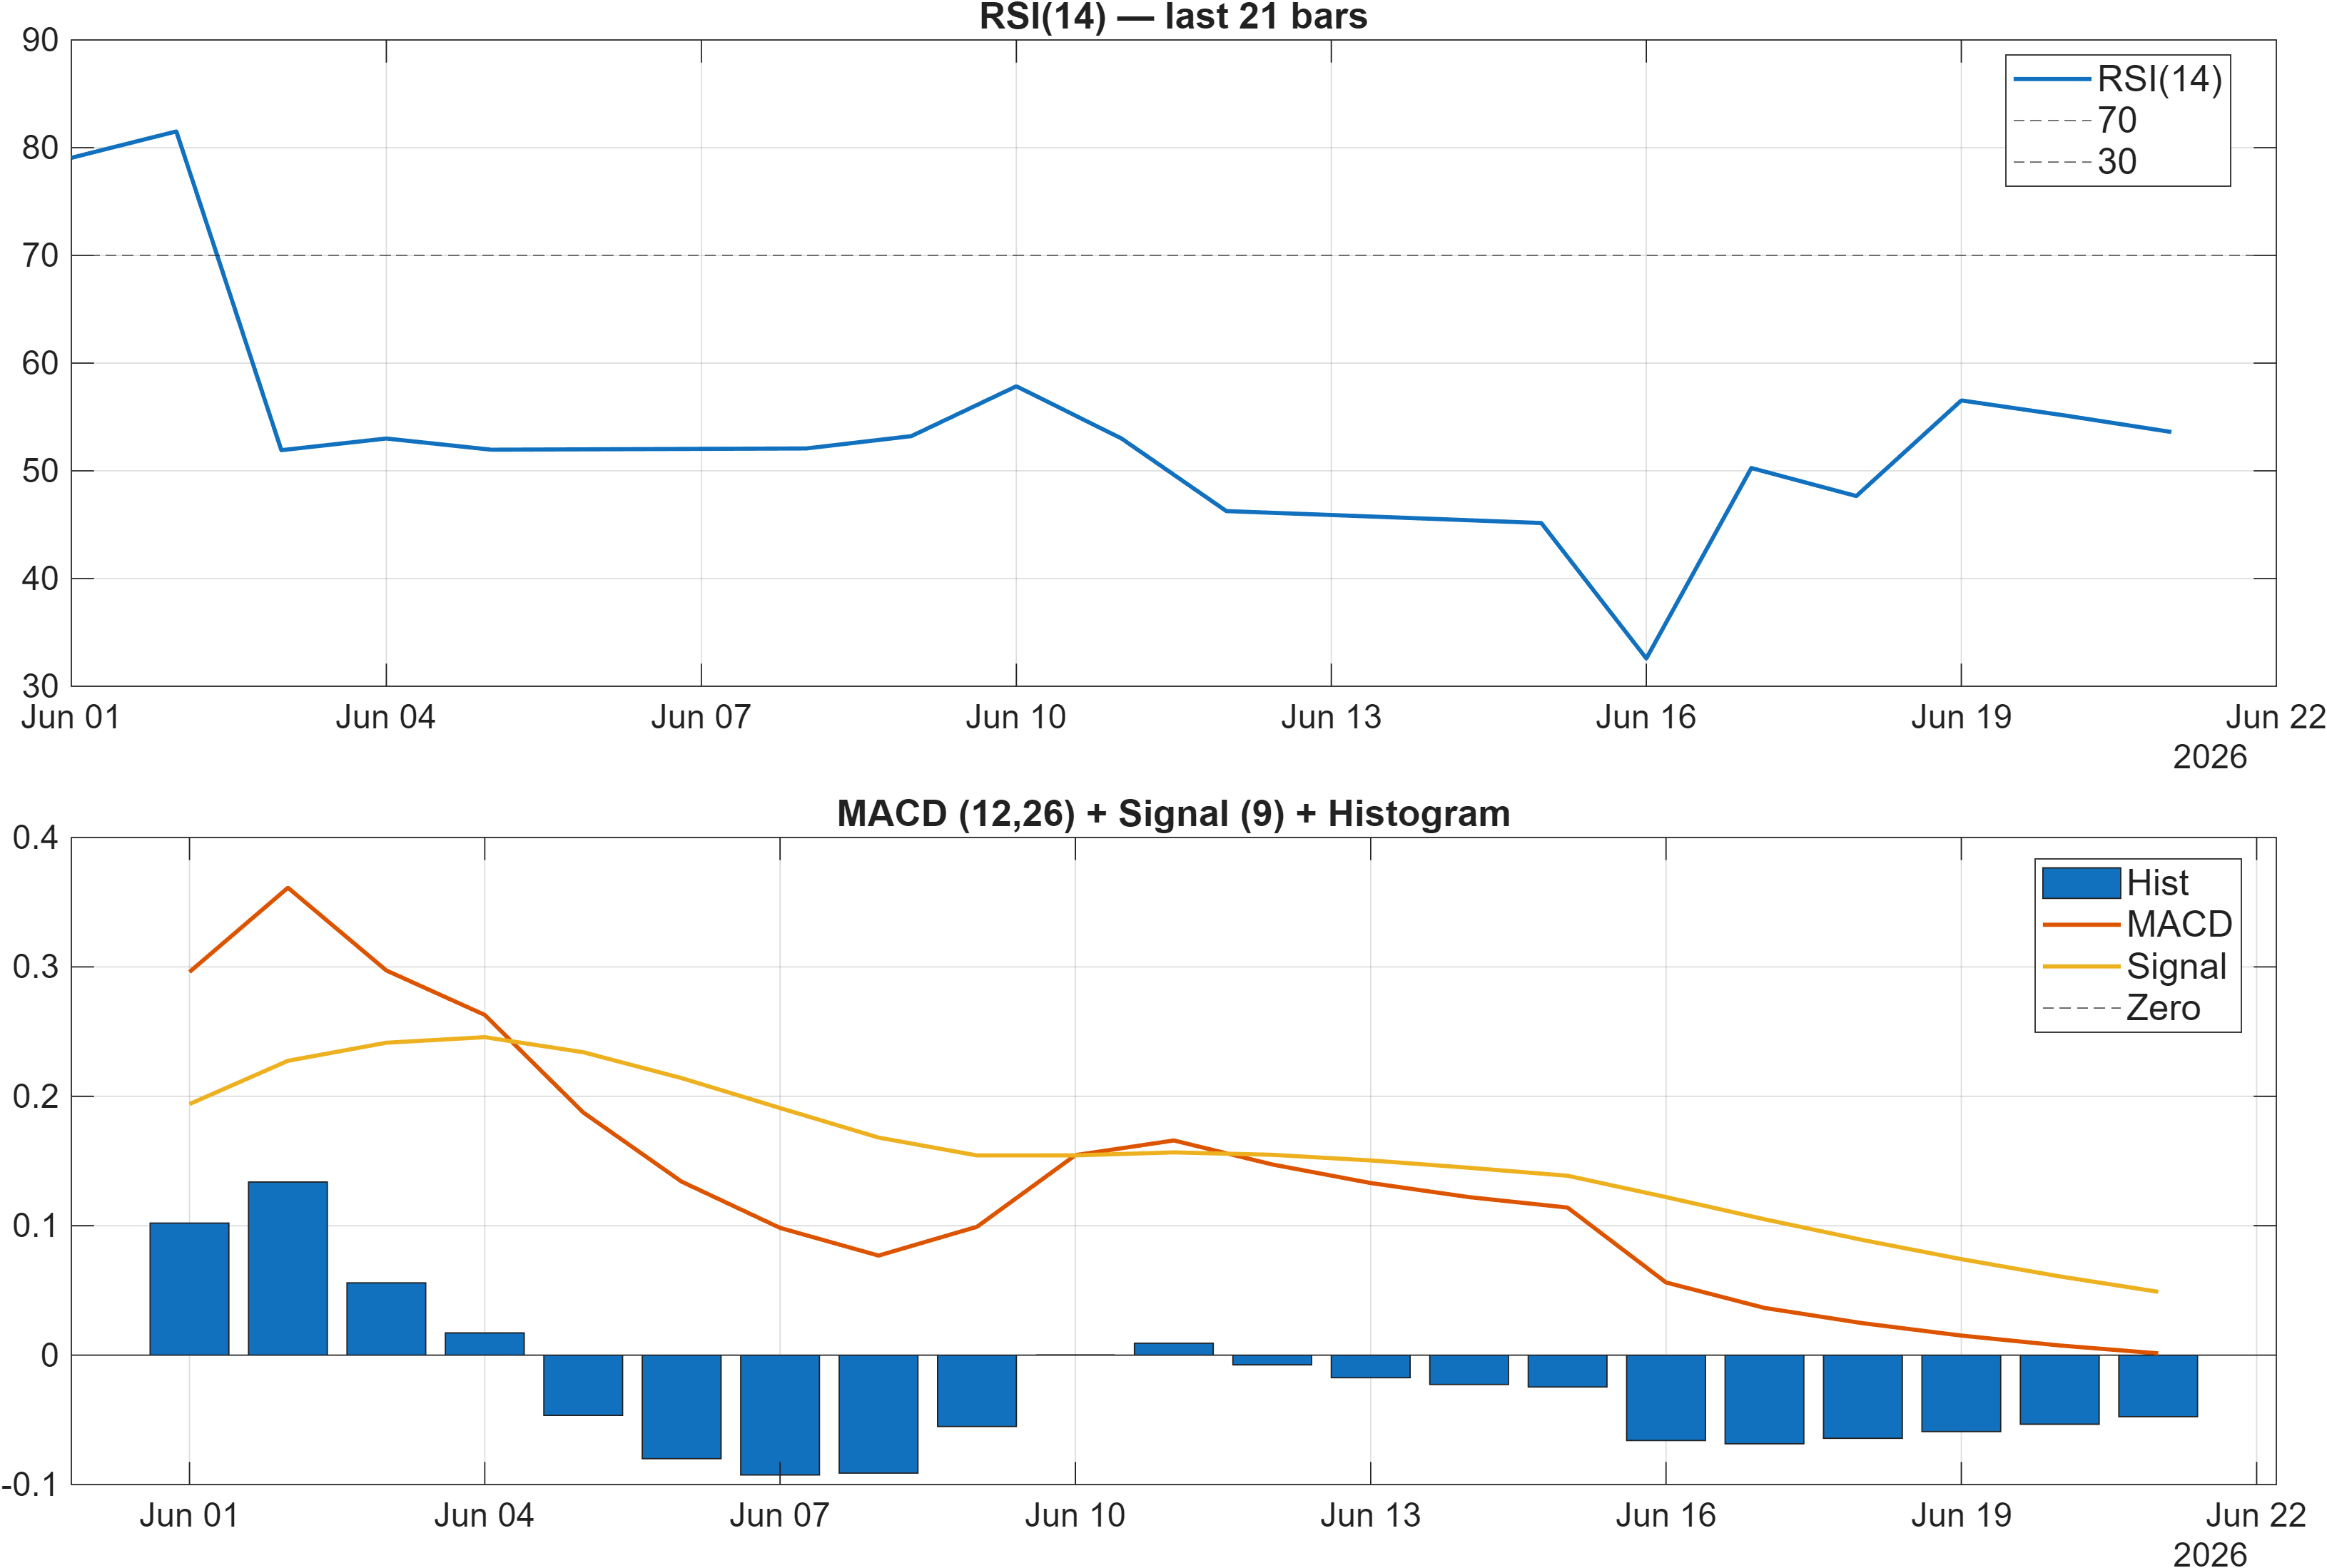
Momentum indicators point to limited directional urgency. RSI(14) at 53.6 sits near a neutral midline, consistent with a market that is neither stretched nor meaningfully washed out. Meanwhile, the MACD histogram at -0.0476 indicates mild negative momentum pressure rather than a pronounced bearish impulse; this often appears when price is consolidating below an intermediate trend reference (consistent with the “close vs MA50 bearish” observation).
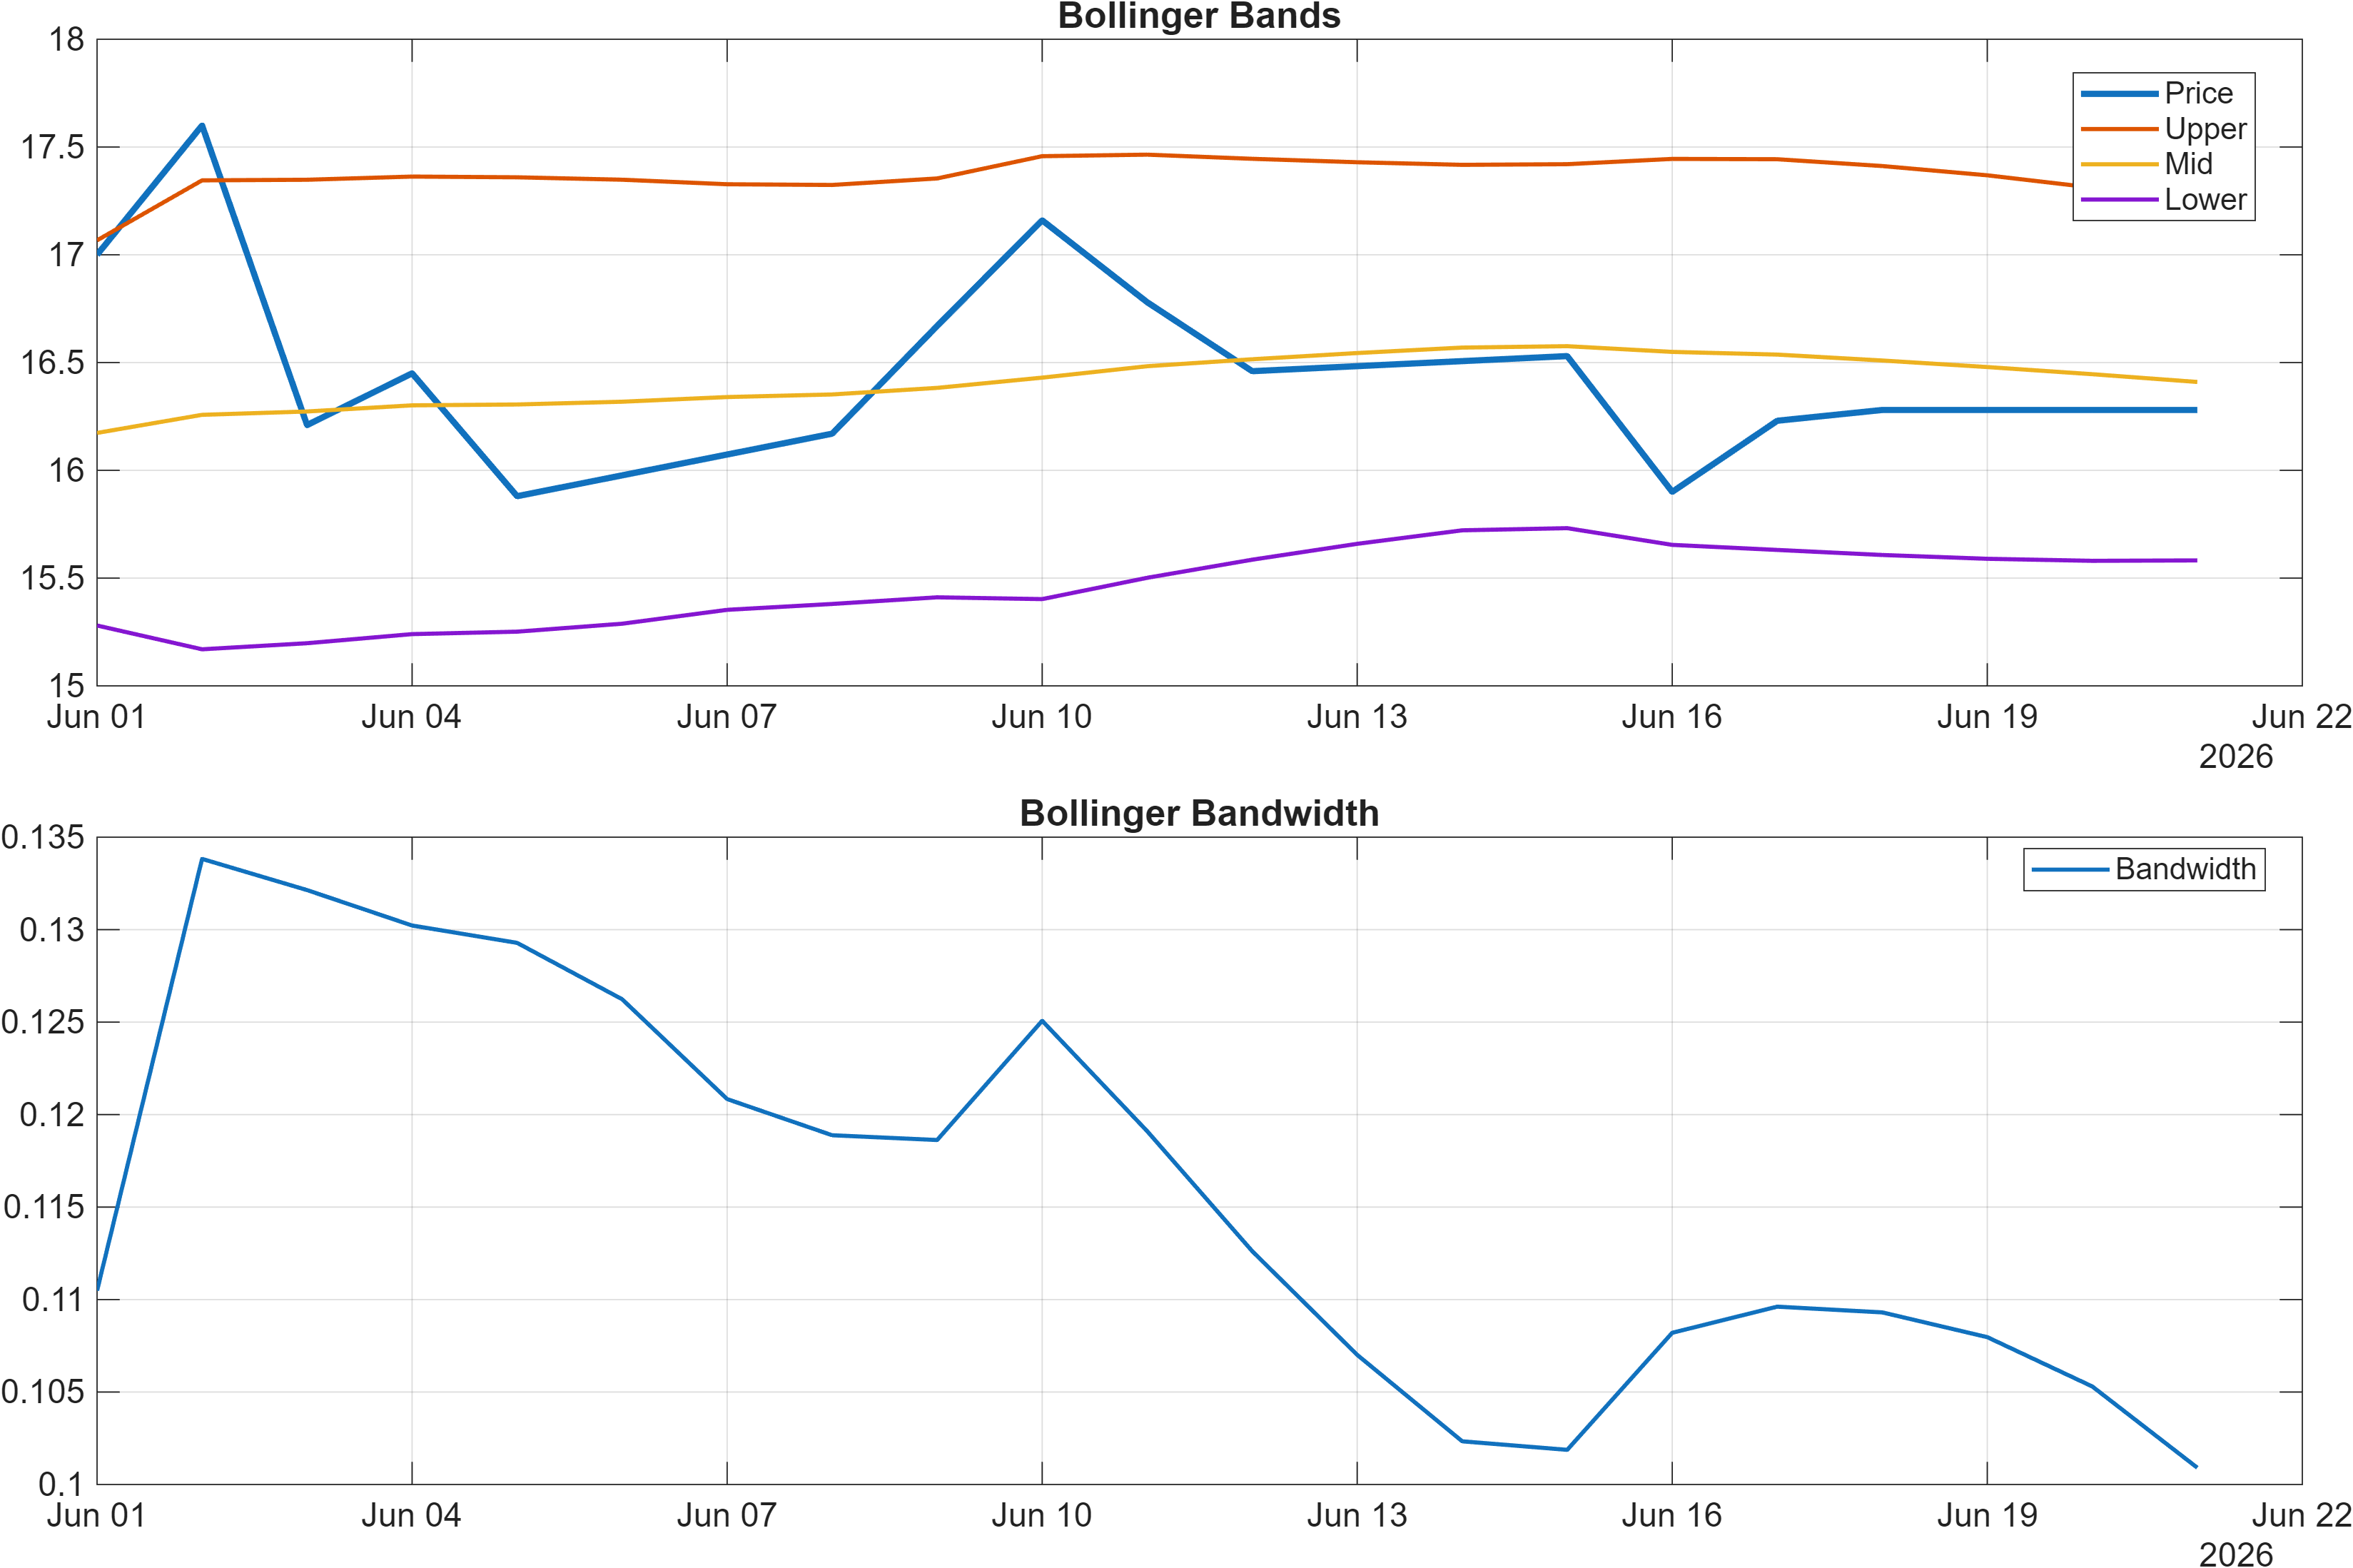
Volatility sits in a moderate regime with Bollinger Bandwidth at 0.1009. That level does not suggest a high-energy expansion phase; instead, it supports the thesis that current price action is more about range negotiation than breakout acceleration. In such regimes, oscillator signals can flip more frequently, and false starts become more likely—reinforcing the value of confirmation through levels rather than single-indicator triggers.
The signal table later reinforces this mixed momentum picture: MACD Hist is bearish while Stoch %K at 40.58 remains neutral and ROC(20) at -7.5 leans bearish. However, the presence of bullish participation proxies (e.g., volume/accumulation measures) suggests that weakness is not uniformly confirmed across market internals. This is the signature of momentum vs participation divergence: price momentum is hesitant, but some flow-based indicators are not decisively risk-off.
Interpretation: RSI bias = Neutral, MACD hist = -0.0476.
Interpretation: Bandwidth (volatility regime) latest = 0.1009.
4) Support / Resistance zones
Support ~ 15.5000 | Resistance ~ 17.0333
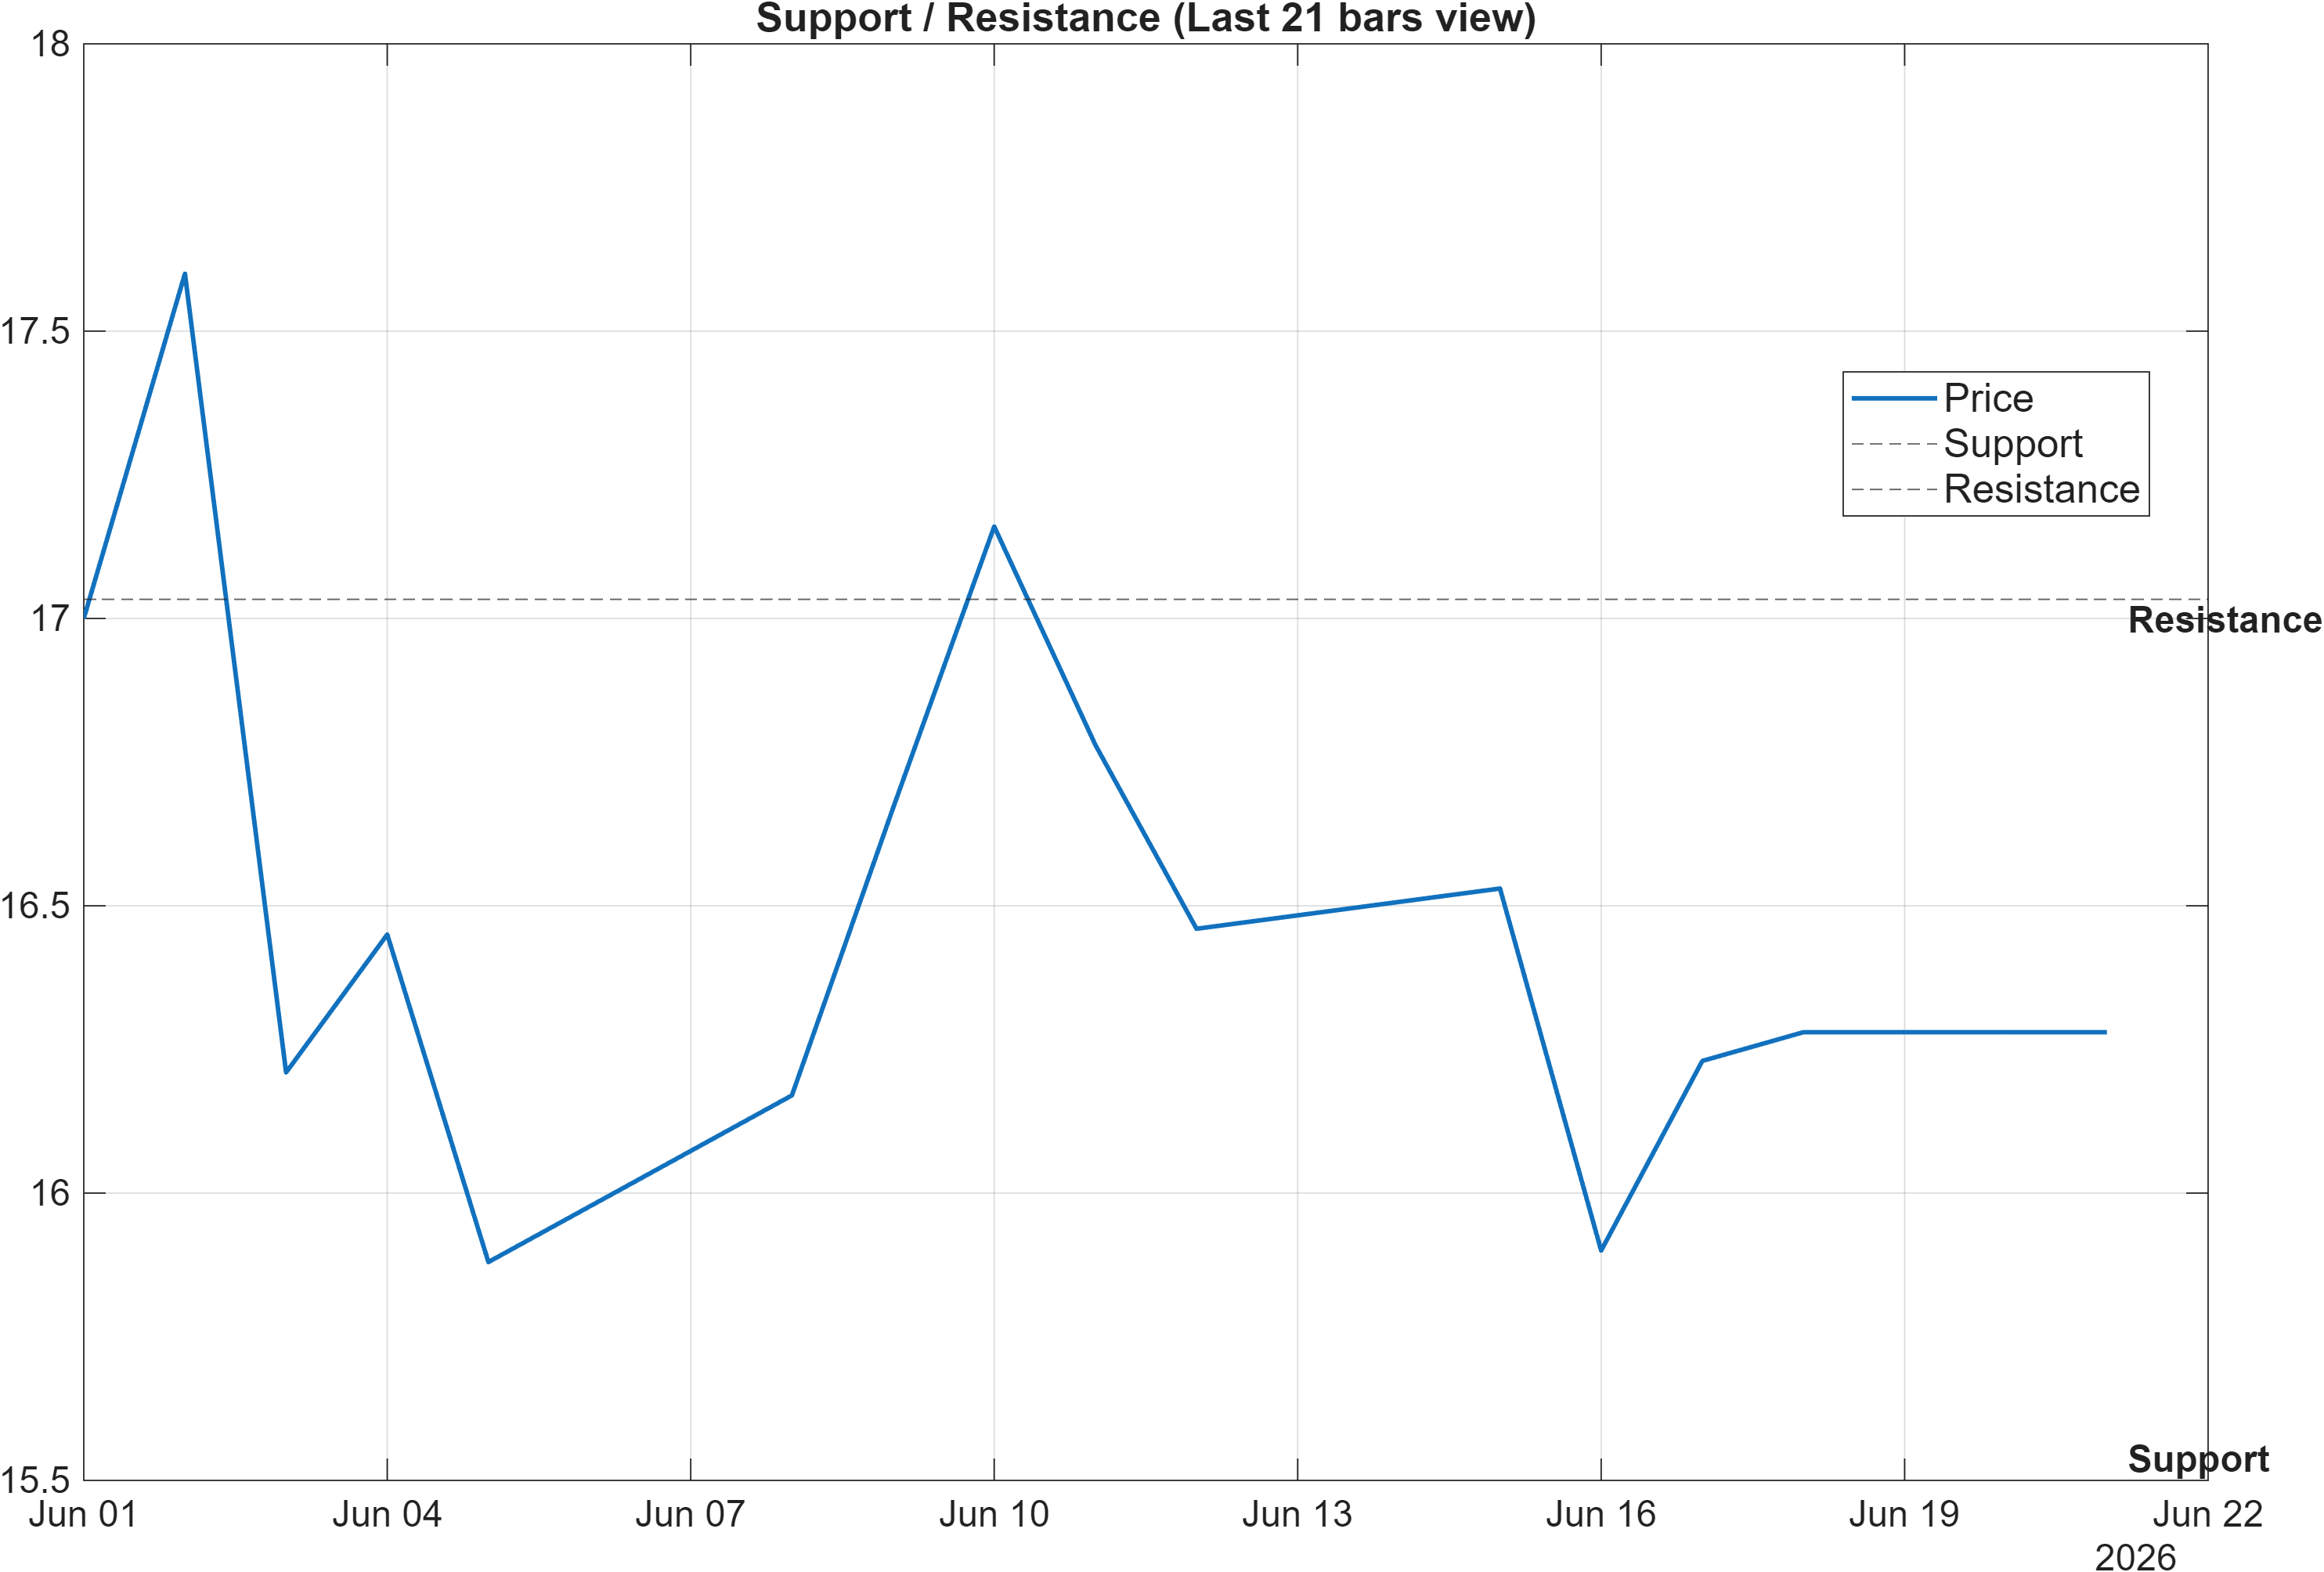
The level map is tight and analytically useful: 15.5000 defines the primary downside decision zone, while 17.0333 caps the upside. Given the moderate volatility reading (0.1009 bandwidth) and neutral confluence (0.000), this corridor functions as a range framework where probability shifts materially only when price exits with confirmation.
A key nuance is how these zones interact with the mixed trend posture. When price is below an intermediate moving average (close vs MA50 bearish), resistance tests can fail without signaling broader breakdown—especially when the longer trend backbone remains constructive (MA50 vs MA200 bullish). In those cases, the quality of the breakout attempt matters: a move above 17.0333 that is not supported by participation tends to revert, while a level reclaim that aligns with improving momentum (e.g., MACD histogram turning) is more structurally consistent.
On the downside, a close below 15.5000 would be more than a routine dip: it would represent a regime deterioration risk by undercutting the most visible reference point for buyers in a stability-biased tape. With several momentum components already leaning bearish (e.g., MACD histogram negative), losing support can accelerate signal alignment to the downside even if longer-term ranks remain neutral.
Scenario view: Break above resistance with volume → continuation. Close below support → signal deterioration risk.
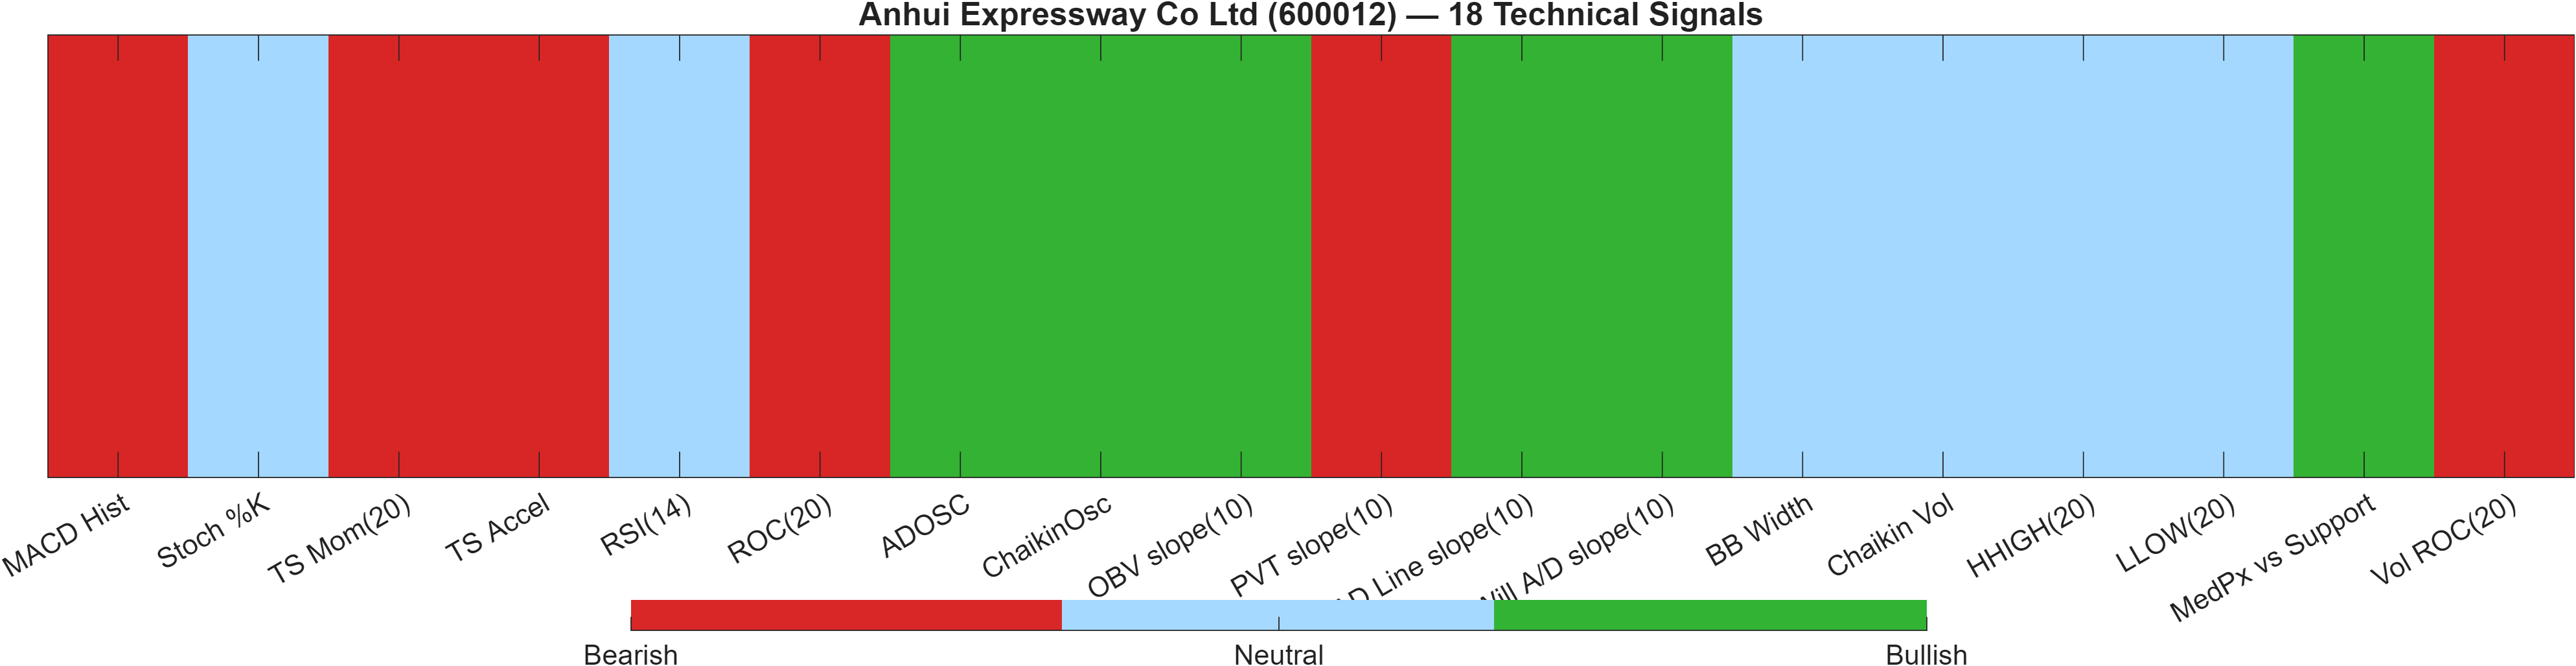
5) Quant Technical Dashboard (18 Signals)
KGNAI AI Technical Analysis Score (Deep Reinforcement Learning): Rank #144 out of 1292 (Rank 1 represents the strongest technical positioning and a higher probability of favorable price behavior. As ranks increase toward the maximum, the probability of favorable outcomes weakens and bearish positioning becomes more dominant.) | Label: Bullish | Score: 0.777
18-Signal Technical Confluence Score: 0.000 (Neutral)
Overall Technical Score (18-signal confluence + DRL rank blend): 0.233 (Neutral)
Note: The blended score reflects signal strength weighted against broader AI technical ranking, which may temporarily diverge.
Blended technical score breakdown: 0.233 (Neutral | Bull 6 / Bear 6 / Neutral 6)
The dashboard is defined by balanced evidence. The 18-signal confluence is exactly 0.000 (Neutral) with an even split (6 bullish / 6 bearish / 6 neutral), which explains why the blended overall technical score remains 0.233 (Neutral) despite a bullish AI technical model rank. This is a classic case of model-vs-indicator tension: the DRL component sees favorable patterning (Rank #144, Score 0.777), but the traditional indicator set does not yet corroborate a strong directional edge.
Signal table (Bull/Bear/Neutral)
| Indicator | Value | Signal |
|---|---|---|
| MACD Hist | -0.04756 | Bearish |
| Stoch %K | 40.58 | Neutral |
| TS Mom(20) | -1.32 | Bearish |
| TS Accel | -3.02 | Bearish |
| RSI(14) | 53.6 | Neutral |
| ROC(20) | -7.5 | Bearish |
| ADOSC | 75 | Bullish |
| ChaikinOsc | 5.737e+06 | Bullish |
| OBV slope(10) | 1.776e+07 | Bullish |
| PVT slope(10) | -3.668e+05 | Bearish |
| AD Line slope(10) | 1.243e+07 | Bullish |
| Will A/D slope(10) | 0.61 | Bullish |
| BB Width | 0.1009 | Neutral |
| Chaikin Vol | -34.28 | Neutral |
| HHIGH(20) | 17.68 | Neutral |
| LLOW(20) | 15.72 | Neutral |
| MedPx vs Support | 0.62 | Bullish |
| Vol ROC(20) | -54.57 | Bearish |
The internal mix is informative: momentum and rate-of-change inputs skew softer (e.g., ROC(20) at -7.5 and TS Accel at -3.02), while several accumulation/participation measures are bullish (e.g., ADOSC 75 and an OBV slope(10) of 1.776e+07). When those groups disagree, markets often remain range-bound until a catalyst—typically a level break—forces alignment. For this instrument, the higher-quality resolution signal would be alignment between improving momentum (MACD/ROC) and a decisive move through 17.0333, or alternatively a breakdown below 15.5000 that confirms bearish momentum persistence.
Interpretation: Indicator-level signals form the base confluence, which is then adjusted using a separate AI-driven technical ranking model. The final technical score summarizes this combined view.
6) News sentiment + extractive gist
Note: Instrument-specific news matches were not found, so the digest includes broader market/sector headlines. Links are provided for verification.
Sentiment score (avg): -0.013 | Positive: 6% | Neutral: 81% | Negative: 12%
KGNAI AI News Sentiment Score (normalized -1 to +1): Not available (as of —) | Label: Not available | Overall news score: -0.01
Positive Developments
Recent coverage across major financial outlets is broadly calm in tone, with the 81% neutral share dominating the distribution and only a small positive slice (6%). In practice, that backdrop tends to act less like a directional driver and more like a “noise floor” where price and technical structure take the lead. A mildly negative average sentiment reading (-0.013) does not, by itself, imply strong risk aversion; it is more consistent with cautious headlines and policy/geopolitical flow that can raise intraday uncertainty without necessarily changing the medium-term tape. For 600012, this complements the technical picture: moderate volatility (0.1009 Bollinger bandwidth) and neutral confluence (0.000) frequently occur when news is not persistently reinforcing either risk-on or risk-off behavior.
Neutral / Mixed Developments
The absence of instrument-specific matches means the news input should be treated as contextual rather than explanatory. With the normalized KGNAI news score marked as Not available in the provided data, readers should avoid over-weighting the digest in decision-making and instead use it as a check against sudden regime shifts. The “overall news score” at -0.01 is close to flat, aligning with the high neutral proportion. In range-bound market structures, this kind of backdrop often coincides with technical levels becoming more influential than narrative: support (~15.5000) and resistance (~17.0333) can become the primary reference points where participants reveal risk appetite.
Negative / Risk Signals
The negative share (12%) is not extreme, but it is large enough to matter when momentum is already tentative (e.g., MACD histogram -0.0476 and bearish ROC inputs). In similar setups, “background risk” can reduce follow-through on upside attempts, particularly if breakouts occur without clear participation. The main risk is not a single headline, but headline volatility interacting with a neutral technical base—creating whipsaw risk near inflection levels. If price action drifts toward 15.5000 while sentiment remains slightly negative on average (-0.013), the market can become more sensitive to incremental bad news, increasing the probability of a support test turning into a close below support.
- Whether news tone shifts away from the current neutral-heavy mix (81%) and begins to cluster in one direction.
- Any sentiment change coinciding with a test of 17.0333 resistance or 15.5000 support.
- Whether volatility expands materially from 0.1009 as price approaches key levels.
Sources referenced: Reuters, Bloomberg, Yahoo Finance, MarketWatch, Investing.com
Snapshot: AI Rank (Short–Mid–Long): Neutral (Neutral–Neutral–Neutral) · Technical Confluence: Neutral · Key Levels: Support ~15.50 | Resistance ~17.03 · News Sentiment: Neutral
7) Sources
Not available in the provided data.
You may also like: How KGNAI AI ranks instruments across global markets
Disclaimer: KGNAI provides AI-generated analytics and educational market commentary only. This is not financial advice. Markets involve risk. Always do your own research.