603212 Cybrid Technologies Inc — Technical Strength, but Trend Confirmation Still Incomplete (10-Jun-2026)
Cybrid Technologies Inc (603212) currently sits in a neutral cross-sectional rank posture versus a 1,292-instrument China universe, even as the technical layer skews bullish. This is a common configuration when momentum and participation indicators improve faster than broader relative-strength tests. The moving-average structure flags constructive conditions (close above MA50; MA50 above MA200), while momentum remains elevated with RSI(14) at 72.92 and a positive MACD histogram at 0.1364. At the same time, volatility appears contained rather than expanding, with Bollinger Bandwidth at 0.2032, implying that follow-through may require a fresh catalyst or stronger confirmation via price acceptance above resistance. From a market-structure perspective, the key decision zone is framed by support near 12.8500 and resistance near 16.1050, where volume-backed breaks (or failures) tend to resolve the “strength vs confirmation” tension.
- Rank stance: Short-term Neutral; Mid-term Neutral; Long-term Not available.
- Technical confluence: Bullish (18-signal confluence 0.667; blended technical score 0.740; DRL technical rank #58 / 1292).
- Key levels: Support ~ 12.8500 | Resistance ~ 16.1050.
- News sentiment bias: Slightly negative-to-neutral (avg sentiment -0.013; 69% neutral share).
- Confirmation / invalidation: Acceptance above 16.1050 with volume supports continuation; a close below 12.8500 increases deterioration risk.
What KGNAI Measures
KGNAI evaluates assets using large cross-sectional datasets built from millions of structured data points. Inputs incorporate fundamental metrics, technical structures, and systematically processed news sentiment. Statistical models, machine learning, and AI frameworks are used to assess relative positioning, signal alignment, and probabilistic behavior across broad universes.
How to Read This Report
- Ranks are comparative across the tracked universe, not absolute price targets.
- Confluence reflects alignment among independent signal groups.
- Support/resistance levels are probabilistic decision zones, not guarantees.
- Sentiment provides contextual bias within the broader analytical framework.
1) KGNAI AI Analysis
Region: CHINA
Total universe size: 1292 ranked instruments
- Daily rank: #1002 out of 1292 — Neutral
- Weekly rank: #776 out of 1292 — Neutral
- Monthly rank: #896 out of 1292 — Neutral
- 3-Monthly rank: #1028 out of 1292 — Neutral
- 6-Monthly rank: Not available for this horizon — Not available
- Yearly rank: Not available for this horizon — Not available
Cross-horizon ranks cluster in the lower third to bottom quartile of the tracked universe (e.g., daily #1002, monthly #896, 3-month #1028 out of 1,292). That distribution is consistent with the current stance: Neutral across short- and mid-term horizons. Importantly, a neutral rank does not contradict bullish technical readings; it often indicates that, in cross-sectional terms, the instrument has not yet established persistent relative strength versus peers, even if internal trend and momentum are improving.
The absence of longer-horizon ranks (6-monthly and yearly: Not available) limits regime classification across full cycles. In practice, this increases the weight placed on intermediate confirmation mechanisms: whether recent strength becomes durable through level acceptance and participation. The technical layer later in the report provides a strong counterpoint—DRL technical rank #58 and a bullish blended score (0.740)—suggesting that the market may be transitioning, but the cross-sectional model has not fully re-rated it.
The cleanest way to reconcile the neutral ranks with bullish signals is to treat the current state as a probability re-pricing phase: technical alignment is improving first, while the relative-strength framework remains cautious until price holds above key resistance and volatility expands in the direction of trend.
2) Price & trend overview
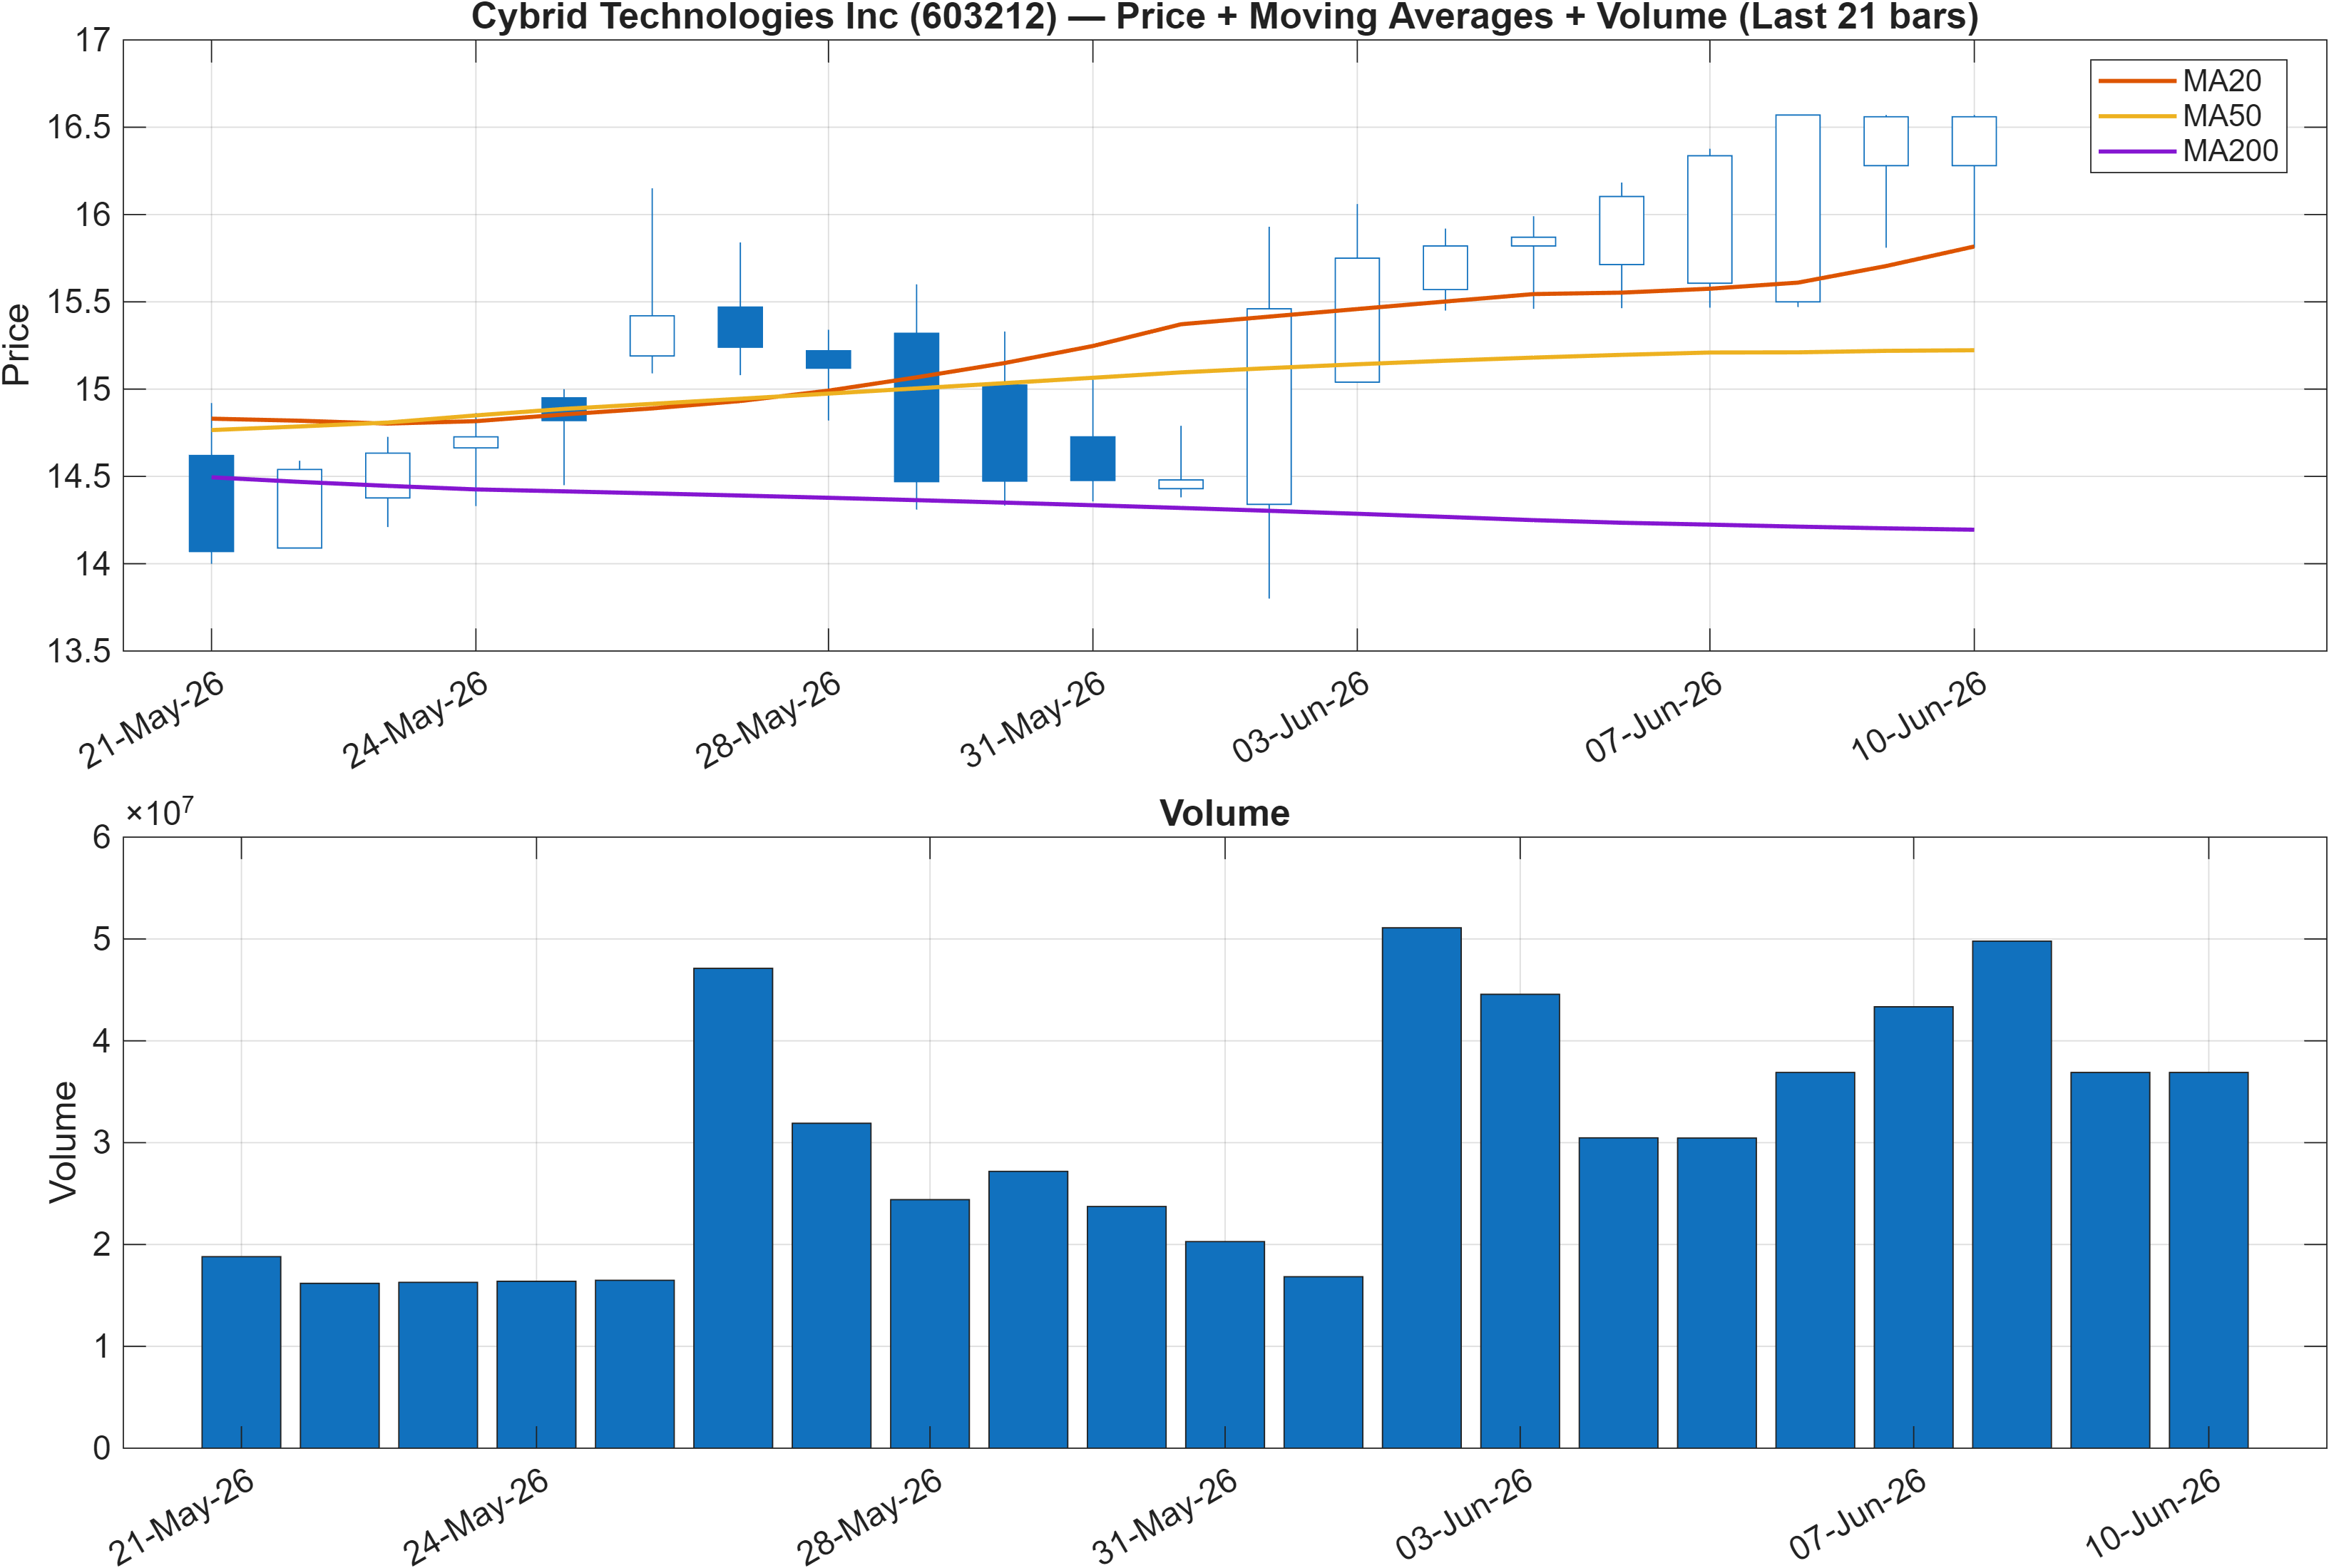
The primary trend framing is constructive: close vs MA50 = Bullish and MA50 vs MA200 = Bullish. That pairing typically corresponds to a market that has already shifted into an upward drift, with the shorter moving average positioned above the longer one. However, the report’s stance—“lack of trend confirmation”—signals that while the moving-average stack is supportive, confirmation is still being sought from complementary dimensions such as breakout acceptance, volatility expansion, and the interaction with clearly defined levels.
A useful way to interpret this configuration is as trend persistence vs. trend validation. Persistence is suggested by the MA alignment, while validation requires evidence that buyers can sustain price above nearby supply and that participation (volume-flow metrics later) is consistent with the move. The later technical dashboard supports this view: many participation proxies are bullish (e.g., ADOSC 68.42 and bullish volume-rate conditions), but volatility remains relatively contained (bandwidth 0.2032), which can accompany either steady grinding advances or late-stage consolidation.
The practical implication for structure is to treat pullbacks and retests differently depending on where they occur relative to the major zones highlighted later. With support identified at 12.8500 and resistance at 16.1050, trend confirmation becomes less about the moving averages (already constructive) and more about whether price can repeatedly hold above former supply after a breakout attempt, ideally with supportive volume.
3) Momentum & volatility dashboard
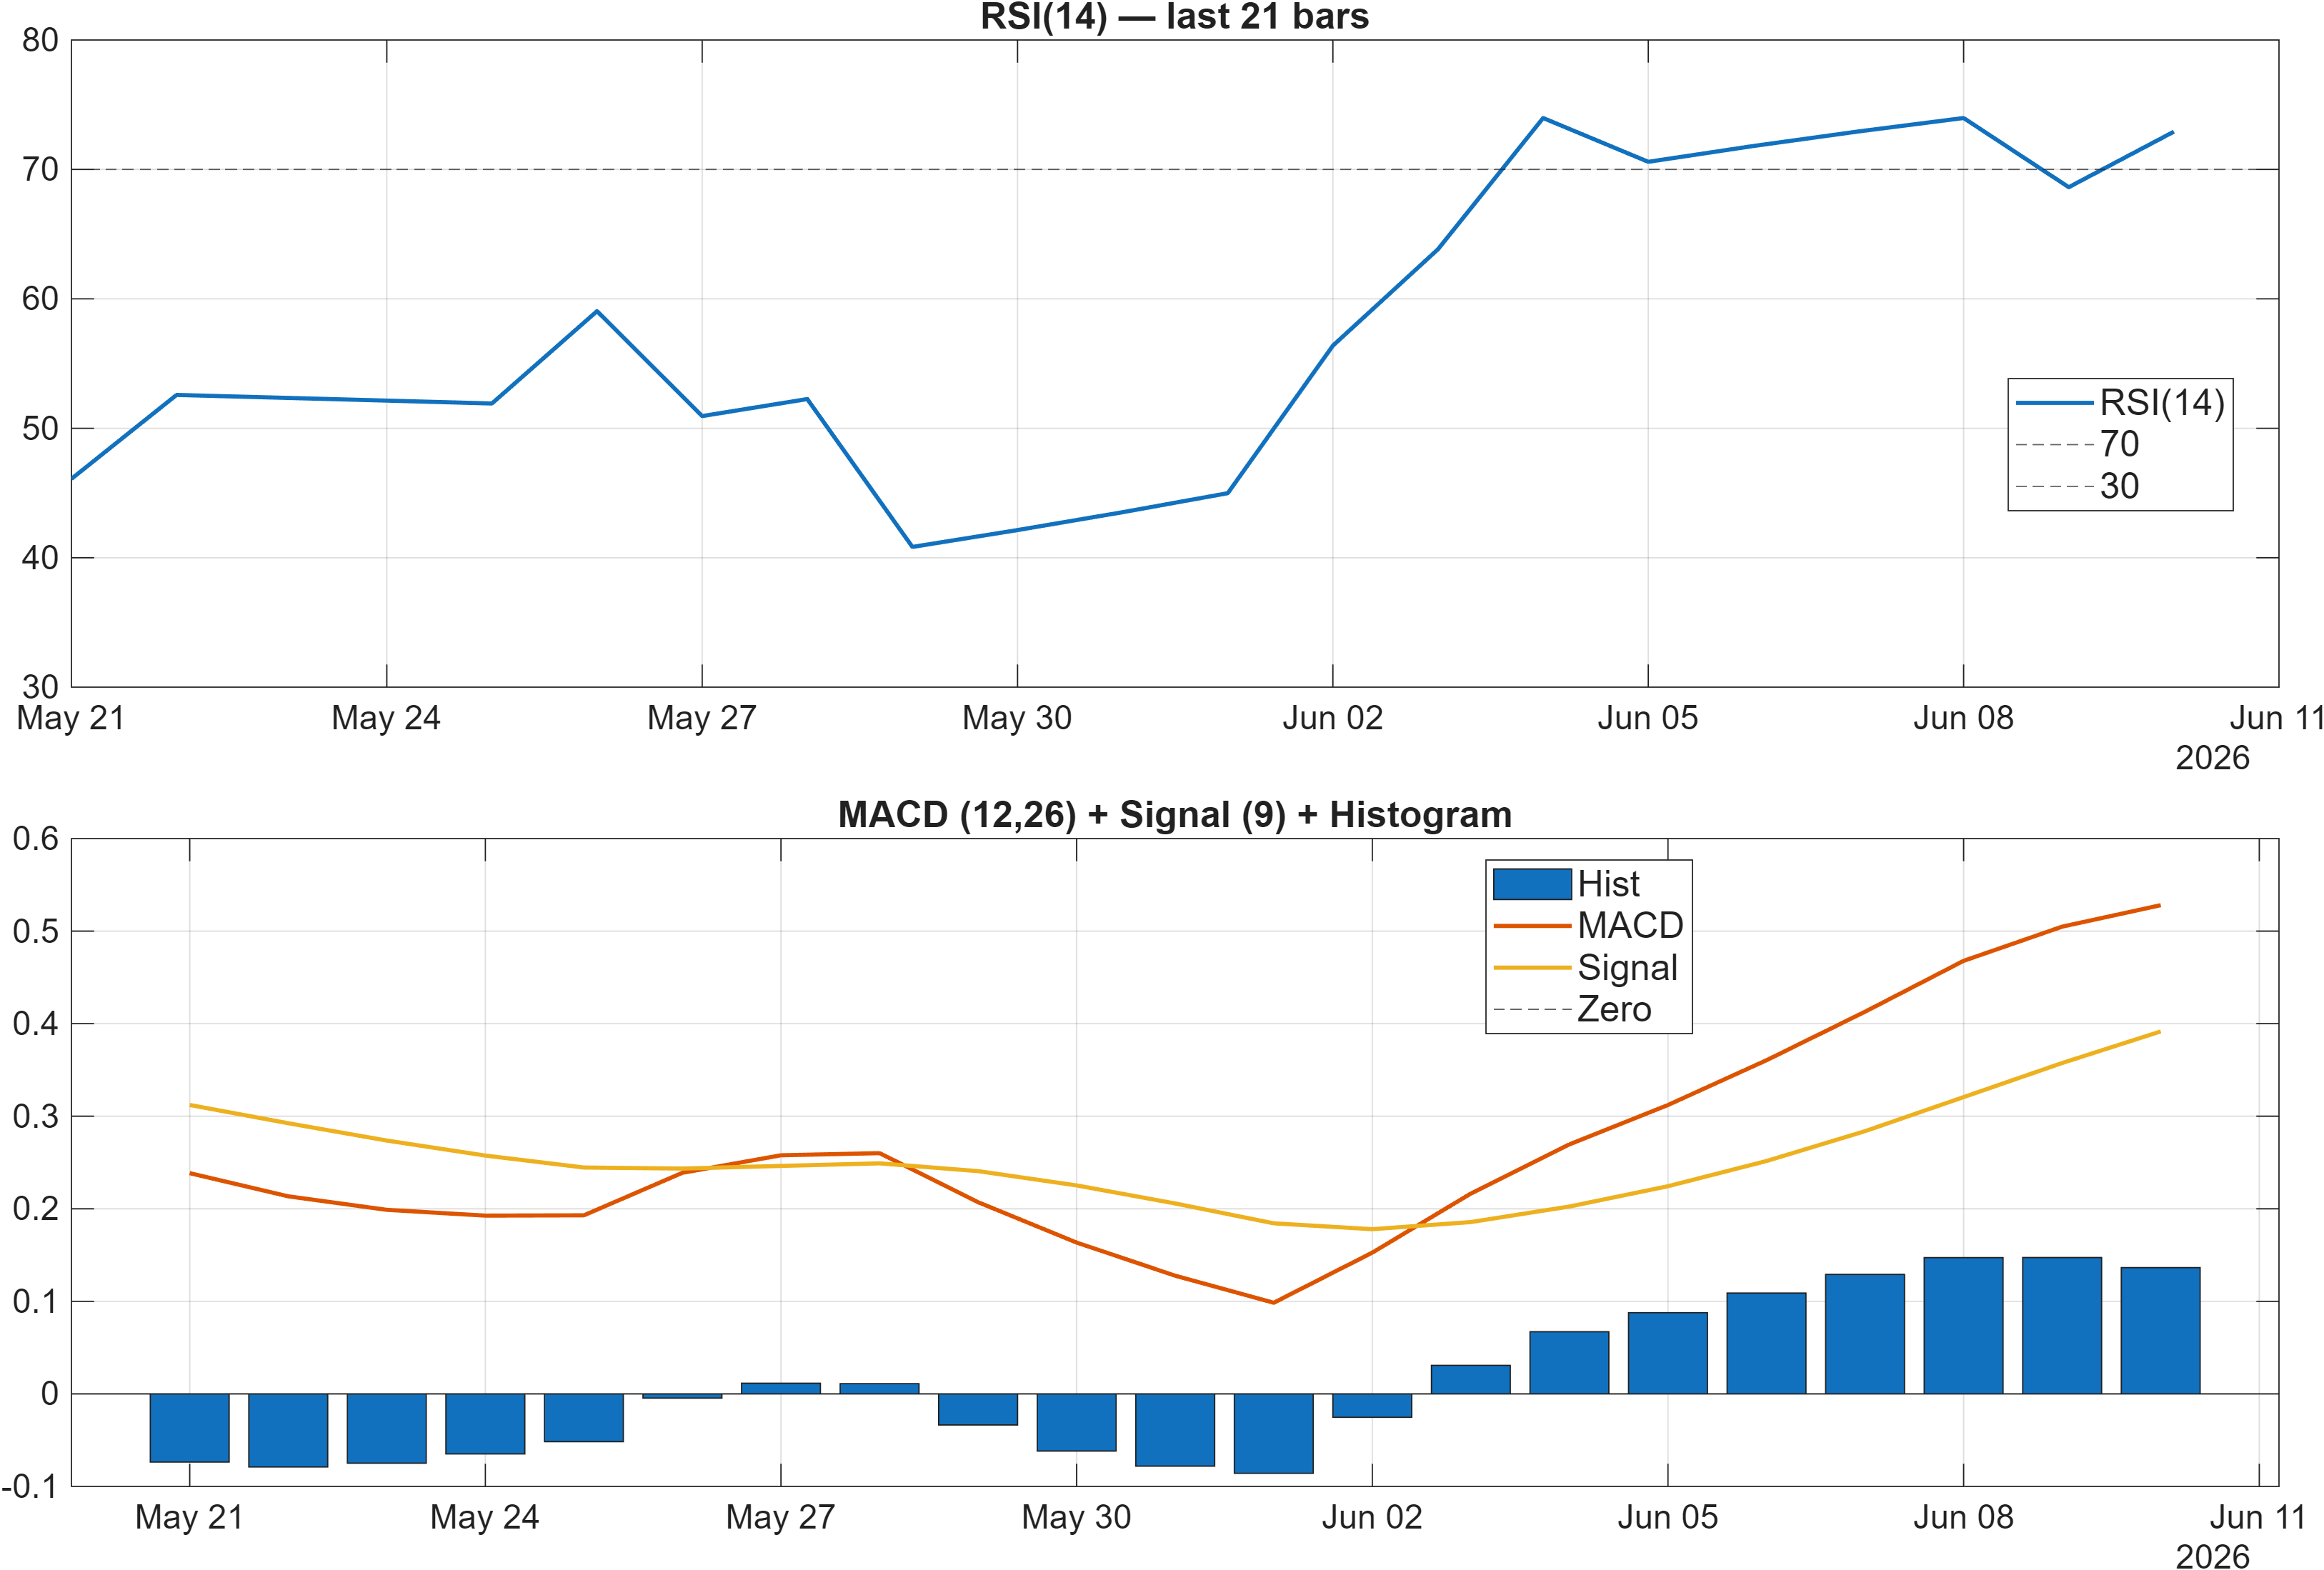
Momentum conditions are positive but increasingly “stretched.” The dashboard labels RSI bias = Bullish with RSI(14) at 72.92, a region that often coincides with strong directional demand but also raises the bar for incremental upside without consolidation. In parallel, the MACD histogram at 0.1364 confirms positive momentum impulse, supporting the view that the upswing has not fully decayed.
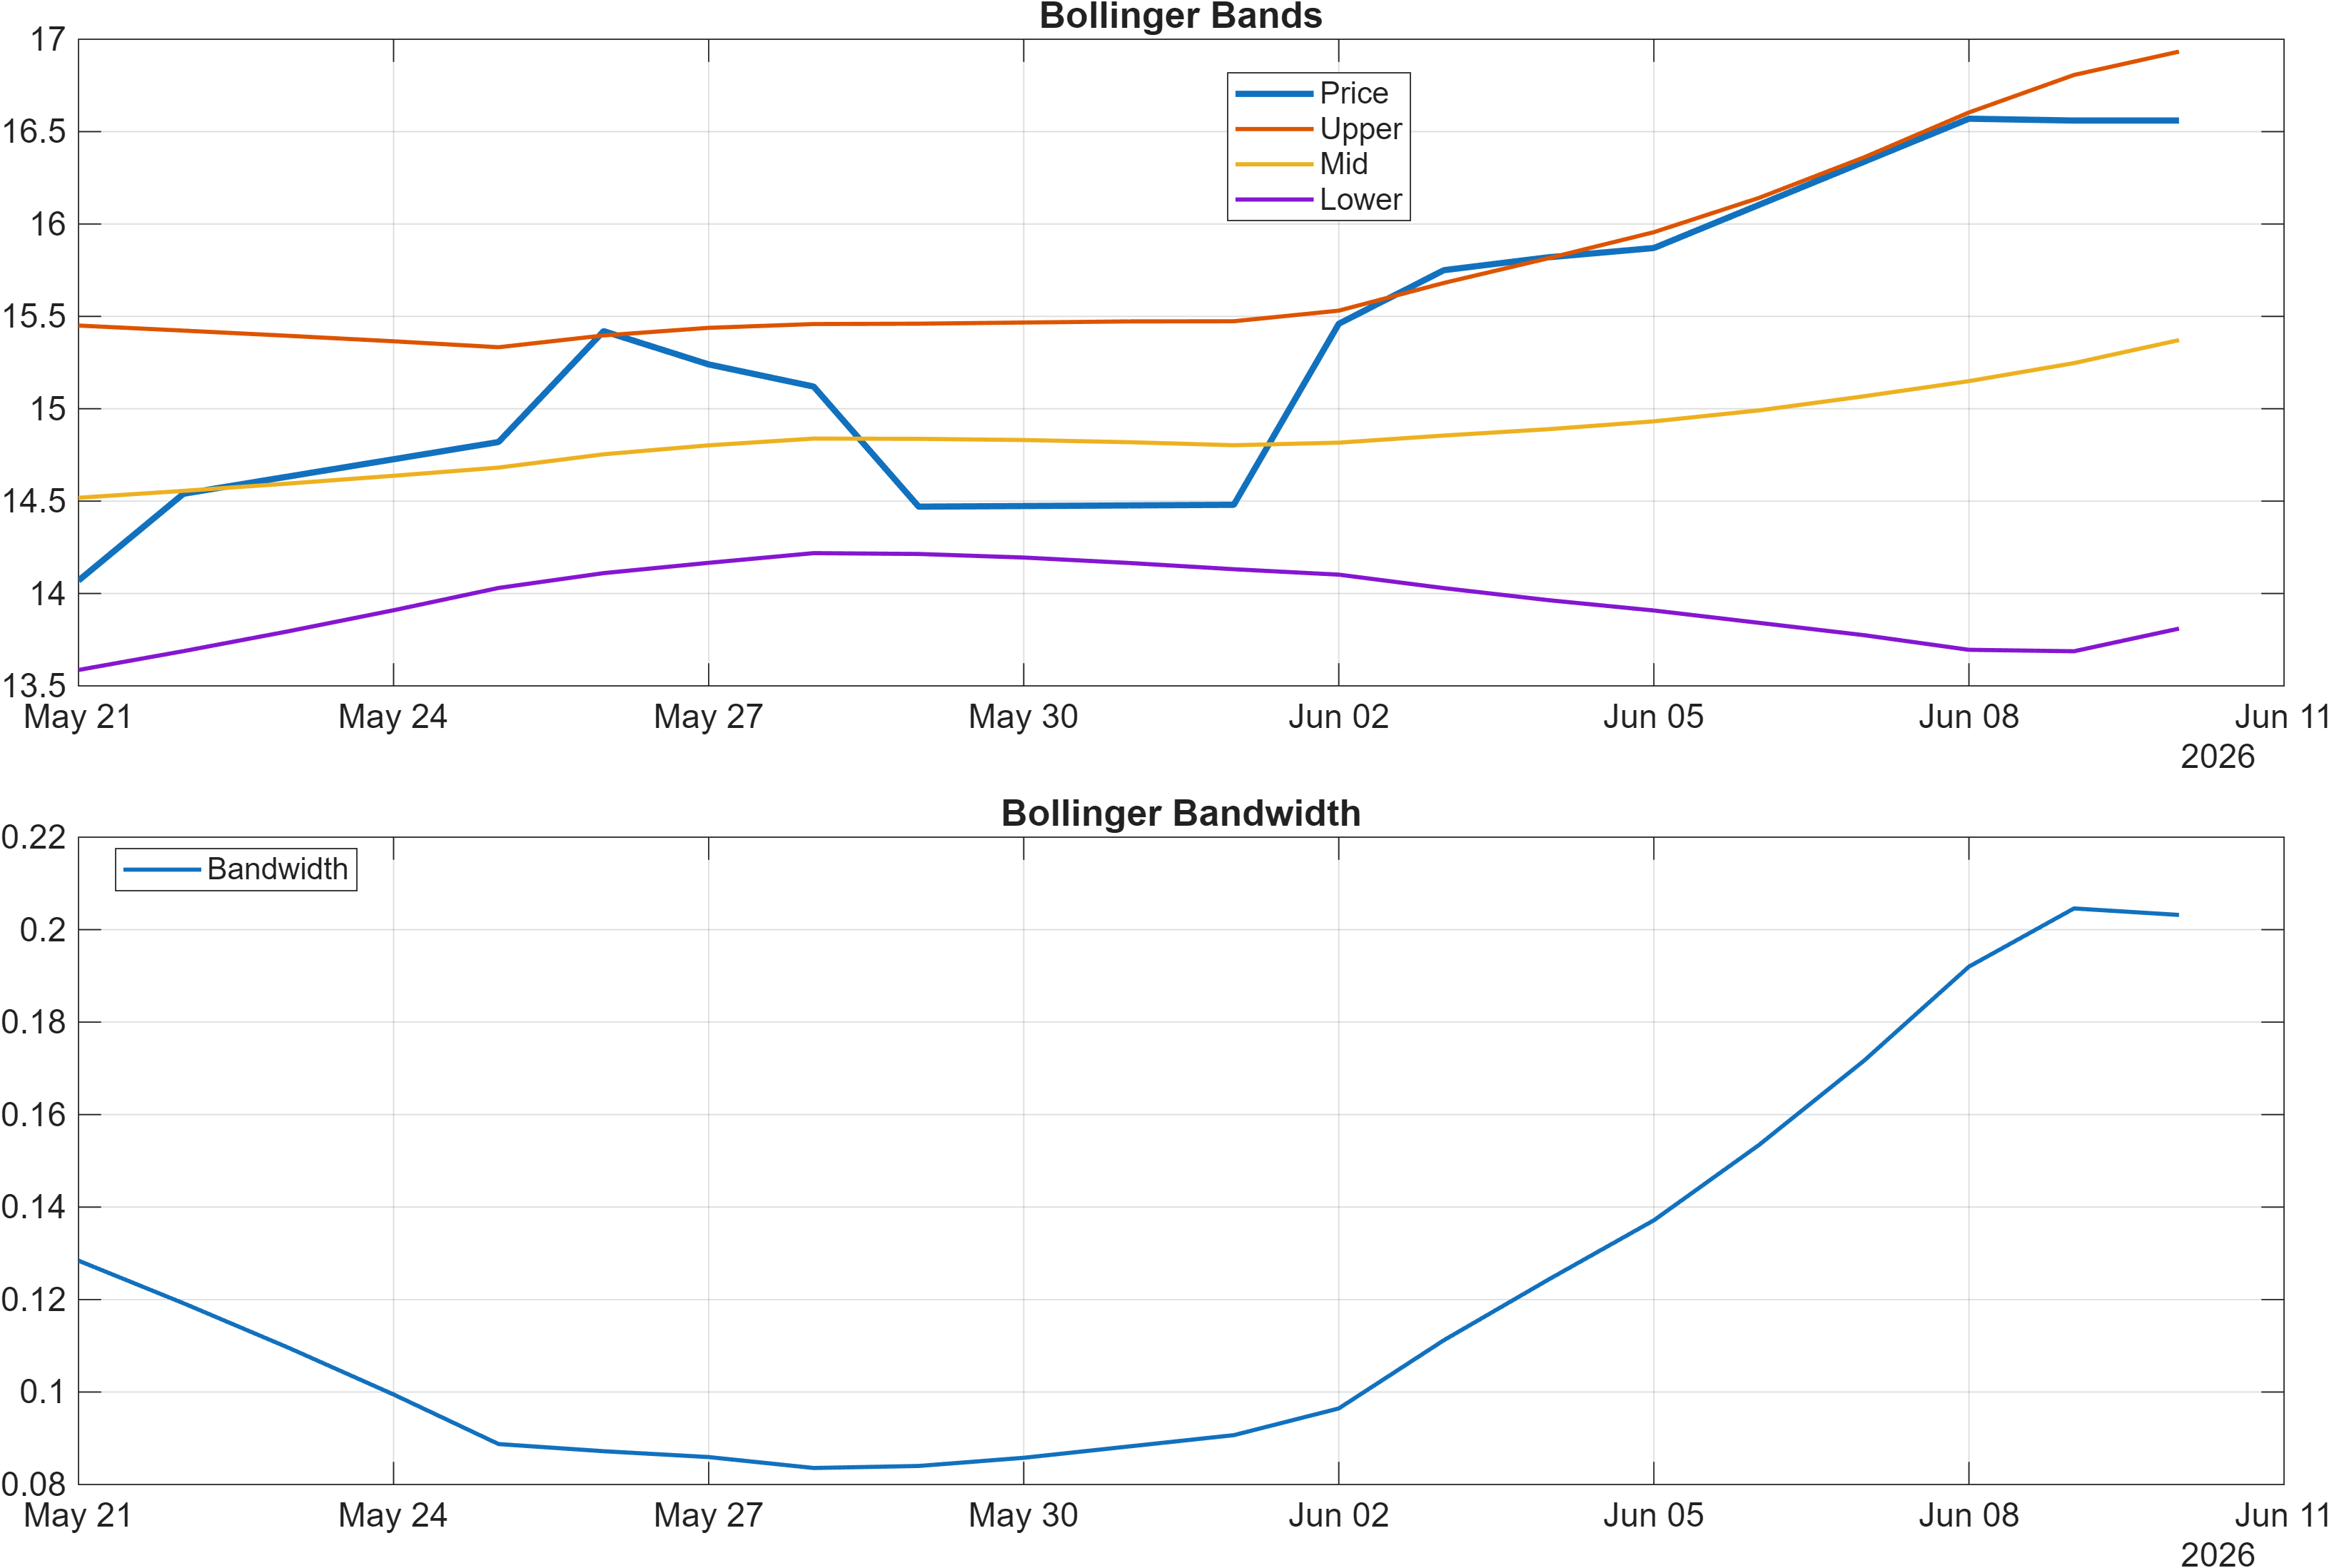
Volatility is the more nuanced component. With Bollinger Bandwidth at 0.2032, the regime reads as comparatively contained rather than aggressively expanding. That matters because breakouts that occur during compressed volatility can be durable—but only if expansion follows and price remains accepted above resistance. If bandwidth stays muted while momentum is elevated, the market can drift into a compression-within-uptrend pattern, where momentum oscillators remain high yet price progress slows, increasing the probability of mean-reversion swings.
The internal tension is therefore impulse vs. range risk. Momentum (RSI/MACD) points higher, while bandwidth suggests the market may still be building energy. A clean confirmation sequence would be: stable momentum readings coupled with a measured rise in volatility and continuation through the resistance zone at 16.1050. Conversely, if momentum remains high but price fails to clear resistance and volatility does not expand, the setup can transition into a choppy distribution-like phase without immediately turning the trend bearish.
4) Support / Resistance zones
Support ~ 12.8500 | Resistance ~ 16.1050
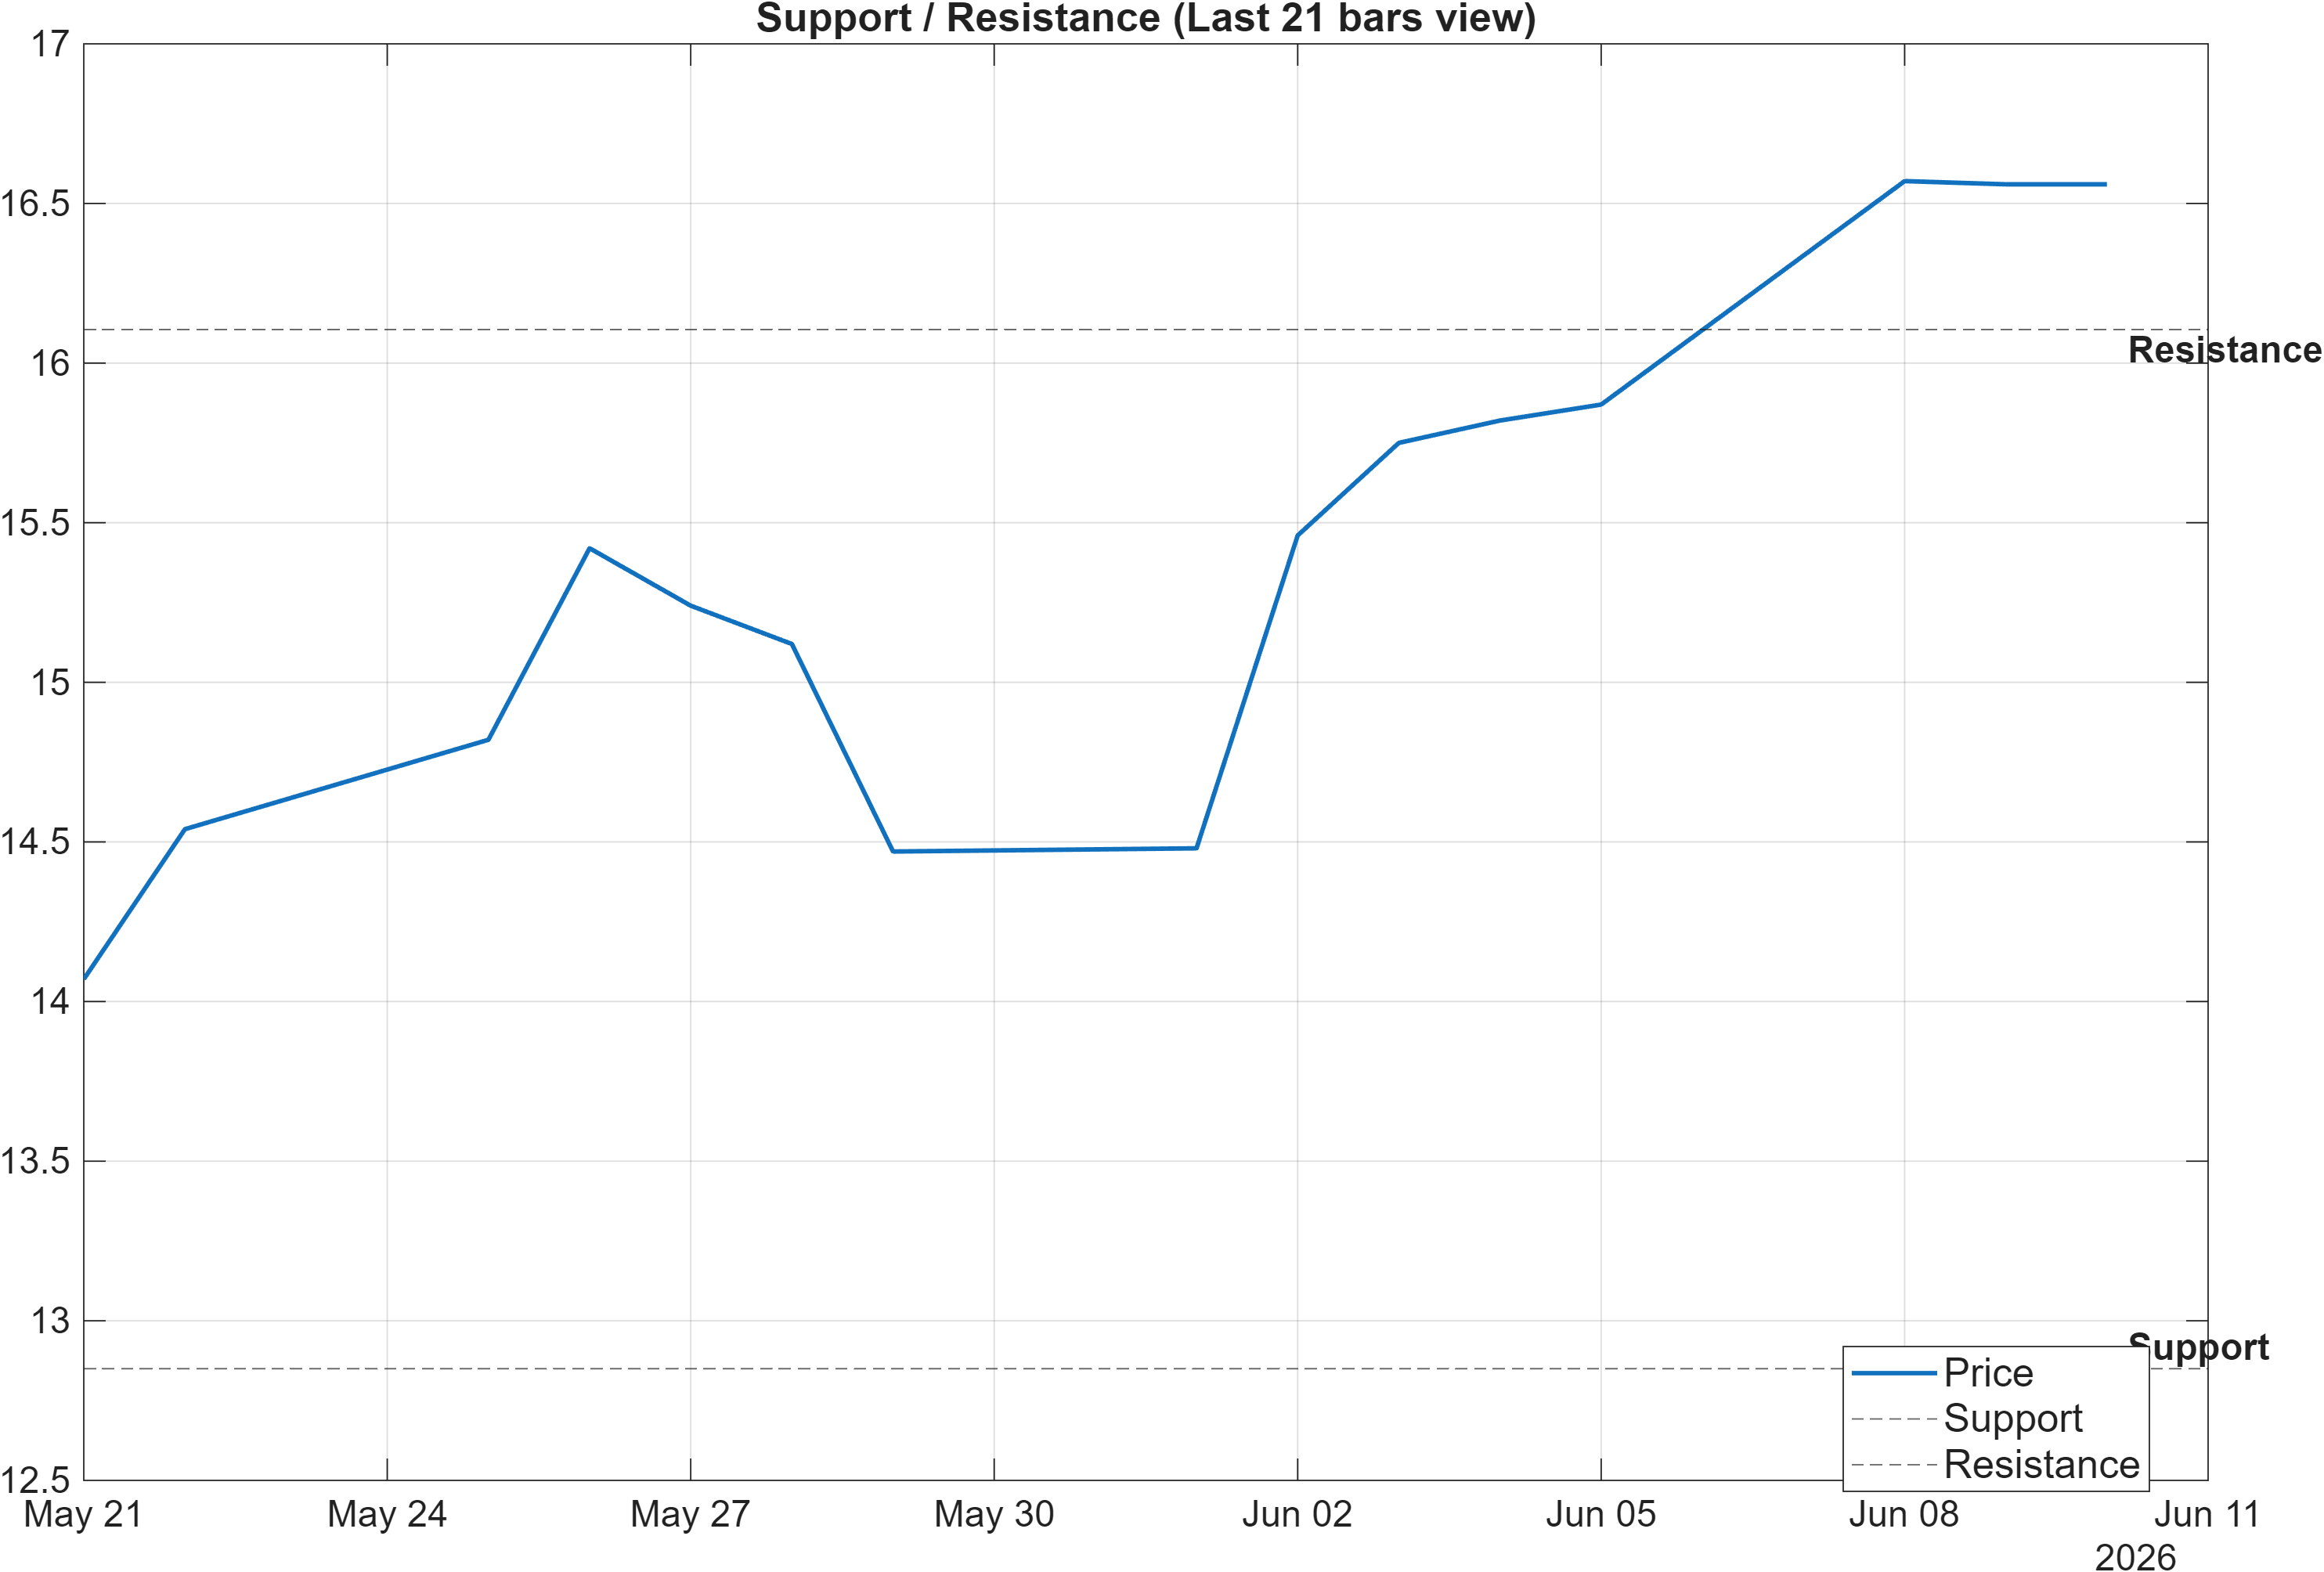
The support and resistance map defines a clear decision corridor: 12.8500 functions as the primary downside reference, while 16.1050 is the level where continuation requires evidence of acceptance. In market-structure terms, resistance is not simply a “ceiling”; it is a zone where resting supply and prior positioning tend to concentrate. A breakout attempt that clears the level but fails to attract follow-through often results in quick reversion, especially when momentum indicators are elevated.
The scenario guidance embedded in the report aligns with standard confirmation logic: break above resistance with volume → continuation; close below support → deterioration risk. That framing is particularly relevant here because the technical dashboard shows broad bullish participation signals (e.g., bullish OBV slope(10) and bullish AD Line slope(10)), while the cross-sectional ranks remain neutral. Levels become the “arbiter” between the two: holding above resistance would support the interpretation that technical strength is becoming durable enough to influence rank-based models over time.
Within the range, the more subtle risk is signal drift: momentum can remain positive while price rotates, which may gradually weaken participation indicators and reduce confluence. A constructive retest behavior would typically see price respect the support zone and avoid repeated closes below it. By contrast, a clean breakdown below 12.8500 would be a direct conflict with the bullish technical score and would likely force a reassessment of whether the current bullish confluence is merely late-cycle extension rather than sustainable trend.
5) Quant Technical Dashboard (18 Signals)
KGNAI AI Technical Analysis Score (Deep Reinforcement Learning): Rank #58 out of 1292 (Rank 1 represents the strongest technical positioning and a higher probability of favorable price behavior. As ranks increase toward the maximum, the probability of favorable outcomes weakens and bearish positioning becomes more dominant.) | Label: Bullish | Score: 0.910
18-Signal Technical Confluence Score: 0.667 (Bullish)
Overall Technical Score (18-signal confluence + DRL rank blend): 0.740 (Bullish)
Note: The blended score reflects signal strength weighted against broader AI technical ranking, which may temporarily diverge.
Blended technical score breakdown: 0.740 (Bullish | Bull 14 / Bear 2 / Neutral 2)
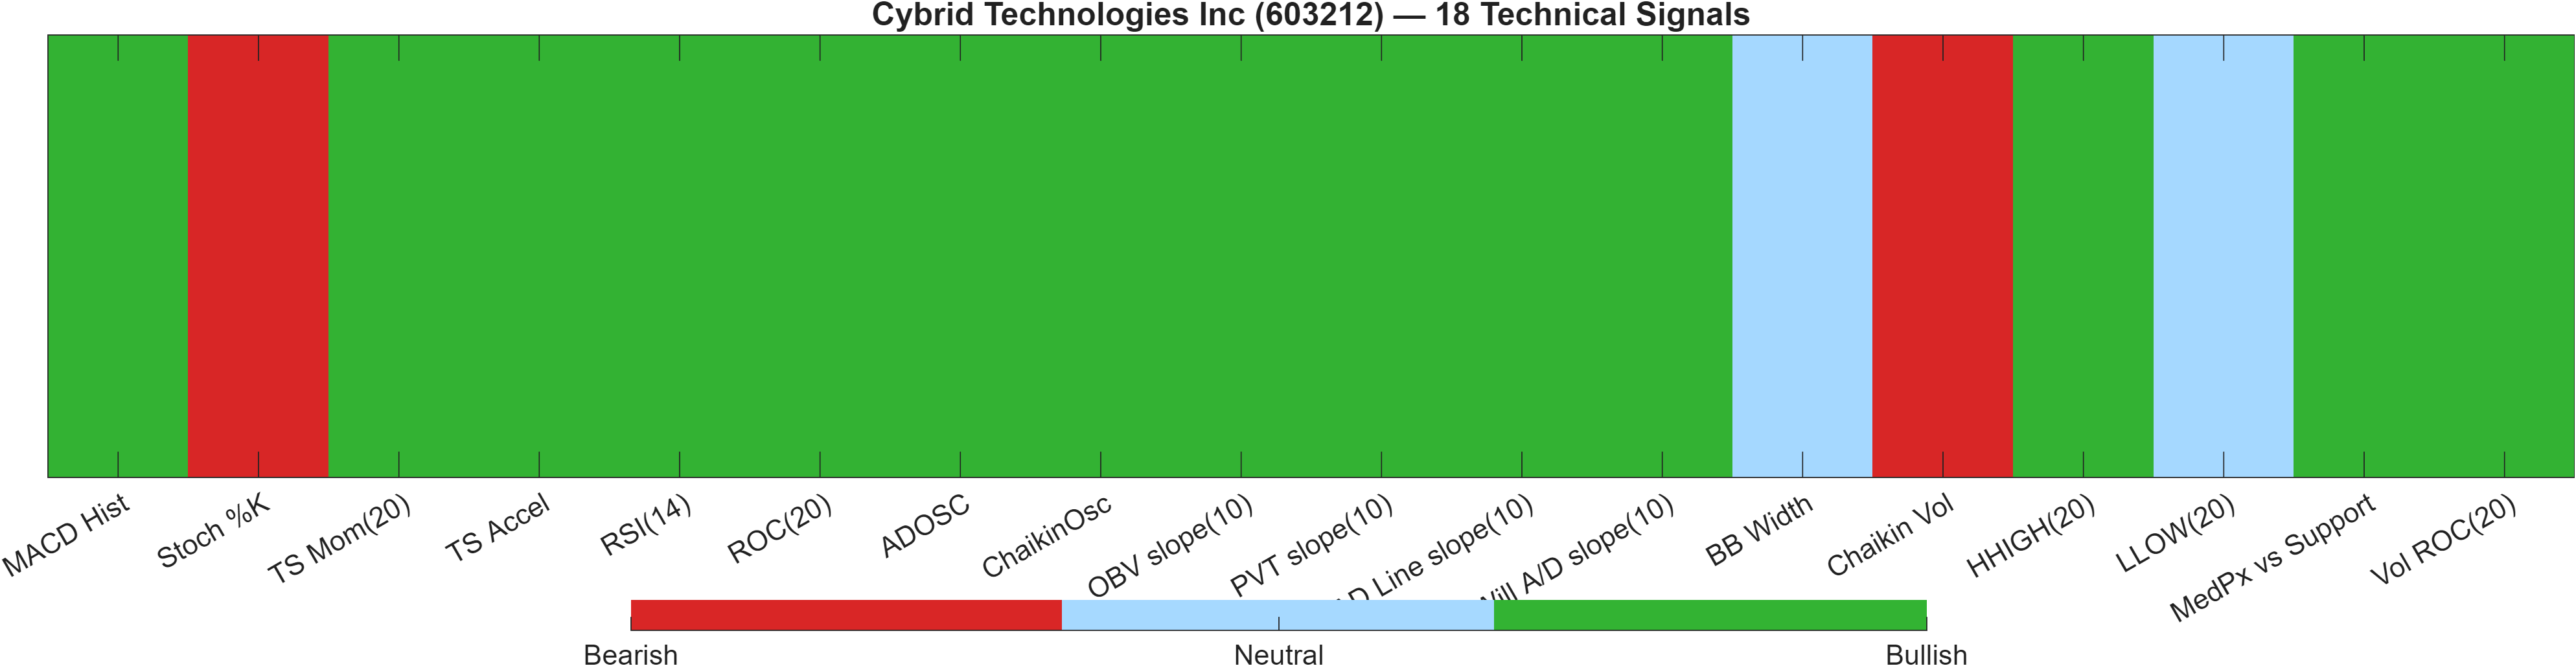
The technical layer is unambiguously constructive on this snapshot. The deep reinforcement learning model places 603212 at #58 out of 1292 (upper decile), with a score of 0.910 and a Bullish label. The broader 18-signal framework corroborates that view with a confluence score of 0.667 and an overall blended score of 0.740, while the distribution (Bull 14 / Bear 2 / Neutral 2) suggests breadth rather than a single-indicator spike.
The most decision-useful nuance is where the bearish readings sit. Momentum is strong, but the stochastic is flagged Bearish with Stoch %K at 99.64, consistent with “fully bid” conditions that can precede short-term pullbacks even in an uptrend. Separately, Chaikin Vol at 16.96 is bearish, which can occur when volatility dynamics lag or when the price advance is not accompanied by the type of intraperiod range expansion that this measure captures.
Offsetting those are multiple participation and rate-of-change confirmations: ROC(20) at 13.89 is bullish, volume-rate is aggressive with Vol ROC(20) at 128 bullish, and accumulation-style indicators such as ADOSC 68.42 are also bullish. Taken together, the dashboard reads as trend-supported, potentially overextended—a setup that often requires either (a) orderly consolidation above support, or (b) a clean breakout above resistance with volume to avoid mean-reversion dominating the next swing.
Signal table (Bull/Bear/Neutral)
| Indicator | Value | Signal |
|---|---|---|
| MACD Hist | 0.1364 | Bullish |
| Stoch %K | 99.64 | Bearish |
| TS Mom(20) | 2.02 | Bullish |
| TS Accel | 1.32 | Bullish |
| RSI(14) | 72.92 | Bullish |
| ROC(20) | 13.89 | Bullish |
| ADOSC | 68.42 | Bullish |
| ChaikinOsc | 8.299e+07 | Bullish |
| OBV slope(10) | 2.666e+08 | Bullish |
| PVT slope(10) | 6.389e+06 | Bullish |
| AD Line slope(10) | 2.614e+08 | Bullish |
| Will A/D slope(10) | 5.85 | Bullish |
| BB Width | 0.2032 | Neutral |
| Chaikin Vol | 16.96 | Bearish |
| HHIGH(20) | 16.57 | Bullish |
| LLOW(20) | 13.8 | Neutral |
| MedPx vs Support | 3.34 | Bullish |
| Vol ROC(20) | 128 | Bullish |
Interpretation: Indicator-level signals form the base confluence, which is then adjusted using a separate AI-driven technical ranking model. The final technical score summarizes this combined view.
6) News sentiment + extractive gist
Note: Instrument-specific news matches were not found, so the digest includes broader market/sector headlines. Links are provided for verification.
Sentiment score (avg): -0.013 | Positive: 12% | Neutral: 69% | Negative: 19%
KGNAI AI News Sentiment Score (normalized -1 to +1): Not available (as of —) | Label: Not available | Overall news score: -0.01
Positive Developments
Recent coverage across major financial outlets indicates a modestly constructive backdrop for risk assets, with some reporting emphasizing resilience in parts of China’s trade and activity narrative. In the context of a technically constructive setup for 603212—where the blended technical score is 0.740 and participation indicators are broadly positive—this kind of macro “steadying” tone can act as a stabilizer rather than a direct driver. The sentiment distribution still shows only 12% positive items, so optimism is not dominant, but the overall mix can support gradual follow-through if markets remain orderly. For positioning, the key link is whether a calm macro tape allows price to test and potentially accept above the 16.1050 resistance zone without a volatility shock. When the news flow leans constructive but not euphoric, it often aligns with trend continuation attempts that require confirmation via volume and price structure rather than narrative momentum.
Neutral / Mixed Developments
The digest is largely neutral, consistent with the 69% neutral share and the near-flat average sentiment (-0.013). Coverage appears mixed and frequently informational, which tends to reduce the odds that headline-driven volatility overwhelms technical dynamics. In this environment, price behavior is more likely to be governed by endogenous signals—RSI, MACD, moving-average alignment, and support/resistance interactions—than by abrupt sentiment swings. That can be beneficial for interpreting technical confluence: if the market is not being whipsawed by event risk, the bullish breadth (14 bull vs 2 bear signals) has a clearer path to express itself. Still, a neutral news tape can also coincide with range-building phases, particularly when volatility measures like bandwidth (0.2032) remain contained.
Negative / Risk Signals
Despite the overall neutrality, risk signals remain present, reflected in the 19% negative share and the slightly negative aggregate score. Recent coverage across major outlets also highlights episodic geopolitical and policy/legal uncertainties, which can reintroduce volatility into China-linked equities even when single-name fundamentals are not the focus of the news flow. For 603212 specifically, the main analytical risk is not a single headline, but the interaction between elevated momentum (RSI(14) 72.92) and a potential volatility uptick that turns corrective rather than trend-confirming. A rapid negative shift in risk sentiment can pressure breakouts, converting the 16.1050 area into a rejection zone, while a deeper deterioration scenario is defined by a close below 12.8500. This keeps the technical strength case conditional on structure holding under stress.
- Whether price acceptance develops above 16.1050 with confirming participation.
- Whether volatility expands beyond the current 0.2032 bandwidth without breaking structure.
- Whether sentiment remains near-neutral (avg -0.013) or shifts materially toward negative.
Sources referenced: Reuters, Bloomberg, Yahoo Finance, MarketWatch, Investing.com
Snapshot: AI Rank (Short–Mid–Long): Neutral (Neutral–Neutral–Not available) · Technical Confluence: Bullish · Key Levels: Support ~12.85 | Resistance ~16.10 · News Sentiment: Neutral
7) Sources
Not available in the provided data.
You may also like: How KGNAI AI ranks instruments across global markets
Disclaimer: KGNAI provides AI-generated analytics and educational market commentary only. This is not financial advice. Markets involve risk. Always do your own research.