600309 (Wanhua Chemical Group Co Ltd) — 19-Jun-2026 Technical & Rank View: Long-Term Strength, Short-Term Neutrality
Wanhua Chemical Group Co Ltd (600309) presents a split profile across horizons as of 19-Jun-2026. Cross-sectional rankings remain Neutral in the short and mid windows (Daily #480, Weekly #710, Monthly #444 out of 1292), while longer horizons retain a distinctly stronger stance (3-Month #30, 6-Month #98, Yearly #15). Technically, moving-average structure reads bearish (close below MA50; MA50 below MA200), yet momentum inputs are not uniformly weak: MACD histogram is 0.2521 even as RSI(14) sits at 40.28. Volatility appears contained with Bollinger Bandwidth at 0.1378, implying the market may be in a decision phase rather than an impulsive trend. Key levels frame the risk map: support near 68.4883 and resistance near 90.5017. News sentiment metrics are mixed in presentation—headline matching is broad-market, with an average sentiment of -0.013 alongside a normalized score labeled 1.00.
- Rank stance: Short-term Neutral (Daily #480), mid-term Neutral (Weekly #710 / Monthly #444), long-term Bullish (Yearly #15; 3-Month #30).
- Technical confluence: Neutral (18-signal confluence 0.000; blended technical score 0.092; DRL technical rank #447).
- Key levels: Support ~ 68.4883 | Resistance ~ 90.5017.
- News sentiment bias: Largely Neutral distribution (Neutral 94%; Negative 6%) with avg sentiment -0.013 and a normalized label reading Bullish at 1.00.
- Confirmation / invalidation: A sustained break above 90.5017 with volume supports continuation; a close below 68.4883 increases deterioration risk.
KGNAI evaluates assets using large cross-sectional datasets built from millions of structured data points. Inputs incorporate fundamental metrics, technical structures, and systematically processed news sentiment. Statistical models, machine learning, and AI frameworks are used to assess relative positioning, signal alignment, and probabilistic behavior across broad universes.
- Ranks are comparative across the tracked universe, not absolute price targets.
- Confluence reflects alignment among independent signal groups.
- Support/resistance levels are probabilistic decision zones, not guarantees.
- Sentiment provides contextual bias within the broader analytical framework.
1) KGNAI AI Analysis
Region: CHINA
Total universe size: 1292 ranked instruments
- Daily rank: #480 out of 1292 — Neutral
- Weekly rank: #710 out of 1292 — Neutral
- Monthly rank: #444 out of 1292 — Neutral
- 3-Monthly rank: #30 out of 1292 — Bullish
- 6-Monthly rank: #98 out of 1292 — Bullish
- Yearly rank: #15 out of 1292 — Bullish
The rank curve across horizons is the defining feature: 600309 screens upper-decile over longer windows (Yearly #15; 3-Month #30) while remaining closer to the middle of the universe near-term (Daily #480; Weekly #710). This configuration often reflects a market that has retained longer-run relative strength but is currently digesting prior advances or working through a shorter-term drawdown. In other words, the longer-term profile remains constructive, but shorter-term confirmation is incomplete.
The term summary provided—Short-term: Neutral; Mid-term: Neutral; Long-term: Bullish—is consistent with the dispersion between weekly/monthly ranks and the much stronger yearly/quarterly positioning. For portfolio construction, this type of dispersion typically elevates the importance of timing and level selection: the long horizon is supportive, but near-term rank neutrality suggests that entry quality can matter more than usual.
The universe context (1292 instruments) also matters for interpretation. A move from the mid-pack (e.g., #444 monthly) into the top decile would usually require broad-based confirmation from independent technical modules, while a deterioration from #15 yearly would be more notable if it were accompanied by worsening signal alignment in the technical confluence layer. Until then, the ranking read is best characterized as long-horizon strength with short-horizon ambiguity.
Want the full universe and complete rank tables? Unlock full access on KGNAI: https://www.kgnai.com/pricing
2) Price & trend overview
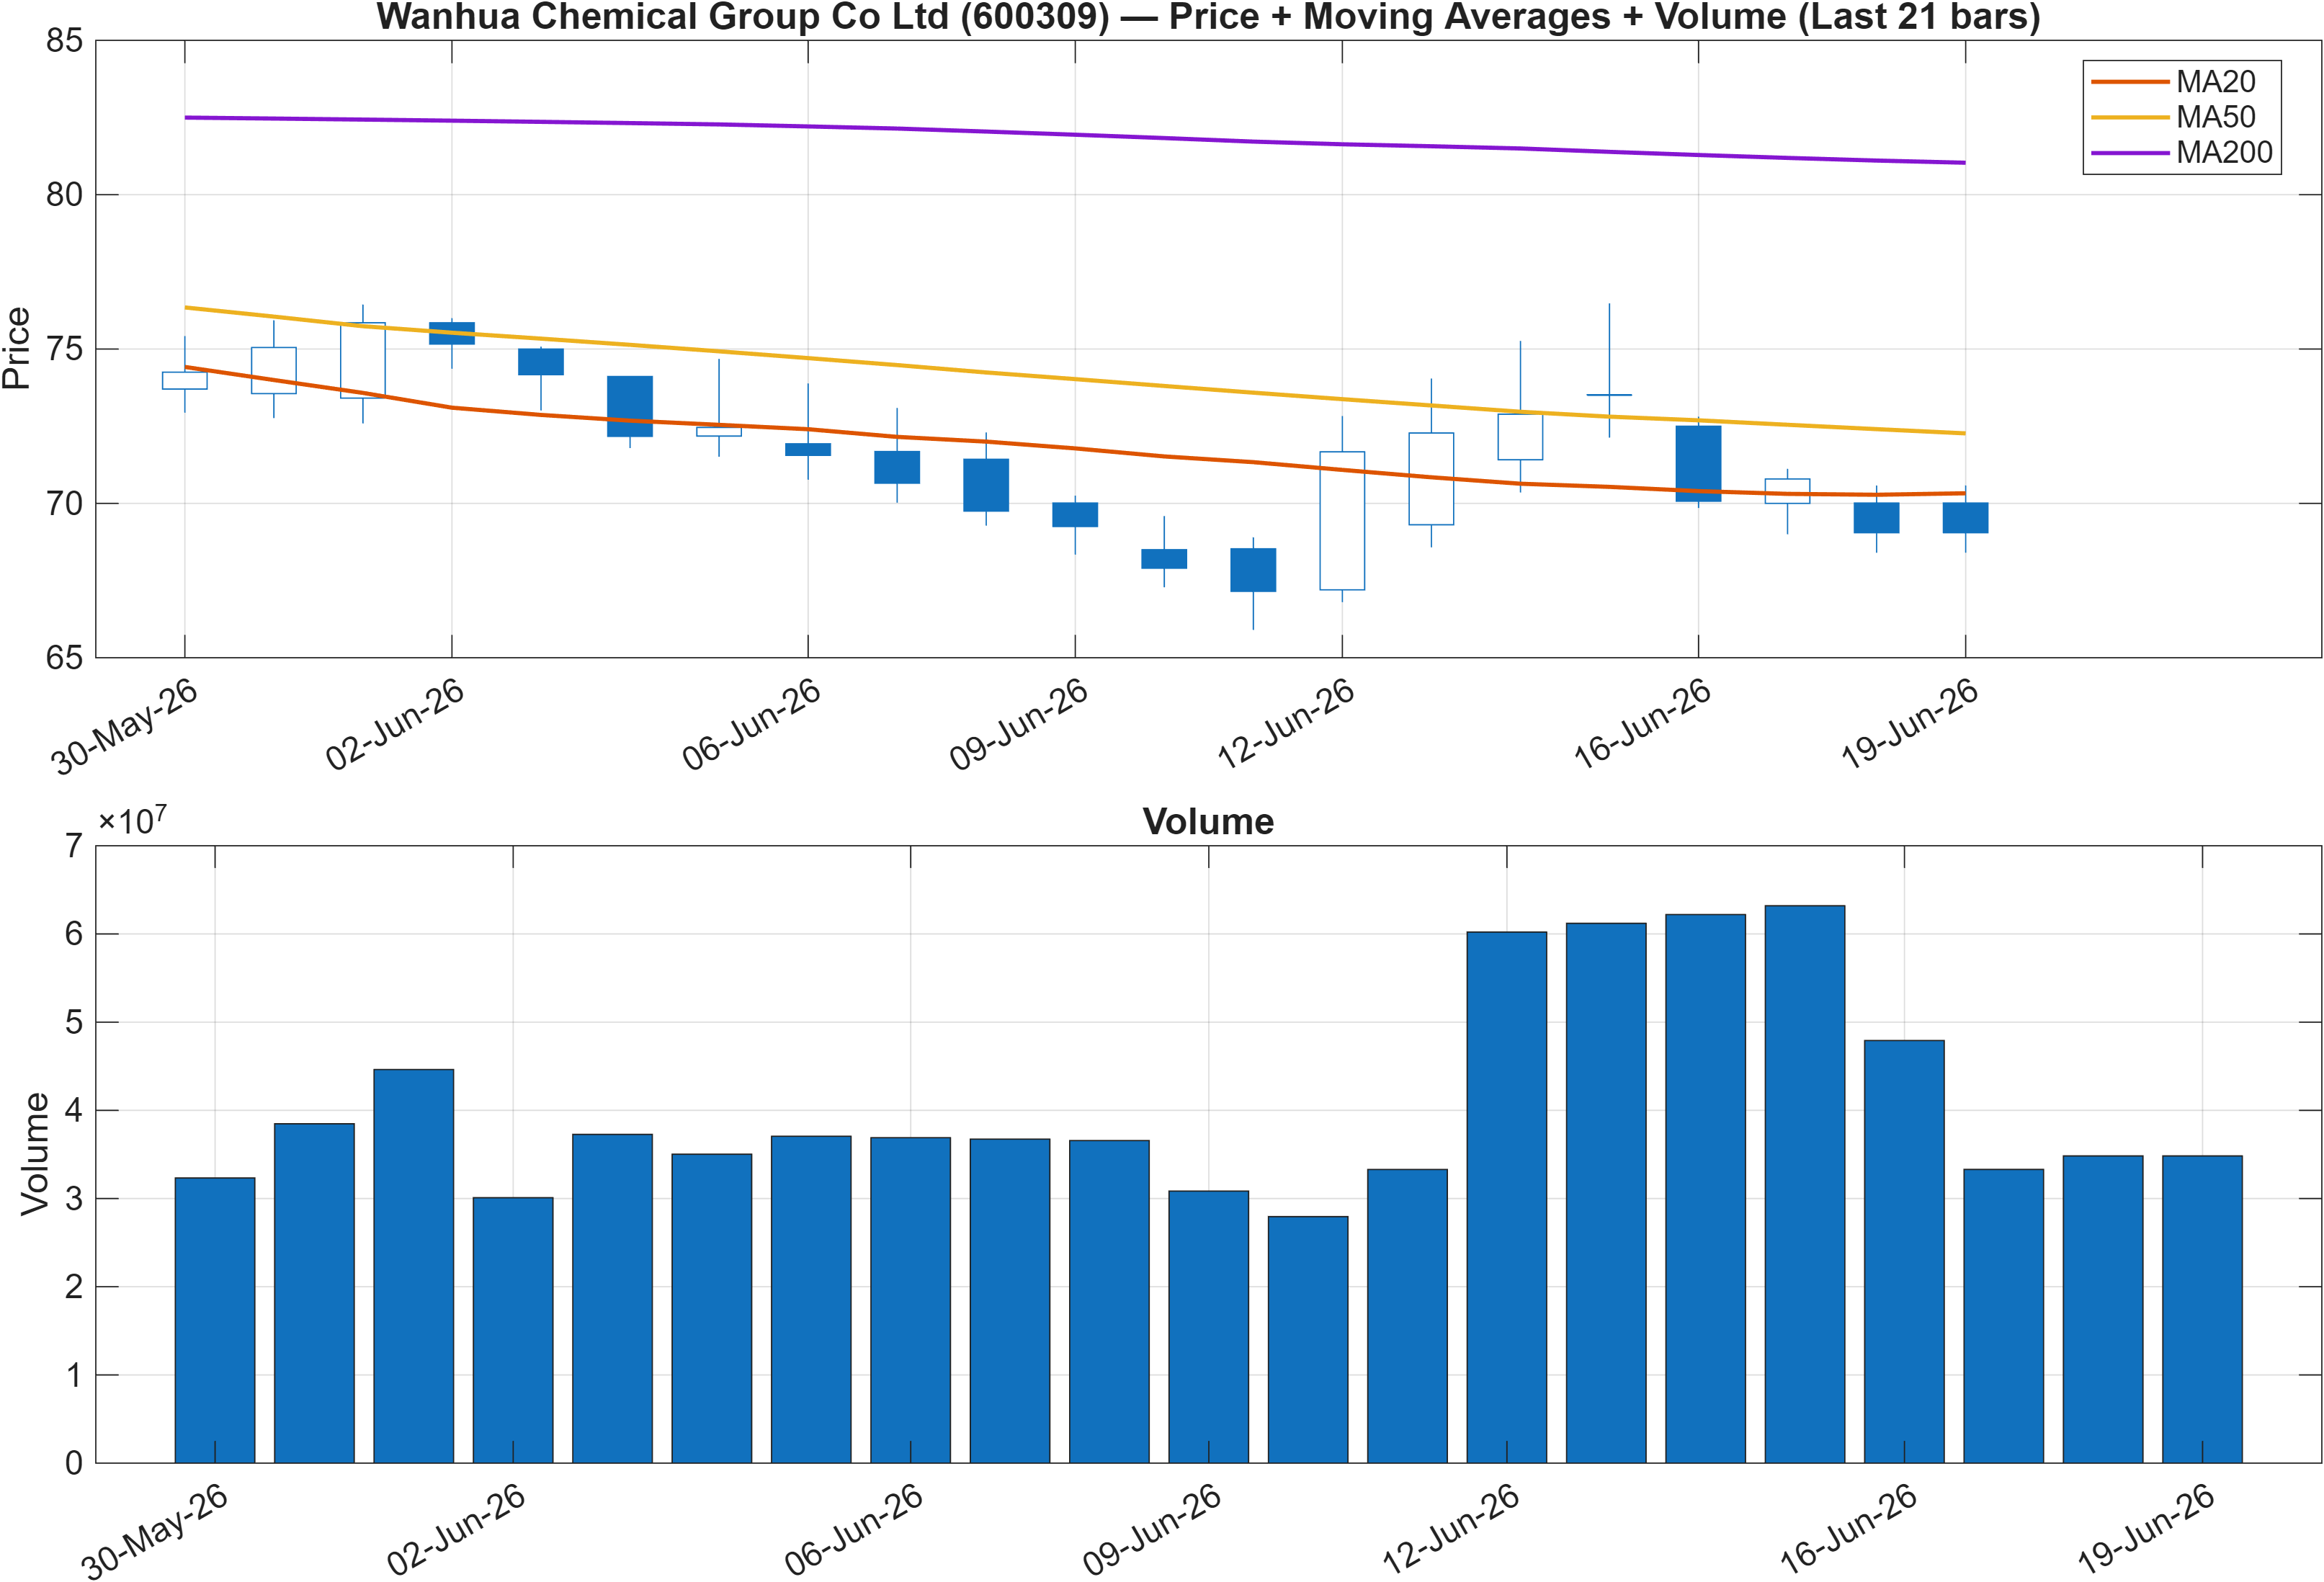
Interpretation: Close vs MA50 = Bearish, MA50 vs MA200 = Bearish.
The moving-average stack signals a trend regime that is not currently supported by classic trend-following confirmation. With the close below the MA50 and the MA50 below the MA200, the structure is aligned with a bearish slope hierarchy—often associated with either a late-stage downtrend or a recovery attempt that has not yet rebuilt medium-term support.
That said, the broader rank profile (notably the Yearly rank #15 and 3-Month rank #30) introduces a useful tension: the longer-horizon relative positioning remains strong even while price structure lags. When ranks stay strong but the MA regime turns negative, it can indicate that the instrument is still behaving better than most peers through the cycle, but the market is currently pricing in caution.
In this context, the most practical way to read Figure 1 is through regime transition risk. A bearish MA configuration tends to penalize momentum strategies; however, it can also set up sharper mean-reversion behavior if the market reclaims the MA50 and stabilizes. The nearby probabilistic decision zones—support at 68.4883 and resistance at 90.5017—become more important under a bearish MA stack because they often define the boundaries of “repair” versus renewed weakness.
Volume in Figure 1 should be treated as a confirmation tool rather than a primary signal. The scenario logic later in the report—break above resistance with volume versus closes below support—fits the idea that trend confirmation is currently conditional rather than persistent.
3) Momentum & volatility dashboard
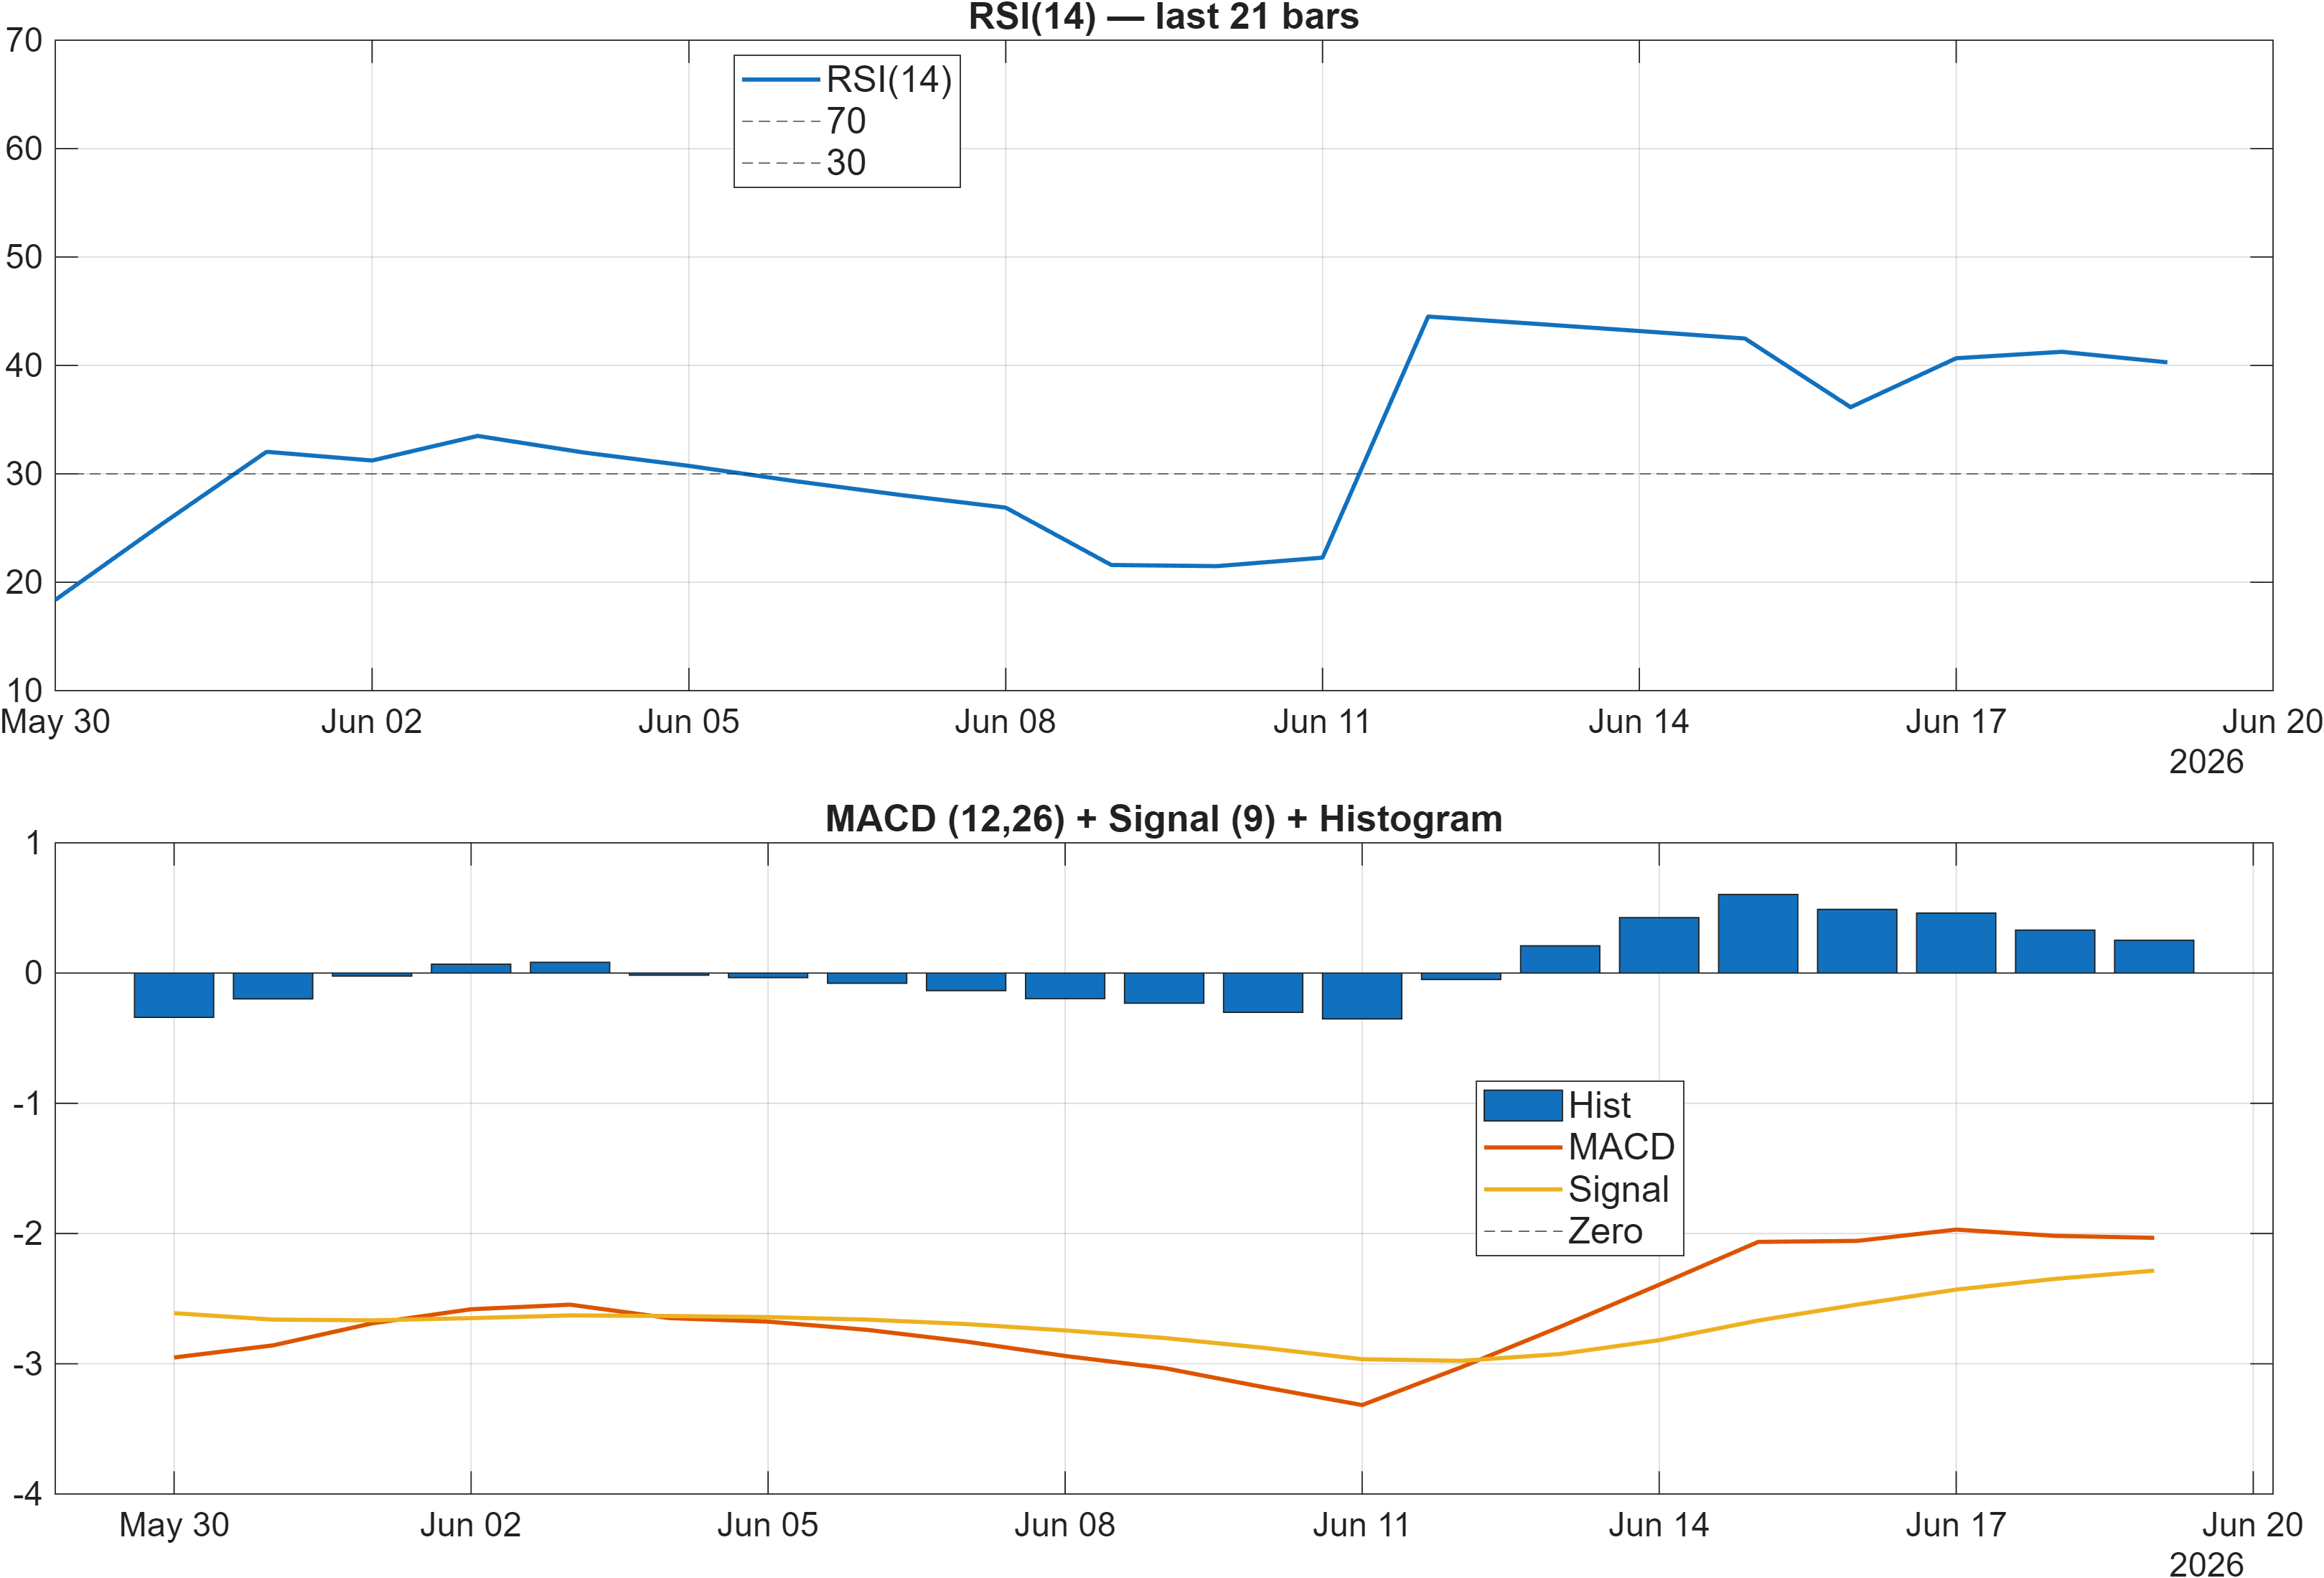
Interpretation: RSI bias = Neutral, MACD hist = 0.2521.
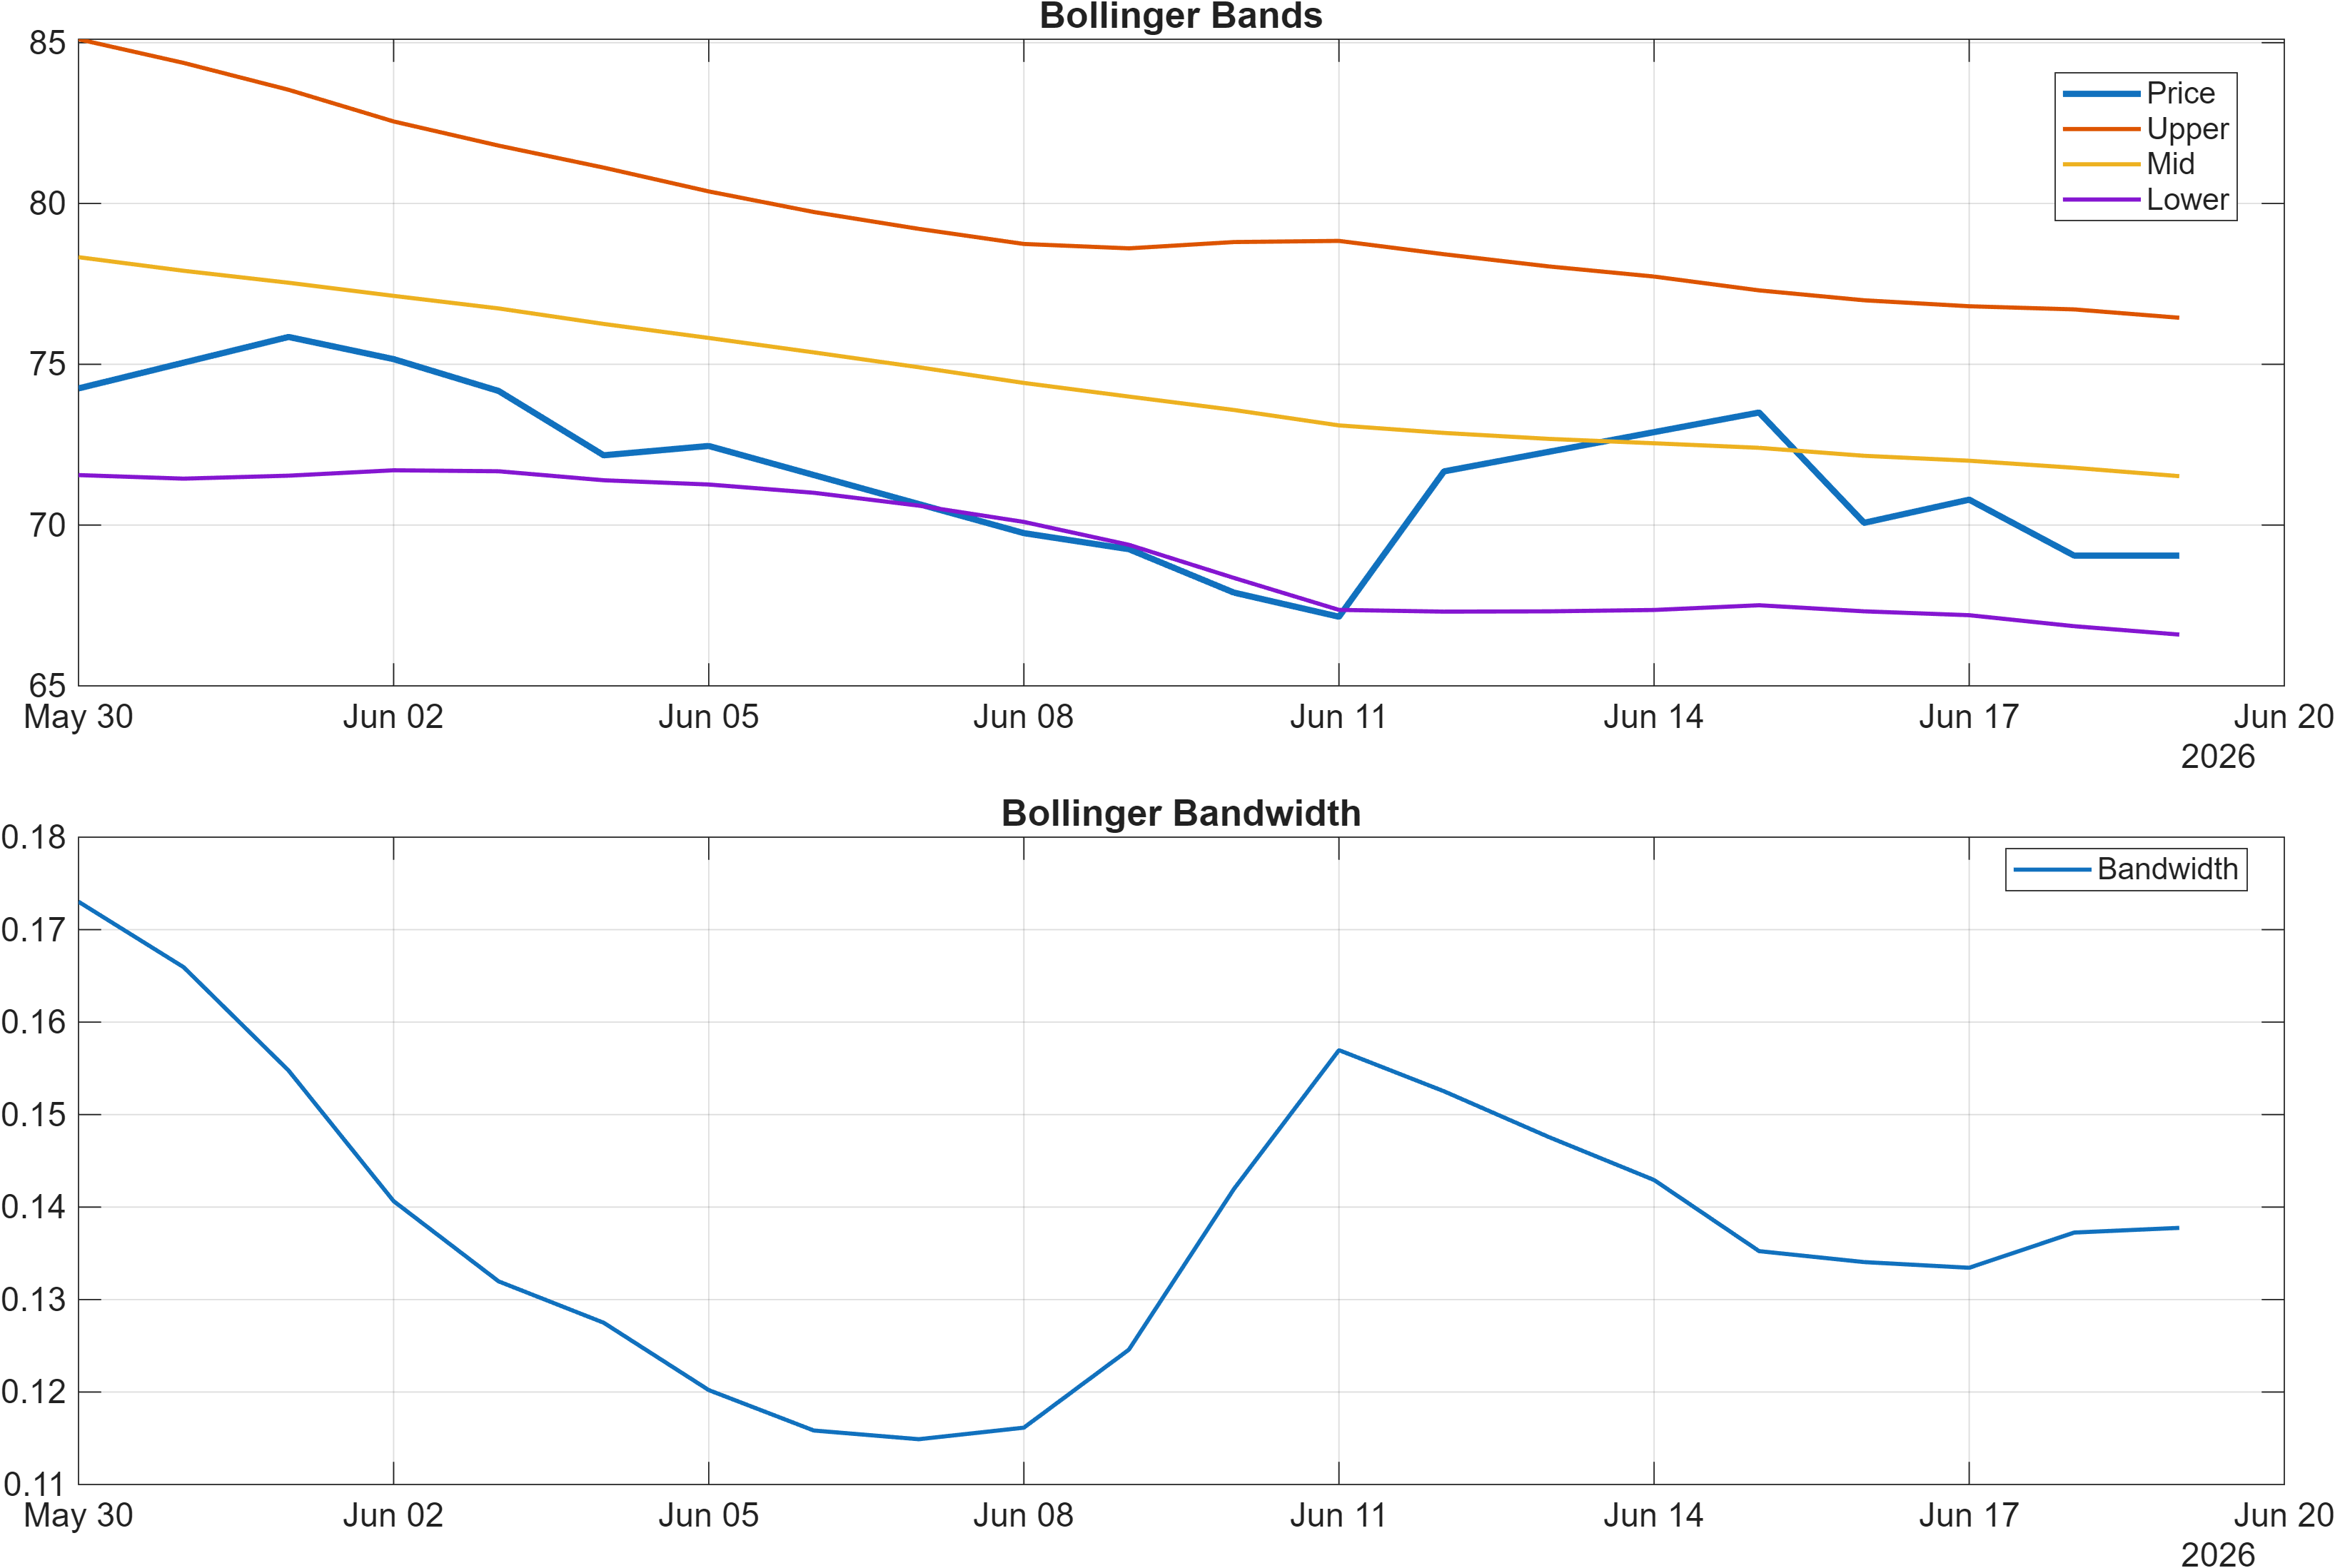
Interpretation: Bandwidth (volatility regime) latest = 0.1378.
Momentum is presently best described as mixed with early stabilization signals. On one hand, the MACD histogram at 0.2521 suggests positive momentum pressure relative to its recent trend—an ingredient that can precede recoveries. On the other hand, RSI(14) at 40.28 sits below the typical 50 midline, consistent with subdued demand and a market that has not fully transitioned back into bullish momentum.
This divergence—MACD improving while RSI remains depressed—often corresponds to a bottoming or basing process rather than a confirmed upswing. It can also align with the bearish moving-average regime in Section 2: trend structure may still be negative even as shorter-cycle momentum begins to lift. From a signal-discipline standpoint, that combination argues for treating any upside as conditional on follow-through, rather than assuming persistence.
Volatility adds another layer. Bollinger Bandwidth at 0.1378 implies a relatively contained volatility regime versus high-expansion conditions. Low-to-moderate bandwidth can mean the market is compressing and awaiting a catalyst, which naturally increases the relevance of the report’s defined decision levels (support 68.4883, resistance 90.5017). In compressed regimes, breakouts and breakdowns can become more discrete because price spends less time oscillating in wide ranges.
Taken together, the dashboard suggests a market where momentum is attempting to turn, but broader confirmation is not yet decisive. The near-term rank neutrality (Daily #480, Weekly #710) fits that interpretation: the market is not exhibiting broad, sustained strength versus peers in the immediate window.
4) Support / Resistance zones
Support ~ 68.4883 | Resistance ~ 90.5017
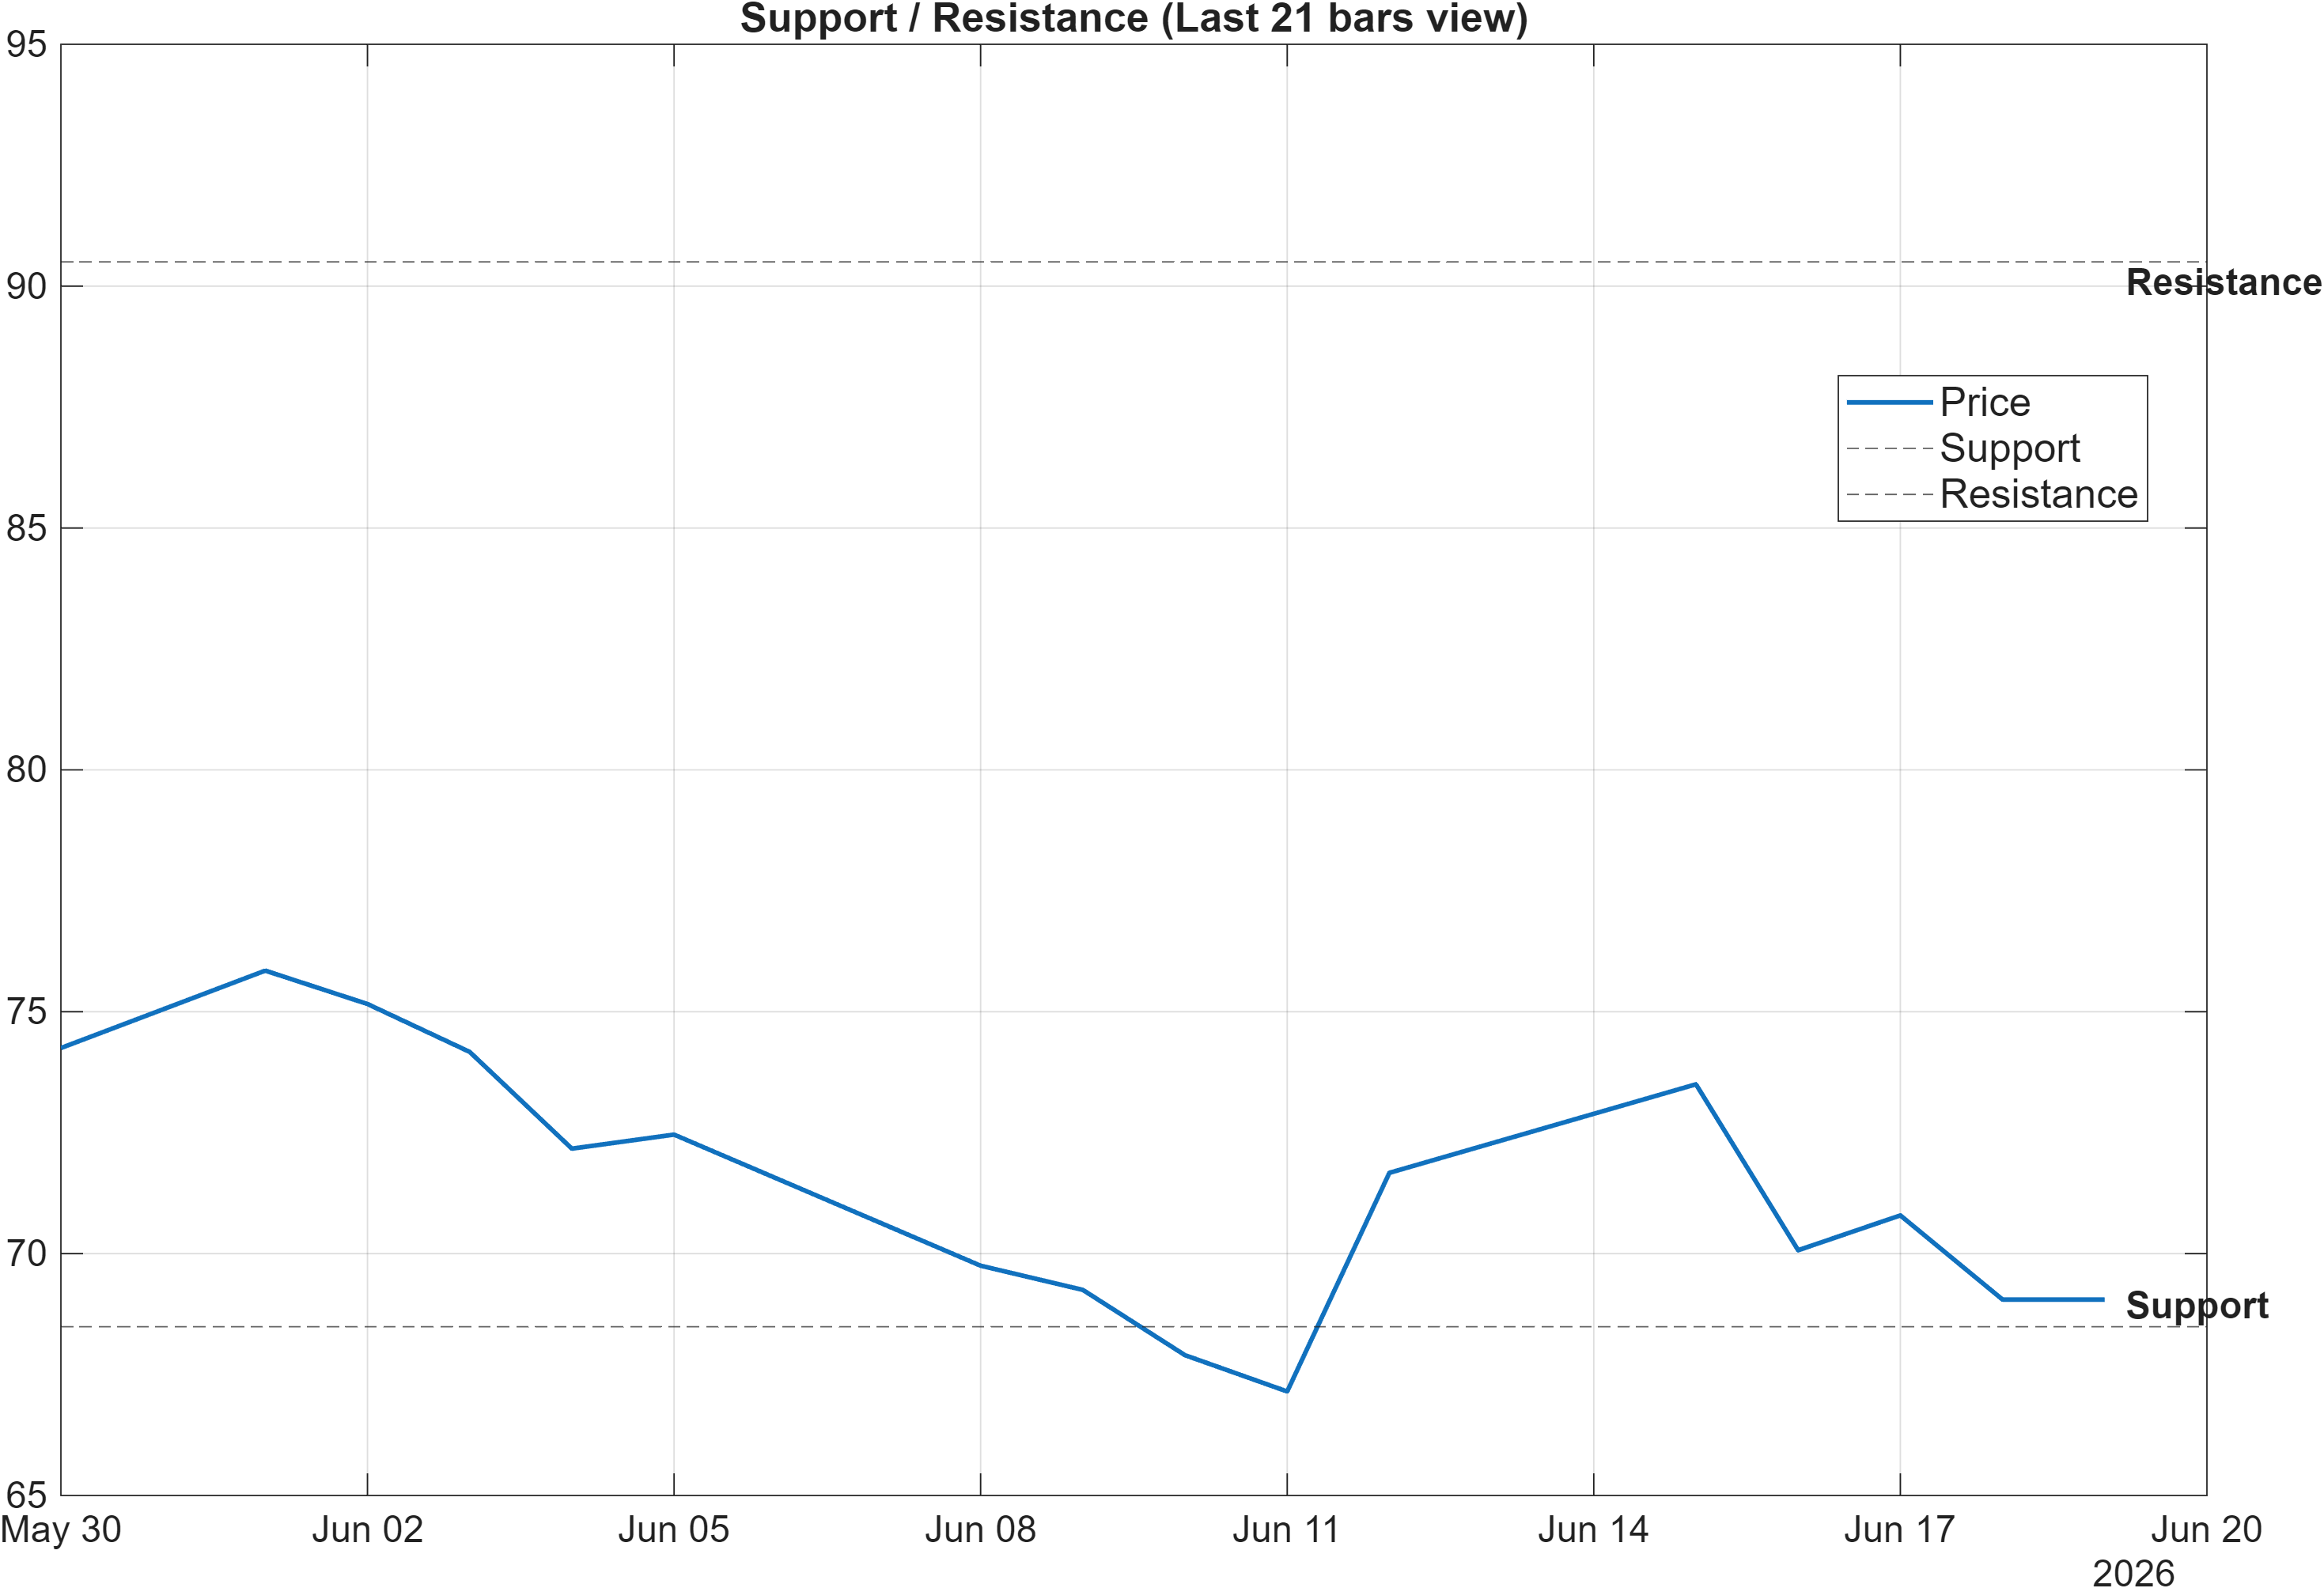
Scenario view: Break above resistance with volume → continuation. Close below support → signal deterioration risk.
The support/resistance map frames 600309’s current “decision corridor” between 68.4883 and 90.5017. With the moving-average regime bearish and momentum indicators mixed, these zones carry extra analytical weight: they represent where the market is most likely to reveal whether the current phase is consolidation within a larger constructive profile (supported by the Yearly rank #15) or a deeper drawdown that begins to erode longer-horizon strength.
From a regime perspective, the resistance zone near 90.5017 is the clearest boundary for shifting from “attempted repair” to “trend continuation.” A break above resistance is explicitly conditioned on volume in the scenario view, which is consistent with typical breakout validation practices: higher participation helps reduce false-break risk, particularly when broader confluence is neutral.
Conversely, a close below 68.4883 would align with the report’s stated deterioration risk. That condition matters because it would likely reinforce bearish trend structure (already flagged via MA relationships) and could pressure momentum readings such as RSI(14) at 40.28 further downward. In a compressed volatility regime (Bandwidth 0.1378), downside breaches can sometimes extend faster than expected because the market may be positioned for stability.
Practically, these zones can be treated as probabilistic decision levels rather than deterministic triggers. They help anchor process: confirm breakouts with participation, and treat repeated failures to reclaim key overhead supply as evidence that neutrality may persist.
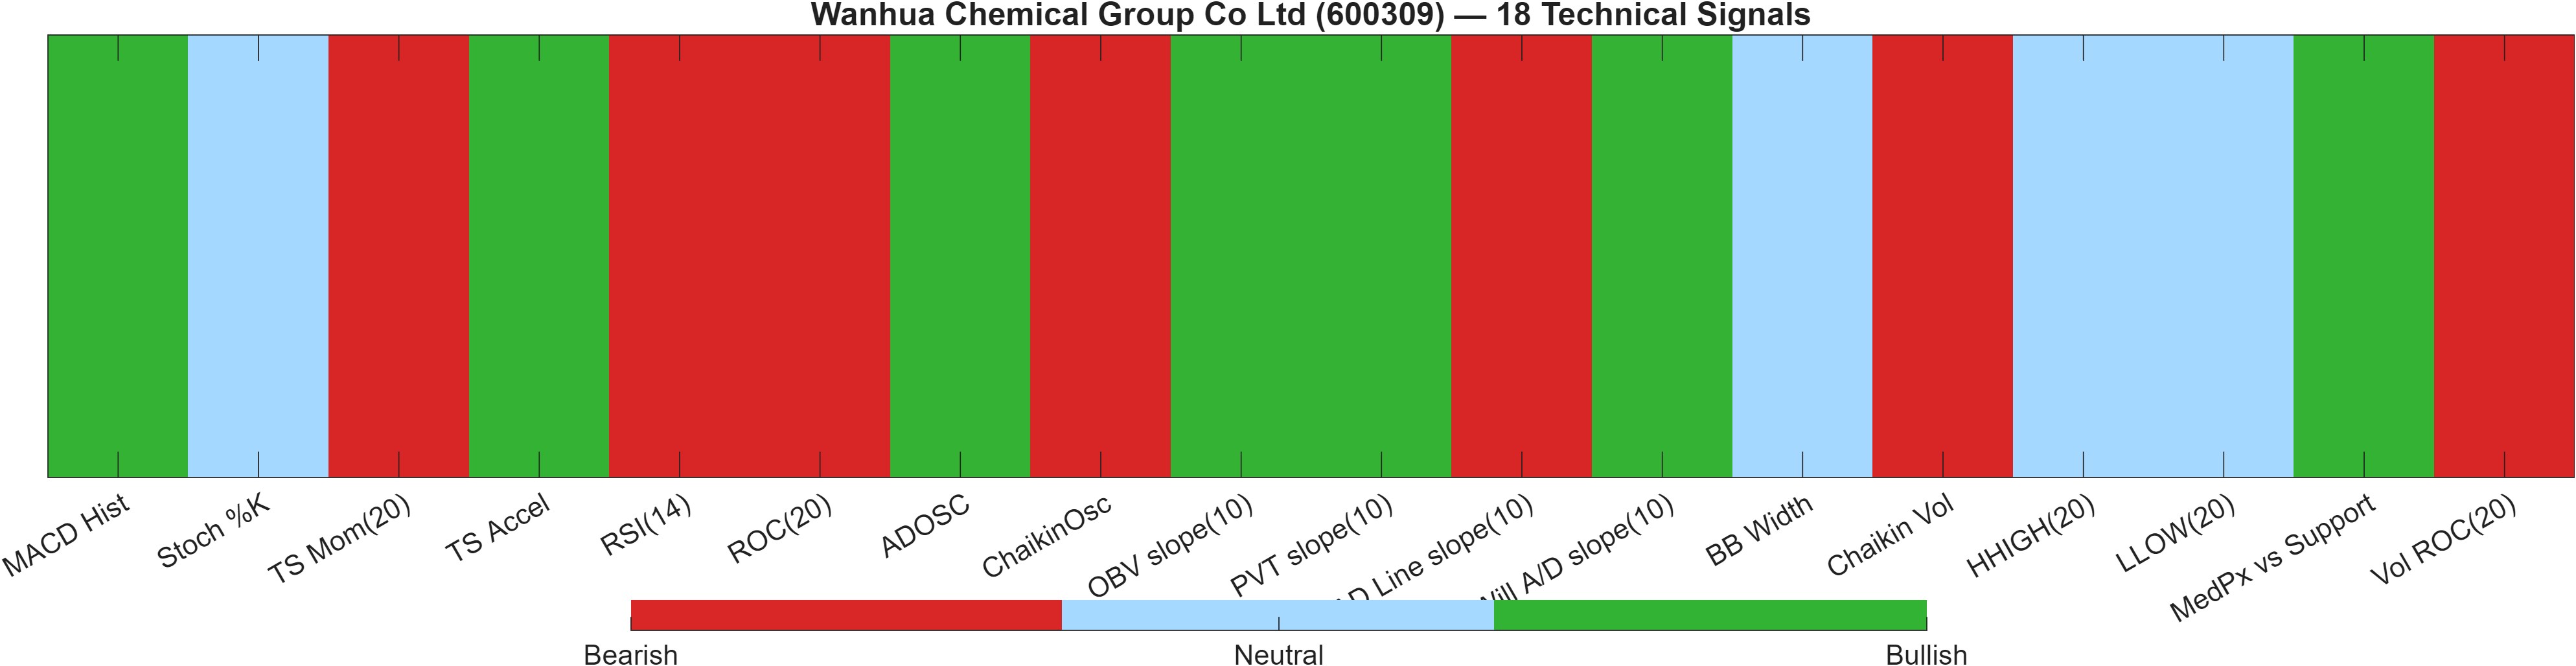
5) Quant Technical Dashboard (18 Signals)
KGNAI AI Technical Analysis Score (Deep Reinforcement Learning): Rank #447 out of 1292 (Rank 1 represents the strongest technical positioning and a higher probability of favorable price behavior. As ranks increase toward the maximum, the probability of favorable outcomes weakens and bearish positioning becomes more dominant.) | Label: Neutral | Score: 0.308
18-Signal Technical Confluence Score: 0.000 (Neutral)
Overall Technical Score (18-signal confluence + DRL rank blend): 0.092 (Neutral)
Note: The blended score reflects signal strength weighted against broader AI technical ranking, which may temporarily diverge.
Blended technical score breakdown: 0.092 (Neutral | Bull 7 / Bear 7 / Neutral 4)
Signal-level alignment and divergence
| Indicator | Value | Signal |
|---|---|---|
| MACD Hist | 0.2521 | Bullish |
| Stoch %K | 29.77 | Neutral |
| TS Mom(20) | -6 | Bearish |
| TS Accel | 2.24 | Bullish |
| RSI(14) | 40.28 | Bearish |
| ROC(20) | -7.995 | Bearish |
| ADOSC | 27.98 | Bullish |
| ChaikinOsc | -2.006e+07 | Bearish |
| OBV slope(10) | 1.361e+08 | Bullish |
| PVT slope(10) | 1.965e+06 | Bullish |
| AD Line slope(10) | -2.708e+07 | Bearish |
| Will A/D slope(10) | 5.66 | Bullish |
| BB Width | 0.1378 | Neutral |
| Chaikin Vol | 19.12 | Bearish |
| HHIGH(20) | 76.48 | Neutral |
| LLOW(20) | 65.9 | Neutral |
| MedPx vs Support | 1.002 | Bullish |
| Vol ROC(20) | -9.476 | Bearish |
The technical layer is internally balanced, which explains the Neutral confluence score (0.000) and the neutral blended score (0.092). The breakdown (Bull 7 / Bear 7 / Neutral 4) highlights that the system is not seeing dominant agreement across independent indicators—often a hallmark of range behavior, transition phases, or a market where different participant horizons are in conflict.
A key divergence is the coexistence of a bullish MACD histogram (0.2521) with bearish momentum/strength metrics such as RSI(14) at 40.28 and ROC(20) at -7.995. This combination can occur when selling pressure has eased (helping MACD improve) but price has not regained sufficient strength to lift RSI or the rate-of-change profile into positive territory.
Volume and accumulation proxies are also split. OBV slope(10) is bullish (1.361e+08) and ADOSC is bullish (27.98), yet AD Line slope(10) is bearish (-2.708e+07) and Vol ROC(20) is bearish (-9.476). When accumulation measures disagree, the higher-level interpretation typically becomes conditional: the market may be attracting selective buying, but participation is not uniformly supportive.
The DRL technical rank (#447 of 1292; score 0.308) sits near the middle, reinforcing the message: technical evidence is sufficient to avoid a bearish classification, but not strong enough for bullish conviction.
6) News sentiment + extractive gist
Note: Instrument-specific news matches were not found, so the digest includes broader market/sector headlines. Links are provided for verification.
Sentiment score (avg): -0.013 | Positive: 0% | Neutral: 94% | Negative: 6%
KGNAI AI News Sentiment Score (normalized -1 to +1): 1.00 (as of 2026-01-21) | Label: Bullish | Overall news score: 1.00
Positive Developments
Recent coverage across major financial outlets is dominated by low-intensity, non-instrument-specific items in the current scrape, which is consistent with the distribution showing 94% neutral classification and 0% positive. Even within that constraint, the news-scoring layer reports a normalized reading of 1.00 (Bullish, dated 2026-01-21), implying the model’s broader news context is not registering persistent downside skew despite the slightly negative average sentiment of -0.013. For readers, the practical takeaway is that the sentiment system is not currently flagging a headline-driven stress regime around this ticker based on the available matches. In that setting, technical factors—such as MACD histogram 0.2521 versus RSI(14) 40.28—tend to carry more weight for near-term decision-making than thematic news flow.
Neutral / Mixed Developments
The dataset explicitly states that instrument-specific matches were not found, and the digest therefore reflects broader market/sector headlines rather than issuer-level developments. This limitation can create a gap between the labeled news stance (normalized score 1.00) and the observed94%, Negative 6%, avg -0.013). In analytical terms, the news layer here should be treated as contextual bias rather than a primary catalyst indicator. When news relevance is low, it is generally more reliable to anchor on the report’s objective price structure—bearish MA configuration and a neutral confluence score (0.000)—and use sentiment only to understand whether the environment is broadly risk-on or risk-off in the processed feed.
Negative / Risk Signals
The direct risk signal in this section is not a surge in negative headlines but rather the data coverage constraint and the presence of a small negative tail (Negative 6%) with an average sentiment of -0.013. When combined with a bearish trend structure (close below MA50; MA50 below MA200) and several bearish momentum readings (e.g., RSI(14) 40.28, ROC(20) -7.995), the absence of issuer-specific news can leave price action as the primary arbiter of risk. Under these conditions, the most actionable “risk signal” is level-based: a close below 68.4883 would align the technical and trend layers toward deterioration, while repeated rejection near 90.5017 can keep the instrument locked in neutral-to-bearish structure even if longer-horizon ranks remain strong (Yearly #15).
- What to monitor next: Whether price can reclaim overhead supply into the 90.5017 resistance zone with confirming participation.
- What to monitor next: Any drift in momentum alignment—MACD histogram 0.2521 holding while RSI(14) lifts from 40.28—as a sign of improving internal breadth.
- What to monitor next: Downside integrity of 68.4883 support in a low-to-moderate volatility regime (Bandwidth 0.1378).
Sources referenced: Reuters, Bloomberg, Yahoo Finance, MarketWatch, Investing.com
Snapshot: AI Rank (Short–Mid–Long): Mixed (Neutral–Neutral–Bullish) · Technical Confluence: Neutral · Key Levels: Support ~68.49 | Resistance ~90.50 · News Sentiment: Neutral
7) Sources
Not available in the provided data.
You may also like: How KGNAI AI ranks instruments across global markets
Disclaimer: KGNAI provides AI-generated analytics and educational market commentary only. This is not financial advice. Markets involve risk. Always do your own research.