NARI Technology Co Ltd (600406) — 07-Jun-2026 Technicals Diverge Despite Bullish Ranks
NARI Technology Co Ltd (600406) screens as broadly constructive in KGNAI’s cross-sectional ranking framework, with Bullish term views across short-, mid-, and long-horizon rank sets. However, the technical layer is meaningfully weaker: the 18-signal confluence remains Bearish and the AI technical rank is deep in the lower tier of the universe, indicating price structure and momentum have not confirmed the stronger relative ranking profile. Momentum gauges reinforce the caution, with RSI showing a bearish bias and MACD histogram negative at -0.1968. Volatility is not extreme but is active enough to widen execution risk, with Bollinger Bandwidth at 0.1662. From a market-structure standpoint, the key decision is whether price can stabilize above the 24.6000 support zone and reclaim the 27.3717 resistance area; those levels frame continuation versus deterioration risk. News tone is broadly neutral (avg sentiment -0.037), offering limited directional reinforcement.
- Rank stance: Short / Mid / Long ranks are Bullish (notably strong at #22 on the 3-month horizon).
- Technical confluence: Bearish (Overall Technical Score -0.668).
- Key levels: Support near 24.6000; resistance near 27.3717.
- News sentiment bias: Neutral (avg -0.037; 88% neutral).
- Confirmation / invalidation: A sustained reclaim of 27.3717 with volume supports continuation; a close below 24.6000 elevates deterioration risk.
KGNAI evaluates assets using large cross-sectional datasets built from millions of structured data points. Inputs incorporate fundamental metrics, technical structures, and systematically processed news sentiment. Statistical models, machine learning, and AI frameworks are used to assess relative positioning, signal alignment, and probabilistic behavior across broad universes.
- Ranks are comparative across the tracked universe, not absolute price targets.
- Confluence reflects alignment among independent signal groups.
- Support/resistance levels are probabilistic decision zones, not guarantees.
- Sentiment provides contextual bias within the broader analytical framework.
1) KGNAI AI Analysis
Region: CHINA
Total universe size: 1292 ranked instruments
- Daily rank: #219 out of 1292 — Bullish
- Weekly rank: #184 out of 1292 — Bullish
- Monthly rank: #190 out of 1292 — Bullish
- 3-Monthly rank: #22 out of 1292 — Bullish
- 6-Monthly rank: #39 out of 1292 — Bullish
- Yearly rank: #133 out of 1292 — Bullish
Cross-sectional strength vs. on-chart confirmation
Across the 1292-instrument China universe, 600406 sits in the upper portion of the distribution on most horizons, with the 3-month rank at #22 and the 6-month rank at #39—both consistent with a top-decile profile. Shorter horizons are still constructive but less dominant (daily #219, weekly #184, monthly #190), implying that the relative advantage is stronger when viewed through a multi-month lens than in the most recent tape.
The key analytical tension is that these ranks are labeled Bullish across short, mid, and long term, while the technical composites later in the report skew decisively Bearish. When cross-sectional ranks stay strong while technical structure deteriorates, it often signals relative resilience rather than immediate upside traction: the instrument may be holding up better than peers in a challenging regime even if its own momentum is compressed.
Practically, the distribution of ranks (from #22 to #219) suggests a setup where timing matters more than selection. The ranks imply the name remains competitively positioned in the universe, but entry/exit discipline should be anchored to the price-based decision levels and momentum stabilization signals (e.g., RSI and MACD) rather than the rank label alone.
Term view: Short-term: Bullish. Mid-term: Bullish. Long-term: Bullish.
Want the full universe and complete rank tables? Unlock full access on KGNAI: https://www.kgnai.com/pricing
2) Price & trend overview
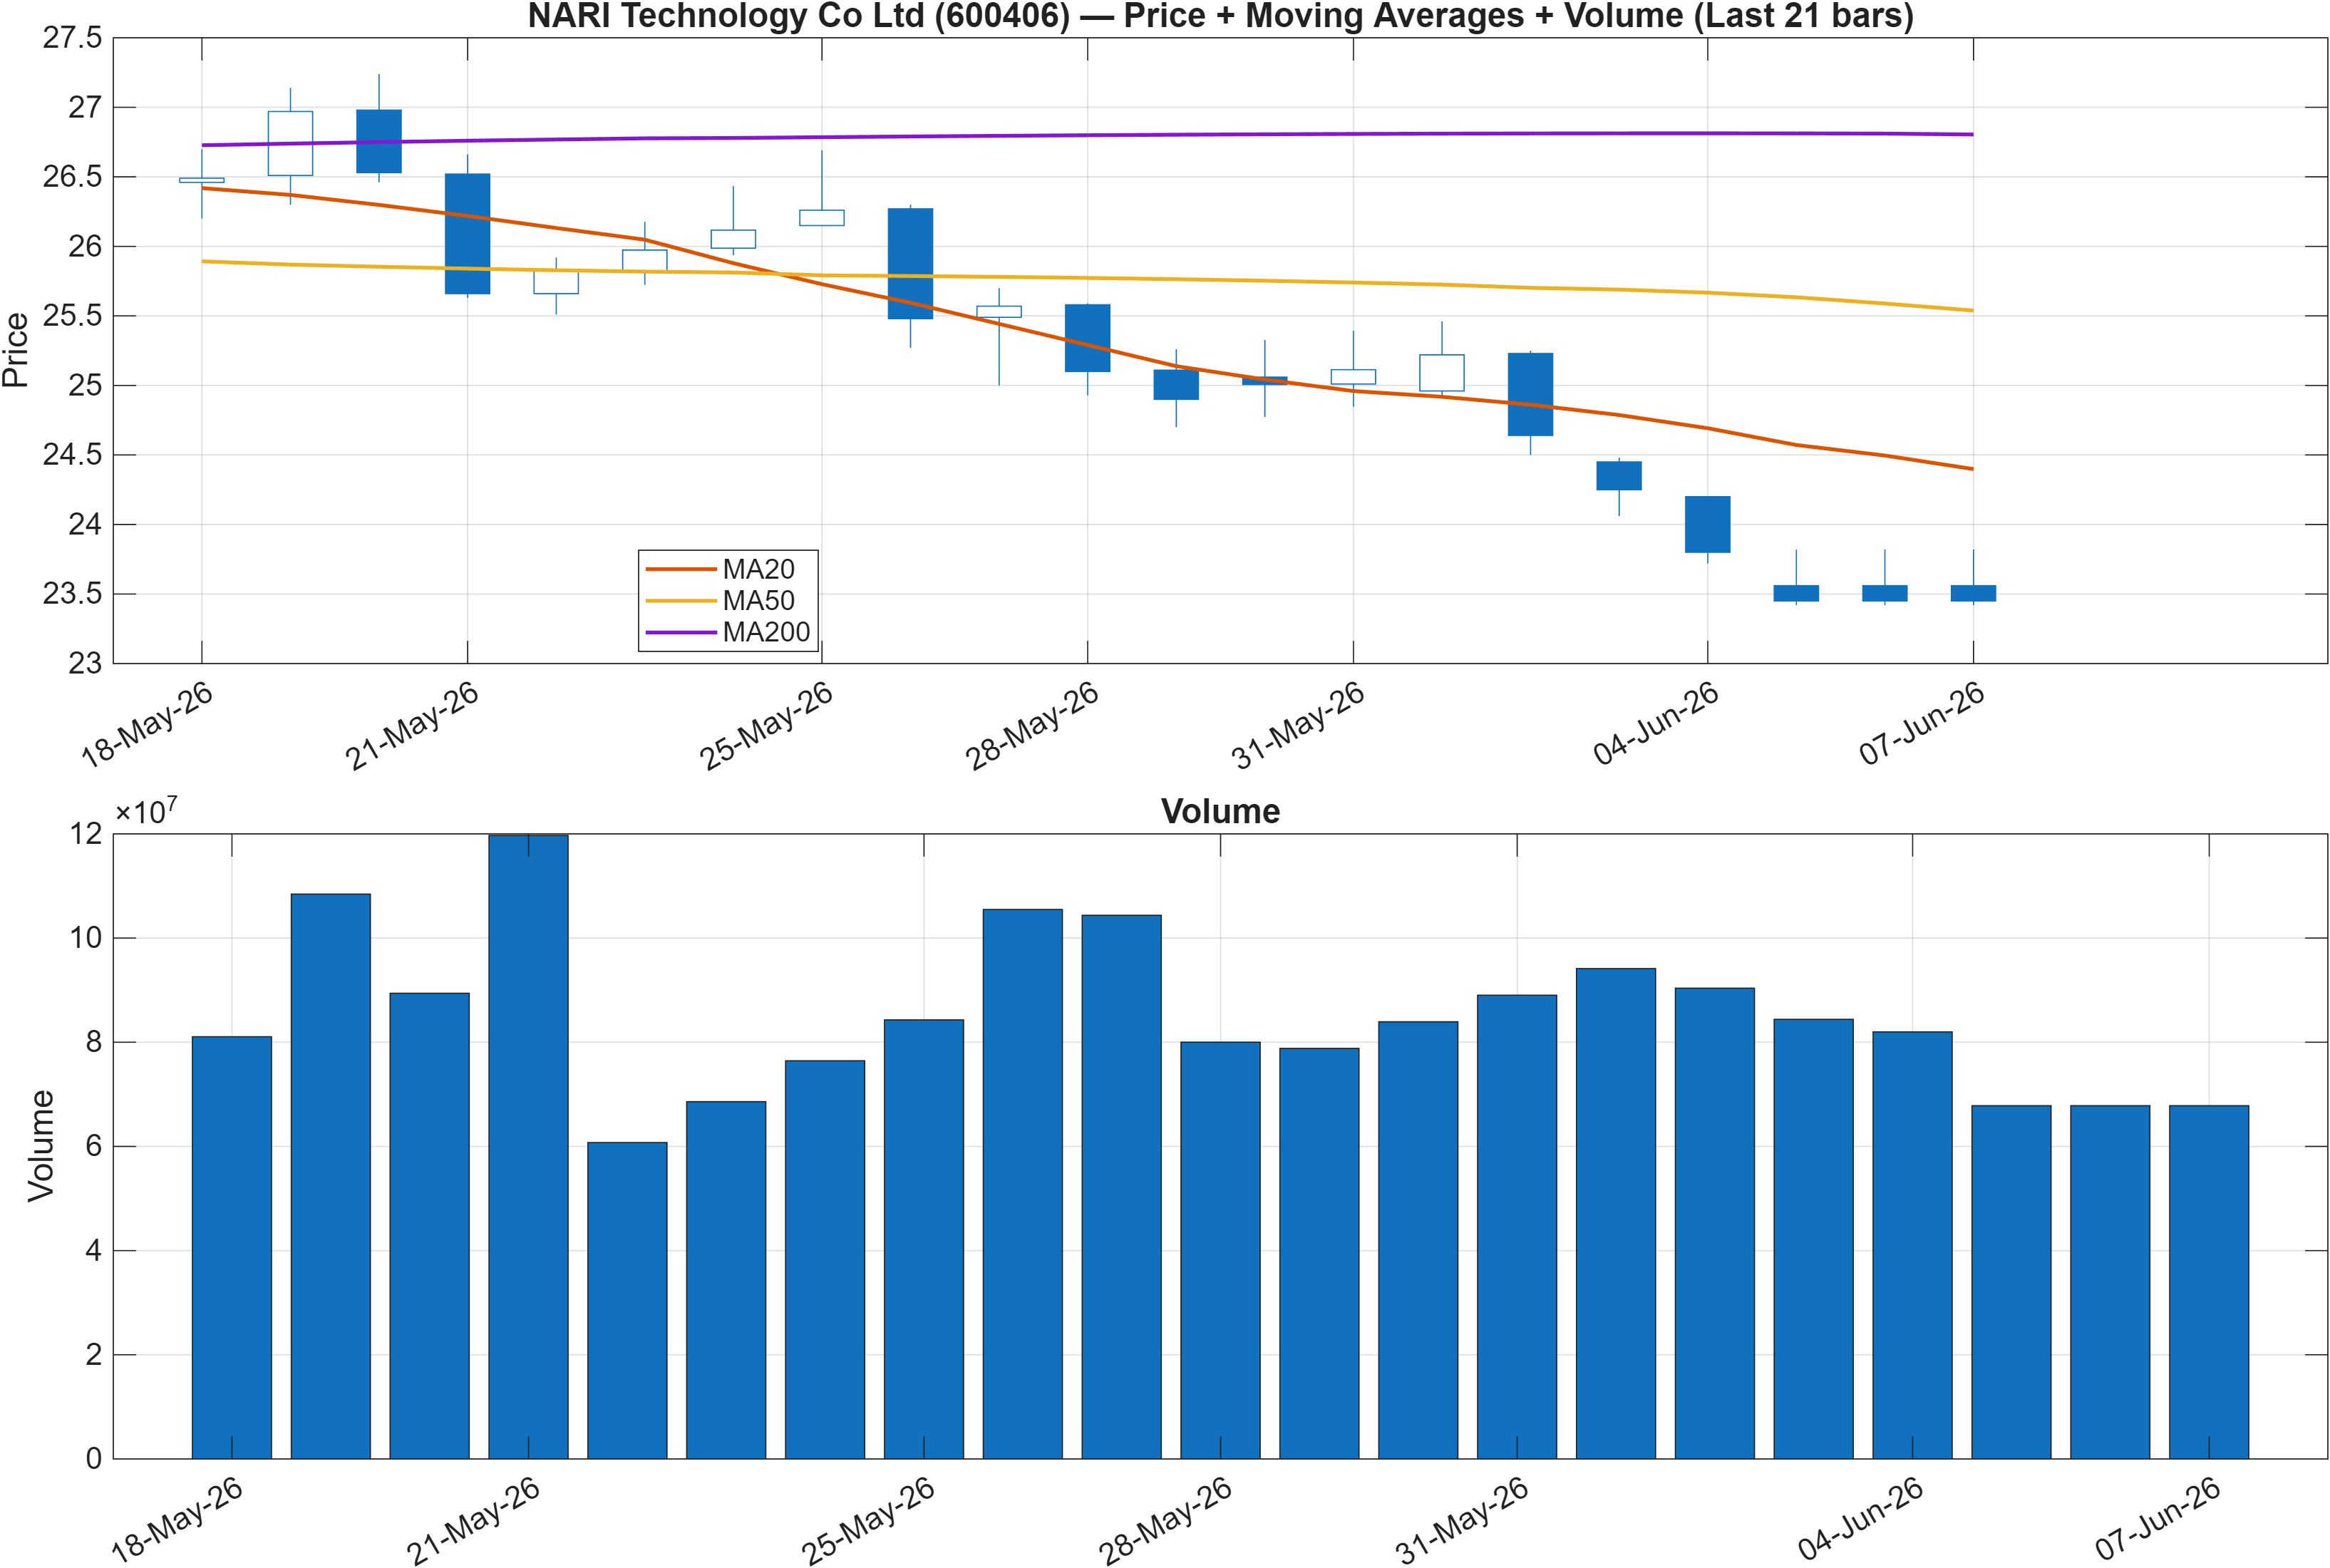
Trend regime: downside structure vs. rank support
The moving-average read is unambiguously risk-off: Close vs MA50 = Bearish and MA50 vs MA200 = Bearish. That combination typically reflects a market in which rallies are more likely to face overhead supply until the shorter moving average flattens and begins to recover relative to the longer one. In this context, the strong 3-month and 6-month ranks (#22 and #39) look less like “trend confirmation” and more like evidence that 600406 may be behaving better than the median peer even while its own trend structure remains pressured.
The more immediate question is whether price can transition from a declining trend state to a stabilization state. The report’s defined decision zones—support near 24.6000 and resistance near 27.3717—provide a clean framework for separating “range repair” from “trend continuation.” When MA configurations are bearish, resistance tends to matter more than usual; it becomes a practical test of whether supply is being absorbed.
Because the MA stack is still bearish, trend-following participation generally prefers evidence of recovery that is visible both in price structure and in momentum. With MACD histogram currently at -0.1968 and RSI bias bearish, the price/MA regime suggests treating bounces as conditional until the market can demonstrate persistence above key levels rather than only intraday attempts.
3) Momentum & volatility dashboard
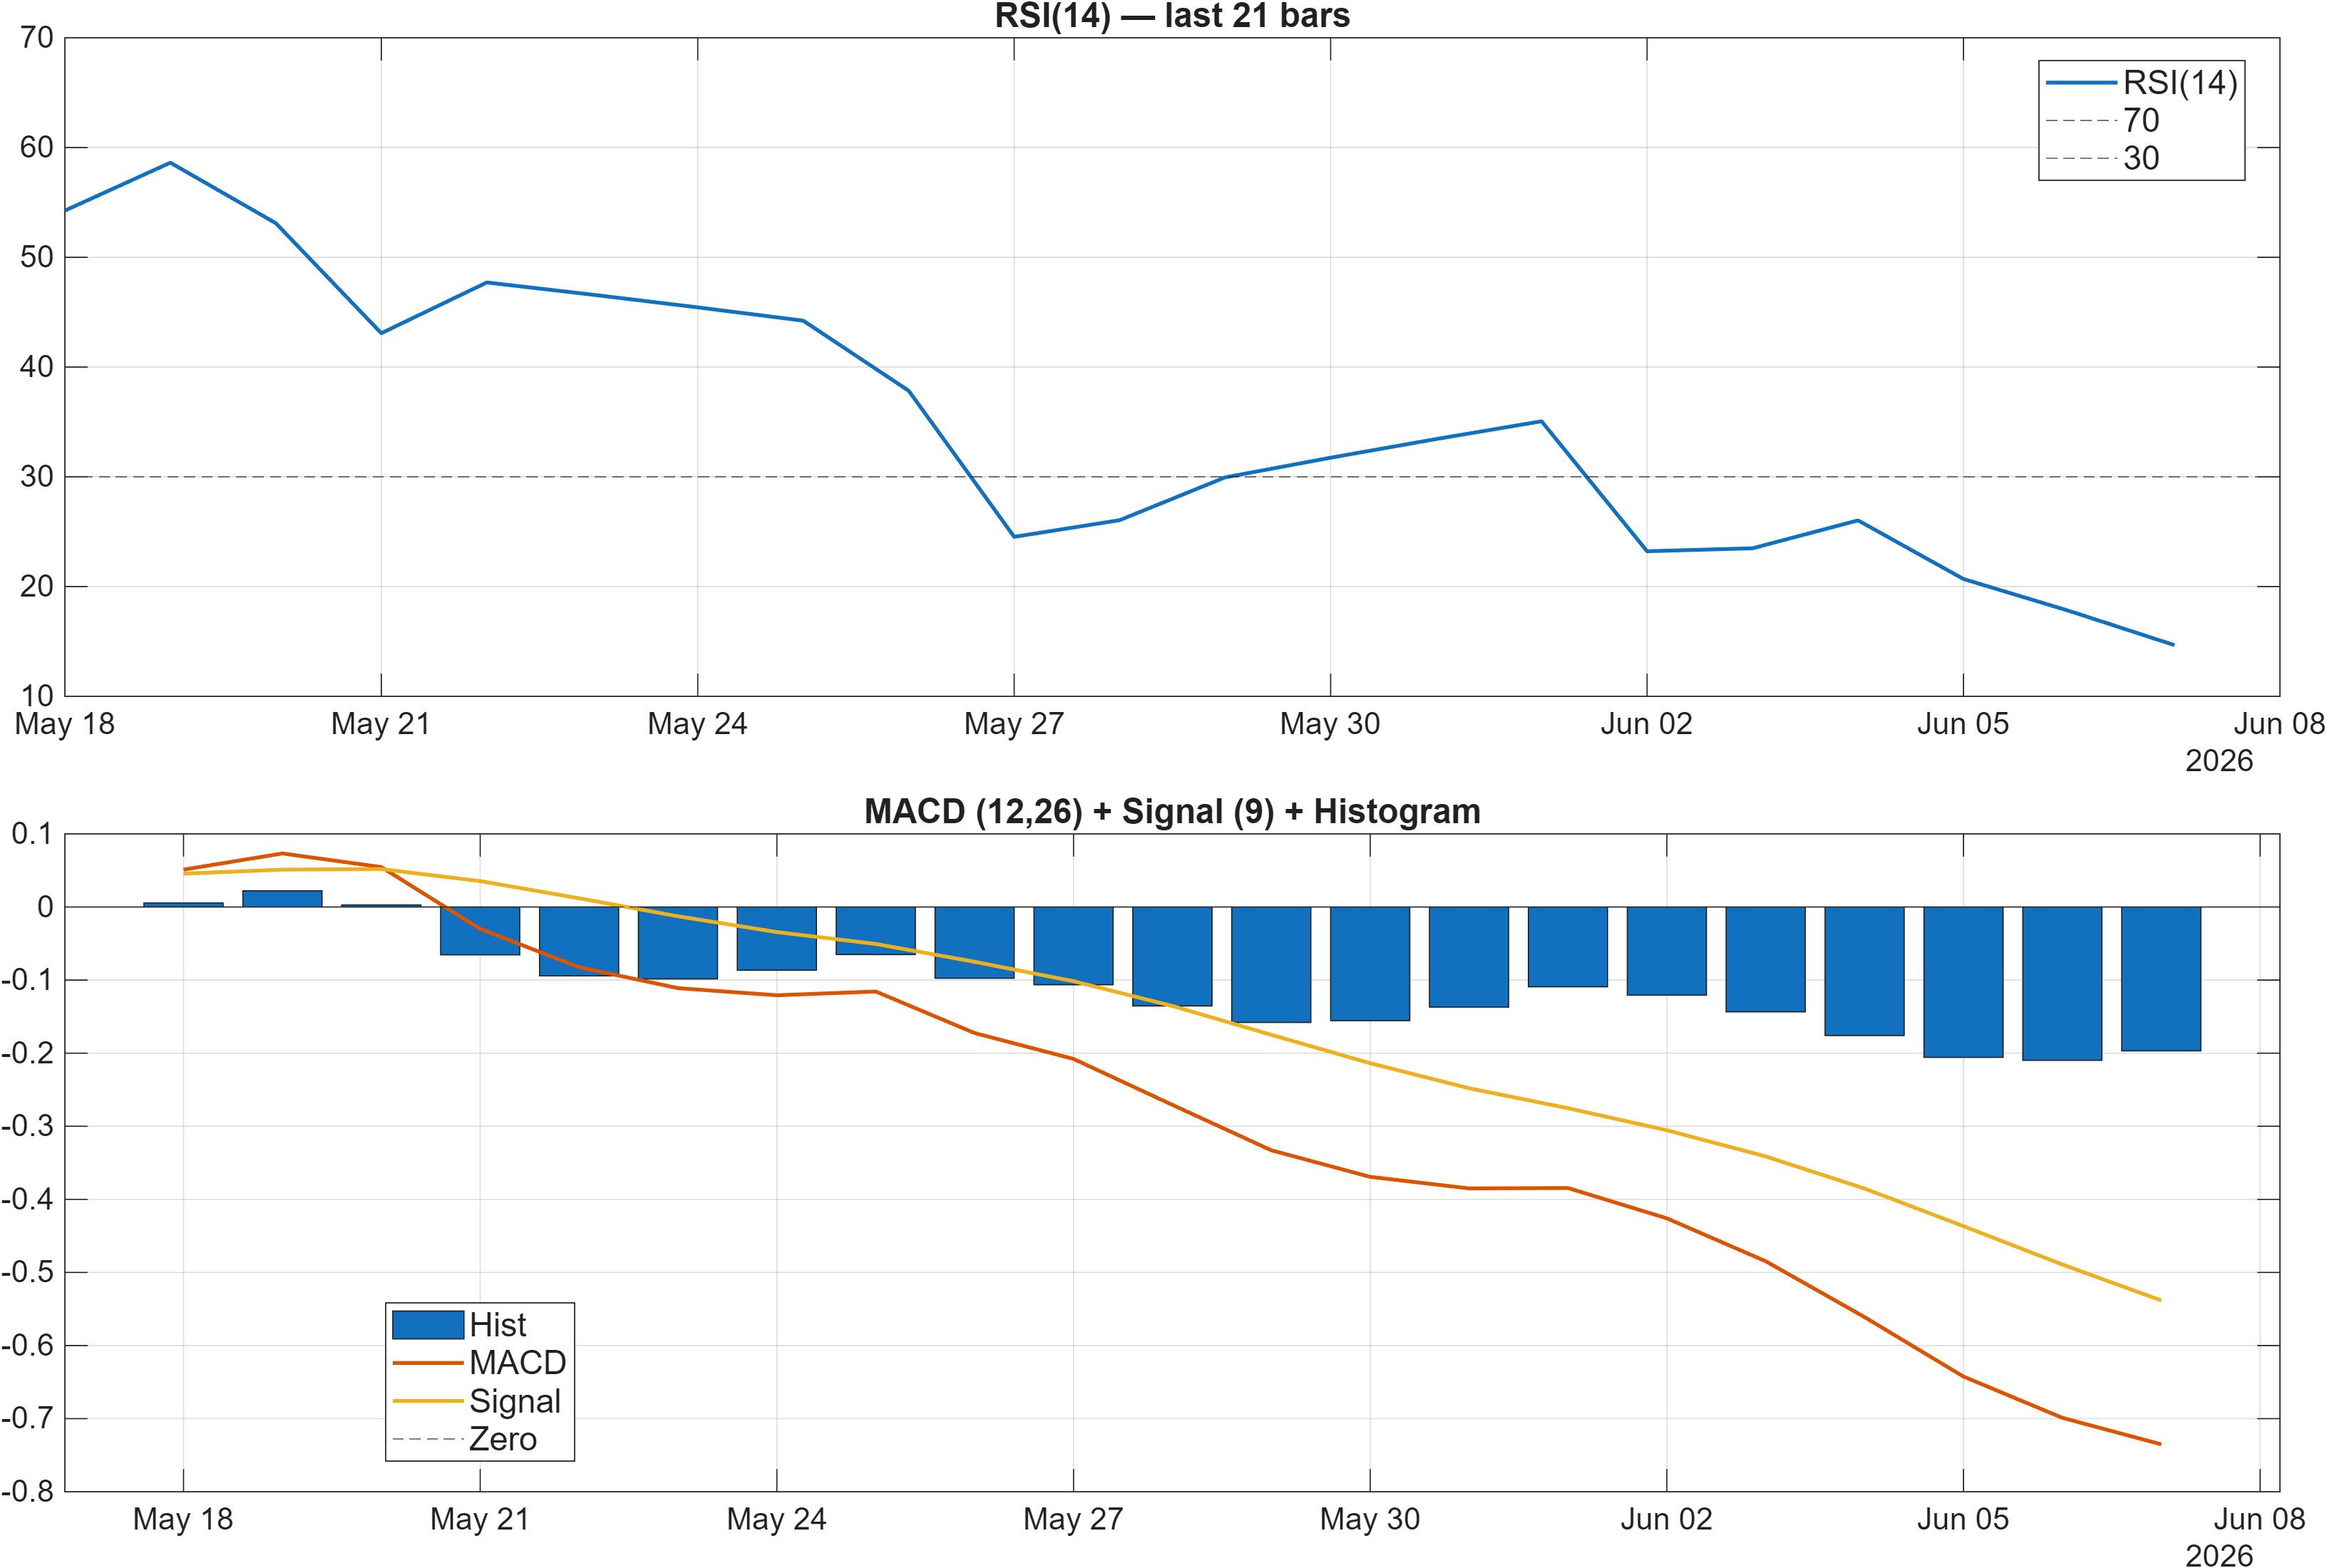
Interpretation: RSI bias = Bearish, MACD hist = -0.1968.
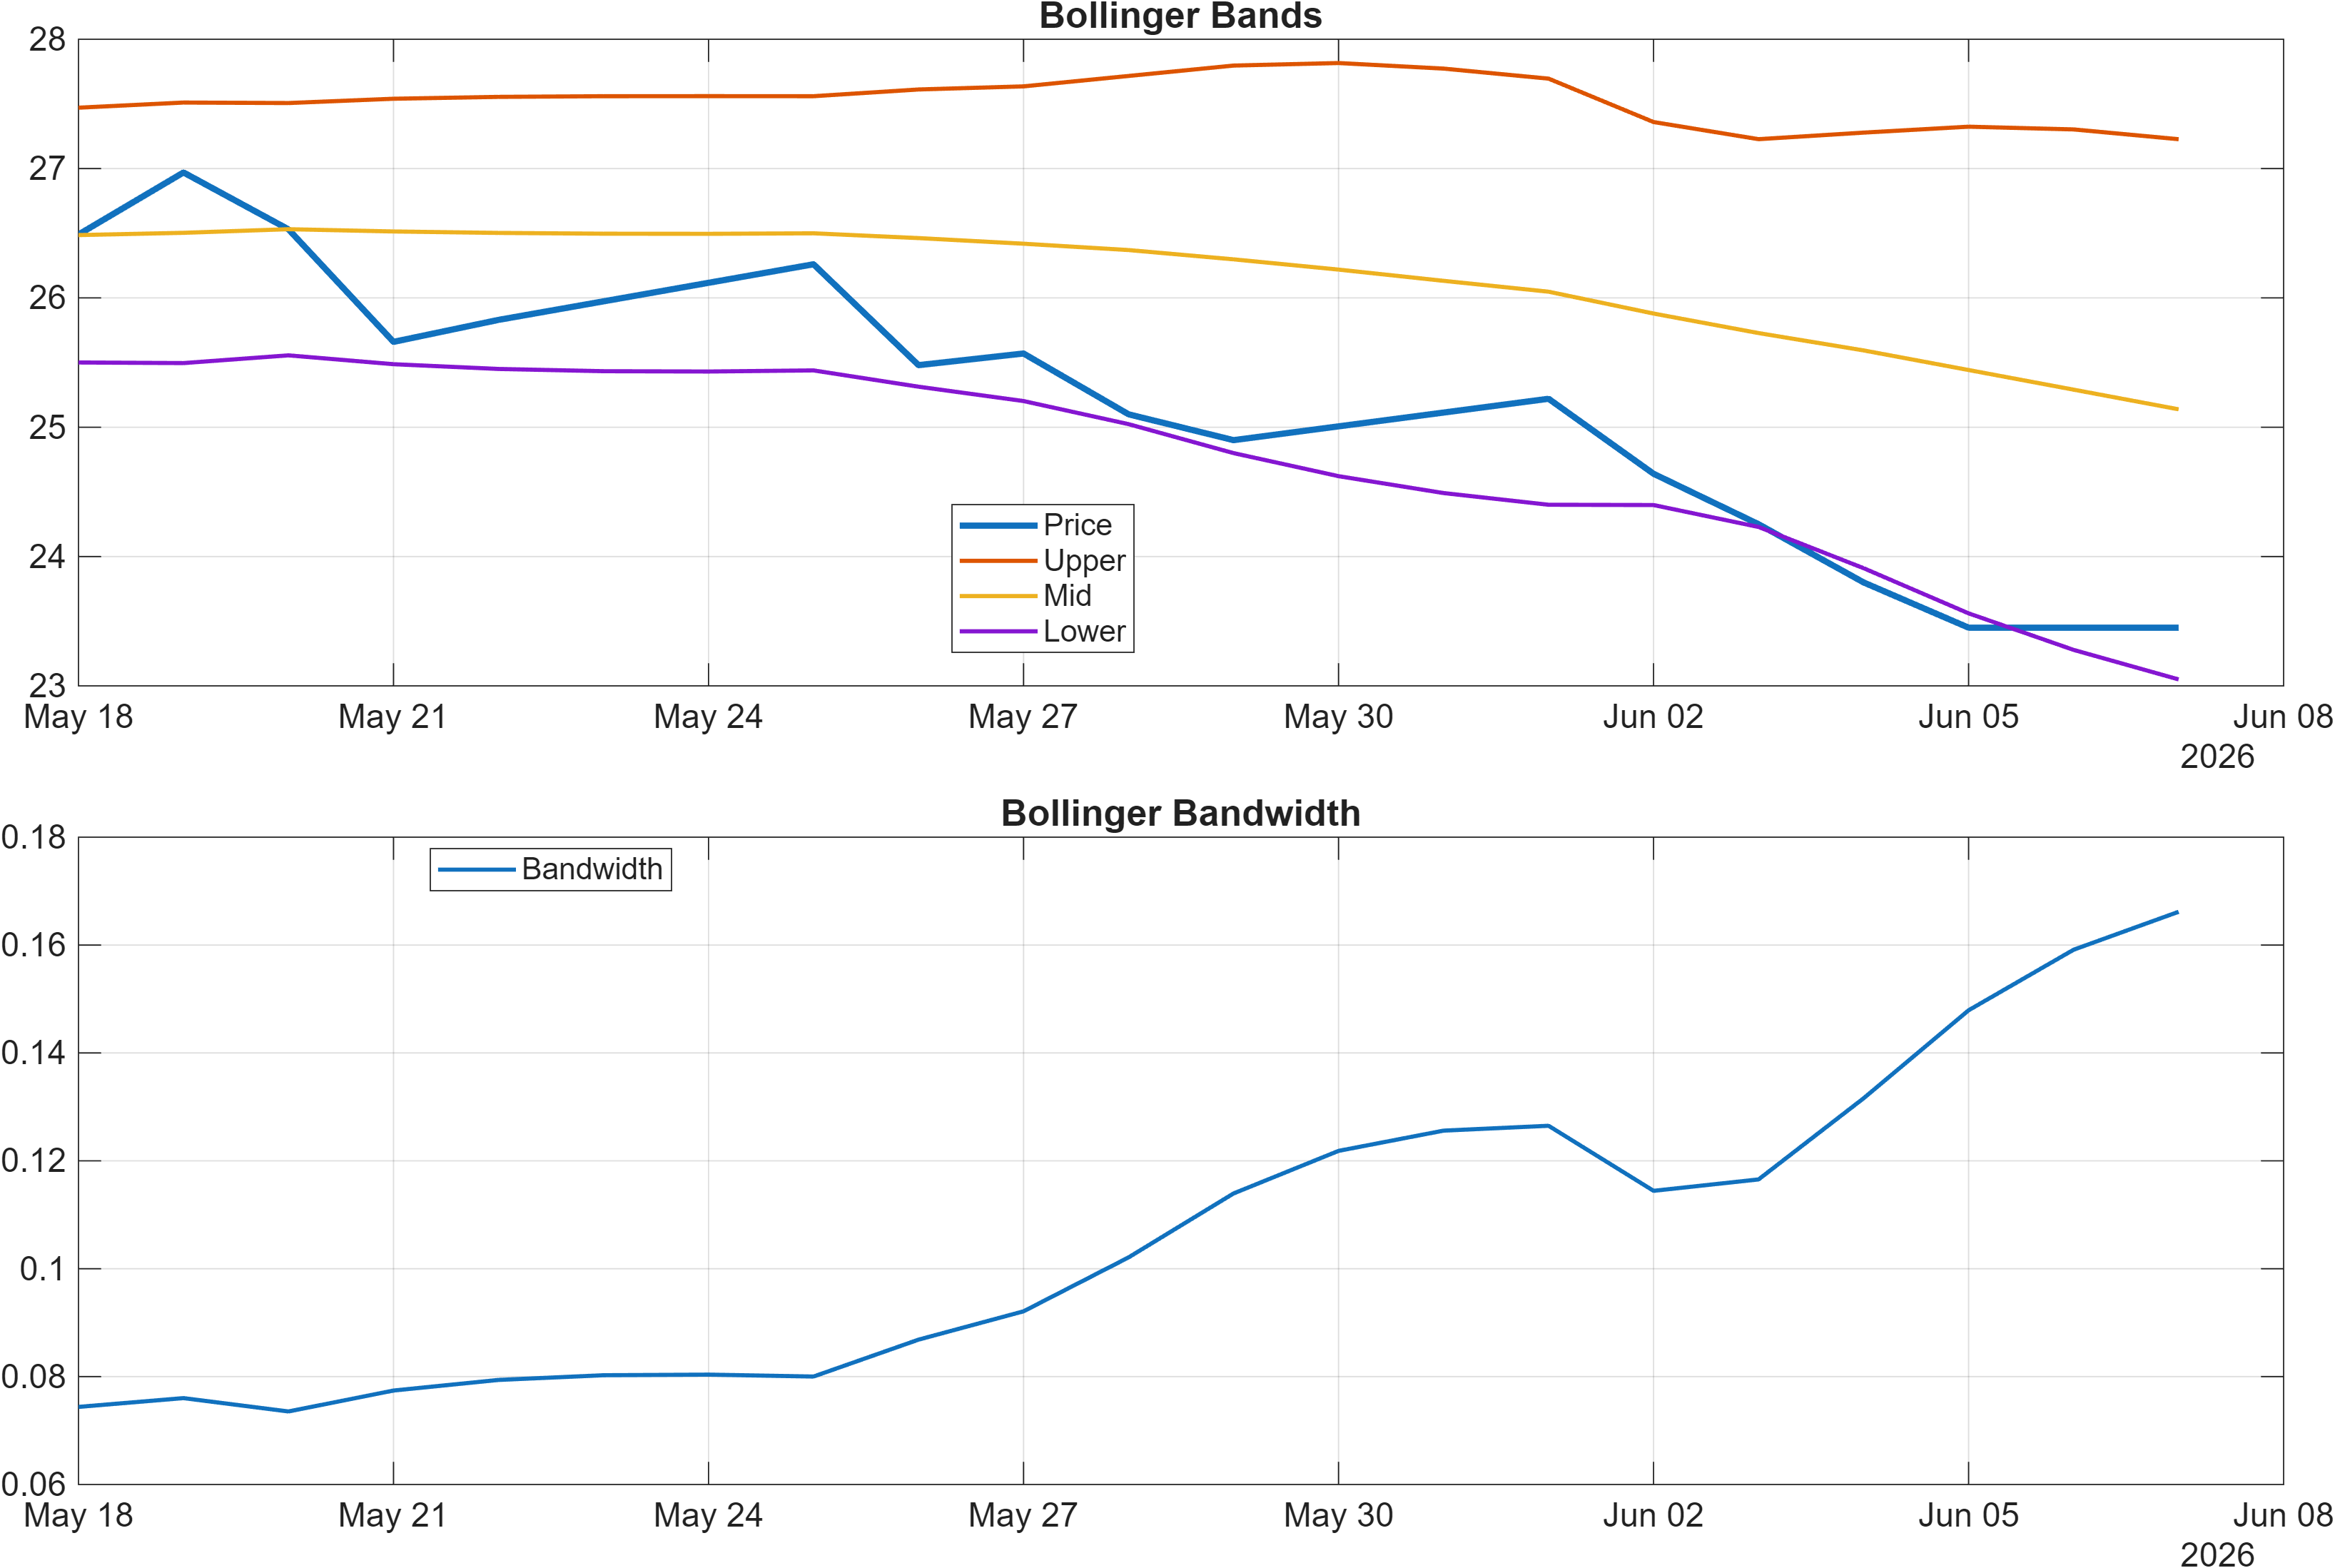
Interpretation: Bandwidth (volatility regime) latest = 0.1662.
Momentum compression with active volatility
Momentum signals lean negative. The MACD histogram at -0.1968 indicates bearish momentum persistence rather than a completed reset, while the RSI bias is also flagged bearish. Within the broader signal set, RSI(14) is 14.66, reinforcing that recent selling pressure has been pronounced versus typical oscillation ranges. In isolation, very low RSI can sometimes coincide with late-stage drawdowns; however, the surrounding evidence—bearish moving-average regime and negative MACD histogram—argues that the momentum regime is still fragile rather than decisively transitioning.
Volatility is present but not extreme. Bollinger Bandwidth at 0.1662 suggests an environment where swings can be meaningful, yet not necessarily “capitulation-grade.” From a positioning perspective, this is a regime where false starts are common: mean-reversion moves can occur without the broader trend changing, especially when price remains below the MA50 and the MA50 remains below the MA200.
The dashboard also hints at a divergence between momentum and some flow/participation proxies. While momentum is weak, the broader technical table later shows at least some constructive pockets (e.g., Stoch %K is 1.471 flagged bullish, and ADOSC is 36.25 bullish). That kind of mixed internal tape often precedes either (a) a stabilization attempt near support, or (b) a brief bounce that fails at resistance. Either way, the 24.6000–27.3717 bracket becomes the practical filter for whether momentum weakness is being absorbed or extended.
4) Support / Resistance zones
Support ~ 24.6000 | Resistance ~ 27.3717
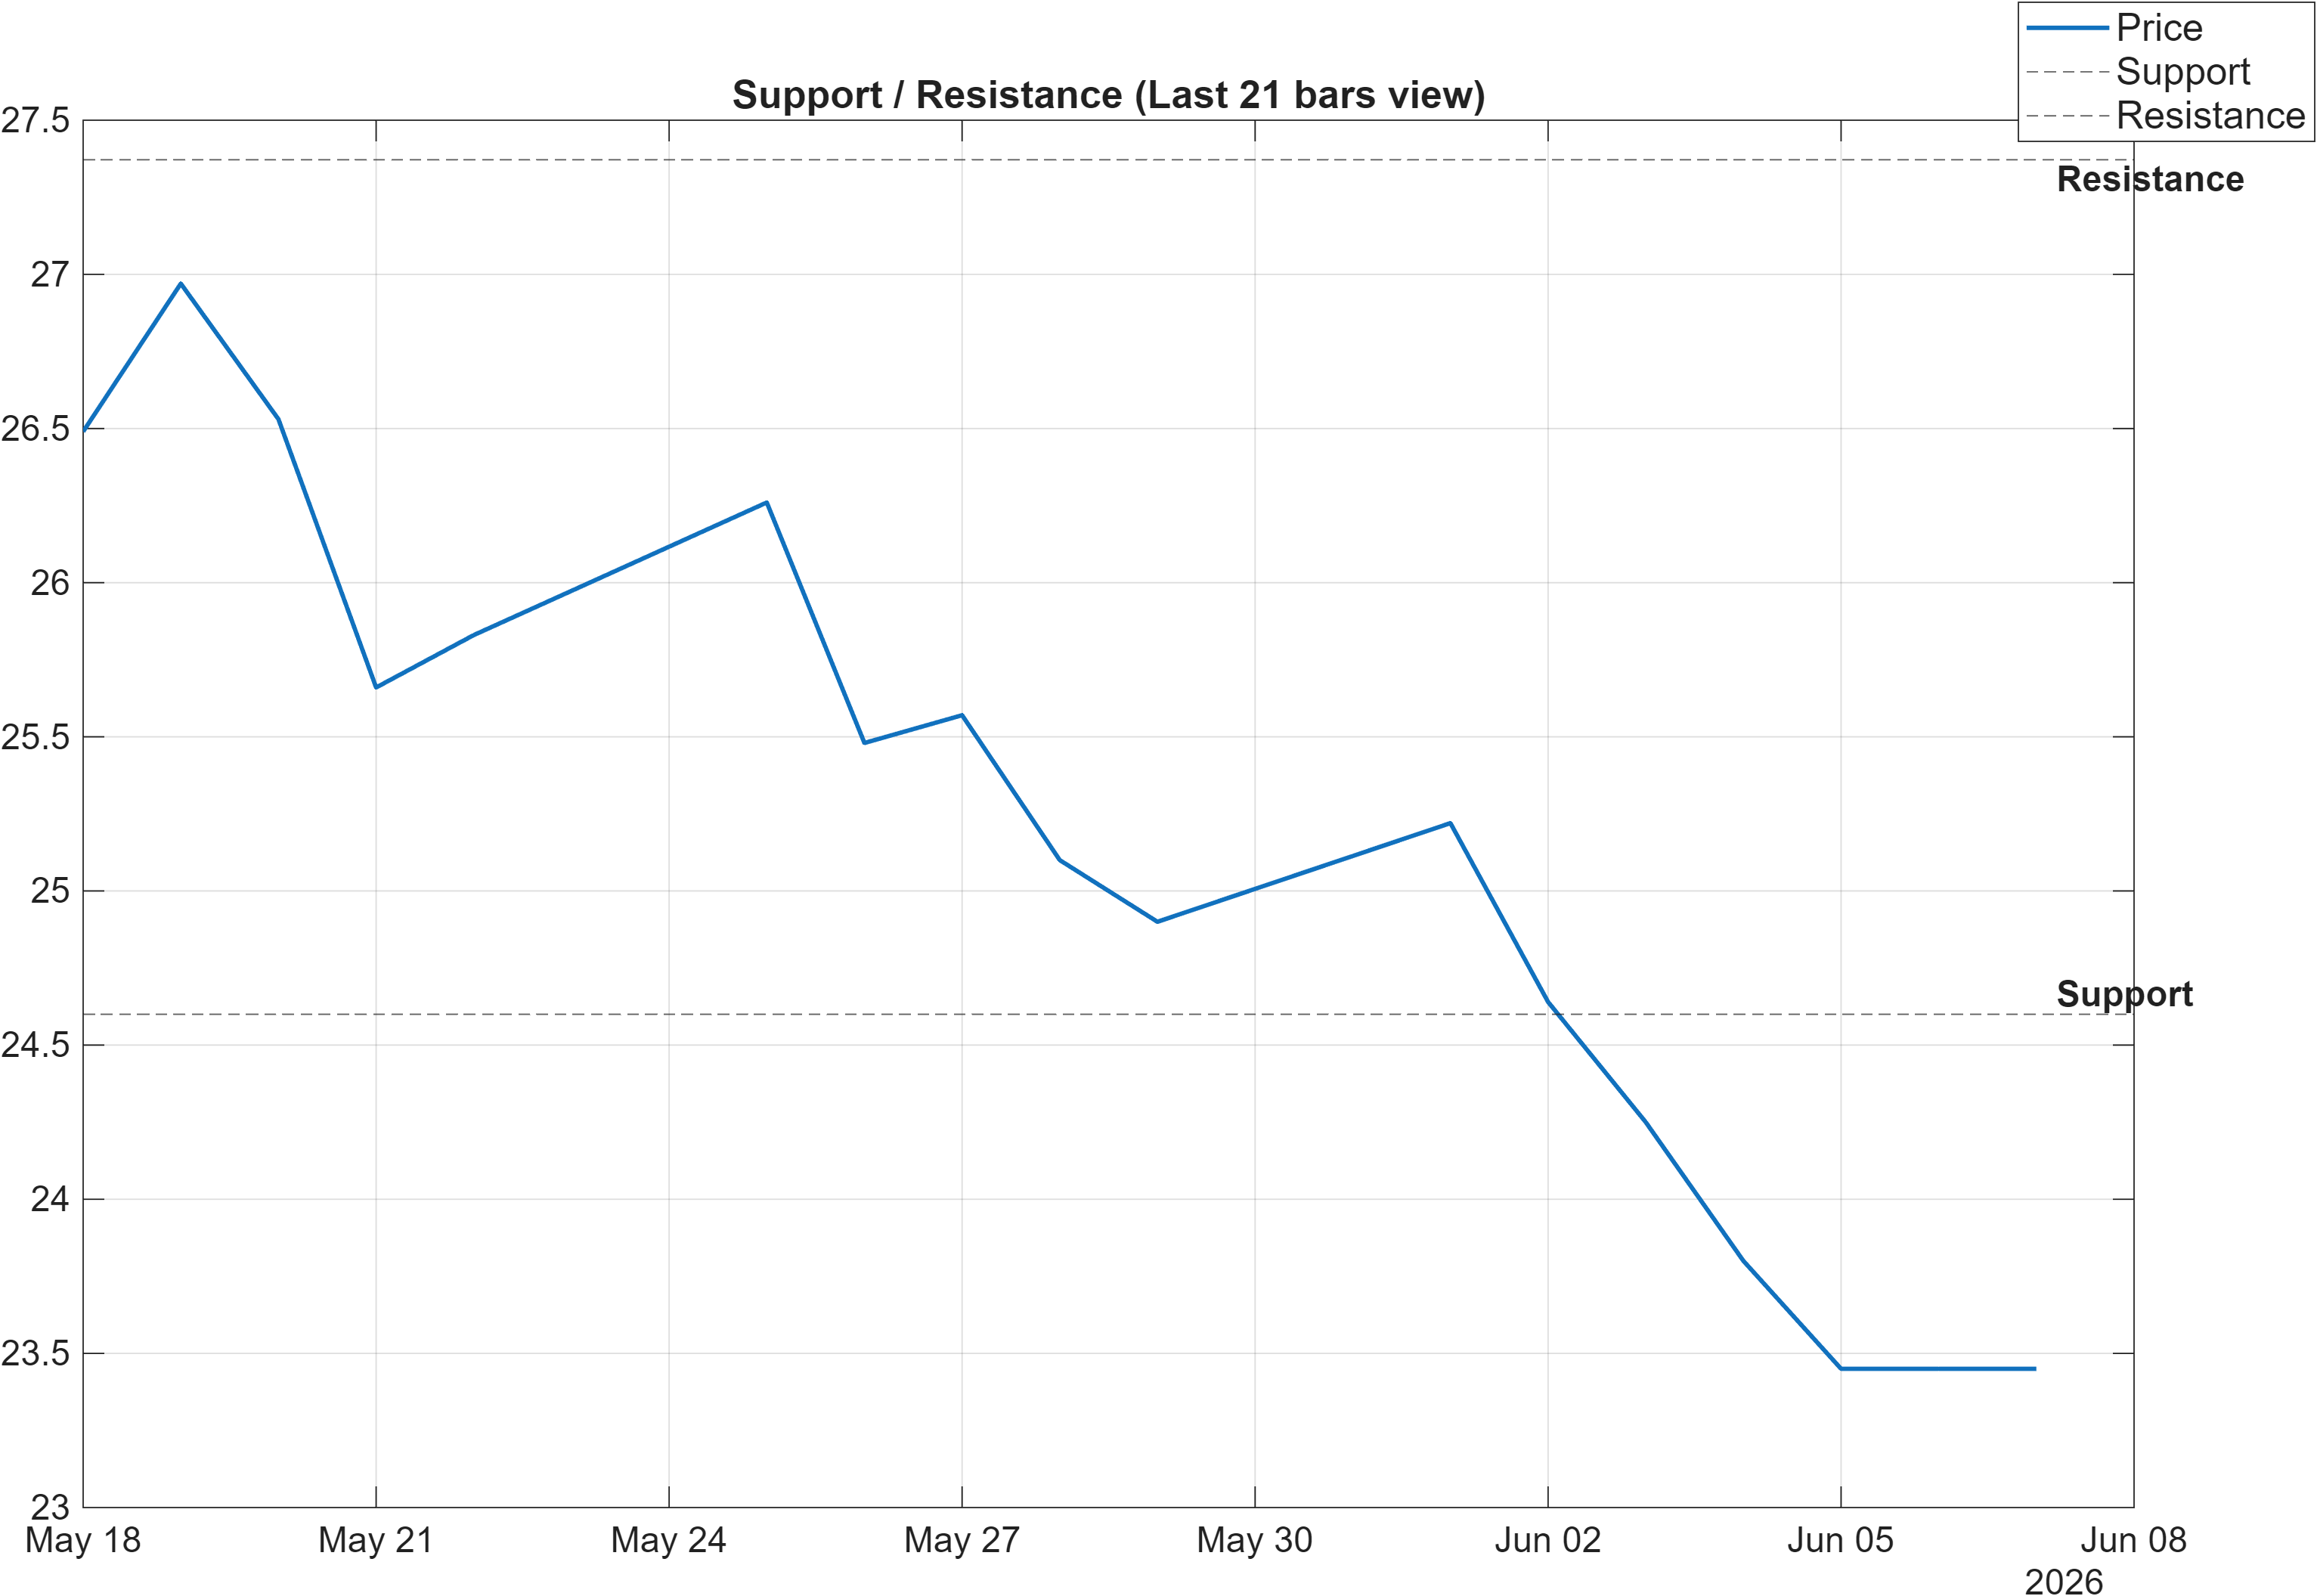
Decision zones: defining continuation vs. deterioration
The support level near 24.6000 is the primary reference for controlling downside damage in the current structure. With the moving-average regime bearish and momentum weak (MACD histogram -0.1968; RSI bearish bias), repeated tests of support can become increasingly important: either the level holds and encourages a base-building process, or it fails and increases the probability of an accelerated drawdown phase.
On the upside, resistance near 27.3717 represents more than a simple price ceiling. In a bearish MA regime, resistance zones frequently align with areas where trapped supply attempts to exit on rallies. A sustained break above resistance with volume (per the scenario note) would be a cleaner sign that the market is transitioning away from distribution dynamics toward acceptance at higher prices.
The range between 24.6000 and 27.3717 also frames execution risk under the current volatility regime (Bandwidth 0.1662). With volatility active, price may traverse meaningful portions of this band quickly; that raises the value of closing behavior relative to intraday moves. A close below 24.6000 is explicitly flagged as deterioration risk, while strength above 27.3717 is the more credible confirmation point for a regime shift from bearish trend persistence toward recovery.
Scenario view: Break above resistance with volume → continuation. Close below support → signal deterioration risk.
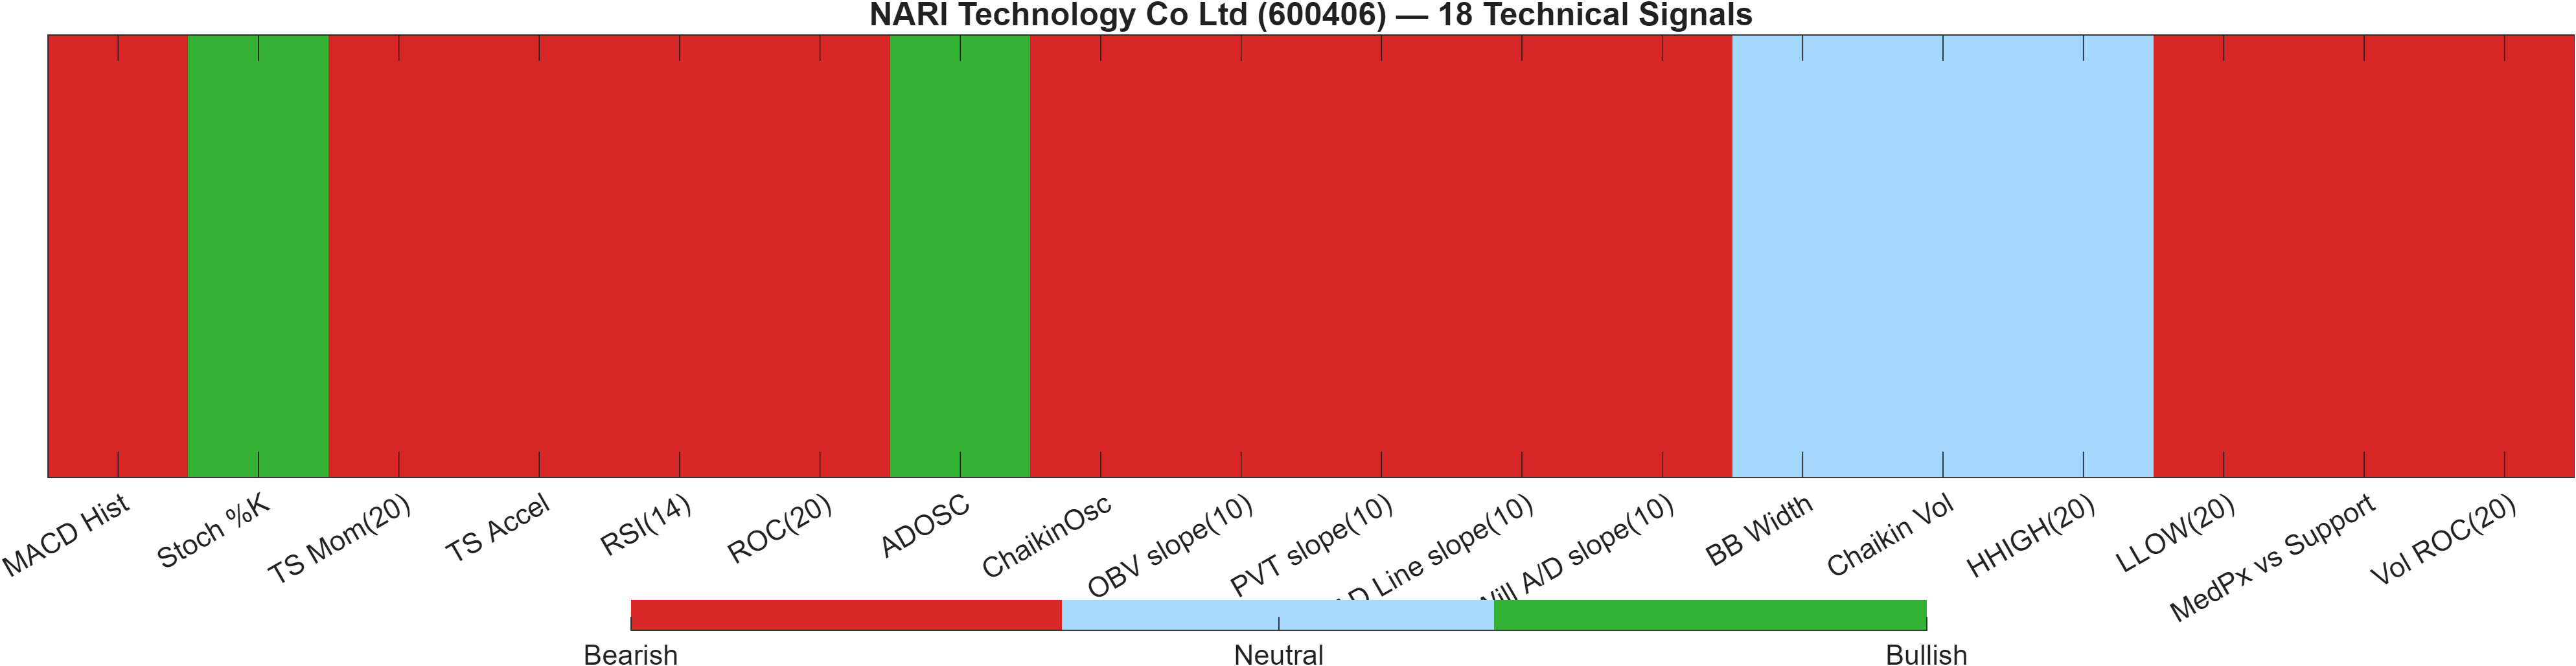
5) Quant Technical Dashboard (18 Signals)
KGNAI AI Technical Analysis Score (Deep Reinforcement Learning): Rank #1164 out of 1292 (Rank 1 represents the strongest technical positioning and a higher probability of favorable price behavior. As ranks increase toward the maximum, the probability of favorable outcomes weakens and bearish positioning becomes more dominant.) | Label: Bearish | Score: -0.802
18-Signal Technical Confluence Score: -0.611 (Bearish)
Overall Technical Score (18-signal confluence + DRL rank blend): -0.668 (Bearish)
Note: The blended score reflects signal strength weighted against broader AI technical ranking, which may temporarily diverge.
Blended technical score breakdown: -0.668 (Bearish | Bull 2 / Bear 13 / Neutral 3)
Alignment check: weak confluence against a strong rank backdrop
The technical stack is decisively negative. The Deep Reinforcement Learning technical rank is #1164 out of 1292 with a score of -0.802, placing it in the lower tail of the universe for technical positioning. The 18-signal confluence is also Bearish at -0.611, and the blended overall technical score remains -0.668. The breadth is notable: 13 Bear versus 2 Bull and 3 Neutral, which reduces the likelihood that the bearish view is being driven by only one or two noisy indicators.
Several momentum and rate-of-change components are consistent with drawdown conditions—RSI(14) at 14.66, ROC(20) at -13.05, and TS Mom(20) at -3.52. That clustering matters because it suggests the bearish signal is not just “trend” but also “speed” of recent movement. At the same time, the limited bullish offsets (e.g., Stoch %K 1.471 and ADOSC 36.25) look more like early stabilization attempts than a confirmed reversal.
When this dashboard is bearish while the rank set stays bullish (e.g., 3-month #22), the tactical implication is often selective patience: the instrument may be a candidate for recovery on a cross-sectional basis, but the current tape argues that confirmation should come from price reclaiming resistance and momentum improving (e.g., MACD histogram moving toward zero from -0.1968) rather than from ranks alone.
Signal table (Bull/Bear/Neutral)
| Indicator | Value | Signal |
|---|---|---|
| MACD Hist | -0.1968 | Bearish |
| Stoch %K | 1.471 | Bullish |
| TS Mom(20) | -3.52 | Bearish |
| TS Accel | -4.52 | Bearish |
| RSI(14) | 14.66 | Bearish |
| ROC(20) | -13.05 | Bearish |
| ADOSC | 36.25 | Bullish |
| ChaikinOsc | -1.223e+08 | Bearish |
| OBV slope(10) | -1.363e+08 | Bearish |
| PVT slope(10) | -5.422e+06 | Bearish |
| AD Line slope(10) | -3.196e+08 | Bearish |
| Will A/D slope(10) | -1.38 | Bearish |
| BB Width | 0.1662 | Neutral |
| Chaikin Vol | -27.36 | Neutral |
| HHIGH(20) | 27.24 | Neutral |
| LLOW(20) | 23.42 | Bearish |
| MedPx vs Support | -0.98 | Bearish |
| Vol ROC(20) | -37.46 | Bearish |
Interpretation: Indicator-level signals form the base confluence, which is then adjusted using a separate AI-driven technical ranking model. The final technical score summarizes this combined view.
6) News sentiment + extractive gist
Note: Instrument-specific news matches were not found, so the digest includes broader market/sector headlines.
Sentiment score (avg): -0.037 | Positive: 0% | Neutral: 88% | Negative: 12%
KGNAI AI News Sentiment Score (normalized -1 to +1): Not available (as of —) | Label: Not available | Overall news score: -0.04
Positive Developments
Recent coverage across major financial outlets reads as broadly calm rather than strongly directional, which is consistent with the sentiment distribution showing 0% positive but a dominant 88% neutral share. In that setting, “positive” is best interpreted as the absence of escalatory shocks rather than the presence of company-specific catalysts. For 600406, the practical value of a quieter headline tape is that it reduces the probability of abrupt, sentiment-driven gaps when the technical configuration is already stressed (MACD histogram -0.1968, RSI bearish). With Bollinger Bandwidth at 0.1662, volatility is active enough that incremental improvements in risk tone can still matter, especially near decision levels such as 24.6000 support and 27.3717 resistance. Overall, the current news context provides limited tailwind, but it also does not materially add pressure to a chart that is attempting to stabilize.
Neutral / Mixed Developments
The news signal is primarily Neutral in aggregate, reflected in an average sentiment of -0.037 and an overall score of -0.04. With instrument-specific matches not available in the provided data, the digest functions more as a macro/sector backdrop filter than as a catalyst monitor for NARI Technology directly. In these conditions, price behavior tends to be more tightly governed by technical mechanics—trend state (Close vs MA50 bearish; MA50 vs MA200 bearish), momentum (RSI bearish; MACD histogram -0.1968), and the nearby support/resistance framework. Net: the headline environment looks unlikely to “rescue” a weak tape on its own, but it may allow technical levels to play out with fewer exogenous disturbances.
Negative / Risk Signals
The negative share is 12%, which is not dominant, but it matters because the technical picture is already skewed risk-off: the blended technical score is -0.668 and the AI technical rank is #1164 out of 1292. In other words, the chart has less shock absorption capacity than it would in a confirmed uptrend. In such a setup, even modest risk headlines can translate into disproportionate price impact if they coincide with a test of 24.6000 support or failed attempts near 27.3717 resistance. With volatility not compressed (Bandwidth 0.1662), the risk is less about a single datapoint and more about path dependency: a cluster of modest negatives can keep momentum indicators (e.g., MACD histogram at -0.1968) pinned in bearish territory and delay any stabilization.
- Whether news tone shifts from predominantly neutral (88%) toward a higher negative share during tests of 24.6000.
- Any broad risk-off surge that coincides with a failure to reclaim 27.3717 on a closing basis.
- Whether volatility expands beyond the current 0.1662 bandwidth regime alongside weakening momentum.
Sources referenced: Reuters, Bloomberg, Yahoo Finance, MarketWatch, Investing.com
Snapshot: AI Rank (Short–Mid–Long): Bullish (Bullish–Bullish–Bullish) · Technical Confluence: Bearish · Key Levels: Support ~24.60 | Resistance ~27.37 · News Sentiment: Neutral
7) Sources
Not available in the provided data.
You may also like: How KGNAI AI ranks instruments across global markets
Disclaimer: KGNAI provides AI-generated analytics and educational market commentary only. This is not financial advice. Markets involve risk. Always do your own research.