601169 (Bank of Beijing Co Ltd) — Neutral multi-horizon ranks with bullish technical confluence (12-Jun-2026)
Bank of Beijing Co Ltd (601169) is currently characterized by a neutral cross-horizon KGNAI rank profile despite a more constructive technical complexion. Within a 1292-instrument China universe, positioning is mixed: the weekly rank (#182) is in the upper quartile and tagged bullish, while the monthly rank (#1021) sits in the lower end of the distribution and is labeled neutral. This creates a market-structure “two-speed” setup: shorter-cycle factors appear to be improving as momentum indicators lean positive, yet longer-cycle confirmation has not fully followed. Technically, the blended framework tilts bullish via a 0.592 overall technical score and a strong AI technical rank (#125), but decision-making remains tightly linked to the defined risk boundaries at support ~5.0650 and resistance ~5.4800. News sentiment is slightly negative on average (-0.026) with a heavy neutral mix, suggesting macro/sector narratives are more likely to act as context than as a dominant catalyst.
- Rank stance (Short / Mid / Long): Neutral / Neutral / Neutral (weekly is the notable exception: bullish at #182).
- Technical confluence label: Bullish (overall technical score 0.592; DRL technical rank #125).
- Key levels: Support ~ 5.0650 | Resistance ~ 5.4800.
- News sentiment bias: Slightly negative-to-neutral (avg -0.026; Neutral 75%).
- Confirmation / invalidation: A sustained push above 5.4800 with volume supports continuation; a close below 5.0650 increases deterioration risk.
KGNAI evaluates assets using large cross-sectional datasets built from millions of structured data points. Inputs incorporate fundamental metrics, technical structures, and systematically processed news sentiment. Statistical models, machine learning, and AI frameworks are used to assess relative positioning, signal alignment, and probabilistic behavior across broad universes.
- Ranks are comparative across the tracked universe, not absolute price targets.
- Confluence reflects alignment among independent signal groups.
- Support/resistance levels are probabilistic decision zones, not guarantees.
- Sentiment provides contextual bias within the broader analytical framework.
1) KGNAI AI Analysis
Region: CHINA | Total universe size: 1292 ranked instruments
- Daily rank: #360 out of 1292 — Neutral
- Weekly rank: #182 out of 1292 — Bullish
- Monthly rank: #1021 out of 1292 — Neutral
- 3-Monthly rank: #297 out of 1292 — Neutral
- 6-Monthly rank: #382 out of 1292 — Neutral
- Yearly rank: #369 out of 1292 — Neutral
Cross-horizon alignment vs. dispersion
The rank stack is best described as selectively constructive but not broadly confirmed. The weekly rank at #182 places 601169 in the upper quartile of the 1292-instrument universe, contrasting with a much weaker longer-cycle placement where the monthly rank at #1021 sits in the lower fifth. That dispersion is important: it often corresponds to rallies that are technically improving but still working through overhead supply from prior regimes.
The daily rank (#360) and the 3-month rank (#297) cluster closer to the upper third, indicating that shorter-cycle factors have stabilized relative to the broader China universe. However, the 6-month (#382) and yearly (#369) ranks remain neutral, reinforcing a “range-with-bias” interpretation rather than a clean trend regime.
Within KGNAI’s framework, ranks are comparative—so the key question is not whether the instrument is “good,” but whether its probabilistic behavior is improving versus peers. Here, the weekly strength alongside neutral long-horizon ranks suggests the market is testing the upside while requiring additional confirmation from price structure (notably the 5.4800 resistance) and volatility expansion. The term view remains Neutral across short, mid, and long horizons, which is consistent with a setup where signal groups are not fully synchronized.
KGNAI ranks each instrument across large universes using multiple proprietary AI tests and statistical models (millions of data points). Lower ranks generally indicate stronger probability of favorable performance behavior, while higher ranks indicate weaker probability and more bearish positioning.
Term view: Short-term: Neutral. Mid-term: Neutral. Long-term: Neutral.
Want the full universe and complete rank tables? Unlock full access on KGNAI: https://www.kgnai.com/pricing
2) Price & trend overview
Trend state: near-term improvement vs. longer-cycle friction
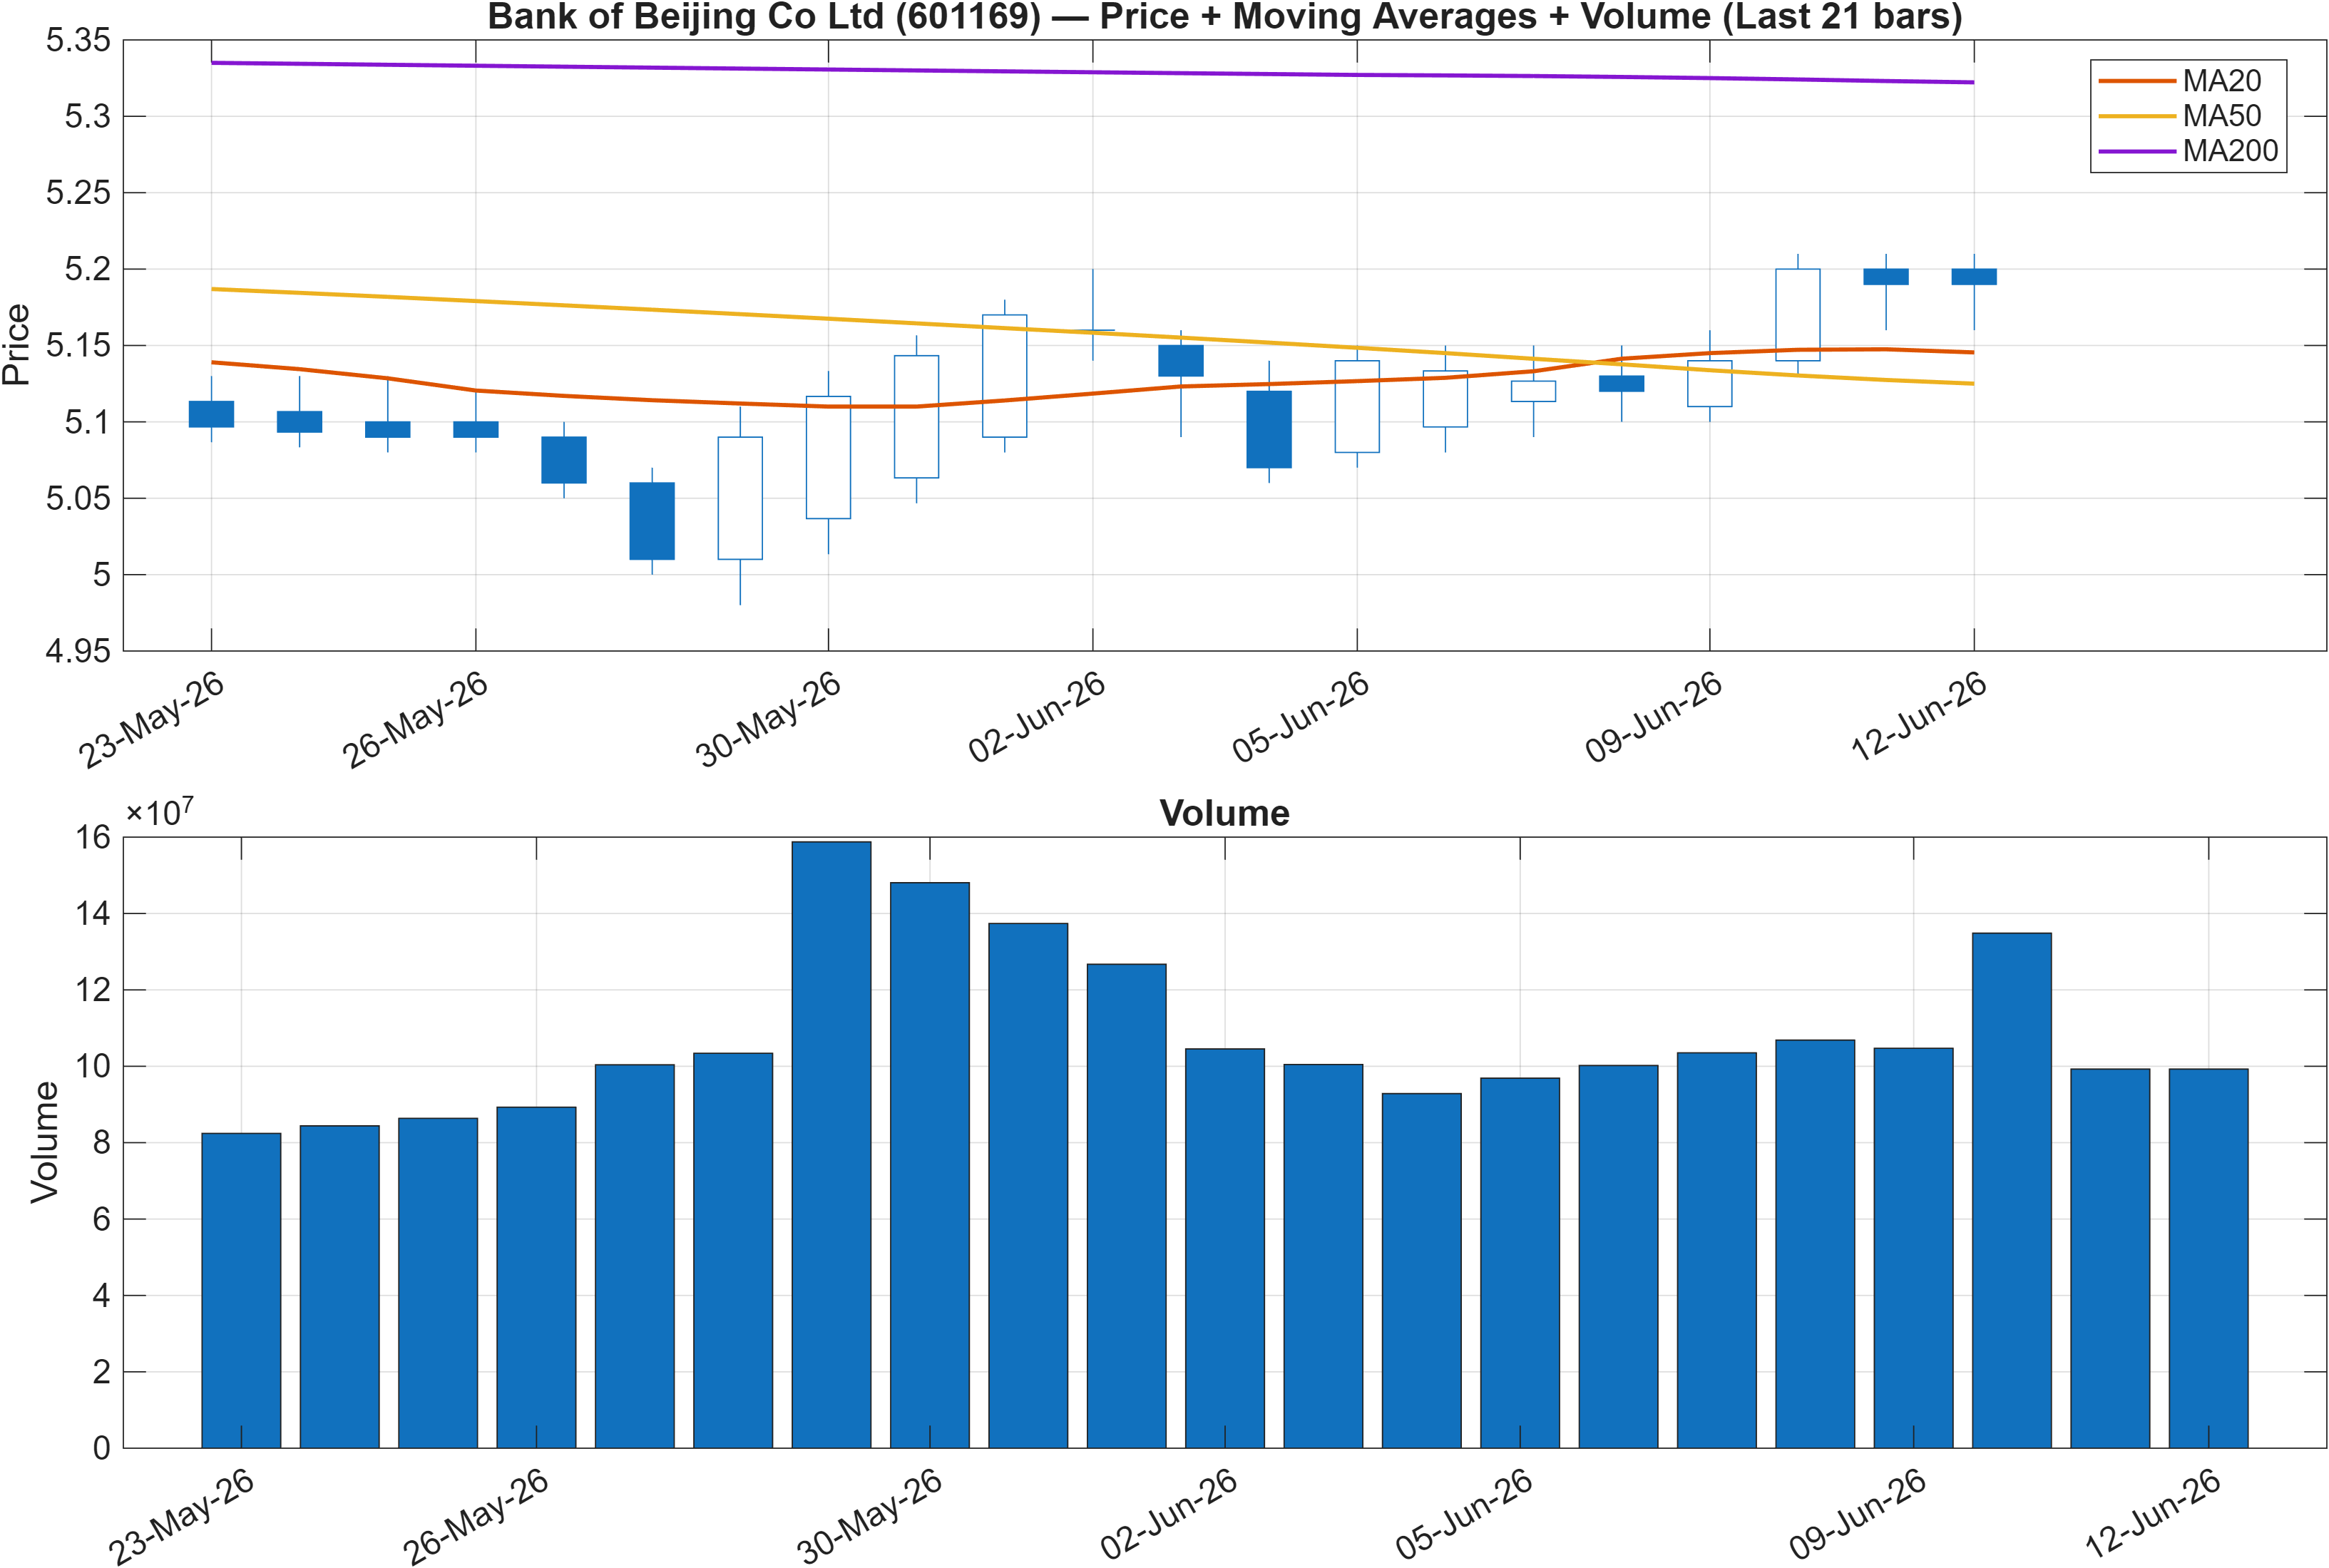
The moving-average interpretation captures a common transitional regime: price action is constructive relative to the MA50 (bullish), while the longer-cycle filter remains cautious because MA50 vs MA200 is bearish. This combination frequently maps to recoveries that are still rebuilding a durable trend base. In practical terms, the market is rewarding recent bids, but longer-term participants may still require evidence that the medium-term trend is turning rather than merely mean-reverting.
That framing aligns with the rank dispersion: a stronger weekly placement (#182) alongside a much weaker monthly placement (#1021) implies the recent impulse has improved relative to peers, yet the broader multi-month context remains less supportive. When this happens, the market often becomes more sensitive to nearby decision levels, since range boundaries act as liquidity magnets and invalidate/confirm points for both systematic and discretionary flows.
From a market-structure perspective, the most actionable read-through is that trend persistence will depend on whether participation (volume) expands as price approaches the upper boundary. The framework’s scenario language in Section 4—continuation on a break above resistance with volume versus deterioration risk on a close below support—fits a transitional condition where trend-following and mean-reversion signals can alternate quickly. Until the longer-cycle moving-average relationship improves, upside follow-through tends to be more dependent on incremental catalysts rather than purely technical drift.
Interpretation: Close vs MA50 = Bullish, MA50 vs MA200 = Bearish.
3) Momentum & volatility dashboard
Momentum confirmation with early signs of compression
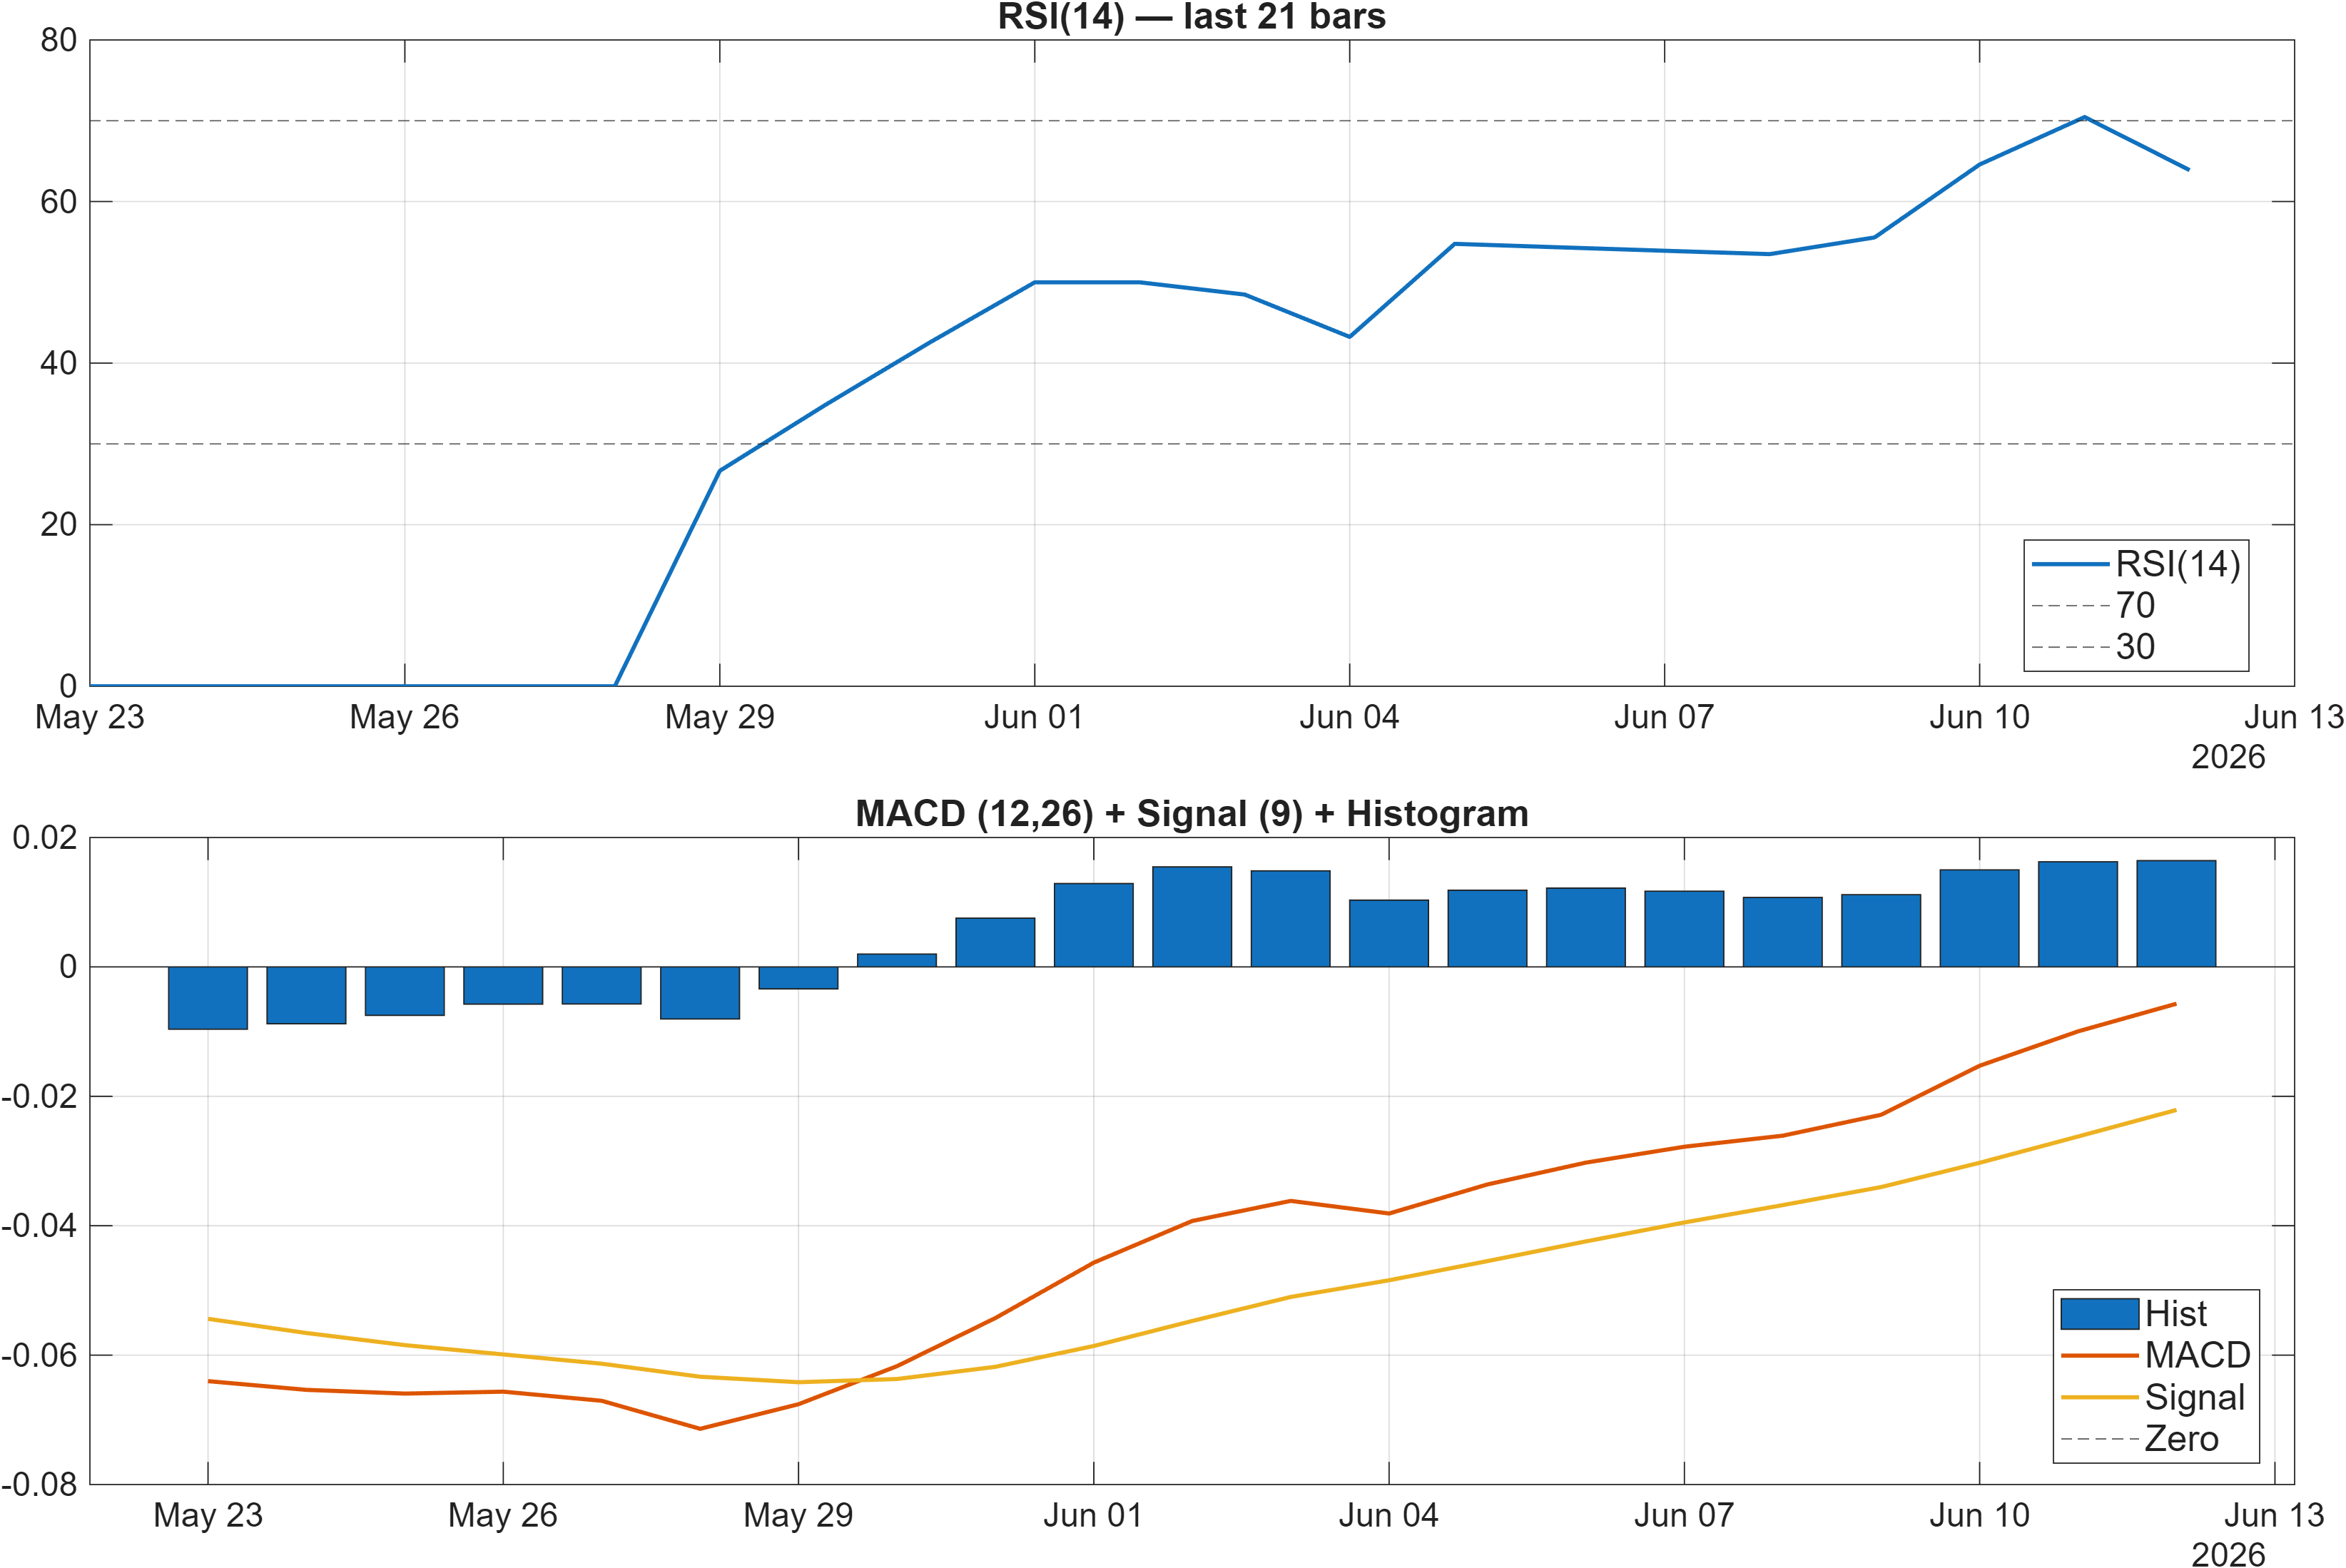
Momentum signals lean supportive. The RSI bias is tagged bullish with RSI(14) at 63.89, which typically indicates positive momentum without necessarily implying a fully extended condition. In parallel, the MACD histogram is positive at 0.0164, consistent with constructive trend pressure over the relevant lookback window. Together, RSI and MACD support the idea that the recent impulse is still intact, aligning with the comparatively stronger weekly rank positioning.
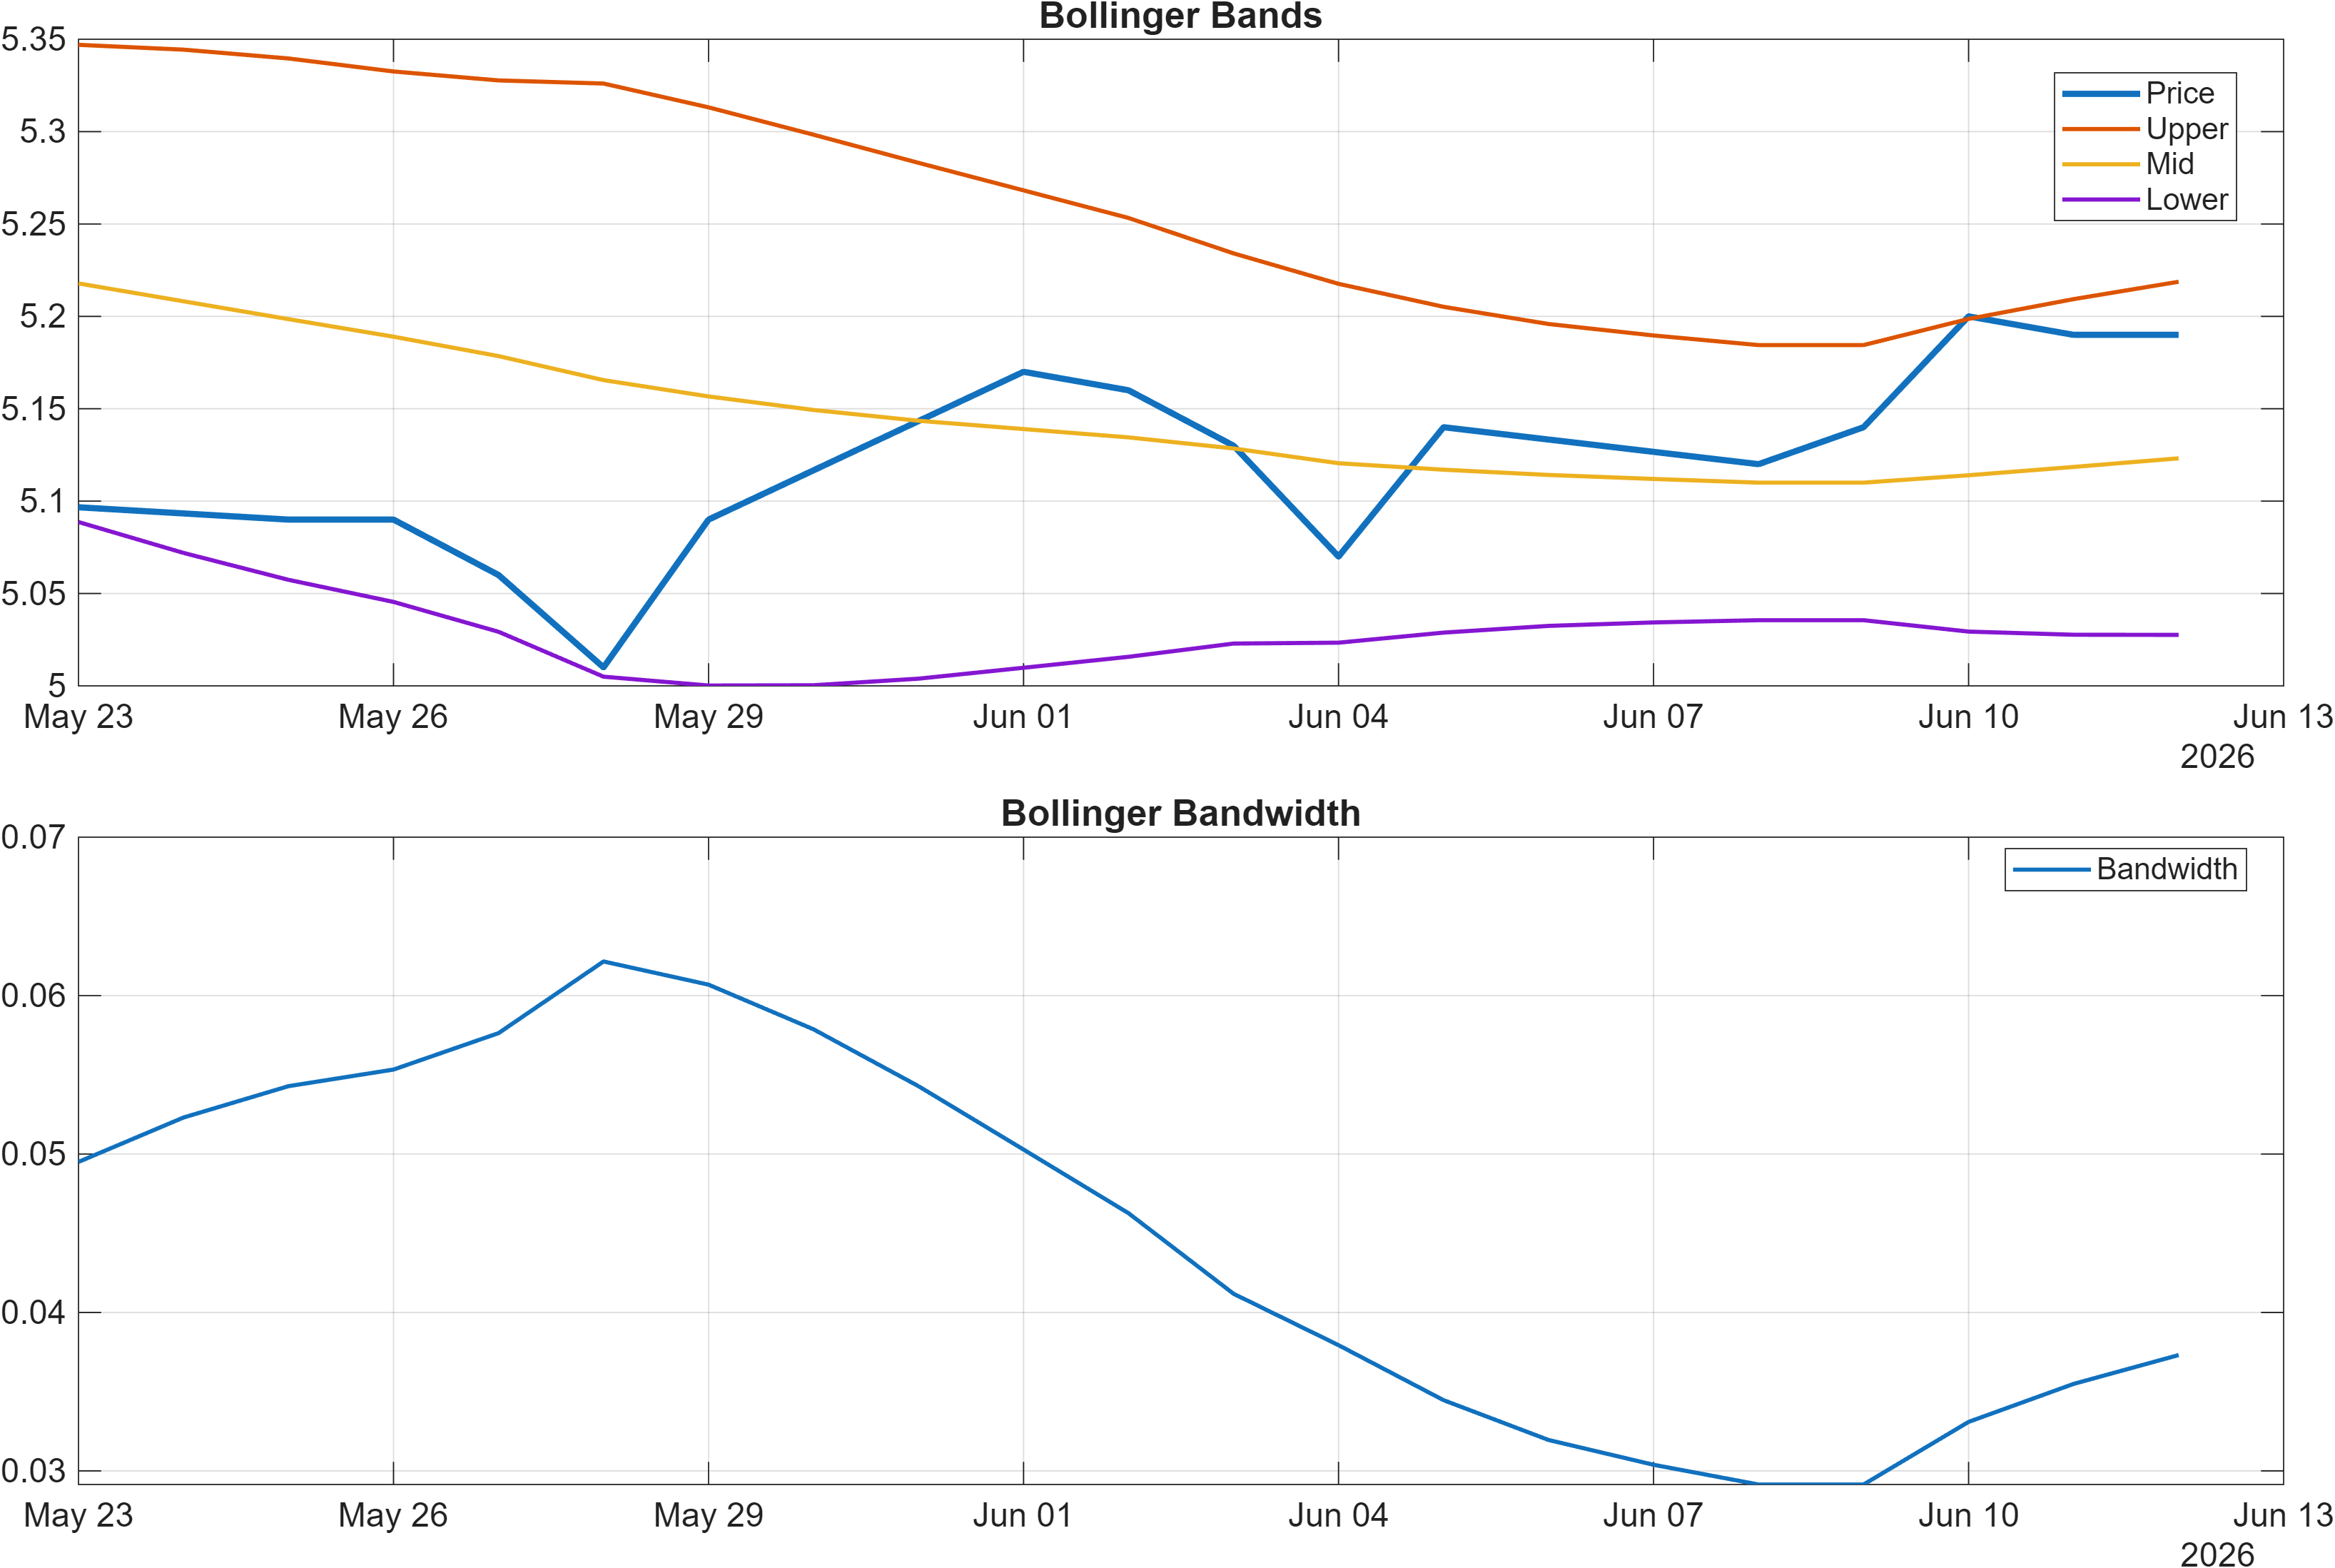
Volatility conditions are more nuanced. Bollinger bandwidth is low-to-moderate at 0.0373, which often corresponds to compression rather than expansion. Compression can be constructive when momentum is positive—because it implies tight risk—but it also increases sensitivity to breakouts and breakdowns at well-defined levels. This makes the 5.4800 resistance and 5.0650 support zones (Section 4) more relevant as “decision rails” than in a high-volatility regime.
The key analytical tension is trend persistence vs. exhaustion. With RSI in the low-to-mid 60s and MACD histogram modestly positive, the dashboard does not signal obvious exhaustion by itself. However, the compression implied by bandwidth suggests that price may require a volatility expansion phase to sustain directional follow-through. If expansion arrives while momentum remains constructive, it typically confirms the move; if expansion arrives on weakness, it often accelerates mean reversion back toward support.
Interpretation: RSI bias = Bullish, MACD hist = 0.0164.
Interpretation: Bandwidth (volatility regime) latest = 0.0373.
4) Support / Resistance zones
Support ~ 5.0650 | Resistance ~ 5.4800
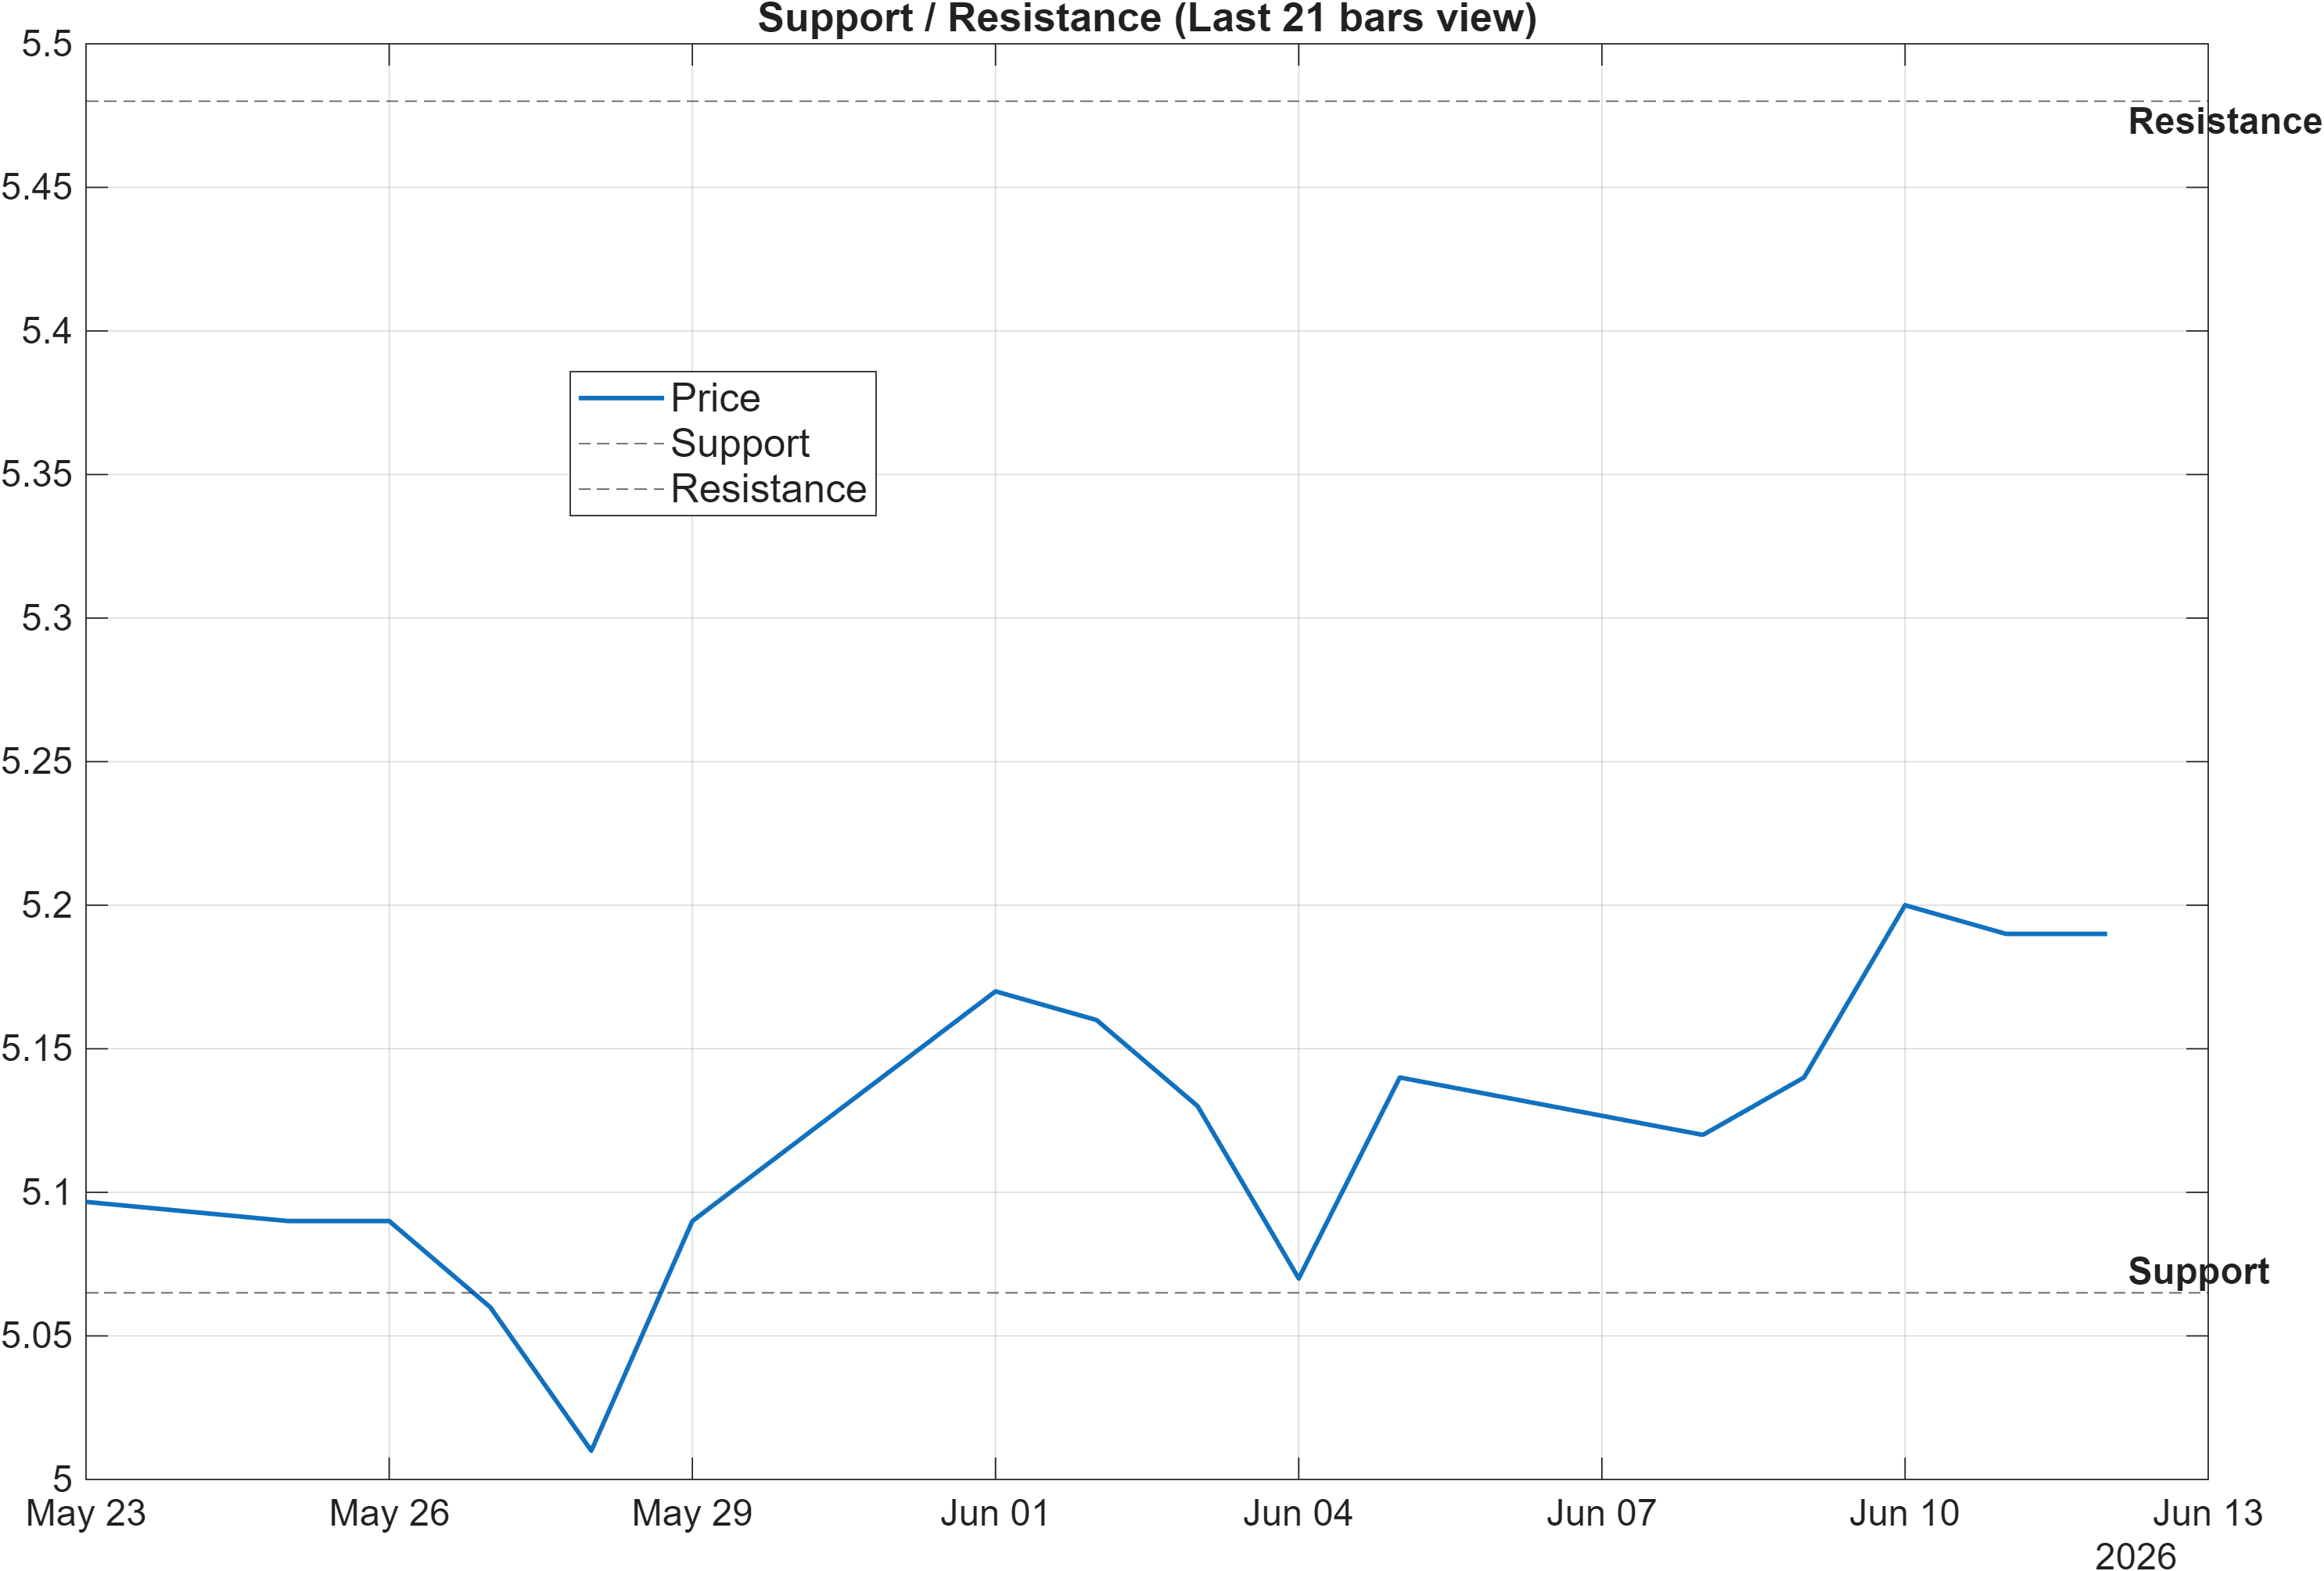
Decision zones: probabilistic boundaries for regime continuation vs. transition
The support and resistance framework is tight and actionable: ~5.0650 functions as the primary downside reference, while ~5.4800#182) but weak monthly placement (#1021)—these boundaries tend to concentrate positioning decisions because participants disagree on whether the move is a rebound inside a larger range or the early stage of a trend transition.
The scenario language is appropriately conditional. A break above resistance with volume supports continuation; this is especially relevant when volatility has been contained (bandwidth 0.0373) and momentum measures remain positive (RSI 63.89, MACD histogram 0.0164). In that configuration, a resistance break often acts as a “permission slip” for systematic strategies that require both level and participation confirmation.
Conversely, a close below support elevates deterioration risk, not because it guarantees a trend reversal, but because it tends to invalidate the near-term constructive setup reflected in the weekly rank and the bullish technical blend. In compressed regimes, level breaks can be disproportionately impactful: small moves can trigger stop placement, hedging demand, and rebalancing flows. As a result, the support zone is less a “buy level” and more a risk boundary for whether the current constructive momentum remains credible.
Scenario view: Break above resistance with volume → continuation. Close below support → signal deterioration risk.
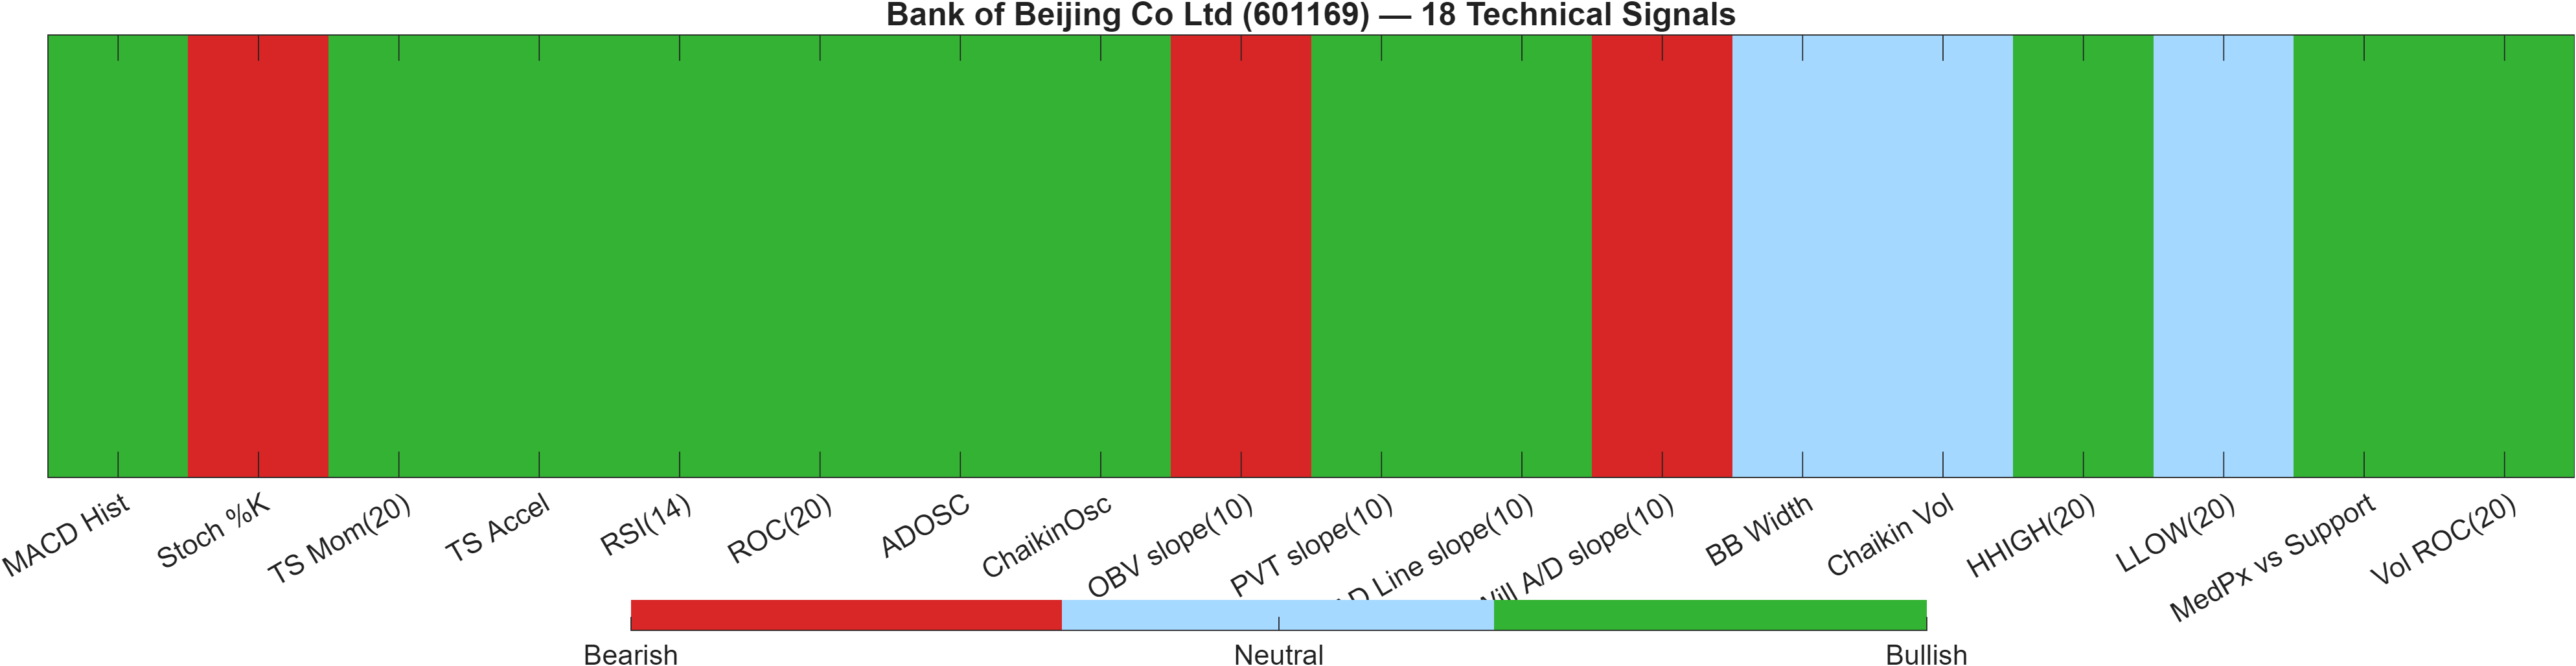
5) Quant Technical Dashboard (18 Signals)
KGNAI AI Technical Analysis Score (Deep Reinforcement Learning): Rank #125 out of 1292 (Rank 1 represents the strongest technical positioning and a higher probability of favorable price behavior. As ranks increase toward the maximum, the probability of favorable outcomes weakens and bearish positioning becomes more dominant.) | Label: Bullish | Score: 0.807
18-Signal Technical Confluence Score: 0.500 (Bullish)
Overall Technical Score (18-signal confluence + DRL rank blend): 0.592 (Bullish)
Note: The blended score reflects signal strength weighted against broader AI technical ranking, which may temporarily diverge.
Blended technical score breakdown: 0.592 (Bullish | Bull 12 / Bear 3 / Neutral 3)
Confluence quality: broad bullish skew with a few notable frictions
The dashboard’s primary message is breadth. The blended technical read is bullish with an overall technical score of 0.592, supported by a strong DRL technical rank of #125 and a DRL score of 0.807. Importantly, the composition is not marginal: the breakdown shows Bull 12 / Bear 3 / Neutral 3, implying that multiple independent signal families are pointing in the same direction rather than a single indicator dominating the narrative.
At the indicator level, momentum alignment is consistent with the earlier dashboard: RSI(14) at 63.89 and MACD Hist at 0.01642 are bullish. Rate-of-change measures also support constructive behavior (e.g., ROC(20) at 1.898). However, the confluence is not perfectly clean. The Stoch %K at 86.67 is flagged bearish, a common pattern when price has pushed quickly within a range and becomes more sensitive to pullbacks or pauses.
Volume and accumulation signals are mixed rather than uniformly supportive. While measures such as ADOSC at 40 and AD Line slope(10) at 2.473e+08 are bullish, OBV slope(10) at -2.667e+08 is bearish. That divergence matters most near resistance (5.4800): breakouts tend to be more durable when volume proxies are broadly confirming. In the current configuration, confluence is bullish, but the market still benefits from participation confirmation at the level boundary.
Signal table (Bull/Bear/Neutral)
| Indicator | Value | Signal |
|---|---|---|
| MACD Hist | 0.01642 | Bullish |
| Stoch %K | 86.67 | Bearish |
| TS Mom(20) | 0.09667 | Bullish |
| TS Accel | 0.2867 | Bullish |
| RSI(14) | 63.89 | Bullish |
| ROC(20) | 1.898 | Bullish |
| ADOSC | 40 | Bullish |
| ChaikinOsc | 9.983e+07 | Bullish |
| OBV slope(10) | -2.667e+08 | Bearish |
| PVT slope(10) | 1.057e+06 | Bullish |
| AD Line slope(10) | 2.473e+08 | Bullish |
| Will A/D slope(10) | -0.01 | Bearish |
| BB Width | 0.03731 | Neutral |
| Chaikin Vol | -18.73 | Neutral |
| HHIGH(20) | 5.21 | Bullish |
| LLOW(20) | 4.98 | Neutral |
| MedPx vs Support | 0.12 | Bullish |
| Vol ROC(20) | 17.61 | Bullish |
Interpretation: Indicator-level signals form the base confluence, which is then adjusted using a separate AI-driven technical ranking model. The final technical score summarizes this combined view.
6) News sentiment + extractive gist
Note: Instrument-specific news matches were not found, so the digest includes broader market/sector headlines. Links are provided for verification.
Sentiment score (avg): -0.026 | Positive: 6% | Neutral: 75% | Negative: 19%
KGNAI AI News Sentiment Score (normalized -1 to +1): Not available (as of —) | Label: Not available | Overall news score: -0.03
Positive Developments
Recent coverage across major financial outlets indicates a modest set of constructive themes, largely driven by macro and sector narratives rather than company-specific catalysts. The news mix contains some pro-growth framing around shifting energy and supply dynamics, which can intermittently support risk appetite across China-related assets and broader cyclical exposures. Against the dashboard backdrop—bullish technical blend (0.592) and an upper-quartile weekly rank (#182)—a small positive news impulse can act as a stabilizer, helping dips remain contained above the 5.0650 support zone. That said, with positive items accounting for only 6% of sentiment and a large neutral share (75%), the base case remains that news functions as a background condition rather than a direct price driver. The constructive read is therefore conditional: supportive headlines matter most if they coincide with improving participation and a test of 5.4800.
Neutral / Mixed Developments
The dominant feature of the news tape is neutral density, consistent with the sentiment average near zero (-0.026) and the absence of instrument-specific matches. This creates a “low-information” environment where technical structures tend to carry more explanatory weight than narratives. In such regimes, markets frequently oscillate between support and resistance as participants wait for clearer catalysts. For 601169, that maps to a setup where the price/MA relationship (bullish vs MA50 but bearish MA50 vs MA200) can persist without a decisive regime change. Neutral coverage can still matter via second-order effects—policy tone, regulatory posture, or regional risk appetite—but it typically shows up as volatility suppression, consistent with Bollinger bandwidth around 0.0373. The net effect is a tape that may reinforce range behavior unless a new catalyst emerges.
Negative / Risk Signals
Risk-oriented items in recent coverage appear more associated with geopolitical, regulatory, and macro cost concerns than with company-level deterioration. With negative sentiment at 19% and the average score slightly negative (-0.026), the bias is mild but relevant because broader risk headlines can tighten liquidity and reduce follow-through near resistance. In a technically constructive but not fully confirmed regime, headline-driven risk can be enough to prevent a clean breakout above 5.4800, particularly if participation indicators remain mixed (for example, a bearish OBV slope(10) of -2.667e+08 alongside otherwise bullish measures). On the downside, risk headlines matter most if they coincide with a close below 5.0650, where the framework flags deterioration risk and compressed volatility can unwind into sharper moves.
- What to monitor next: Whether sentiment shifts away from the current high-neutral mix (75%) toward a clearer directional bias.
- What to monitor next: Any increase in market-wide volatility that changes the current compression regime (bandwidth 0.0373).
- What to monitor next: Reaction quality at 5.4800 and 5.0650 as risk narratives evolve.
Sources referenced: Reuters, Bloomberg, Yahoo Finance, MarketWatch, Investing.com
Snapshot: AI Rank (Short–Mid–Long): Neutral (Neutral–Neutral–Neutral) · Technical Confluence: Bullish · Key Levels: Support ~5.06 | Resistance ~5.48 · News Sentiment: Neutral
7) Sources
Not available in the provided data.
You may also like: How KGNAI AI ranks instruments across global markets
Disclaimer: KGNAI provides AI-generated analytics and educational market commentary only. This is not financial advice. Markets involve risk. Always do your own research.