
688222 (HitGen Inc. A) — 03-Jun-2026 Technical & Rank Update with a Bearish Bias
HitGen Inc. A (688222) screens as bearish across multiple horizons within KGNAI’s cross-sectional ranking framework, with the weekly (#1136/1292) and monthly (#1194/1292) positions sitting deep in the lower tier of the tracked China universe. The technical layer reinforces this bias: the 18-signal confluence score is -0.500 (Bearish) and the overall blended technical score is -0.515 (Bearish), indicating broad indicator agreement rather than a single-factor weakness. Momentum diagnostics show a negative MACD histogram (-0.5366) alongside an RSI(14) of 41.1, consistent with a market that has not re-established sustained upside impulse. Key decision zones remain well-defined at support ~26.0050 and resistance ~31.8400; price acceptance above resistance would be a meaningful regime check, while a break below support would increase deterioration risk. News sentiment is largely neutral in distribution (94% neutral) despite a normalized label reading Bullish (1.00) in the provided data.
Key Takeaways
- Rank stance: Short-term Neutral (daily #817/1292), Mid-term Bearish (weekly #1136/1292; monthly #1194/1292), Long-term: Not available.
- Technical confluence: Bearish (18-signal -0.500; blended -0.515; Bull 3 / Bear 12 / Neutral 3).
- Key levels: Support ~26.0050 | Resistance ~31.8400.
- News sentiment bias: Distribution Neutral (avg -0.013; 94% neutral), while normalized label reads Bullish (1.00, as of 2026-04-02).
- Confirmation / invalidation condition: Acceptance above 31.8400 with volume improves continuation odds; a close below 26.0050 increases deterioration risk.
What KGNAI Measures
KGNAI evaluates assets using large cross-sectional datasets built from millions of structured data points. Inputs incorporate fundamental metrics, technical structures, and systematically processed news sentiment. Statistical models, machine learning, and AI frameworks are used to assess relative positioning, signal alignment, and probabilistic behavior across broad universes.
How to Read This Report
- Ranks are comparative across the tracked universe, not absolute price targets.
- Confluence reflects alignment among independent signal groups.
- Support/resistance levels are probabilistic decision zones, not guarantees.
- Sentiment provides contextual bias within the broader analytical framework.
1) KGNAI AI Analysis
Region: CHINA
Total universe size: 1292 ranked instruments
- Daily rank: #817 out of 1292 — Neutral
- Weekly rank: #1136 out of 1292 — Bearish
- Monthly rank: #1194 out of 1292 — Bearish
- 3-Monthly rank: #1028 out of 1292 — Neutral
- 6-Monthly rank: Not available for this horizon — Not available
- Yearly rank: Not available for this horizon — Not available
Cross-sectional ranks place 688222 in a weaker relative cohort on the horizons that typically dominate positioning decisions. The weekly rank #1136 and monthly rank #1194 are both in the lower segment of a 1292-instrument universe, consistent with a mid-term profile that has struggled to keep pace with peers. The daily rank (#817) and 3-month rank (#1028) are comparatively less negative, creating a mild horizon split: shorter windows are not strongly supportive, but they are also not as depressed as the weekly/monthly layer.
Horizon alignment vs. divergence
The key analytical feature is the alignment of mid-term weakness with only partial relief at shorter horizons. When daily and 3-month ranks stabilize while weekly and monthly remain deep in the bottom tier, it often reflects intermittent mean reversion within a broader down-biased regime. In those conditions, the model’s conservative posture tends to treat rallies as unconfirmed until multiple horizons improve simultaneously.
Data availability constraints
The 6-month and yearly ranks are not available in the provided data, limiting the ability to classify long-horizon persistence. With long-term signals absent, the most defensible read is to weight the weekly/monthly ranking pressure more heavily, while using key levels (support/resistance) as invalidation points for any short-lived improvement in the daily layer.
Term view: Short-term: Bearish. Mid-term: Bearish. Long-term: Not available.
Want the full universe and complete rank tables? Unlock full access on KGNAI: https://www.kgnai.com/pricing
2) Price & trend overview
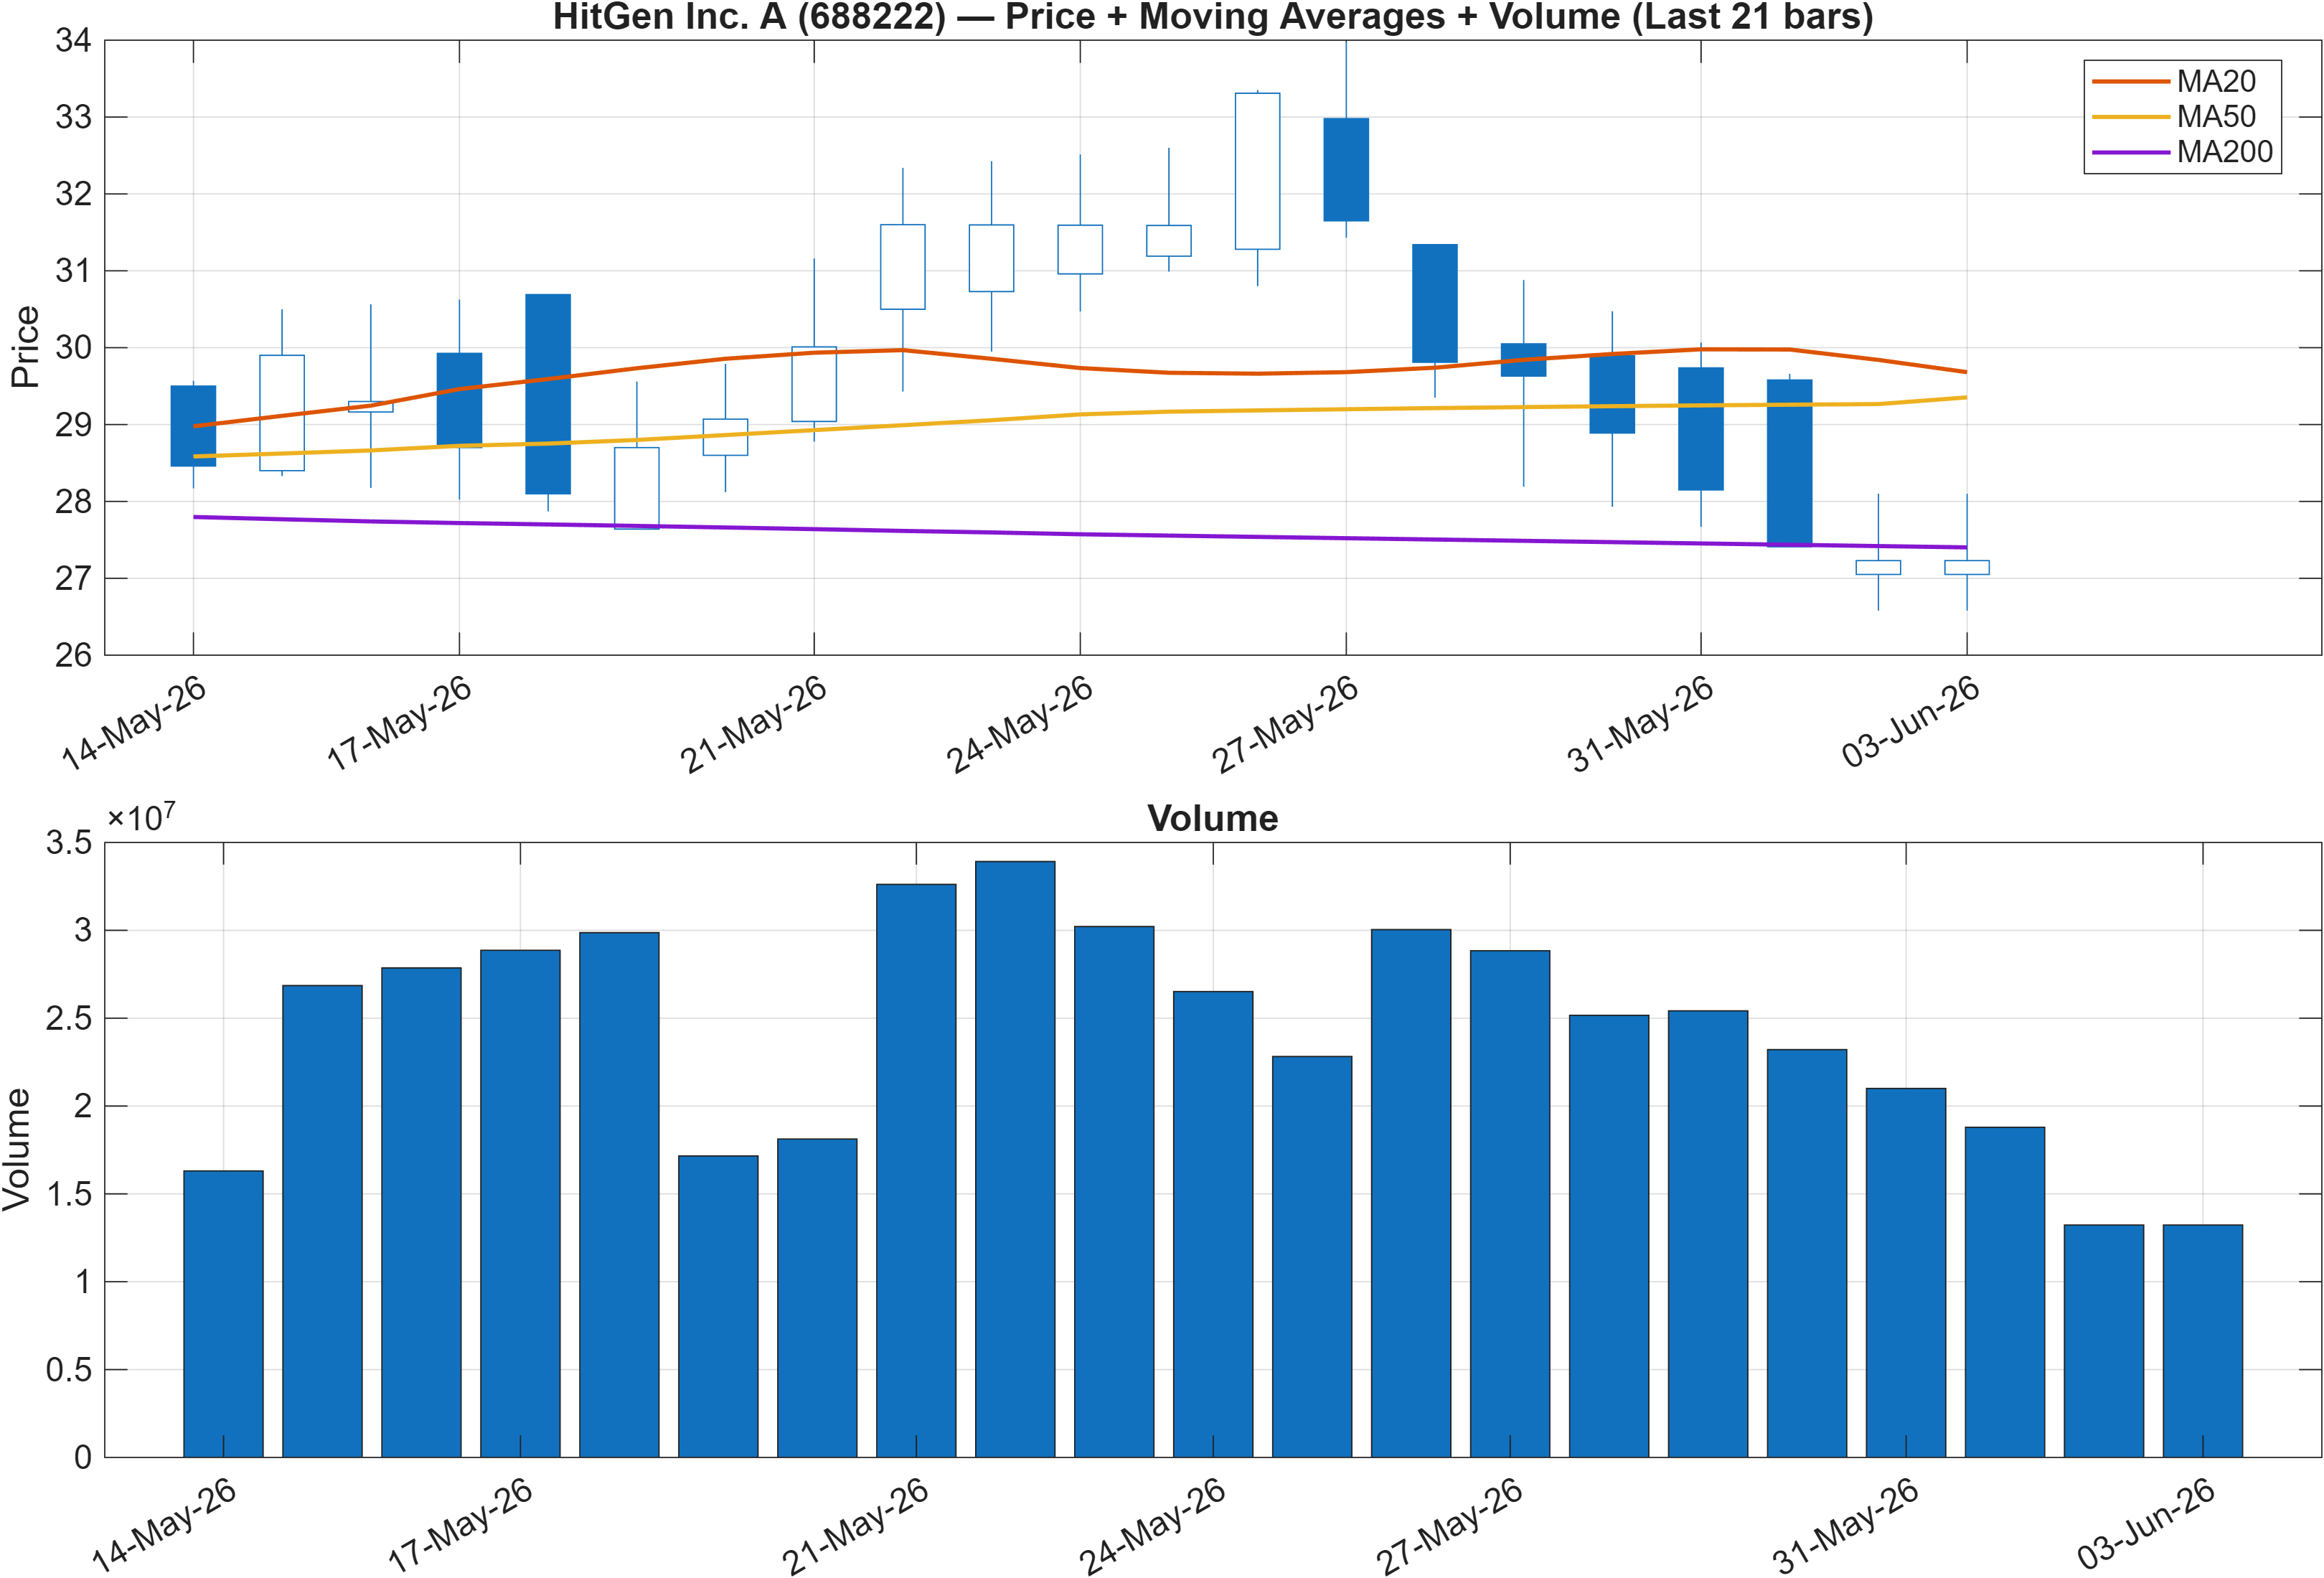
Interpretation: Close vs MA50 = Bearish, MA50 vs MA200 = Bullish.
Regime tension: short-term weakness inside a longer-horizon up-slope
The moving-average interpretation is internally mixed: close vs MA50 is Bearish, while MA50 vs MA200 is Bullish. That combination typically characterizes a market where the intermediate trend has weakened even though the longer-duration structure has not fully rolled over. Practically, this setup often increases the probability of choppy, range-like trade because trend participants are receiving conflicting information from different lookback windows.
Trend persistence vs. mean reversion risk
When price is below the 50-day average but the 50-day remains above the 200-day, rallies can materialize quickly, but they often face overhead supply near trend reference points until price can reclaim the MA50 with consistency. That framing aligns with the rank profile where the weekly and monthly horizons are notably weak (#1136 and #1194), while the daily is less extreme (#817). In other words, the tape can bounce, but it is not yet behaving like a sustained leadership candidate within the universe.
Volume as confirmation (contextual)
Volume is shown in Figure 1, but no discrete volume statistics are provided beyond the visual. Confirmation therefore relies more heavily on the level-based framework (support/resistance) and on momentum/volatility diagnostics, including MACD hist -0.5366 and BB Width 0.2334, to judge whether pullbacks are controlled or whether weakness is broadening.
3) Momentum & volatility dashboard
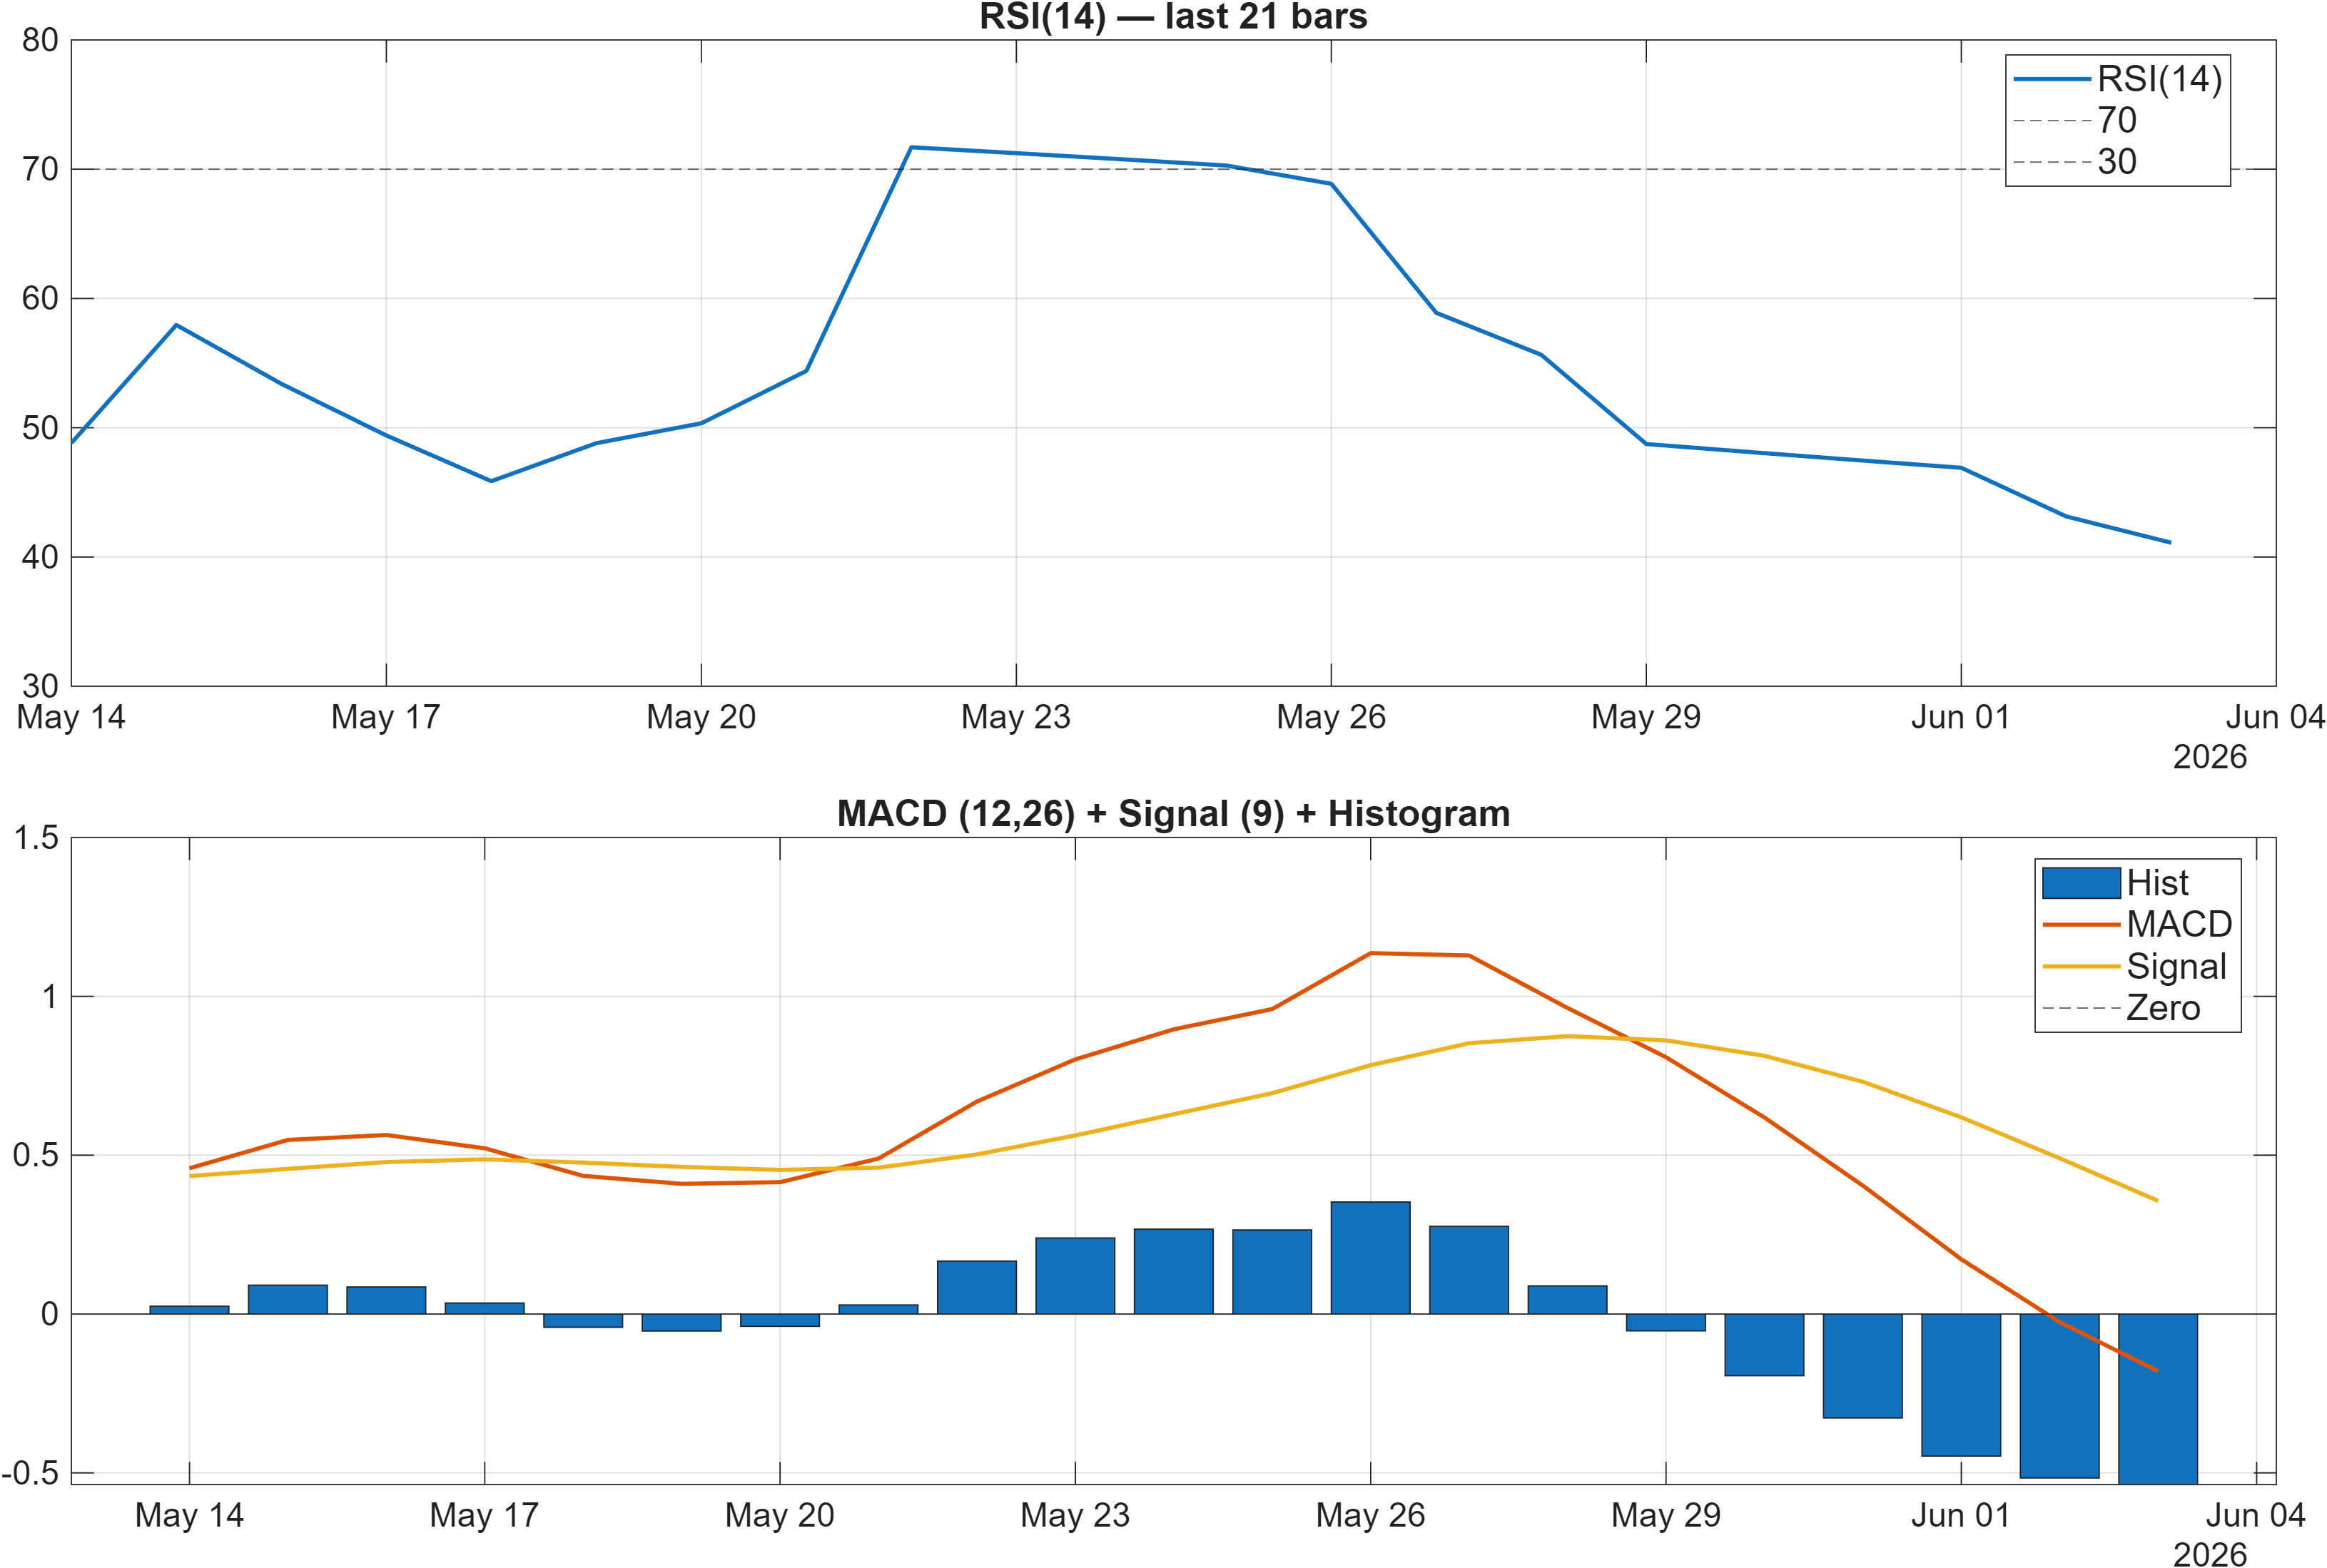
Interpretation: RSI bias = Neutral, MACD hist = -0.5366.
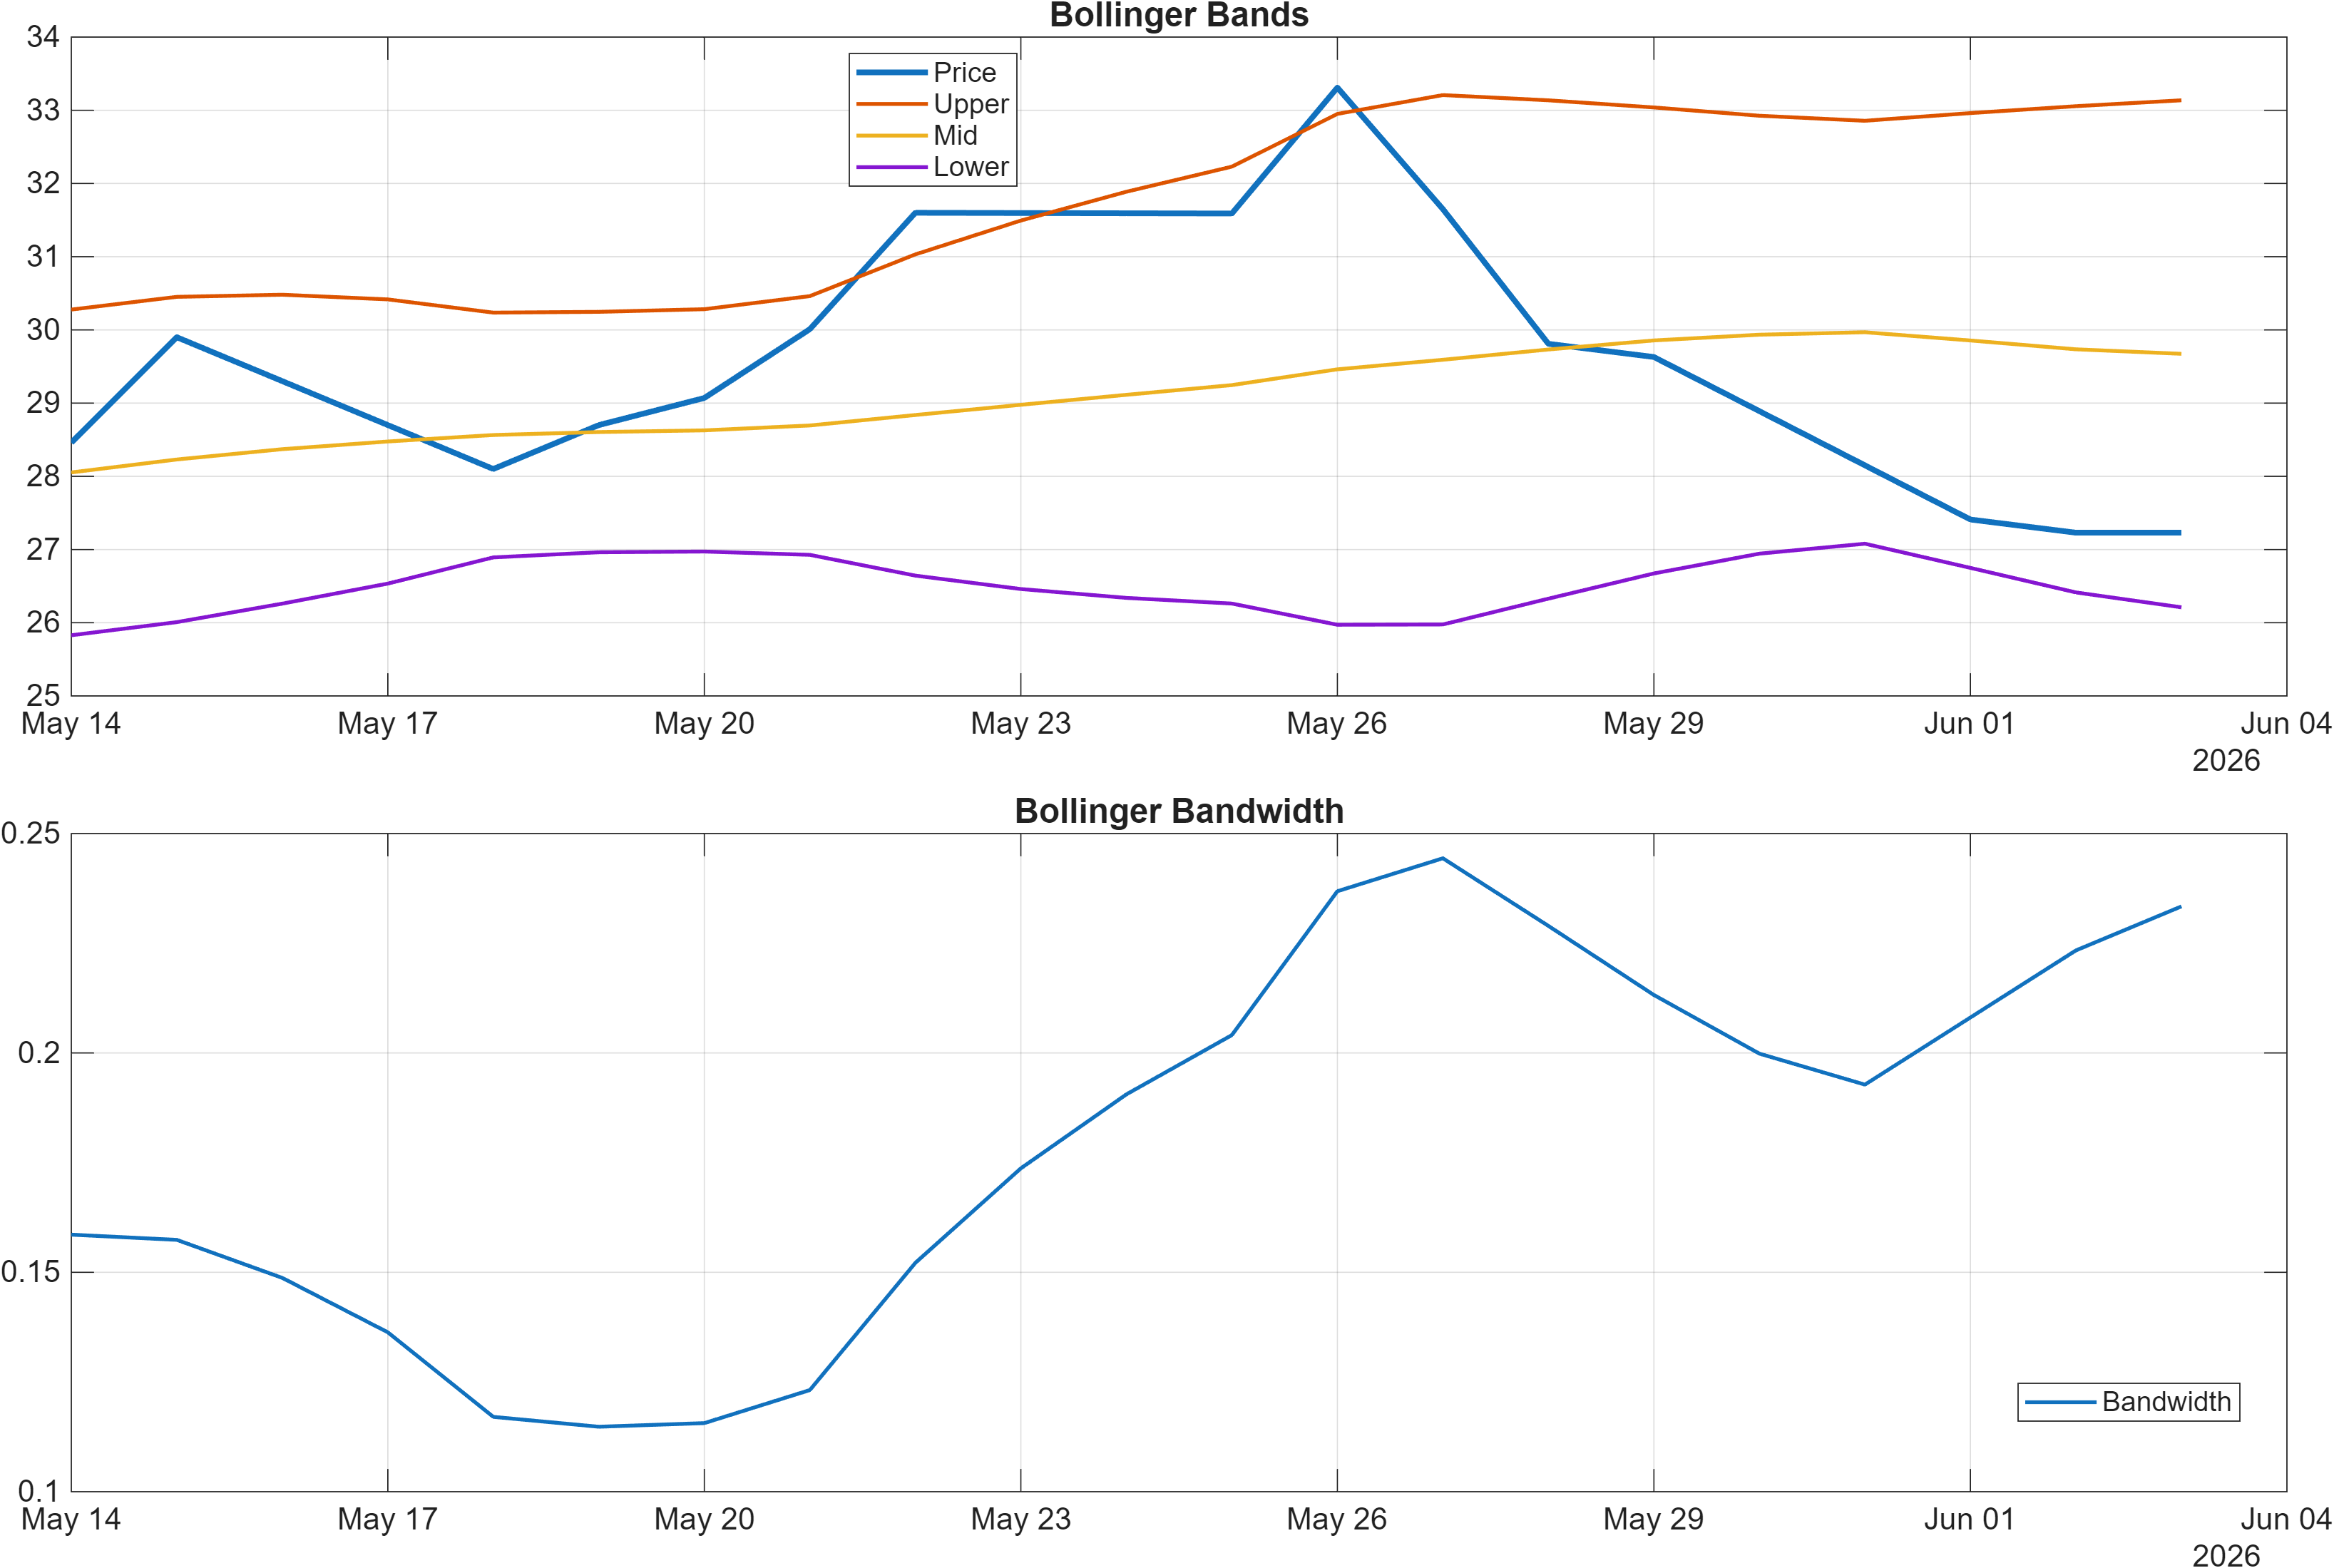
Interpretation: Bandwidth (volatility regime) latest = 0.2334.
Momentum: bearish MACD with sub-50 RSI
Momentum readings lean negative even as the high-level note marks RSI bias as neutral. The MACD histogram at -0.5366 indicates downside momentum remains present, and the signal table reinforces that with TS Mom(20) at -2.67 and ROC(20) at -8.93, both flagged Bearish. Meanwhile, RSI(14) at 41.1 sits below the midpoint, consistent with a market that has not rebuilt sustained upside pressure. This trio (MACD/ROC/RSI) collectively points to trend-following participants remaining cautious.
Volatility regime: controlled, not explosive
Bollinger bandwidth at 0.2334 is a useful regime descriptor: it suggests volatility is present but not necessarily in a breakout state. In a controlled-volatility decline, price often remains responsive to nearby reference levels (moving averages and horizontal zones), which increases the analytical value of the 26.0050 support and 31.8400 resistance thresholds.
Compression vs. downside drift
The mix of a negative MACD histogram and a moderate bandwidth can reflect downside drift rather than capitulation. That distinction matters because it often produces incremental lower lows without the kind of volatility spike that forces quick reversals. Any change in this character would likely show up first as improving momentum (MACD histogram moving toward zero) alongside a shift in confluence away from Bearish (-0.500) rather than as a single-day price move.
4) Support / Resistance zones
Support ~ 26.0050 | Resistance ~ 31.8400
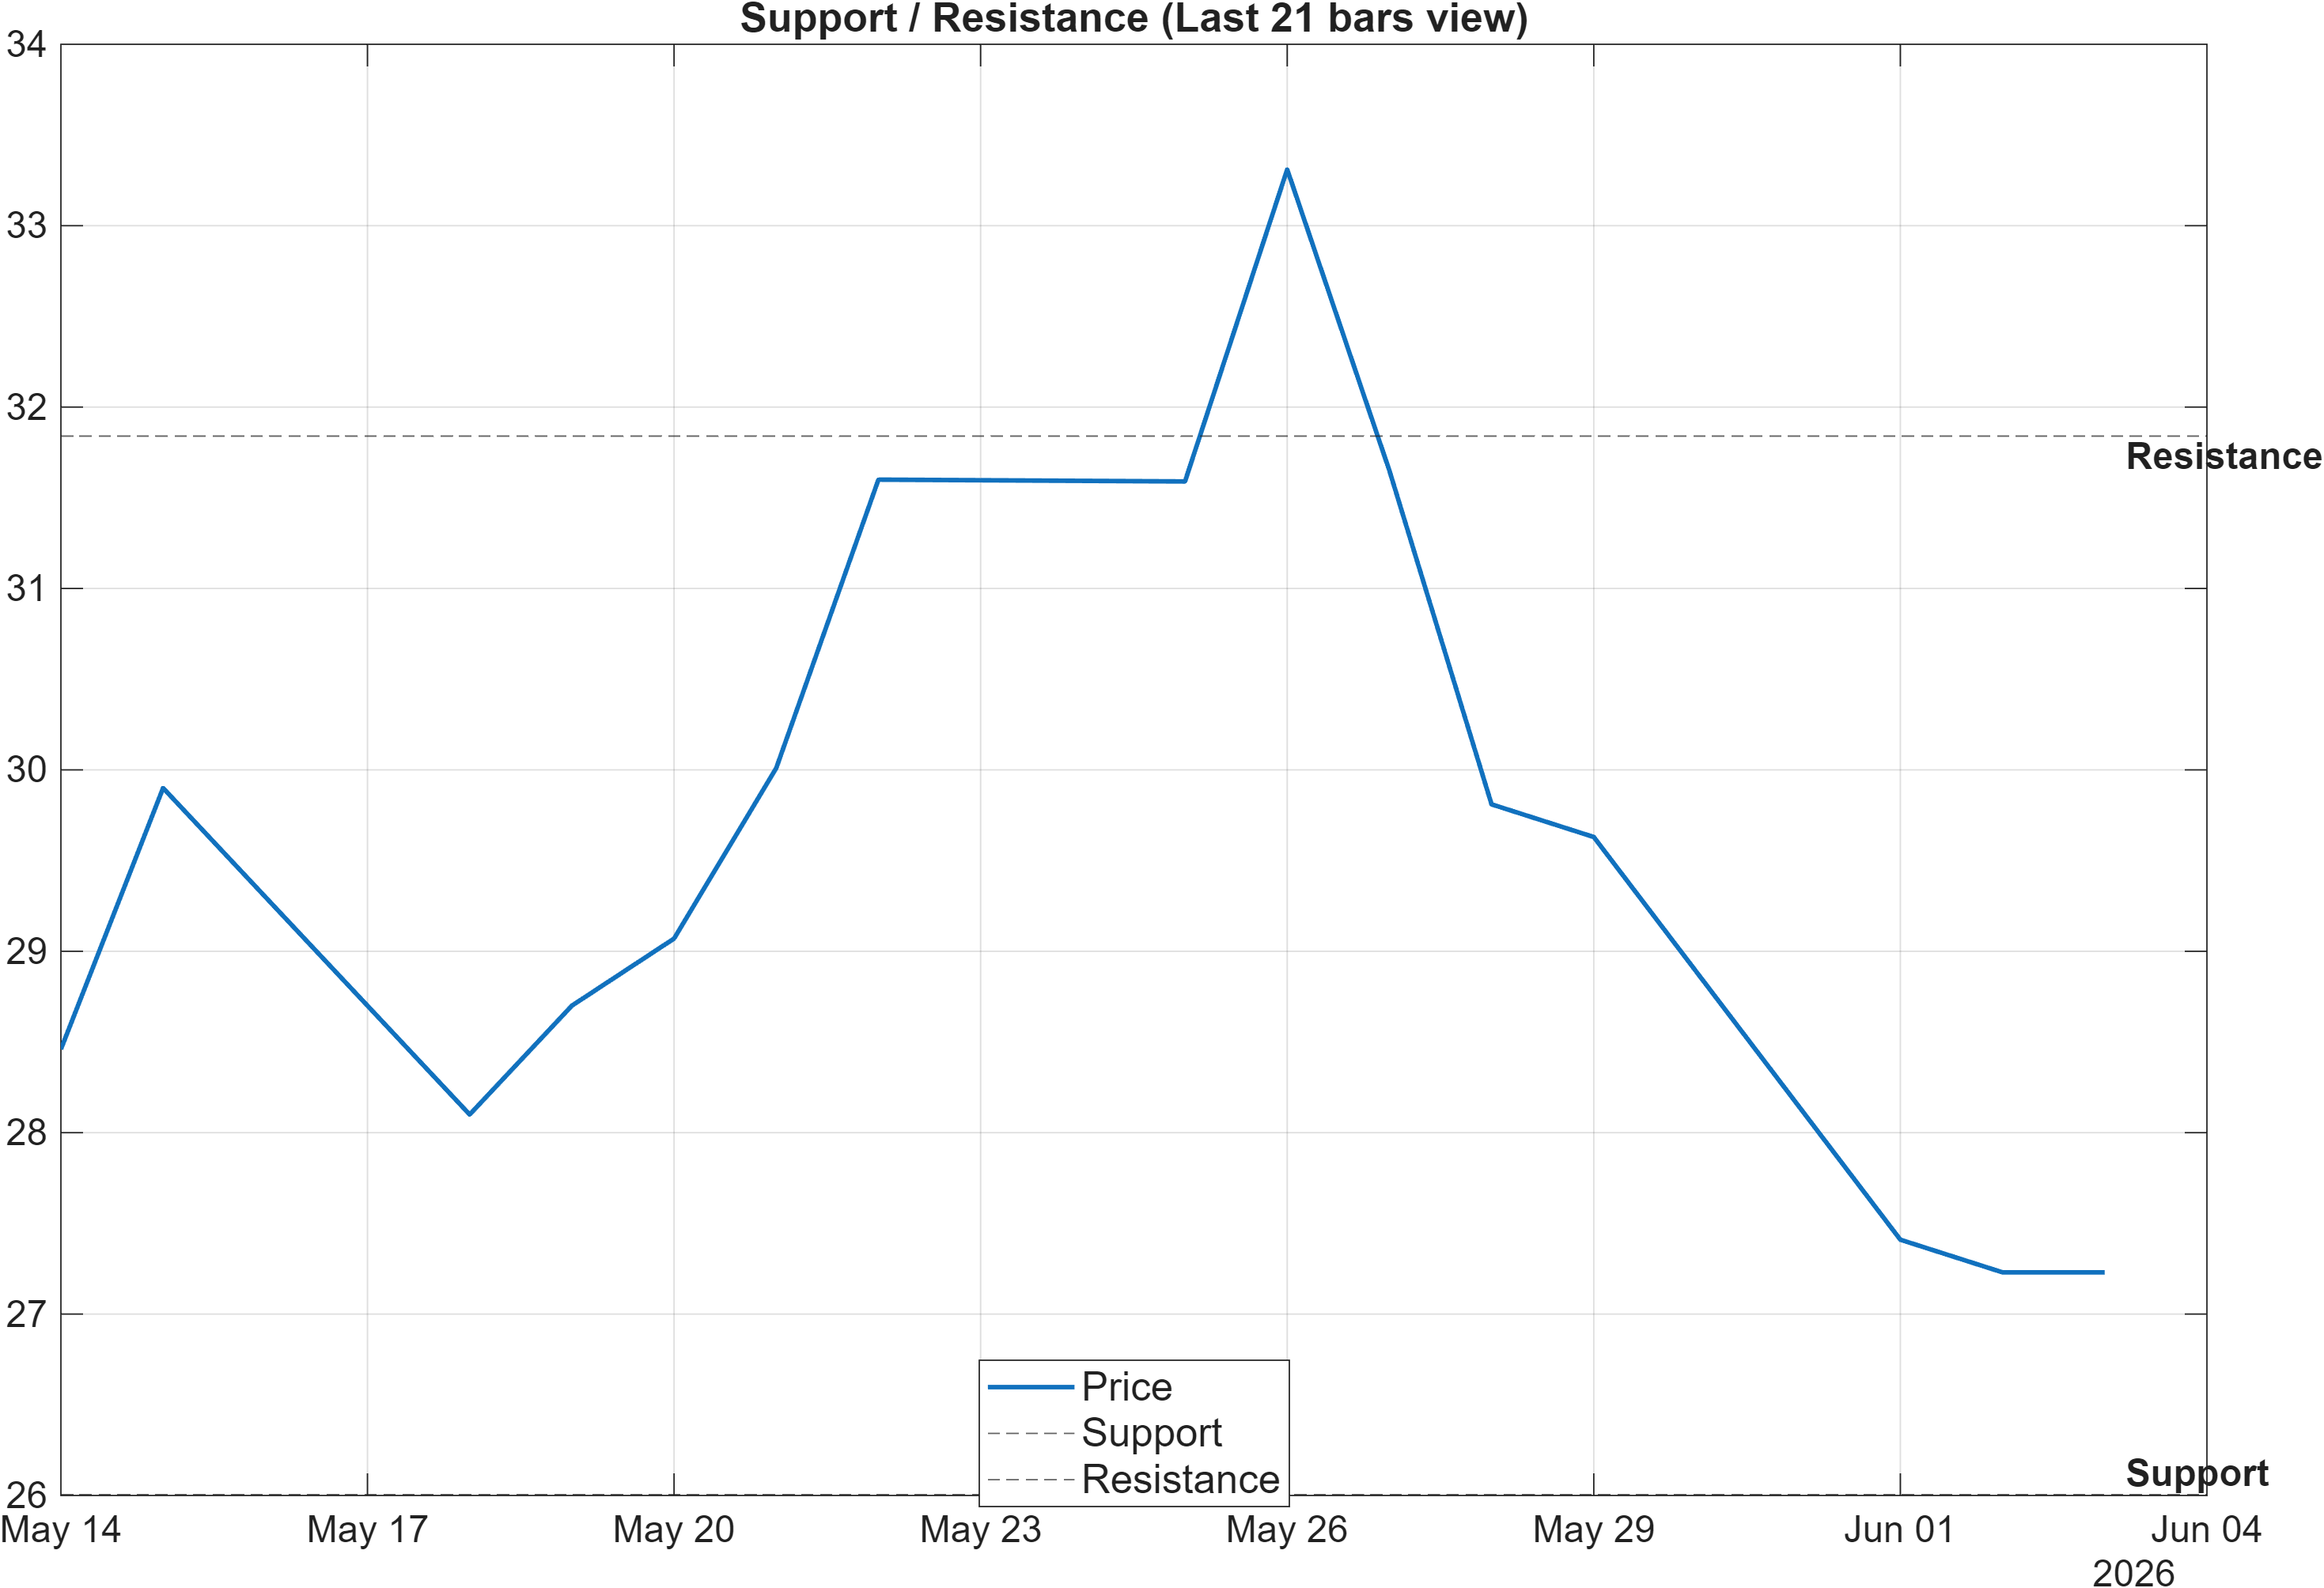
Scenario view: Break above resistance with volume → continuation. Close below support → signal deterioration risk.
Decision zones: probabilistic levels for regime validation
The horizontal map is concise and therefore analytically high-impact: 26.0050 defines the near-term support zone, while 31.8400 anchors resistance. With the broader technical posture bearish (overall blended -0.515), these levels function less as “targets” and more as validation boundaries for whether the market is transitioning out of weakness or reinforcing it.
Support integrity vs. breakdown risk
A deterioration scenario is explicitly tied to a close below 26.0050. That aligns with the momentum stack—negative MACD histogram -0.5366 and bearish ROC(20) -8.93—which tends to reduce the reliability of shallow bounces if support is decisively lost. In such cases, the indicator mix often migrates from “bearish drift” toward bearish expansion, where volatility can rise after the level fails.
Resistance reclaim as a quality filter
On the constructive side, a break above 31.8400 “with volume” is framed as continuation. Within the broader dataset, that condition would serve as a quality filter because it asks for both price acceptance and participation, not a transient oversold rebound. Given that the MA structure is mixed (close vs MA50 bearish; MA50 vs MA200 bullish), reclaiming resistance would also help reconcile the intermediate weakness with the still-positive longer moving-average relationship.
5) Quant Technical Dashboard (18 Signals)
KGNAI AI Technical Analysis Score (Deep Reinforcement Learning): Rank #1001 out of 1292 (Rank 1 represents the strongest technical positioning and a higher probability of favorable price behavior. As ranks increase toward the maximum, the probability of favorable outcomes weakens and bearish positioning becomes more dominant.) | Label: Neutral | Score: -0.550
18-Signal Technical Confluence Score: -0.500 (Bearish)
Overall Technical Score (18-signal confluence + DRL rank blend): -0.515 (Bearish)
Note: The blended score reflects signal strength weighted against broader AI technical ranking, which may temporarily diverge.
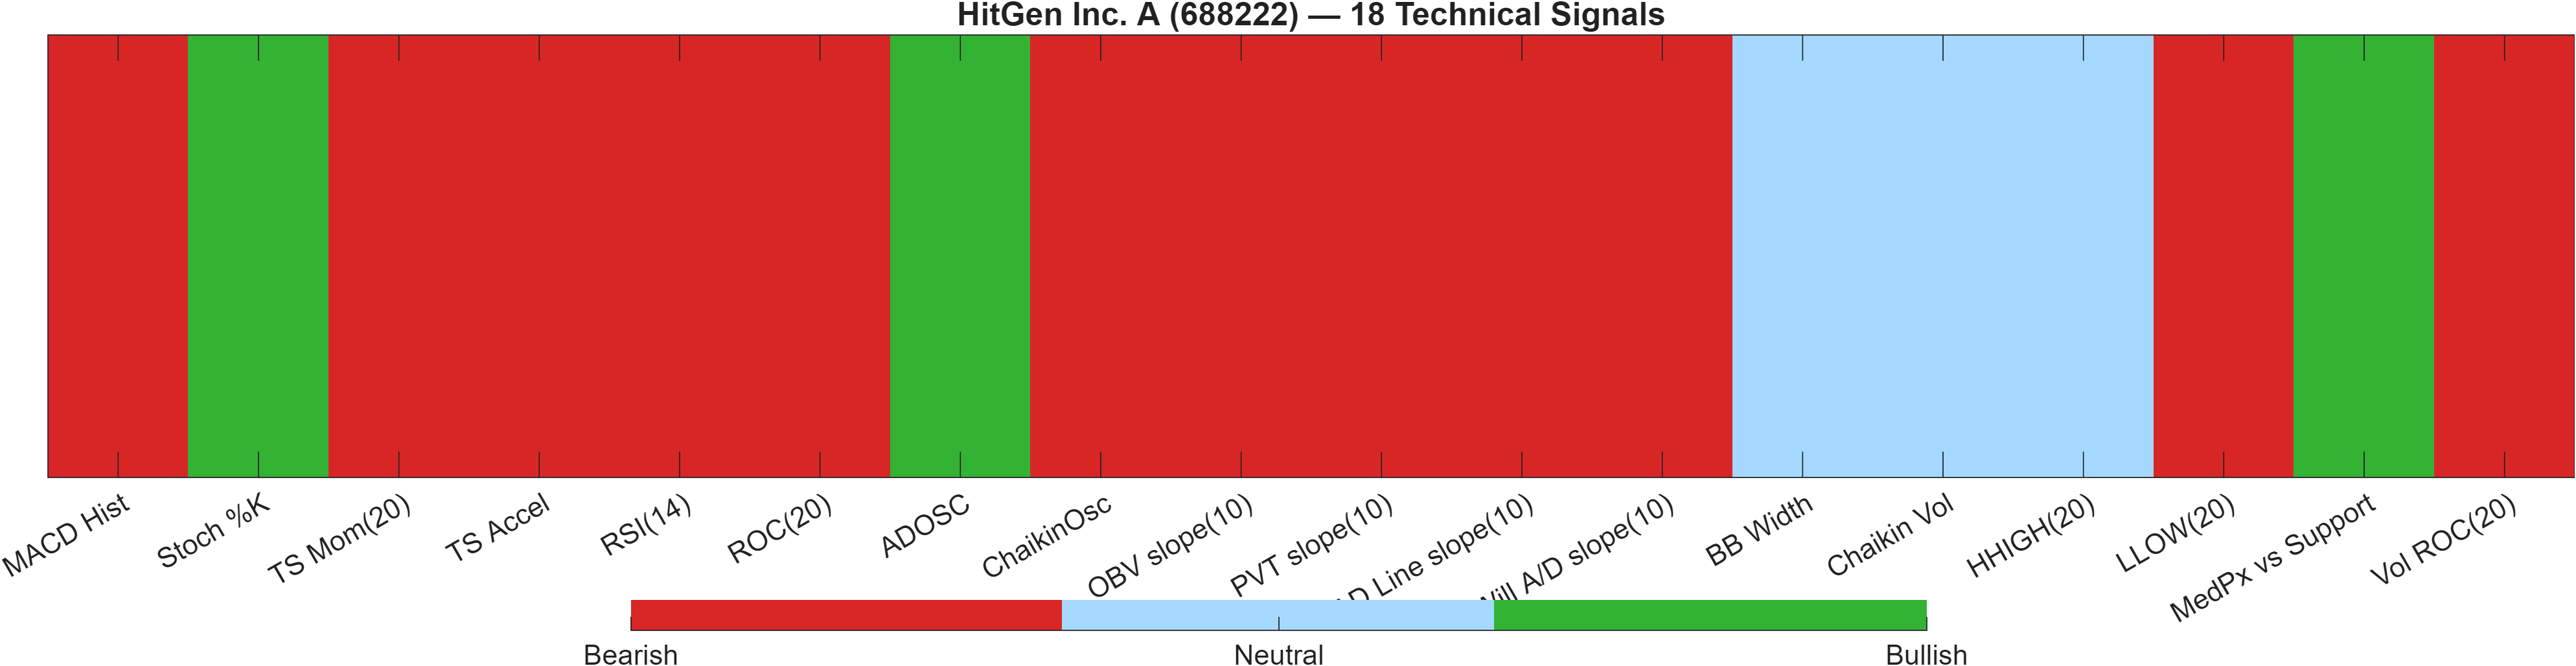
Blended technical score breakdown: -0.515 (Bearish | Bull 3 / Bear 12 / Neutral 3)
Signal mix: breadth of bearish agreement
The dashboard character is defined by breadth. The confluence score of -0.500 and the breakdown (Bear 12 vs Bull 3) indicate bearish signals are distributed across momentum, trend, and volume/accumulation categories, rather than concentrated in a single indicator family. This matters because broad agreement typically increases signal persistence unless price can force a regime shift through level reclamation.
Confluence vs. DRL rank: mild divergence, same direction
The Deep Reinforcement Learning technical rank is #1001/1292 with a score of -0.550 labeled Neutral. While the label differs from the confluence’s Bearish tag, the score remains negative and the blended output settles at -0.515 (Bearish). This is a form of model-level divergence that is directionally consistent: the DRL layer is less categorical, but it does not contradict the bearish skew embedded in the indicator ensemble.
Selected indicator anchors (non-exhaustive)
A few readings help explain the bearish weighting without reproducing the entire table: RSI(14) 41.1 (Bearish) reinforces subdued momentum; Stoch %K 8.784 (Bullish) signals localized oversold pressure that can fuel short rebounds; and Vol ROC(20) -50.75 (Bearish) suggests activity has not been supportive on the way down. Together, these often map to a market where rallies occur, but they require follow-through before the broader bias changes.
Signal table (Bull/Bear/Neutral)
| Indicator | Value | Signal |
|---|---|---|
| MACD Hist | -0.5366 | Bearish |
| Stoch %K | 8.784 | Bullish |
| TS Mom(20) | -2.67 | Bearish |
| TS Accel | -6.087 | Bearish |
| RSI(14) | 41.1 | Bearish |
| ROC(20) | -8.93 | Bearish |
| ADOSC | 55.92 | Bullish |
| ChaikinOsc | -1.736e+07 | Bearish |
| OBV slope(10) | -1.484e+08 | Bearish |
| PVT slope(10) | -3.119e+06 | Bearish |
| AD Line slope(10) | -5.321e+07 | Bearish |
| Will A/D slope(10) | -10.54 | Bearish |
| BB Width | 0.2334 | Neutral |
| Chaikin Vol | -2.655 | Neutral |
| HHIGH(20) | 33.98 | Neutral |
| LLOW(20) | 26.58 | Bearish |
| MedPx vs Support | 1.335 | Bullish |
| Vol ROC(20) | -50.75 | Bearish |
Interpretation: Indicator-level signals form the base confluence, which is then adjusted using a separate AI-driven technical ranking model. The final technical score summarizes this combined view.
6) News sentiment + extractive gist
Note: Instrument-specific news matches were not found, so the digest includes broader market/sector headlines. Links are provided for verification.
Sentiment score (avg): -0.013 | Positive: 0% | Neutral: 94% | Negative: 6%
KGNAI AI News Sentiment Score (normalized -1 to +1): 1.00 (as of 2026-04-02) | Label: Bullish | Overall news score: 1.00
Positive Developments
Recent coverage across major financial outlets indicates a constructive backdrop around AI policy and cross-border dialogue themes, which can support risk appetite in adjacent technology and innovation-linked segments. The current sentiment distribution is overwhelmingly neutral (94%), but the normalized sentiment label in the provided data reads Bullish (1.00) as of 2026-04-02, implying the model’s scoring framework has recently interpreted the broader narrative set as supportive rather than threatening. For 688222 specifically, this does not override the technical picture (overall technical score -0.515), but it can reduce the probability that weakness is being reinforced by a persistently negative headline cycle. In practical market-structure terms, a constructive macro/sector narrative can help liquidity re-enter on dips, making the 26.0050 support zone a more relevant near-term decision point than it would be under a sharply negative news regime.
Neutral / Mixed Developments
The dataset flags that instrument-specific matches were not found, so the digest should be treated as context rather than a driver. With positive at 0% and negative at 6%, the tape is operating under a low-information news regime where price action is more likely to be governed by technical positioning, flow, and broader risk conditions than by company-level catalysts. This neutrality is consistent with a market that can oscillate between technical zones—particularly when volatility is not in breakout mode (BB Width 0.2334). In that environment, short-lived relief rallies can appear even while mid-term ranks remain weak (#1136 weekly; #1194 monthly).
Negative / Risk Signals
Risk signals in the digest are not company-specific and appear primarily as broader geopolitical and global-risk narratives. Even when the measured average sentiment is near flat (-0.013), such themes can still influence correlations and de-risking behavior, especially when technical momentum is already negative (MACD histogram -0.5366, RSI(14) 41.1). The key analytical issue is sentiment vs. price conflict: the normalized sentiment label reads bullish (1.00), while the technical stack remains bearish (18-signal confluence -0.500). When these disagree, markets often require a price-based confirmation—typically a reclaim of resistance (31.8400) or a clear stabilization above support (26.0050)—before the narrative tone becomes tradable context rather than background noise.
- What to monitor next: Whether price can reclaim 31.8400 with participation, aligning sentiment context with technical confirmation.
- What to monitor next: Any decisive loss of 26.0050 alongside further momentum deterioration (MACD histogram staying negative).
- What to monitor next: Whether volatility shifts materially from BB Width 0.2334 toward expansion, which would change the character of moves around the key zones.
Sources referenced: Reuters, Bloomberg, Yahoo Finance, MarketWatch, Investing.com
7) Sources
Not available in the provided data.
You may also like: How KGNAI AI ranks instruments across global markets
Disclaimer: KGNAI provides AI-generated analytics and educational market commentary only. This is not financial advice. Markets involve risk. Always do your own research.