
603505 (China Kings Resources Group Co) — 31-May-2026 Technicals Bearish, Longer-Horizon Ranks Still Supportive
China Kings Resources Group Co (603505) shows a notable cross-horizon split as of 31-May-2026: shorter-term KGNAI ranks sit in neutral territory while medium-to-long horizons remain strongly positioned within the broader China universe of 1292 instruments. This divergence matters because the blended technical picture is currently bearish even as the longer-horizon ranking stack (monthly through yearly) points to comparatively stronger historical price behavior versus peers. Momentum signals lean defensive—RSI(14) is 32.17 and MACD histogram is -0.4831—while volatility is neither compressed nor extreme with Bollinger Band width at 0.2986. The key map for near-term validation is defined by support ~17.3425 and resistance ~22.3000, which frames whether weakness is a pullback within a stronger regime or the start of broader deterioration.
- Rank stance: Short-term Neutral | Mid-term Bullish | Long-term Bullish
- Technical confluence: Bearish (18-signal score -0.389; blended overall -0.464)
- Decision levels: Support ~ 17.3425 | Resistance ~ 22.3000
- News sentiment bias: Neutral (avg 0.000; 75% neutral)
- Confirmation / invalidation: A break above 22.3000 with volume supports continuation; a close below 17.3425 increases deterioration risk.
What KGNAI Measures
KGNAI evaluates assets using large cross-sectional datasets built from millions of structured data points. Inputs incorporate fundamental metrics, technical structures, and systematically processed news sentiment. Statistical models, machine learning, and AI frameworks are used to assess relative positioning, signal alignment, and probabilistic behavior across broad universes.
How to Read This Report
- Ranks are comparative across the tracked universe, not absolute price targets.
- Confluence reflects alignment among independent signal groups.
- Support/resistance levels are probabilistic decision zones, not guarantees.
- Sentiment provides contextual bias within the broader analytical framework.
1) KGNAI AI Analysis
Region: CHINA
Total universe size: 1292 ranked instruments
- Daily rank: #602 out of 1292 — Neutral
- Weekly rank: #900 out of 1292 — Neutral
- Monthly rank: #83 out of 1292 — Bullish
- 3-Monthly rank: #22 out of 1292 — Bullish
- 6-Monthly rank: #40 out of 1292 — Bullish
- Yearly rank: #17 out of 1292 — Bullish
Cross-horizon alignment vs. divergence
The rank stack is front-end neutral while the back end is distinctly constructive. Daily rank #602 and weekly rank #900 sit around the middle-to-lower half of the 1292-instrument universe, consistent with a market state that is not currently rewarding short-horizon momentum. In contrast, the monthly rank #83 moves into the upper decile, and the 3-month #22, 6-month #40, and yearly #17 are firmly in the top cohort.
This pattern typically flags a regime mismatch: longer-term relative behavior remains favorable, but the most recent impulse has cooled. For positioning and risk control, this tends to shift the focus away from “trend strength” and toward trend maintenance—i.e., whether pullbacks remain orderly and confined to defined support zones.
The term view encoded by these ranks is unchanged in the provided snapshot: Short-term Neutral, Mid-term Bullish, Long-term Bullish. Practically, it sets up a framework where near-term weakness can exist without invalidating the broader relative standing—unless technical deterioration compounds and breaks key structural levels later described in the support/resistance section.
KGNAI ranks each instrument across large universes using multiple proprietary AI tests and statistical models (millions of data points). Lower ranks generally indicate stronger probability of favorable performance behavior, while higher ranks indicate weaker probability and more bearish positioning.
Term view: Short-term: Neutral. Mid-term: Bullish. Long-term: Bullish.
Want the full universe and complete rank tables? Unlock full access on KGNAI: https://www.kgnai.com/pricing
2) Price & trend overview
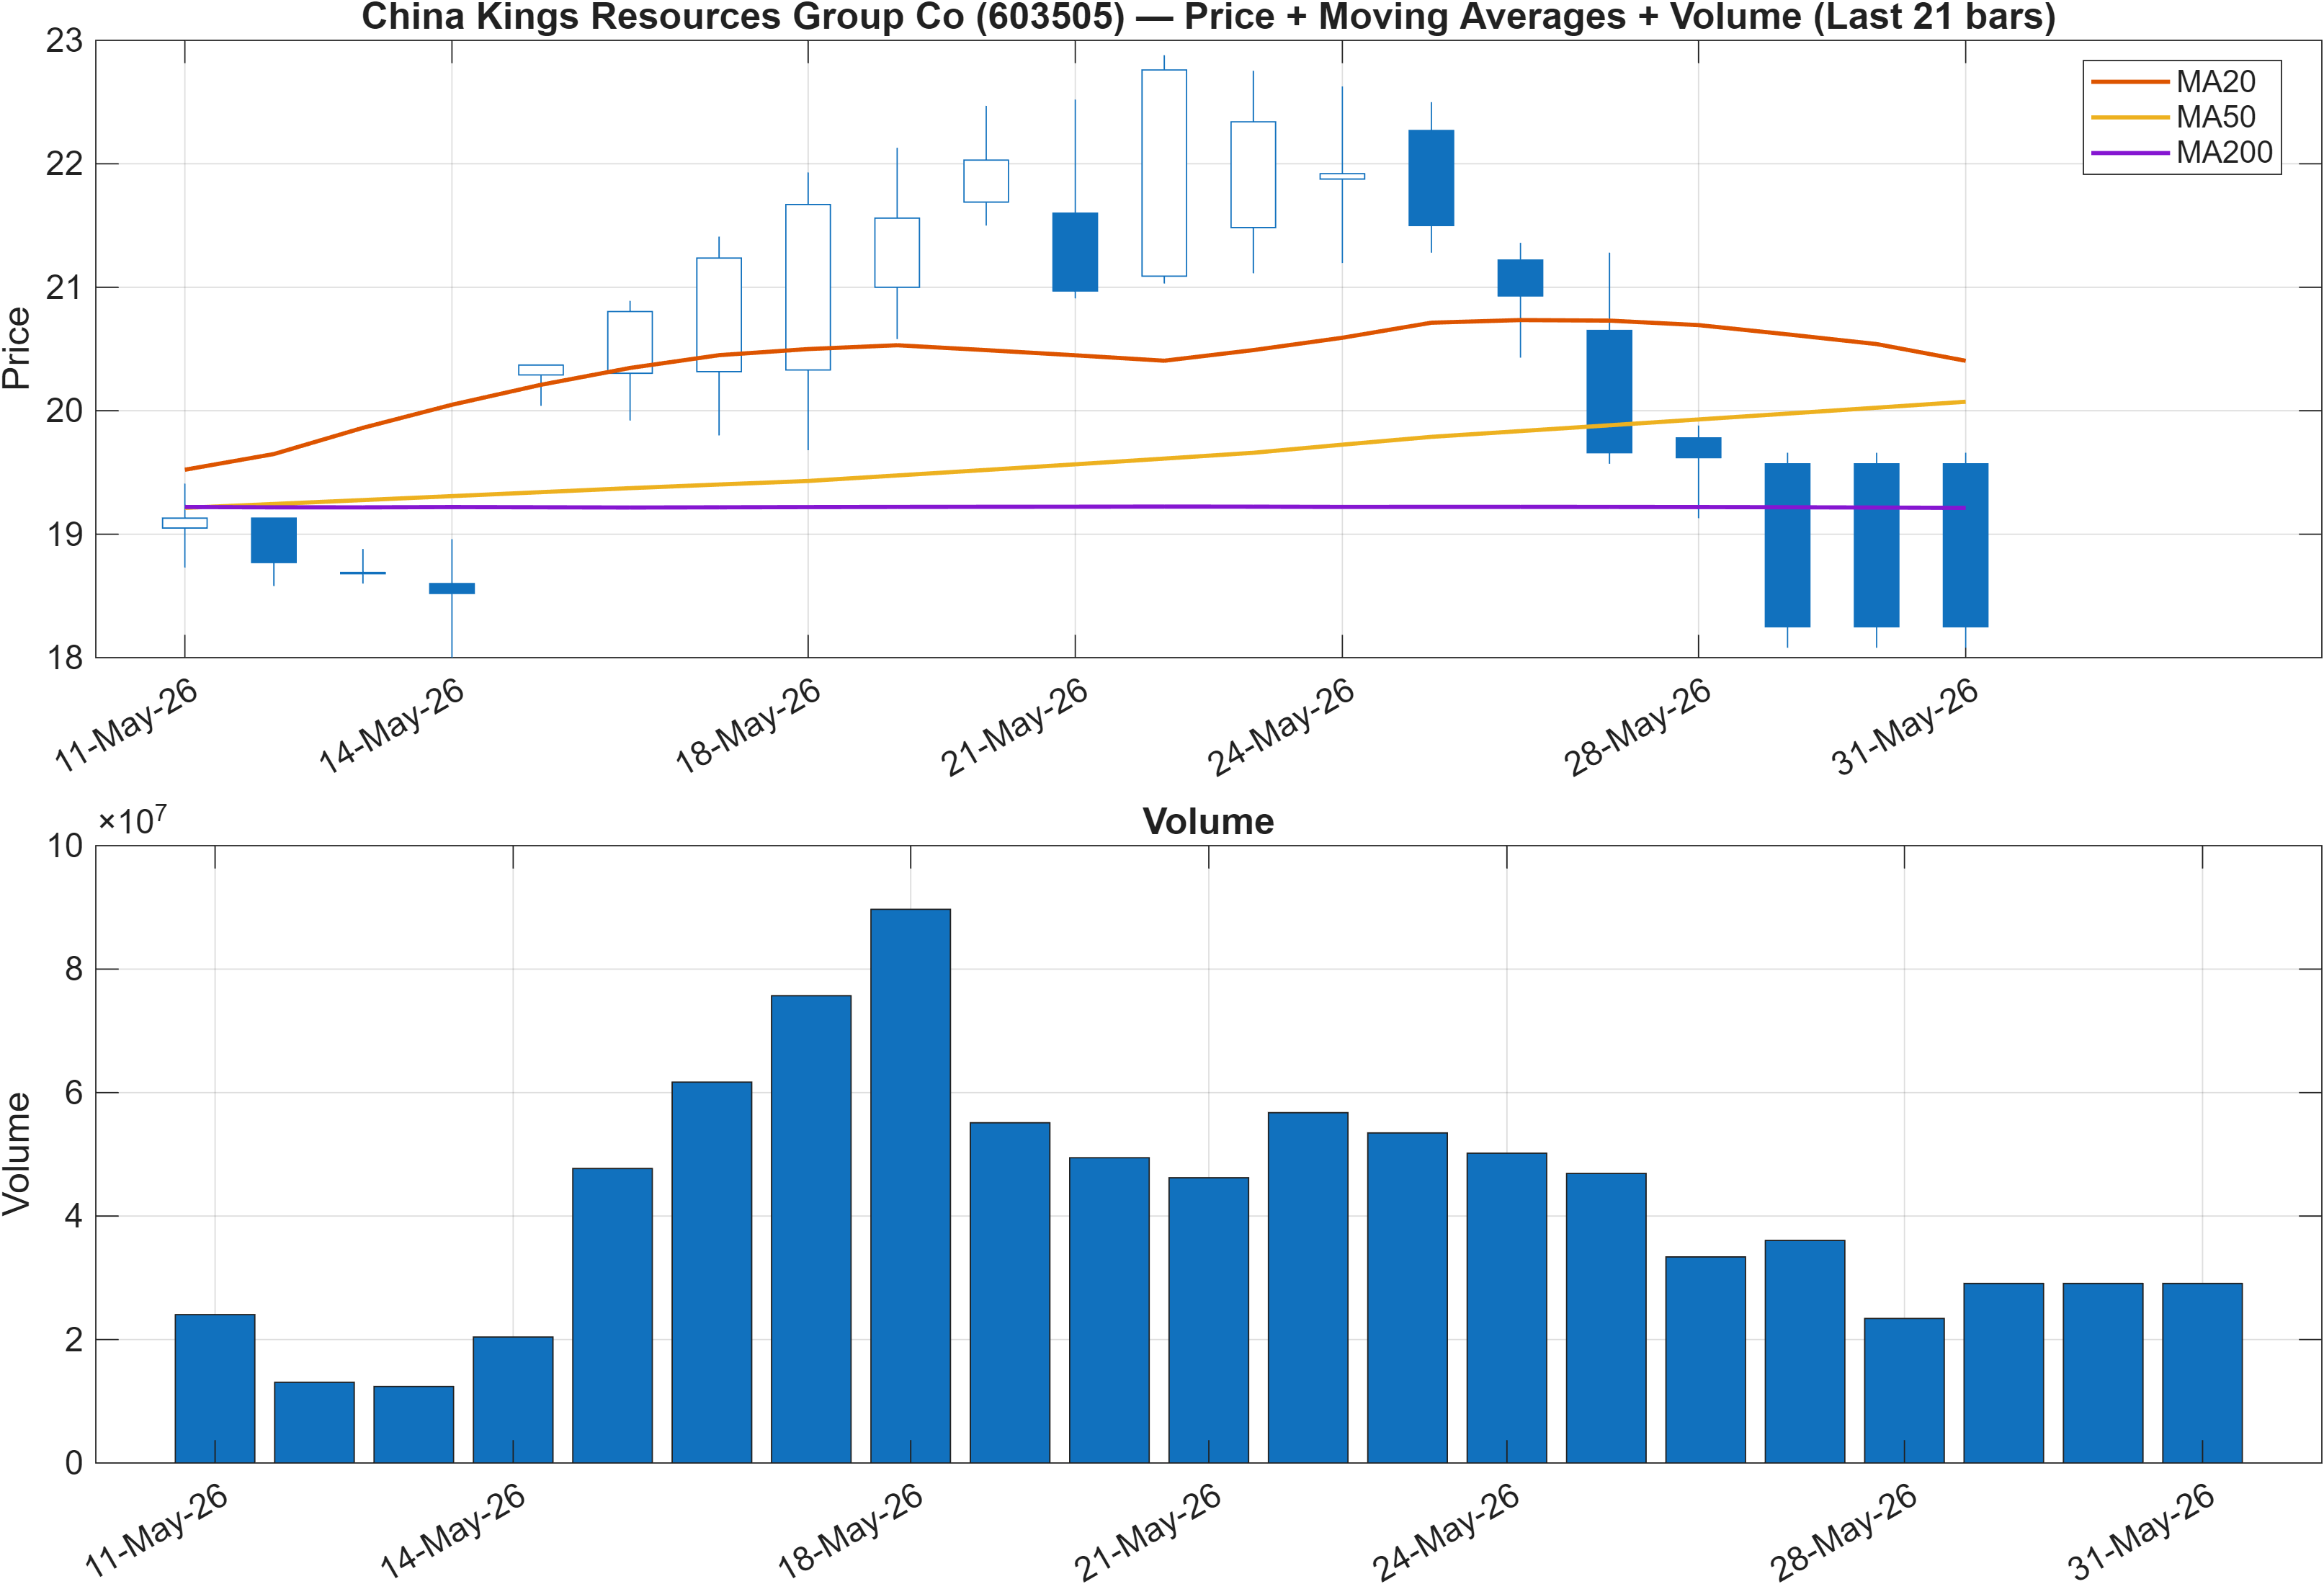
Moving-average structure: trend continuity with near-term friction
The provided interpretation signals a mixed moving-average regime: “Close vs MA50 = Bearish” while “MA50 vs MA200 = Bullish.” This combination is often consistent with a broader uptrend that is experiencing a nearer-term retracement or consolidation phase. In that setting, the market’s question is less about whether a long trend existed, and more about whether the current drawdown stays contained within a constructive structure.
The rank profile supports this reading: the long-horizon ranks (yearly #17, 3-month #22) remain strong, suggesting the longer-term behavior has been comparatively favorable versus the universe. However, the daily #602 and weekly #900 neutrality is consistent with prices spending time below a key intermediate average and testing participation.
From a market-structure standpoint, trend stability depends on how price behaves as it approaches the defined support area at 17.3425. A stable uptrend commonly sees pullbacks hold above support and then rebuild relative strength; failure to do so tends to shift the profile toward a deeper mean-reversion cycle. Conversely, reclaiming the area that resolves the “close vs MA50 bearish” condition—followed by progress toward 22.3000—would align the shorter-horizon read with the longer-horizon ranks.
Interpretation: Close vs MA50 = Bearish, MA50 vs MA200 = Bullish.
3) Momentum & volatility dashboard
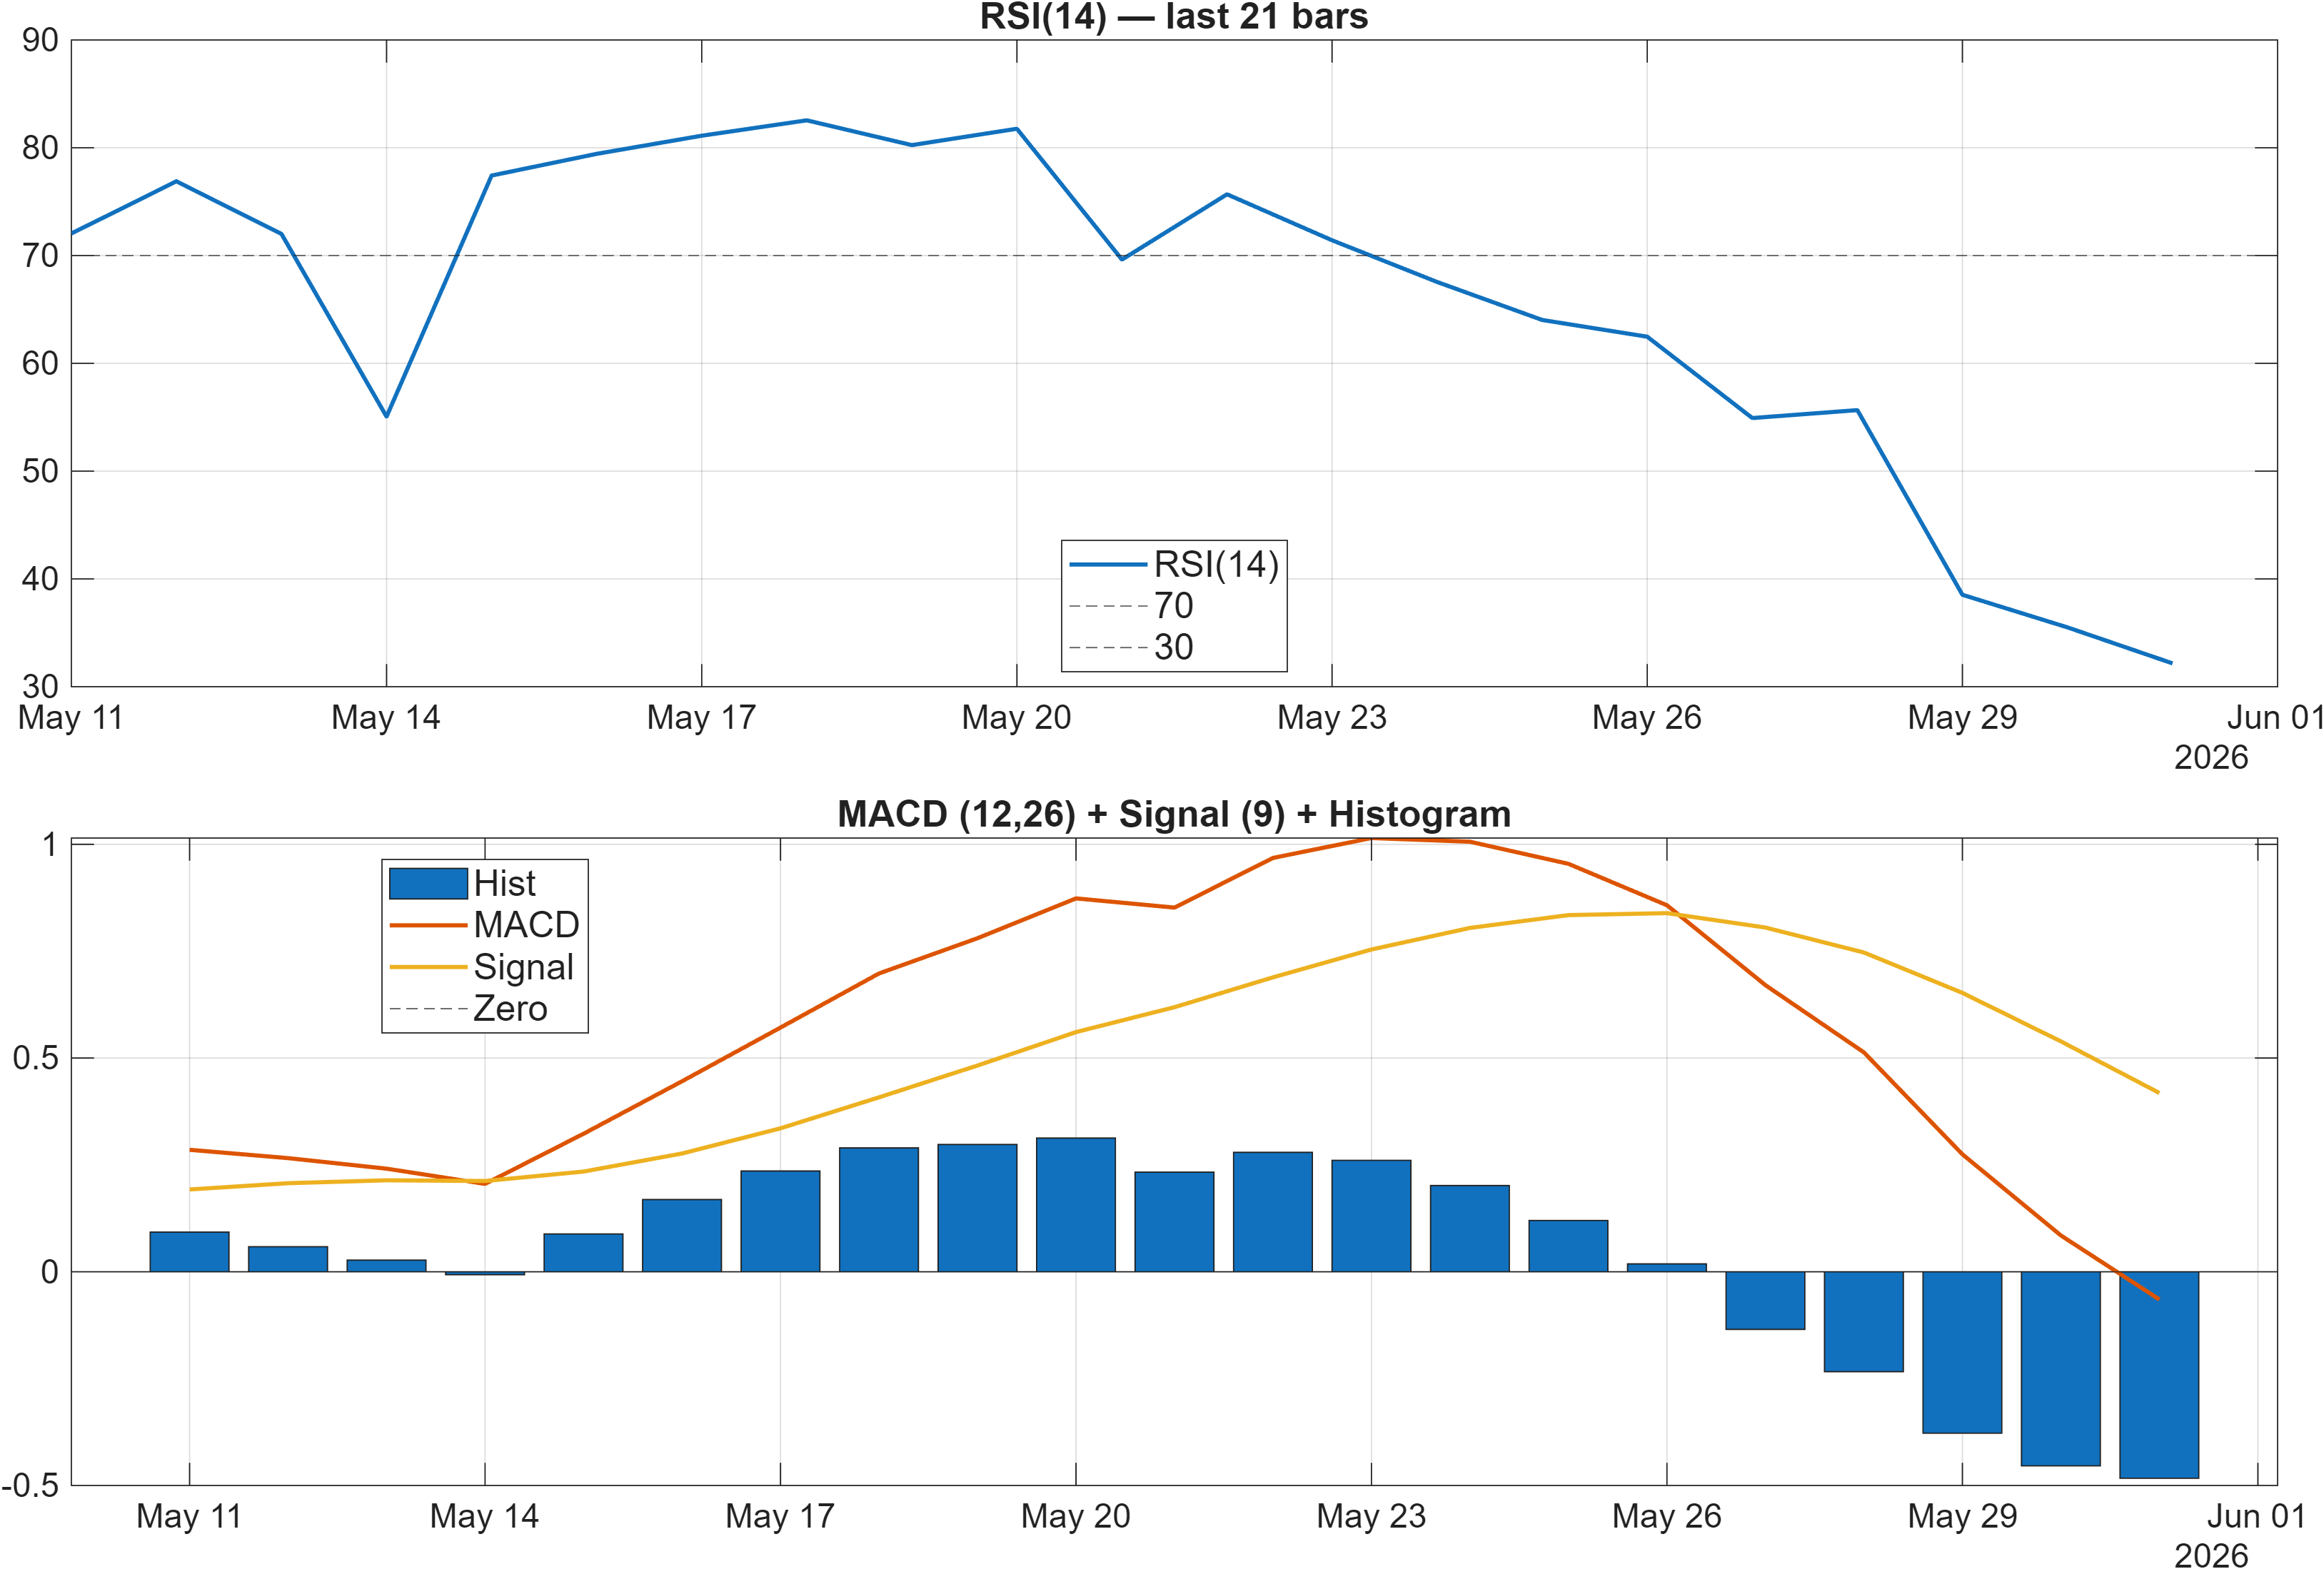
Momentum: oversold-leaning RSI with negative MACD impulse
Momentum indicators are skewed bearish in the snapshot. RSI(14) at 32.17 sits near oversold territory, which can arise in two very different contexts: (1) late-stage weakness that precedes further downside, or (2) a washout phase within a broader uptrend that later stabilizes. The MACD histogram at -0.4831 adds evidence that downside impulse is still present rather than fully exhausted.
The presence of both a low RSI and a negative MACD histogram often indicates that any rebound attempt may initially be fragile until the histogram improves and RSI recovers away from the low 30s. This also helps reconcile why longer-horizon ranks can remain bullish while short-horizon ranks fade: the longer-horizon features may still score well, but recent momentum is not providing confirmation.
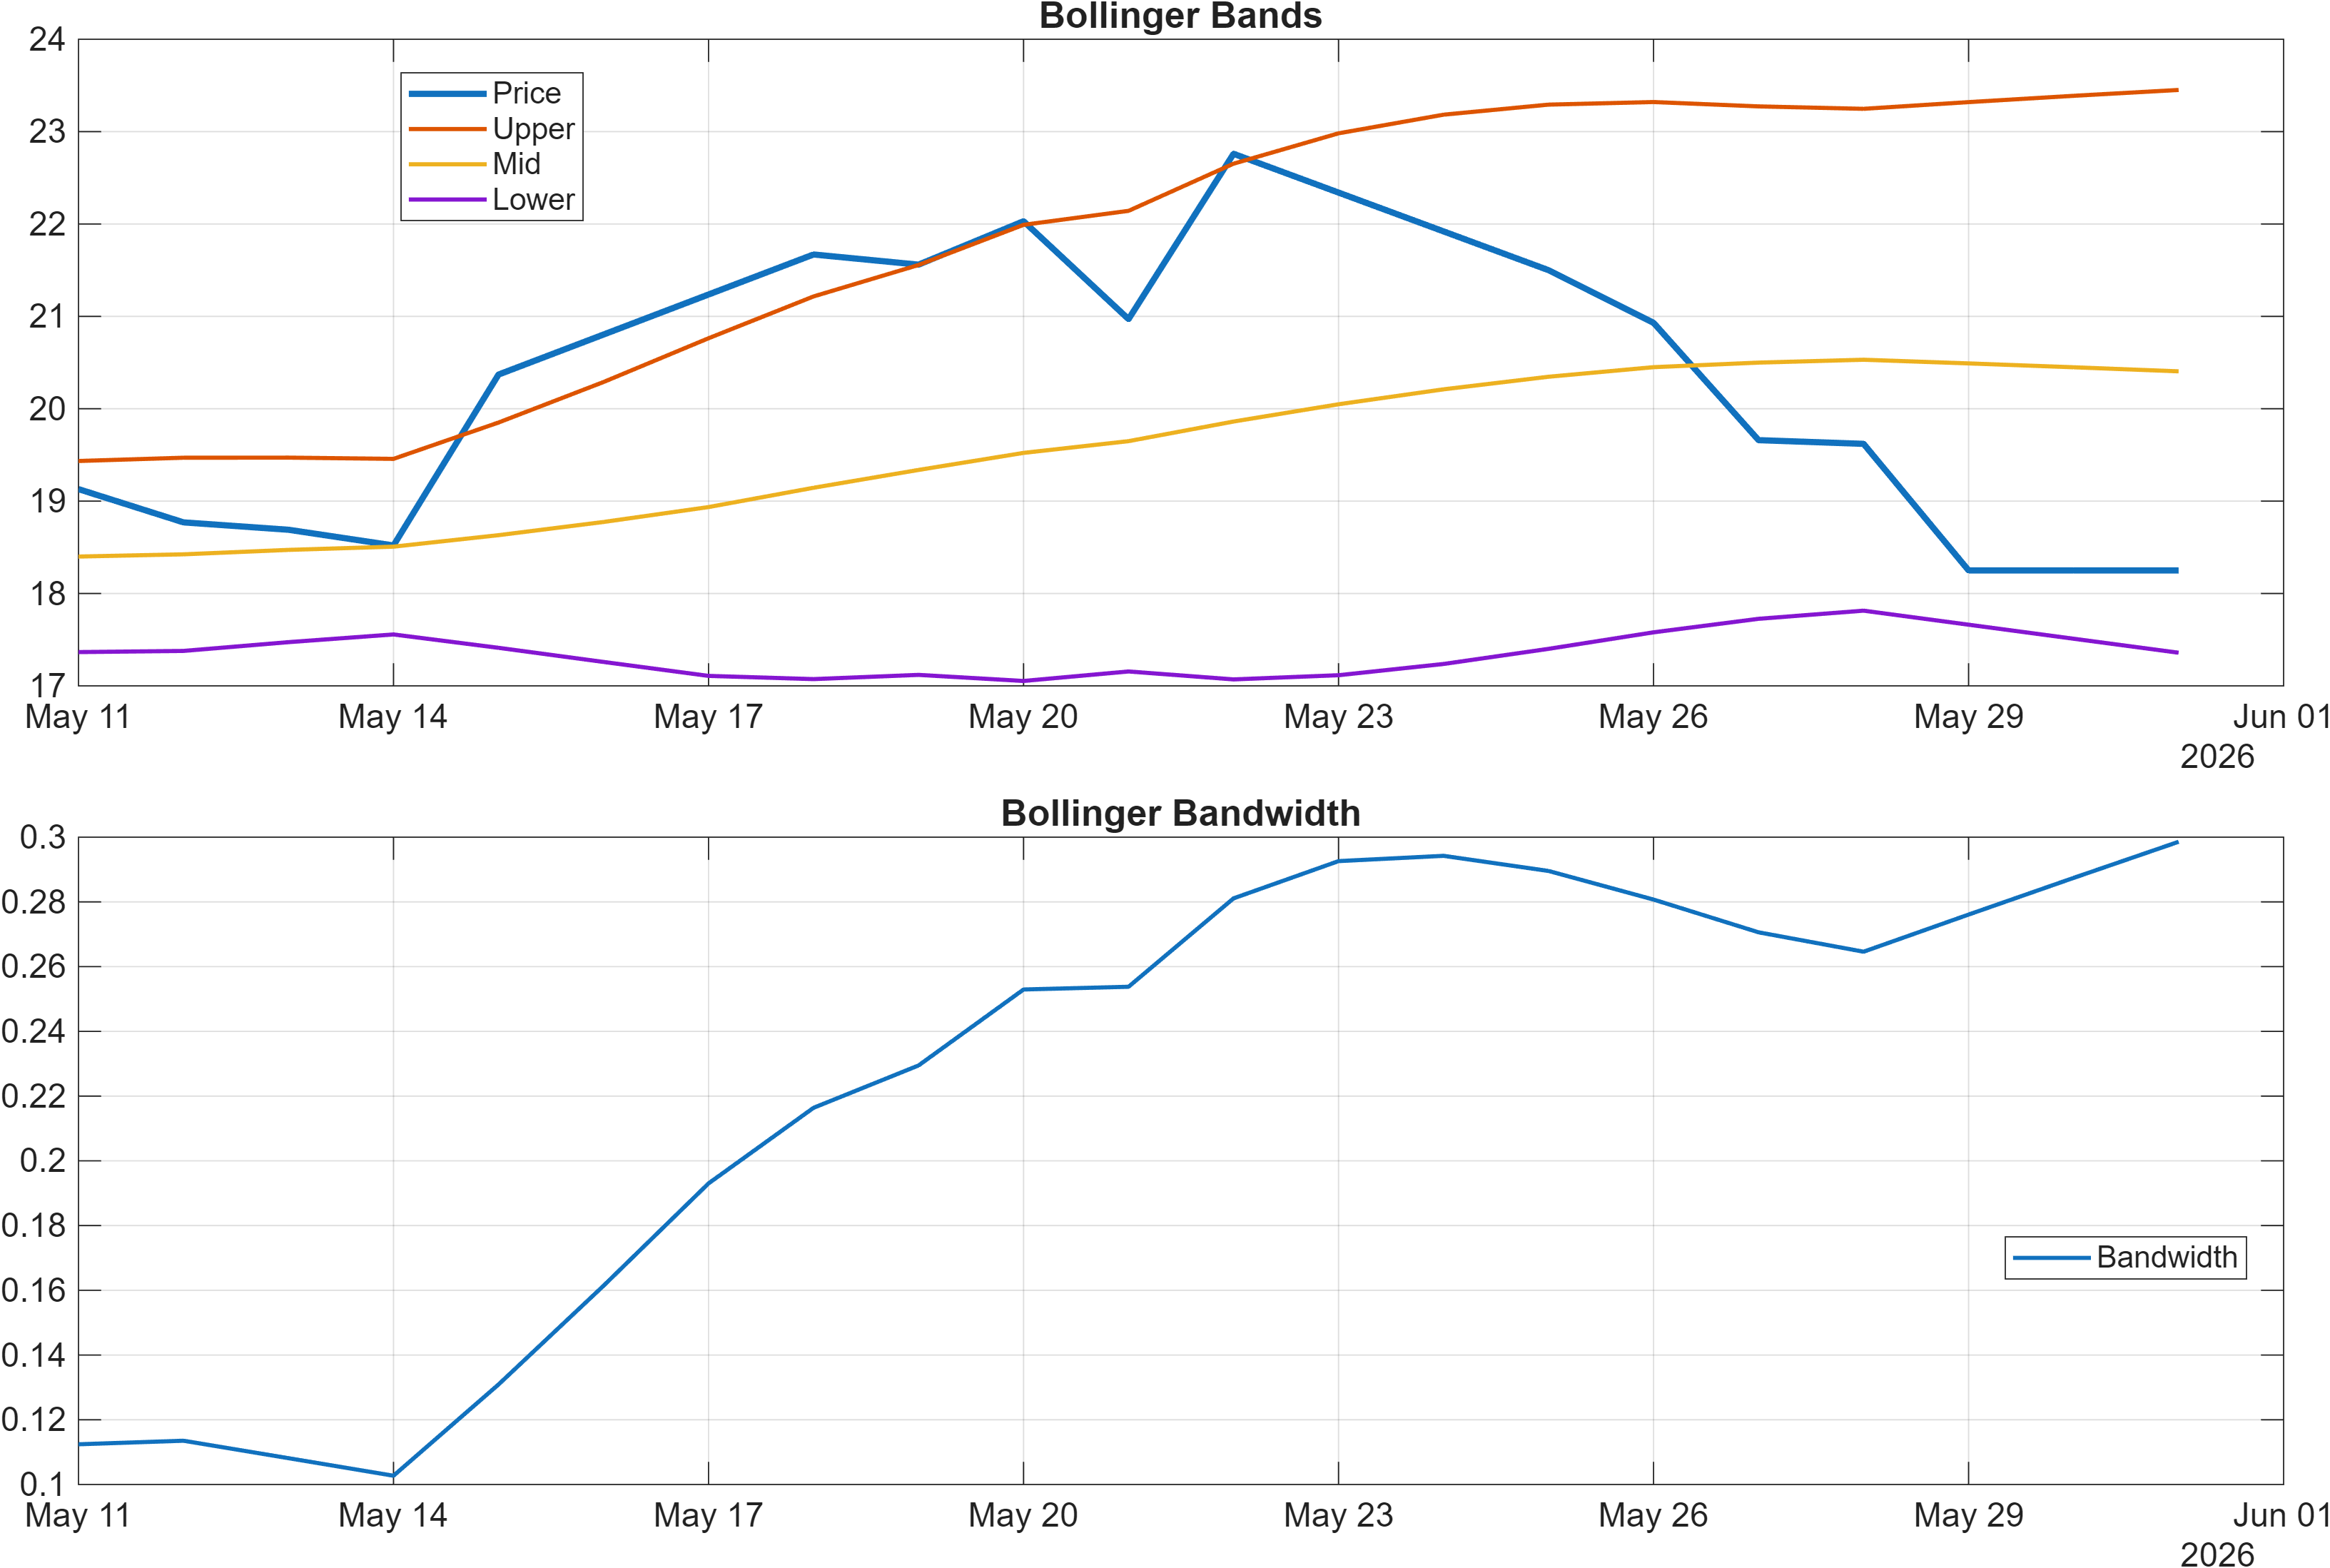
Volatility regime: neither tight compression nor disorderly expansion
Bollinger Bandwidth at 0.2986 frames the volatility backdrop as moderate in the provided data. That matters because momentum drawdowns paired with extreme volatility expansion can indicate capitulation risk, while tight compression can precede sharp breakouts. Here, the bandwidth reading suggests a more typical environment where level-based trading (support/resistance) can be more informative than anticipating a volatility shock.
Interpretation: RSI bias = Bearish, MACD hist = -0.4831.
Interpretation: Bandwidth (volatility regime) latest = 0.2986.
4) Support / Resistance zones
Support ~ 17.3425 | Resistance ~ 22.3000
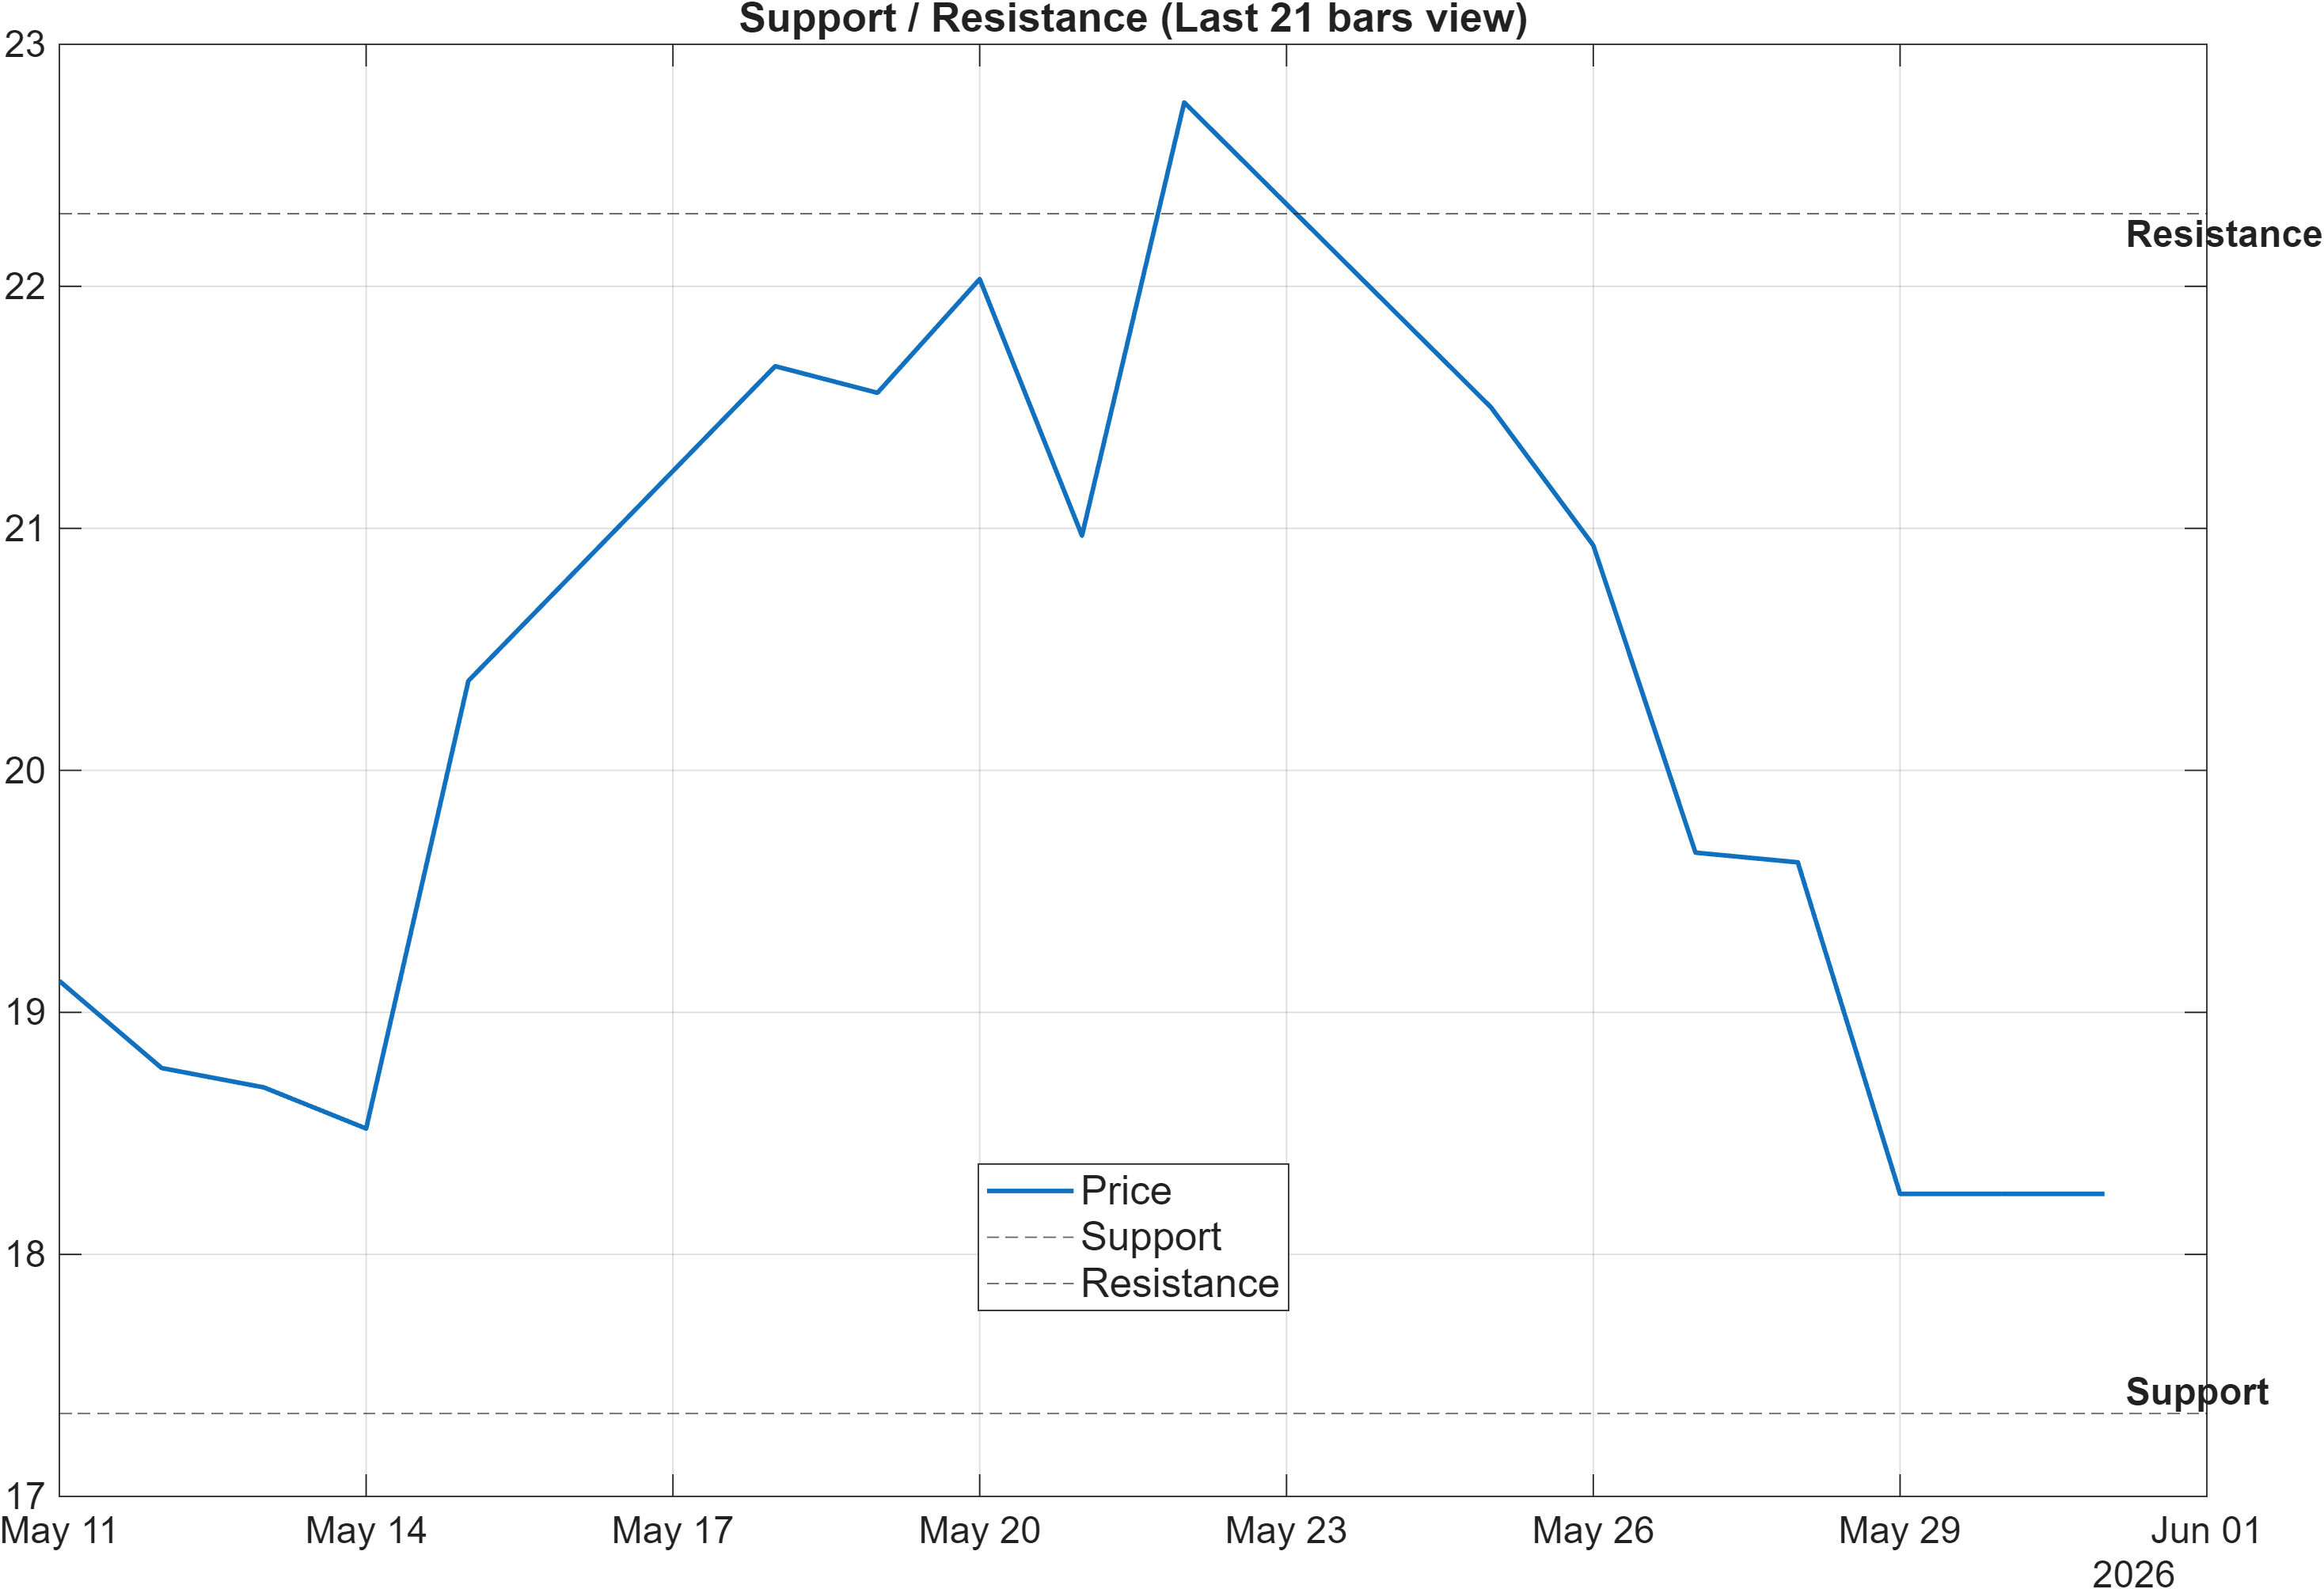
Probabilistic decision zones: where divergence resolves
With the broader rank stack bullish over multi-month horizons but technical confluence bearish, the 17.3425–22.3000 range becomes the practical arena where the market can resolve the disagreement. In many regime-transition setups, the initial test is whether support holds during bearish momentum conditions (RSI(14) 32.17, MACD histogram -0.4831). A stable response near support can allow momentum to mean-revert without structurally breaking the longer-horizon thesis implied by the top-decile ranks.
Resistance at 22.3000 represents the zone where buyers must demonstrate follow-through. Since the trend read already notes “Close vs MA50 = Bearish,” any advance that approaches resistance while momentum remains negative can encounter supply. For continuation conditions, the provided scenario guidance is explicit: a break above resistance with volume supports continuation. That would also tend to improve the short-term rank posture, which is currently neutral.
On the downside, a close below 17.3425 is the clean invalidation line provided in the dataset. Given the current bearish confluence and negative impulse signals, that level functions as the main boundary between a controlled pullback and a deeper deterioration phase.
Scenario view: Break above resistance with volume → continuation. Close below support → signal deterioration risk.
5) Quant Technical Dashboard (18 Signals)
KGNAI AI Technical Analysis Score (Deep Reinforcement Learning): Rank #1059 out of 1292 (Rank 1 represents the strongest technical positioning and a higher probability of favorable price behavior. As ranks increase toward the maximum, the probability of favorable outcomes weakens and bearish positioning becomes more dominant.) | Label: Bearish | Score: -0.639
18-Signal Technical Confluence Score: -0.389 (Bearish)
Overall Technical Score (18-signal confluence + DRL rank blend): -0.464 (Bearish)
Note: The blended score reflects signal strength weighted against broader AI technical ranking, which may temporarily diverge.
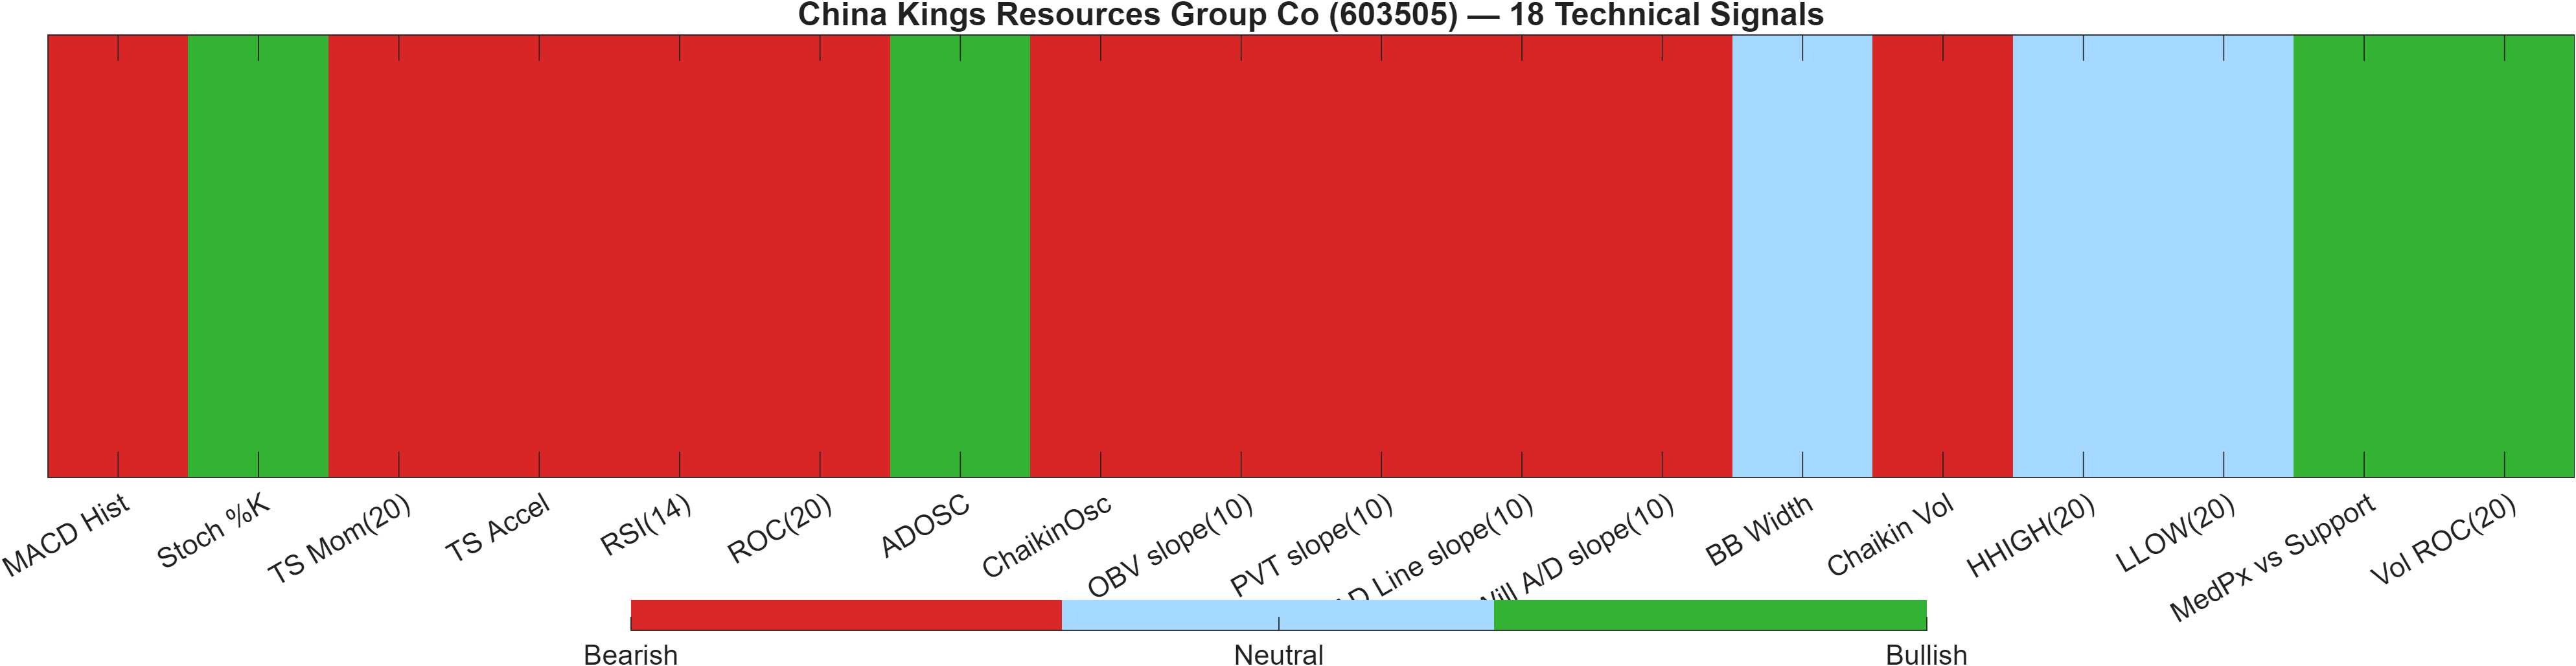
Blended technical score breakdown: -0.464 (Bearish | Bull 4 / Bear 11 / Neutral 3)
Signal compression: bearish breadth outweighs selective bullish pockets
The technical layer is notably defensive. The deep reinforcement learning technical rank sits at #1059 out of 1292 with a score of -0.639, and the blended overall technical score is -0.464 (Bearish). Breadth reinforces that message: 11 bearish signals versus 4 bullish and 3 neutral, which indicates that weakness is not concentrated in a single indicator family.
Momentum vs. participation: mixed internal confirmation
Within the 18-signal set, several momentum readings are aligned bearish (RSI(14) 32.17, ROC(20) -2.77, TS Mom(20) -0.52), consistent with a declining short-horizon profile. At the same time, there are select bullish offsets that can matter tactically—Stoch %K at 3.542 (Bullish) can occur near local lows, and ADOSC at 8.228 (Bullish) suggests some accumulation pressure in the dataset even while other volume-derived slopes (e.g., OBV slope(10) -2.157e+08) remain bearish.
Volatility is not driving the signal set: BB Width is 0.2986 and marked Neutral. That points back to directional impulse and breadth as the main constraint on bullish follow-through right now. For the technical state to improve, it typically requires bearish breadth to narrow (fewer than 11 bearish signals) and for negative impulse measures—especially MACD histogram -0.4831—to move toward stabilization.
Signal table (Bull/Bear/Neutral)
| Indicator | Value | Signal |
|---|---|---|
| MACD Hist | -0.4831 | Bearish |
| Stoch %K | 3.542 | Bullish |
| TS Mom(20) | -0.52 | Bearish |
| TS Accel | -1.56 | Bearish |
| RSI(14) | 32.17 | Bearish |
| ROC(20) | -2.77 | Bearish |
| ADOSC | 8.228 | Bullish |
| ChaikinOsc | -2.232e+07 | Bearish |
| OBV slope(10) | -2.157e+08 | Bearish |
| PVT slope(10) | -3.135e+06 | Bearish |
| AD Line slope(10) | -4.453e+07 | Bearish |
| Will A/D slope(10) | -4.197 | Bearish |
| BB Width | 0.2986 | Neutral |
| Chaikin Vol | 4.5 | Bearish |
| HHIGH(20) | 22.88 | Neutral |
| LLOW(20) | 18 | Neutral |
| MedPx vs Support | 1.527 | Bullish |
| Vol ROC(20) | 122.5 | Bullish |
Interpretation: Indicator-level signals form the base confluence, which is then adjusted using a separate AI-driven technical ranking model. The final technical score summarizes this combined view.
6) News sentiment + extractive gist
Note: Instrument-specific news matches were not found, so the digest includes broader market/sector headlines. Links are provided for verification.
Sentiment score (avg): 0.000 | Positive: 12% | Neutral: 75% | Negative: 12%
KGNAI AI News Sentiment Score (normalized -1 to +1): Not available (as of —) | Label: Not available | Overall news score: 0.00
Positive Developments
Recent coverage across major financial outlets reflects a broadly calm tone with occasional constructive themes, but without instrument-specific catalysts in the provided data. The positive skew is limited (12%), yet it indicates the market backdrop is not dominated by uniformly adverse narratives. In contexts like this, price tends to respond more to technical positioning than to headline-driven repricing, especially when sentiment is near 0.000 and the neutral share is high. For 603505, that can be relevant because the technical layer is currently bearish (overall -0.464), meaning a modestly constructive backdrop may help stabilize volatility rather than drive immediate trend expansion. A supportive environment can also allow oversold-leaning indicators such as RSI(14) 32.17 to mean-revert without requiring a strong news impulse—provided key levels hold.
Neutral / Mixed Developments
Neutral coverage dominates at 75%, consistent with a market that is processing cross-currents rather than repricing around a single dominant theme. For analysis, this reduces the usefulness of sentiment as a timing tool and increases the importance of level-based confirmation—particularly the 17.3425 support and 22.3000 resistance bands. With KGNAI’s instrument-level news matches not found, the practical implication is that the near-term path is more likely to be shaped by endogenous signals (momentum, trend structure, volume participation) than exogenous narrative shifts. That framework aligns with the current divergence: longer-horizon ranks remain bullish while the short-horizon impulse remains weak.
Negative / Risk Signals
Negative items are present but not dominant (12%), suggesting risk signals exist in the broader environment without overwhelming the information set. In markets where technical confluence is already bearish—18-signal score -0.389 and DRL technical rank #1059—even moderate risk tone can limit buyers’ willingness to chase rebounds, especially if MACD histogram remains at -0.4831. The key is whether risk perception coincides with a loss of structural support. If price behavior weakens enough to register a close below 17.3425, the combination of bearish breadth (11 bear signals) and a non-supportive impulse backdrop can reinforce a deterioration phase even in the absence of strongly negative sentiment.
- Whether RSI(14) (32.17) recovers while MACD histogram (-0.4831) improves, indicating momentum stabilization.
- Reaction quality near 17.3425 (support): hold vs. close below.
- Any volume-backed push through 22.3000 (resistance), aligning trend and confluence.
Sources referenced: Reuters, Bloomberg, Yahoo Finance, MarketWatch, Investing.com
Snapshot: AI Rank (Short–Mid–Long): Mixed (Bullish tilt) (Neutral–Bullish–Bullish) · Technical Confluence: Bearish · Key Levels: Support ~17.34 | Resistance ~22.30 · News Sentiment: Neutral
7) Sources
Not available in the provided data.
You may also like: How KGNAI AI ranks instruments across global markets
Disclaimer: KGNAI provides AI-generated analytics and educational market commentary only. This is not financial advice. Markets involve risk. Always do your own research.