601600 (Aluminum Corp of China Ltd) Technical & Rank Outlook — 05-Jun-2026 | Short-term bearish, broader structure neutral
Aluminum Corp of China Ltd (601600) enters 05-Jun-2026 with a short-term bearish rank profile alongside a neutral mid-to-longer horizon posture across KGNAI’s 1,292-instrument China universe. The daily rank sits near the bottom of the distribution, while weekly through yearly ranks remain in the neutral band—an internal split that often coincides with tactical pressure inside a broader range. Technically, trend filters flag close below the MA50 and MA50 below MA200 (bearish), but momentum is not decisively risk-off: RSI is neutral (RSI(14) 46.97) and MACD histogram is slightly positive (0.0020). Volatility conditions look contained with Bollinger Bandwidth at 0.1591, suggesting the market may be waiting for a directional catalyst. Key decision zones remain support ~10.8150 and resistance ~12.6933, which frame confirmation/invalidation for both trend continuation and deterioration scenarios.
Key Takeaways
- Rank stance: Short-term Bearish | Mid-term Neutral | Long-term Neutral
- Technical confluence label: 18-signal confluence 0.111 (Neutral) with blended overall technical score -0.220 (Neutral)
- Key levels: Support ~10.8150 | Resistance ~12.6933
- News sentiment bias: Price-context sentiment mix reads Neutral on distribution (avg -0.026) despite a normalized news score of 1.00 (Bullish label)
- Confirmation / invalidation: A break above 12.6933 with volume supports continuation; a close below 10.8150 increases deterioration risk
What KGNAI Measures
KGNAI evaluates assets using large cross-sectional datasets built from millions of structured data points. Inputs incorporate fundamental metrics, technical structures, and systematically processed news sentiment. Statistical models, machine learning, and AI frameworks are used to assess relative positioning, signal alignment, and probabilistic behavior across broad universes.
How to Read This Report
- Ranks are comparative across the tracked universe, not absolute price targets.
- Confluence reflects alignment among independent signal groups.
- Support/resistance levels are probabilistic decision zones, not guarantees.
- Sentiment provides contextual bias within the broader analytical framework.
1) KGNAI AI Analysis
Region: CHINA
Total universe size: 1292 ranked instruments
- Daily rank: #1228 out of 1292 — Bearish
- Weekly rank: #960 out of 1292 — Neutral
- Monthly rank: #818 out of 1292 — Neutral
- 3-Monthly rank: #708 out of 1292 — Neutral
- 6-Monthly rank: #808 out of 1292 — Neutral
- Yearly rank: #783 out of 1292 — Neutral
The rank curve shows a pronounced short-horizon drawdown in relative positioning: the daily rank at #1228/1292 places 601600 in the weakest tail of the tracked universe, consistent with near-term risk control behavior dominating flows. In contrast, weekly to yearly ranks (#960, #818, #708, #808, #783) cluster in a neutral band, implying the longer sampling windows have not confirmed a durable downtrend regime.
Alignment vs divergence across horizons
This is a classic timing divergence: the short-term model penalizes recent price/participation dynamics more heavily, while medium/long horizons still treat the instrument as range-bound relative to peers. Practically, that combination tends to produce asymmetric confirmation requirements: bullish improvement typically needs a visible break/hold above key resistance, while bearish follow-through can occur simply by failing to reclaim moving averages and losing support.
Probability framing (not a point forecast)
KGNAI’s framework is explicitly comparative: lower ranks indicate stronger probability of favorable performance behavior, higher ranks indicate weaker probability and more bearish positioning. With a daily rank deep in the lower tail but higher-timeframe ranks neutral, the current setup reads as tactically fragile but not conclusively transitioned into a persistent bearish state on longer windows. The stated term view reflects that split: Short-term Bearish, Mid-term Neutral, Long-term Neutral.
Want the full universe and complete rank tables? Unlock full access on KGNAI: https://www.kgnai.com/pricing
2) Price & trend overview
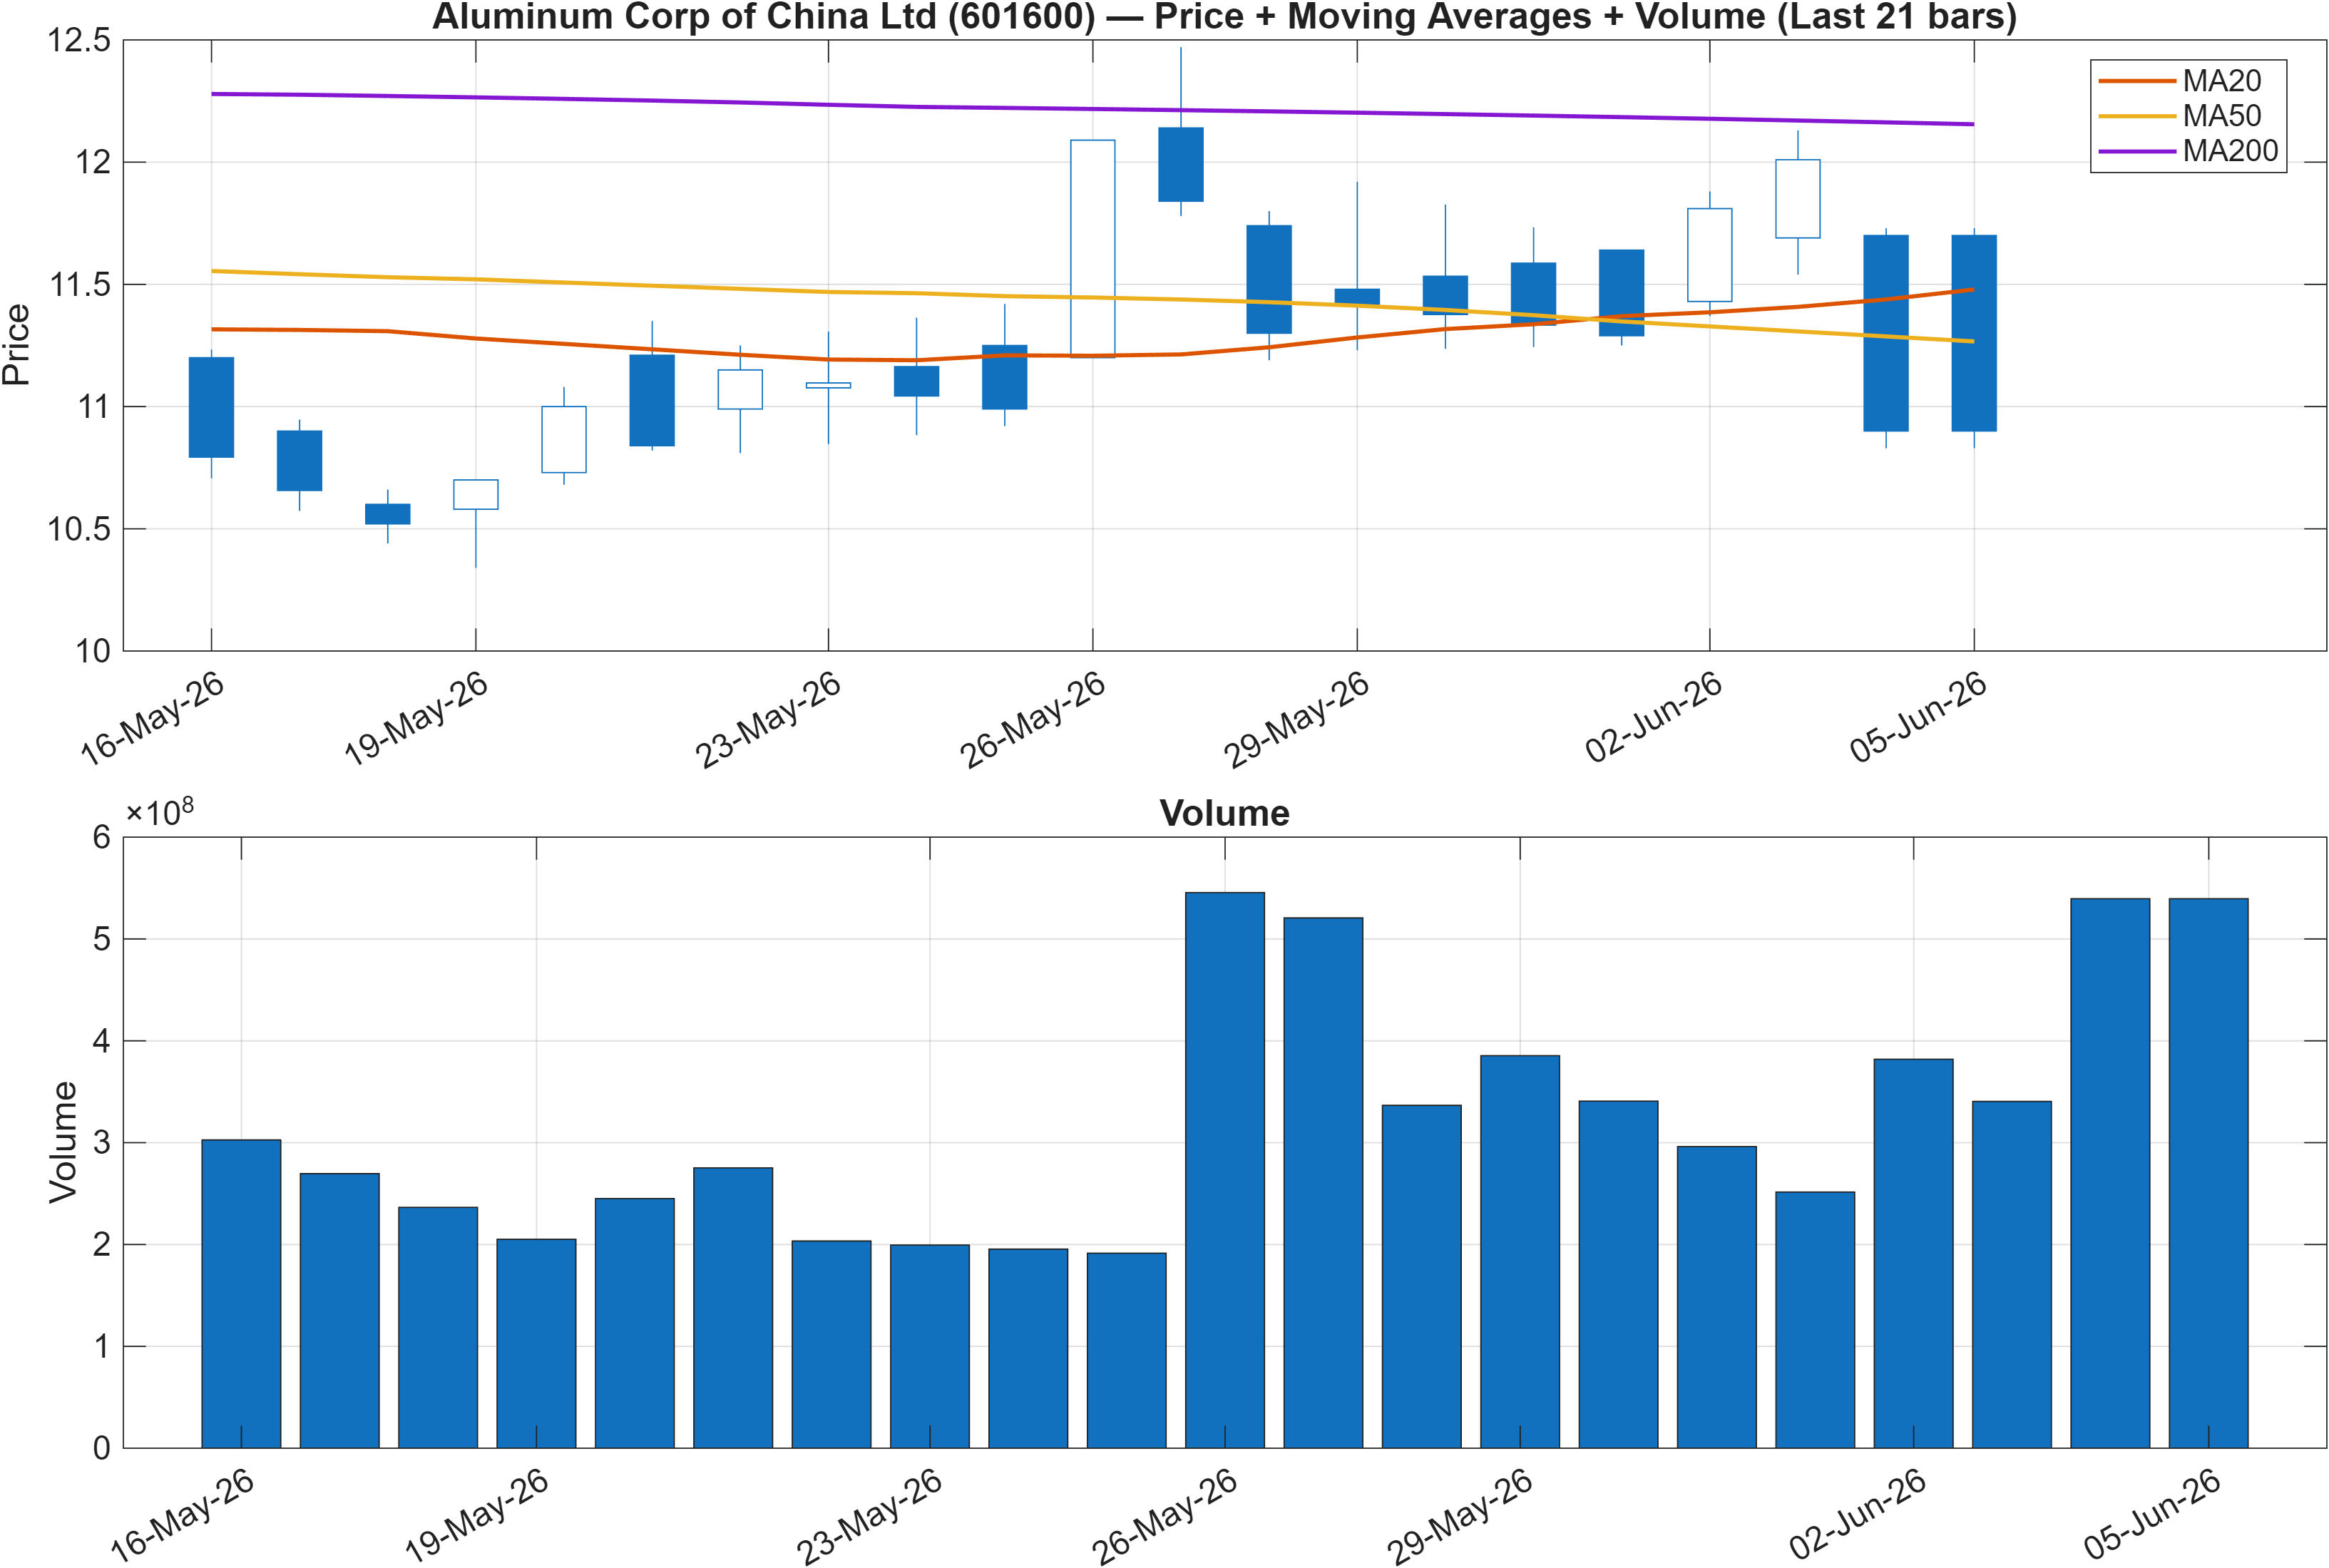
Trend filters are currently stacked to the downside: Close vs MA50 = Bearish and MA50 vs MA200 = Bearish. That configuration usually indicates the market is trading below intermediate trend control, while the longer moving average structure also fails to support a positive regime. In this context, rallies often face overhead supply until price can reclaim and hold above the MA50, and then stabilize the MA50 relative to the MA200.
Regime continuation vs transition
The key analytical question is whether the bearish moving-average stack is a continuation of a broader downshift or a late-phase lagging signal inside a range. The support/resistance framework helps differentiate those regimes: a market that repeatedly respects the lower boundary and fails to trend tends to keep ranks neutral over longer horizons, which is consistent with the weekly-to-yearly neutral readings (e.g., #708 on the 3-month window).
Participation sensitivity
The trend read should be interpreted alongside participation and volatility: later sections show mixed momentum (MACD histogram 0.0020) and contained volatility (bandwidth 0.1591). That combination can occur when price is below moving averages but selling pressure is not accelerating. For the trend view to materially improve, the market typically needs both price structure repair (reclaiming trend filters) and confirmation through the key upper level at 12.6933.
Interpretation: Close vs MA50 = Bearish, MA50 vs MA200 = Bearish.
3) Momentum & volatility dashboard
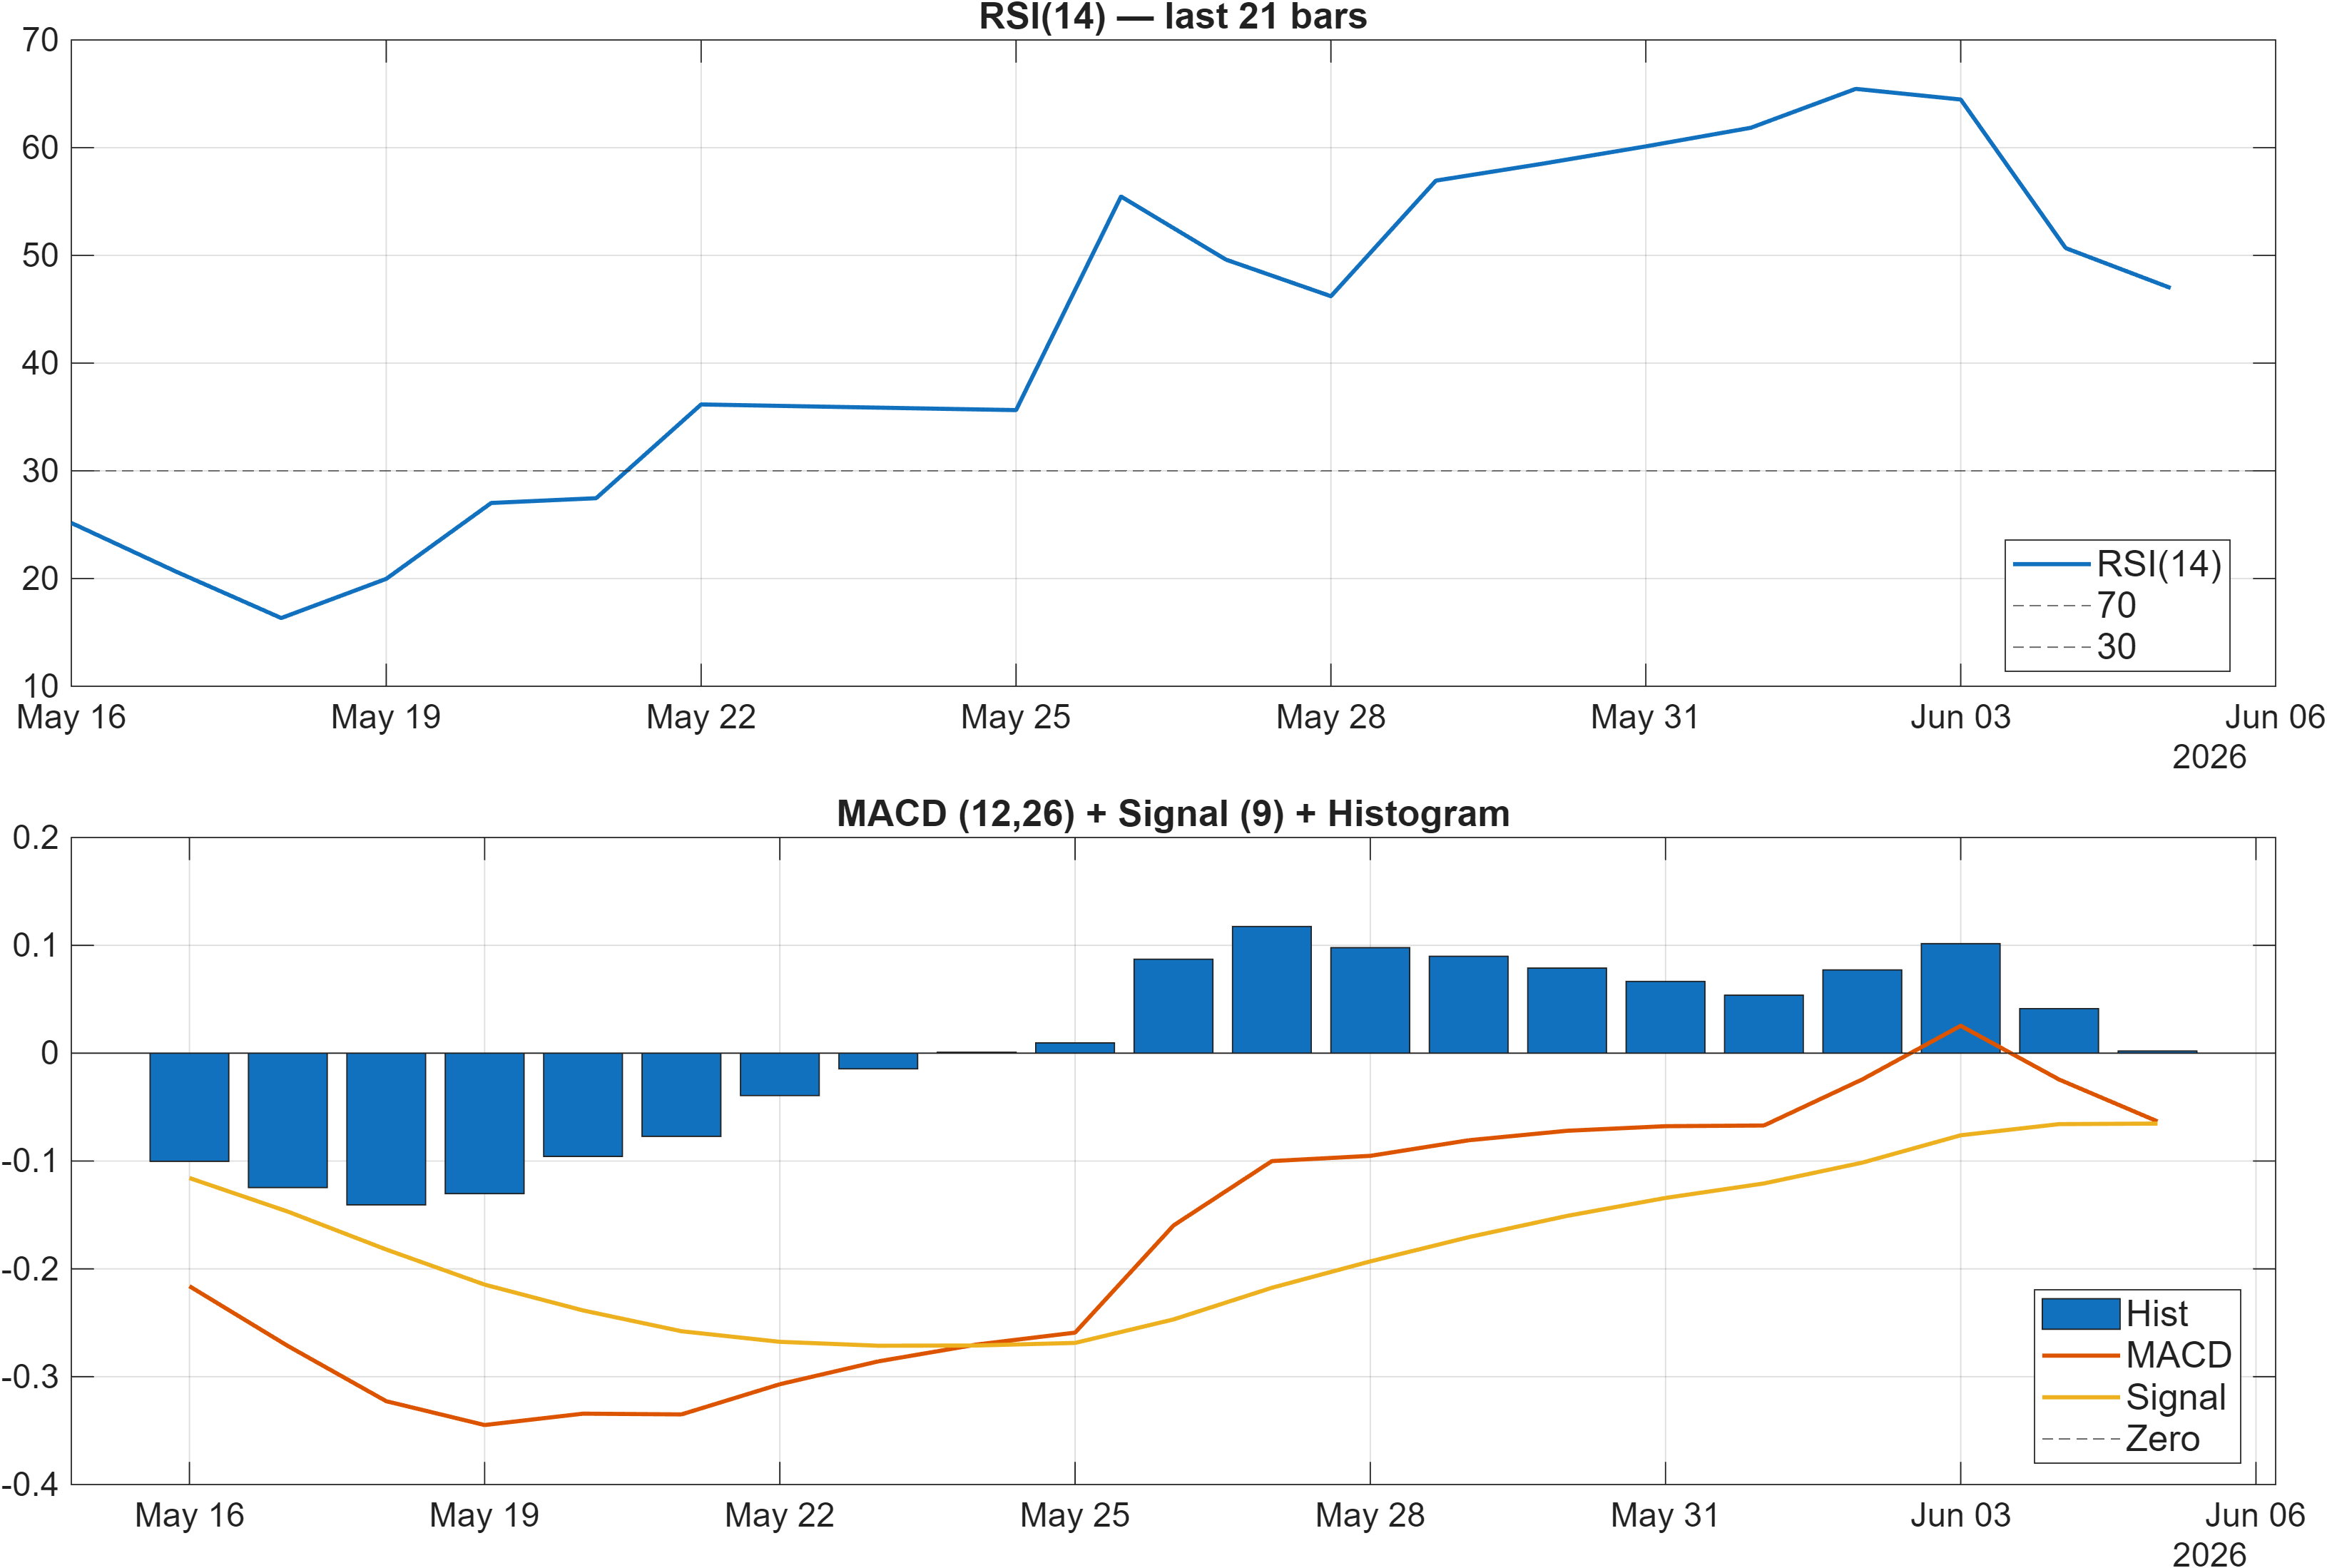
Momentum indicators do not fully corroborate the bearish trend stack. RSI bias is labeled Neutral, with RSI(14) at 46.97, which is consistent with a market that is neither extended nor clearly trending with strong downside momentum. Meanwhile, the MACD histogram is slightly positive at 0.0020 (0.002026 in the signal table), a small but notable contrast versus bearish moving-average positioning.
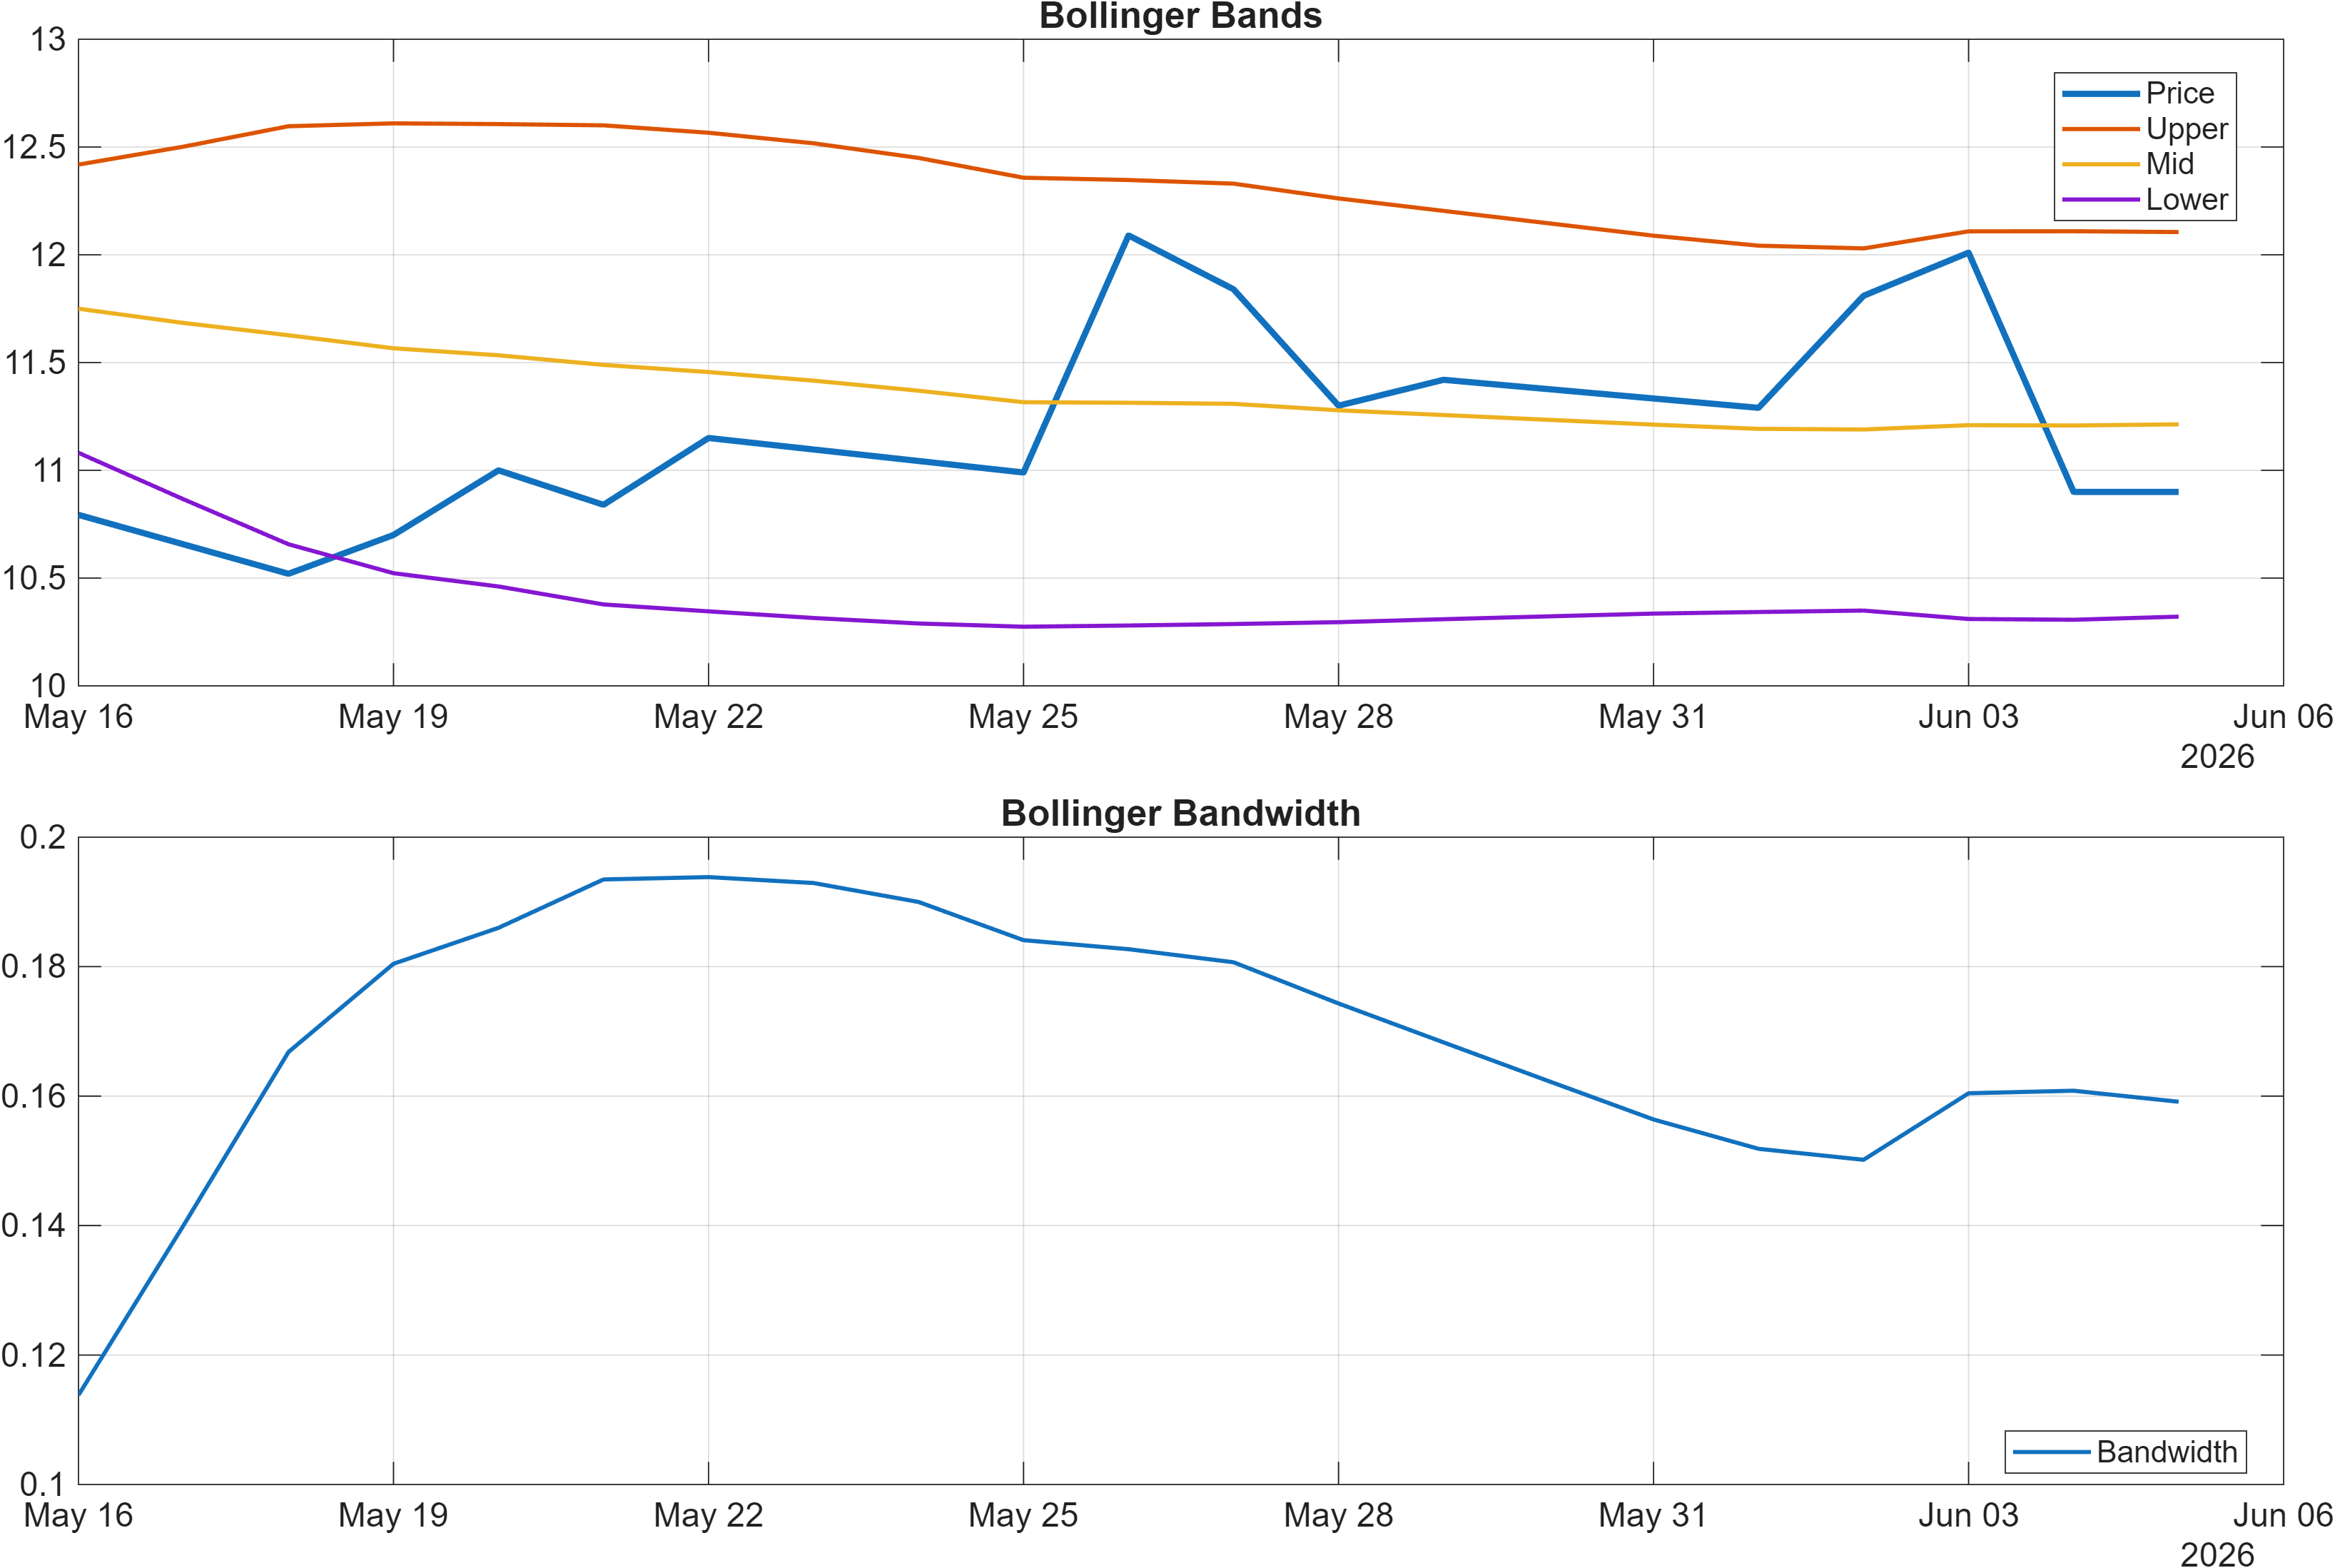
Signal compression vs expansion
Bollinger Bandwidth at 0.1591 indicates a relatively contained volatility regime. When volatility is compressed while trend filters remain bearish, price often oscillates in a tight distribution where breaks through decision levels become disproportionately informative. In other words, a move beyond established resistance/support can carry more signal weight than usual because it represents a shift away from compression.
Momentum cross-check
The broader momentum dashboard also includes very low Stoch %K (4.268, bullish-labeled) and positive ROC(20) (2.283, bullish-labeled), which can appear when the instrument is attempting to stabilize after weakness. However, without a confirmed price reclaim of trend filters, these are better treated as early stabilization signals rather than decisive trend reversal evidence.
Interpretation: RSI bias = Neutral, MACD hist = 0.0020.
Interpretation: Bandwidth (volatility regime) latest = 0.1591.
4) Support / Resistance zones
Support ~ 10.8150 | Resistance ~ 12.6933
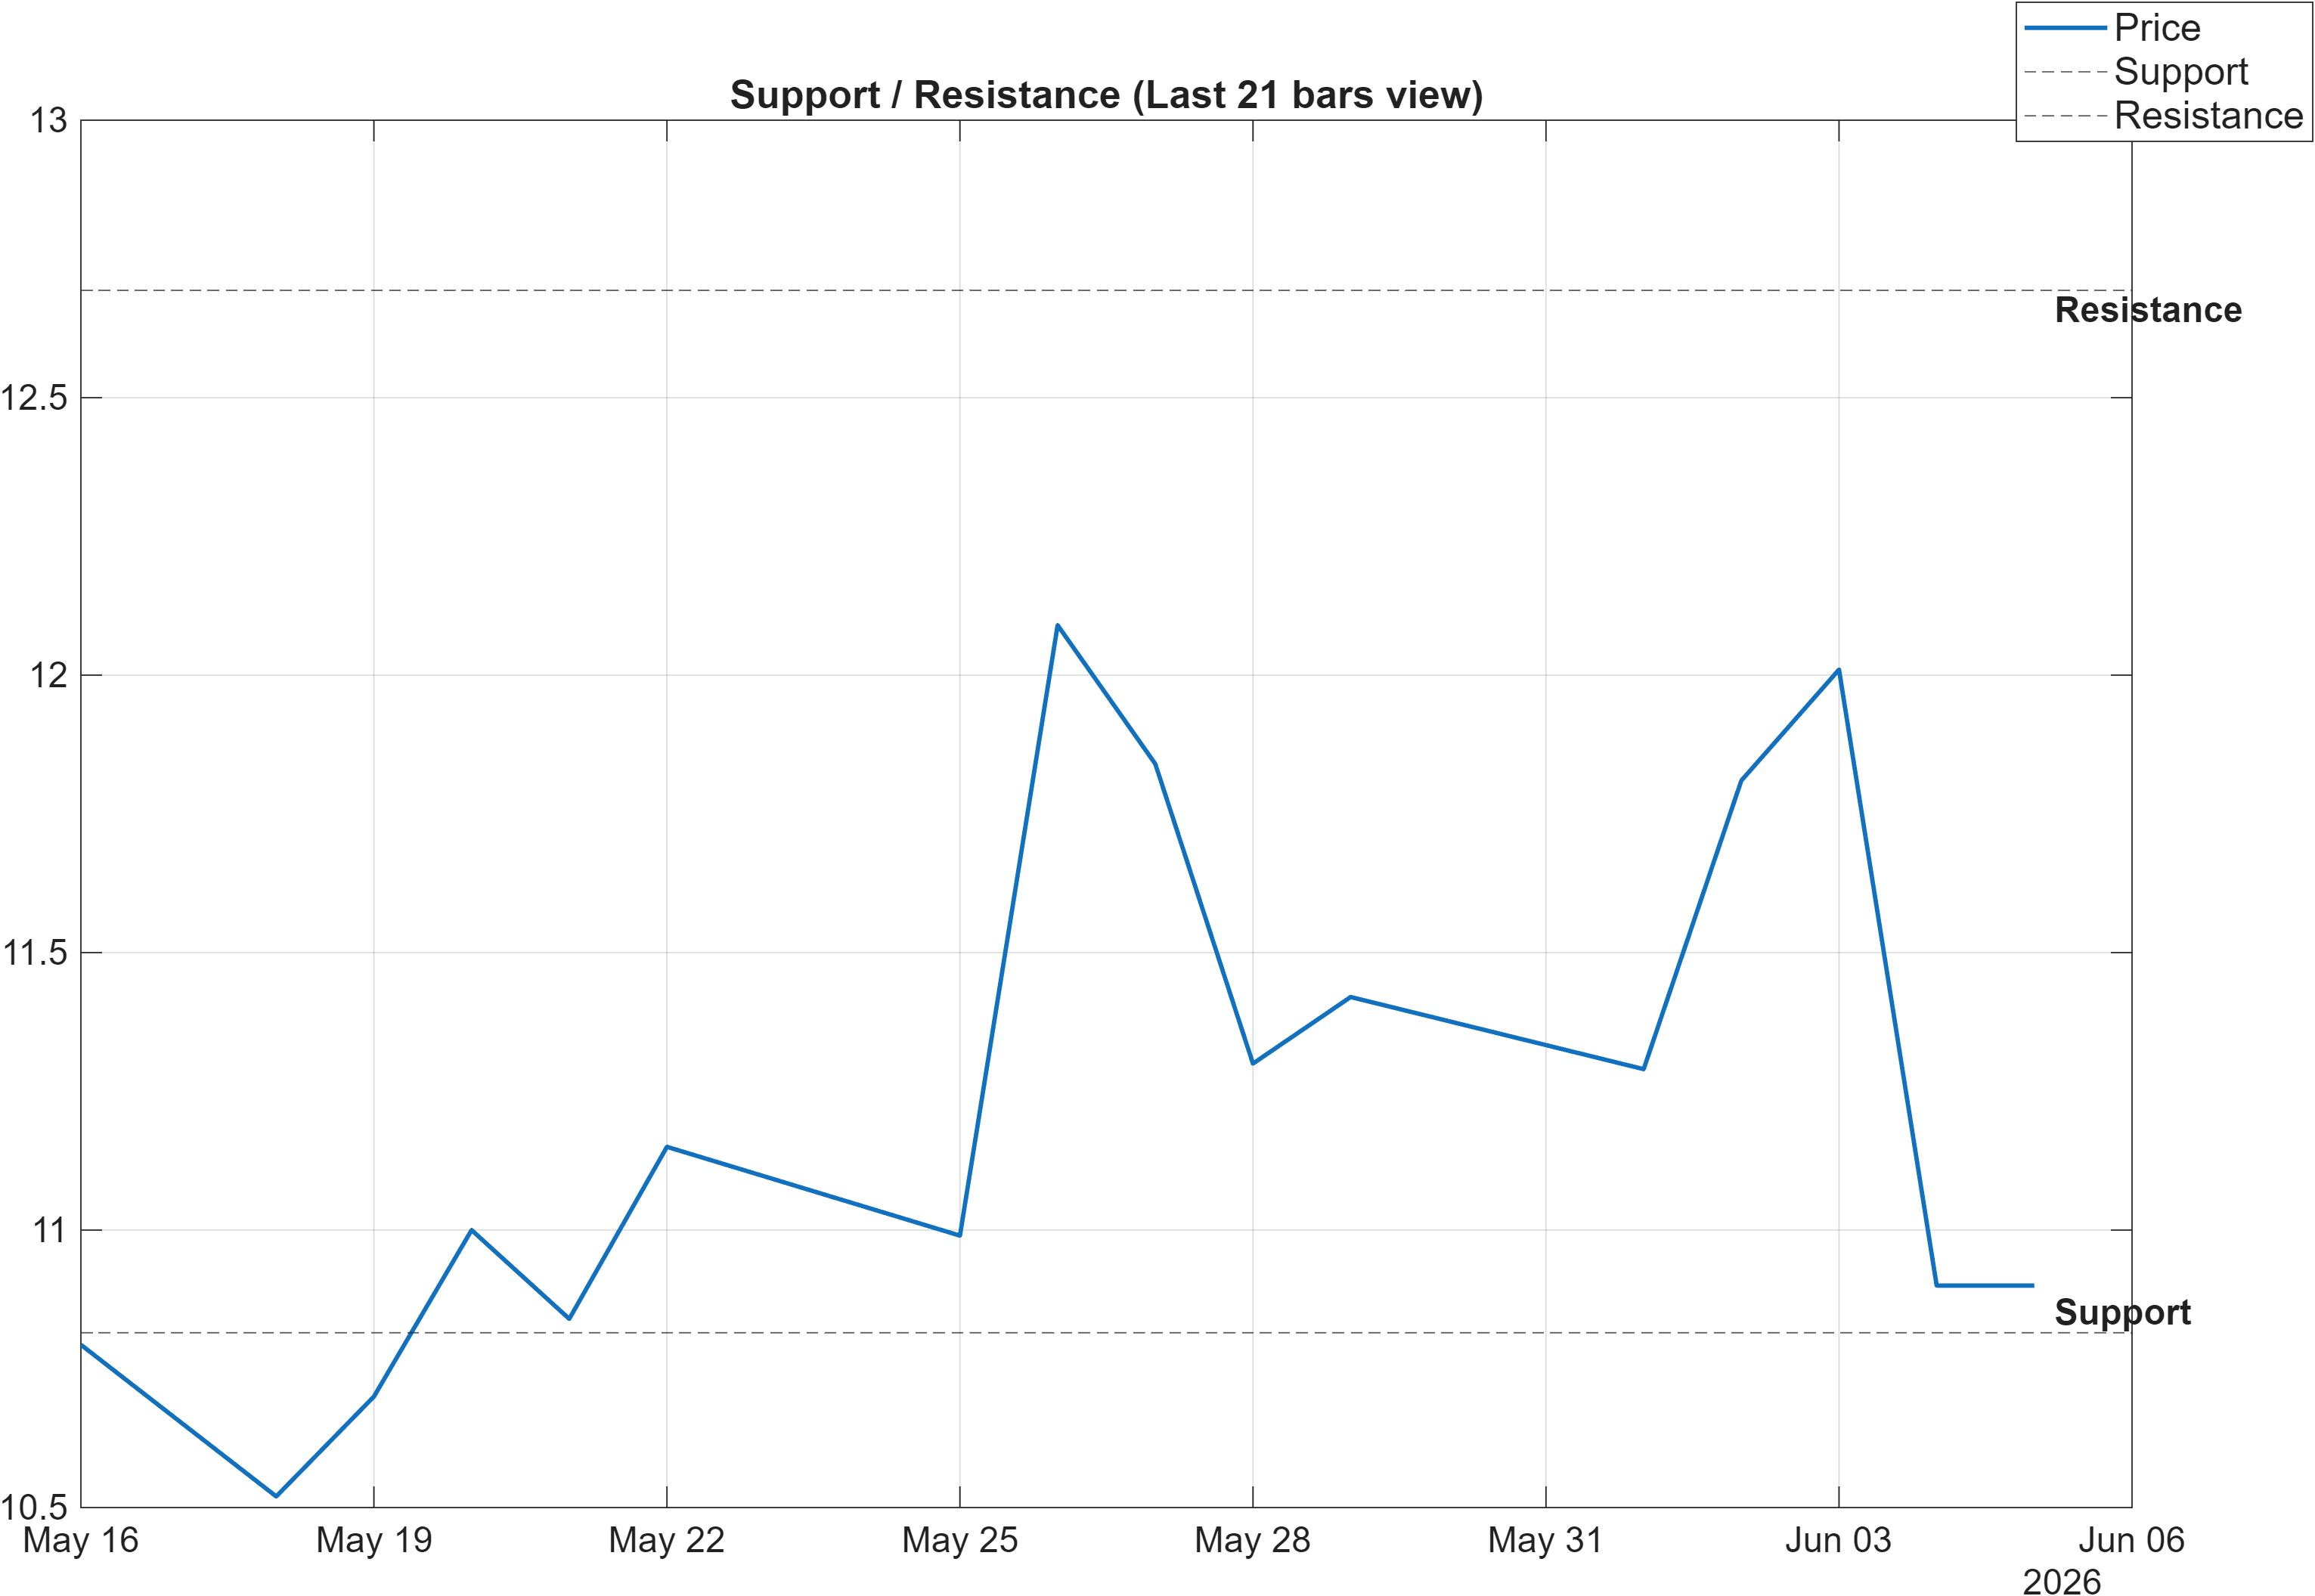
The current map is straightforward: 10.8150 is the principal downside decision zone and 12.6933 is the principal upside decision zone. Given the bearish MA configuration, resistance tends to function as a validation gate for any upside thesis; support functions as the risk boundary for deterioration. The scenario guidance is explicit: break above resistance with volume supports continuation, while a close below support elevates signal deterioration risk.
Decision-zone logic under mixed ranks
Mixed horizon ranks (daily bearish vs longer neutral) often translate into mean-reversion behavior inside boundaries until a decisive break occurs. This interacts with the volatility regime (bandwidth 0.1591) by increasing the informational content of any level breach. If the market remains between these levels, the more likely path is continued rank churn rather than clean trend establishment.
Integrating momentum with levels
Momentum readings provide nuance around these zones: a neutral RSI (46.97) and slightly positive MACD histogram (0.0020) are consistent with a market that can test resistance without being technically overextended. Conversely, if price approaches 10.8150 while participation metrics remain soft (as suggested by several bearish volume/flow slopes in the signal set), the level can become more vulnerable even without extreme momentum readings.
Scenario view: Break above resistance with volume → continuation. Close below support → signal deterioration risk.
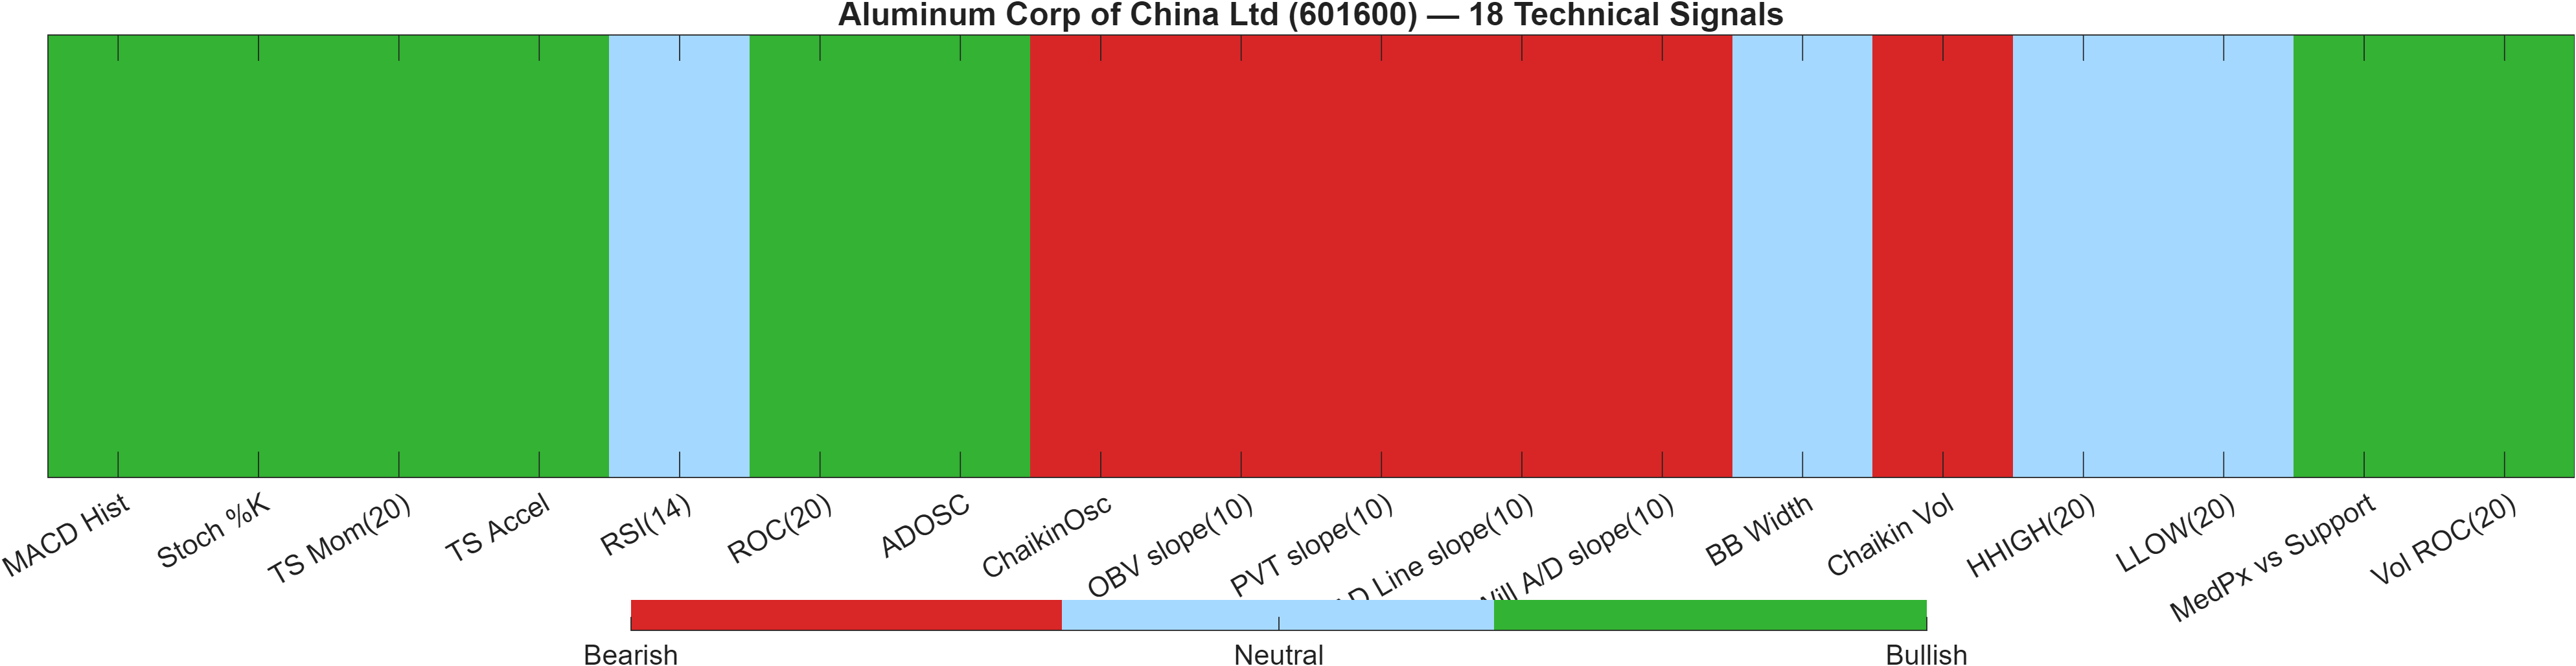
5) Quant Technical Dashboard (18 Signals)
KGNAI AI Technical Analysis Score (Deep Reinforcement Learning): Rank #1287 out of 1292 (Rank 1 represents the strongest technical positioning and a higher probability of favorable price behavior. As ranks increase toward the maximum, the probability of favorable outcomes weakens and bearish positioning becomes more dominant.) | Label: Bearish | Score: -0.992
18-Signal Technical Confluence Score: 0.111 (Neutral)
Overall Technical Score (18-signal confluence + DRL rank blend): -0.220 (Neutral)
Note: The blended score reflects signal strength weighted against broader AI technical ranking, which may temporarily diverge.
Blended technical score breakdown: -0.220 (Neutral | Bull 8 / Bear 6 / Neutral 4)
Confluence vs model-rank tension
The technical stack contains an important internal tension. The 18-signal confluence score is 0.111 (Neutral) and the blended overall technical score is -0.220 (Neutral), yet the separate DRL technical rank is #1287/1292 with a Bearish label and score -0.992. When a learning-based rank model sits near the extreme bearish tail while conventional signal confluence remains neutral, it often indicates the model is detecting pattern-risk (structure/sequence) that is not captured by single-point indicator states.
What the signal mix is emphasizing
The confluence breakdown shows Bull 8 / Bear 6 / Neutral 4, a balanced distribution rather than a one-way cascade. Selected positives include MACD histogram (0.002026, bullish) and a very low Stoch %K (4.268, bullish-labeled), while several participation/flow slopes are bearish (e.g., OBV slope(10) and AD Line slope(10) both negative and bearish-labeled). That composition is consistent with price attempting to stabilize while participation remains uneven.
Interpretation for risk framing
In practice, the DRL tail ranking argues for requiring stronger confirmation before treating bullish signals as dominant—particularly in a market already flagged bearish by trend filters. Conversely, the neutral confluence and contained volatility (BB Width 0.1591) argue against assuming immediate acceleration without a level break. This is the type of environment where support/resistance outcomes (10.8150 / 12.6933) tend to dominate the next meaningful update in both the indicator layer and the rank layer.
Signal table (Bull/Bear/Neutral)
| Indicator | Value | Signal |
|---|---|---|
| MACD Hist | 0.002026 | Bullish |
| Stoch %K | 4.268 | Bullish |
| TS Mom(20) | 0.2433 | Bullish |
| TS Accel | 1.247 | Bullish |
| RSI(14) | 46.97 | Neutral |
| ROC(20) | 2.283 | Bullish |
| ADOSC | 5.556 | Bullish |
| ChaikinOsc | -3.948e+08 | Bearish |
| OBV slope(10) | -1.177e+09 | Bearish |
| PVT slope(10) | -5.192e+07 | Bearish |
| AD Line slope(10) | -1.817e+09 | Bearish |
| Will A/D slope(10) | -2.3 | Bearish |
| BB Width | 0.1591 | Neutral |
| Chaikin Vol | 18.43 | Bearish |
| HHIGH(20) | 12.47 | Neutral |
| LLOW(20) | 10.34 | Neutral |
| MedPx vs Support | 0.465 | Bullish |
| Vol ROC(20) | 100.1 | Bullish |
Interpretation: Indicator-level signals form the base confluence, which is then adjusted using a separate AI-driven technical ranking model. The final technical score summarizes this combined view.
6) News sentiment + extractive gist
Note: Instrument-specific news matches were not found, so the digest includes broader market/sector headlines. Links are provided for verification.
Sentiment score (avg): -0.026 | Positive: 0% | Neutral: 88% | Negative: 12%
KGNAI AI News Sentiment Score (normalized -1 to +1): 1.00 (as of 2026-02-25) | Label: Bullish | Overall news score: 1.00
Positive Developments
Recent coverage across major financial outlets leans toward a cautiously constructive tone in the broader macro and policy backdrop, with recurring discussion around potential de-escalation pathways in geopolitics and the market’s tendency to re-price risk when diplomatic narratives shift. For sector-linked equities, this matters less as a direct driver and more as a risk-premium variable that can influence cyclicals and materials indirectly through positioning and cross-asset volatility. However, this optimism is not mirrored by the news distribution metrics provided here: the breakdown shows 0% positive and a slightly negative average sentiment (-0.026), which implies the constructive angle is more contextual than instrument-specific. The headline implication is that if risk appetite improves, 601600 may benefit primarily through broader flow conditions rather than dedicated company catalysts—so confirmation should still come from price behavior around 12.6933 and trend repair signals.
Neutral / Mixed Developments
The dominant feature of the digest is neutral: 88% of items are classified as neutral, and the RSS-style content mix suggests more informational coverage than directional, instrument-relevant catalysts. This aligns with the technical picture of contained volatility (BB Width 0.1591) and mixed momentum (RSI 46.97 neutral; MACD histogram 0.0020 slightly positive). A noteworthy internal inconsistency remains: the normalized KGNAI news sentiment score is 1.00 with a Bullish label, while the average sentiment score is slightly negative at -0.026. Interpreting this strictly within the provided data, sentiment appears to be offering a supportive bias in the model normalization layer, but the raw distribution does not show broad positive skew.
Negative / Risk Signals
Risk-oriented coverage emphasizes themes that can elevate uncertainty—such as policy competition in strategic technologies and broader “great power” framing—factors that can spill into commodity and industrial equity volatility through risk-off rotations. Within the provided sentiment metrics, 12% of items are classified as negative and the average is marginally negative (-0.026), consistent with low-grade caution rather than acute stress. The main analytical takeaway is sentiment/price conflict risk: the short-term KGNAI rank is bearish (daily #1228/1292) while the normalized sentiment score prints 1.00 (Bullish label). In these conditions, it is typically the price-level map that resolves the conflict—either by holding 10.8150 and rebuilding trend structure, or by breaking support and validating the bearish rank pressure.
- What to monitor next: Reaction quality near 10.8150 (hold vs close below).
- What to monitor next: Any breakout attempt above 12.6933 alongside visible volume confirmation.
- What to monitor next: Whether RSI remains neutral (~46.97) or shifts into a directional momentum regime.
Sources referenced: Reuters, Bloomberg, Yahoo Finance, MarketWatch, Investing.com
Snapshot: AI Rank (Short–Mid–Long): Mixed (Bearish–Neutral–Neutral) · Technical Confluence: Neutral · Key Levels: Support ~10.82 | Resistance ~12.69 · News Sentiment: Neutral
7) Sources
Not available in the provided data.
You may also like: How KGNAI AI ranks instruments across global markets
Disclaimer: KGNAI provides AI-generated analytics and educational market commentary only. This is not financial advice. Markets involve risk. Always do your own research.