
CNHUSD (Chinese Yuan Offshore / US Dollar) — 24-Jun-2026 Quant Signal: Stability Fraying Amid Bearish Ranks
CNHUSD is presenting a structurally cautious setup: KGNAI’s cross-universe ranks skew bearish across the weekly through 6-month horizons, while the daily rank remains neutral, a pattern consistent with near-term stabilization inside a weaker medium-term regime. The technical layer adds nuance. The moving-average read is split (close vs MA50 bearish, MA50 vs MA200 bullish), suggesting price is under shorter-term pressure even as longer-term trend structure has not fully flipped. Momentum confirms the softer bias via RSI(14) at 38.89 and a slightly negative MACD histogram (-0.0001), while volatility appears contained with Bollinger bandwidth near 0.0075, implying the market may be compressing rather than trending aggressively. Key decision zones are narrowly defined at support ~0.1463 and resistance ~0.1480. News sentiment is mildly supportive on aggregate (0.42 label bullish), but it is not instrument-specific in the provided data and should be treated as contextual rather than confirmatory.
- Rank stance (Short / Mid / Long): Short Neutral-to-Bearish | Mid Bearish | Long Bearish
- Technical confluence label: Neutral (18-signal) with Bearish blended score
- Key levels: Support 0.1463 | Resistance 0.1480
- News sentiment bias: Slightly constructive in aggregate (0.42 bullish label), not instrument-specific in the provided data
- Confirmation / invalidation: A sustained close above 0.1480 improves continuation odds; a close below 0.1463 increases deterioration risk
KGNAI evaluates assets using large cross-sectional datasets built from millions of structured data points. Inputs incorporate fundamental metrics, technical structures, and systematically processed news sentiment. Statistical models, machine learning, and AI frameworks are used to assess relative positioning, signal alignment, and probabilistic behavior across broad universes.
- Ranks are comparative across the tracked universe, not absolute price targets.
- Confluence reflects alignment among independent signal groups.
- Support/resistance levels are probabilistic decision zones, not guarantees.
- Sentiment provides contextual bias within the broader analytical framework.
1) KGNAI AI Analysis
Region: FOREX
Total universe size: 927 ranked instruments
- Daily rank: #707 out of 927 — Neutral
- Weekly rank: #855 out of 927 — Bearish
- Monthly rank: #862 out of 927 — Bearish
- 3-Monthly rank: #870 out of 927 — Bearish
- 6-Monthly rank: #856 out of 927 — Bearish
- Yearly rank: #527 out of 927 — Neutral
Cross-horizon ranking dispersion is the defining feature here. CNHUSD’s daily rank (#707) sits in the weaker half of the universe but avoids an outright bearish label, while the weekly through 6-month ranks (#855–#870 range) cluster deep in the lower portion of the distribution, consistent with sustained relative weakness versus the broader set of 927 instruments. The yearly rank (#527) returning to neutral adds a second layer: longer-horizon behavior is not uniformly risk-off, but it is also not strong enough to offset the weaker intermediate regime.
This configuration typically indicates that short-term price action may be attempting to base while the medium-term evidence remains heavy. When weekly/monthly ranks remain elevated while daily improves, the market often needs additional confirmation from momentum and level breaks before the rank regime can rotate. In that sense, the rank stack is not signaling “capitulation”; it is signaling persistence of unfavorable relative conditions until proven otherwise.
The stated term view remains Bearish across short-, mid-, and long-term, which aligns more closely with the intermediate ranks than the daily/yearly neutrality. For risk framing, the practical implication is that mean-reversion bounces can occur without changing the underlying comparative posture—particularly when intermediate ranks are tightly clustered in the bearish zone.
KGNAI ranks each instrument across large universes using multiple proprietary AI tests and statistical models (millions of data points). Lower ranks generally indicate stronger probability of favorable performance behavior, while higher ranks indicate weaker probability and more bearish positioning.
Term view: Short-term: Bearish. Mid-term: Bearish. Long-term: Bearish.
Want the full universe and complete rank tables? Unlock full access on KGNAI: https://www.kgnai.com/pricing
2) Price & trend overview
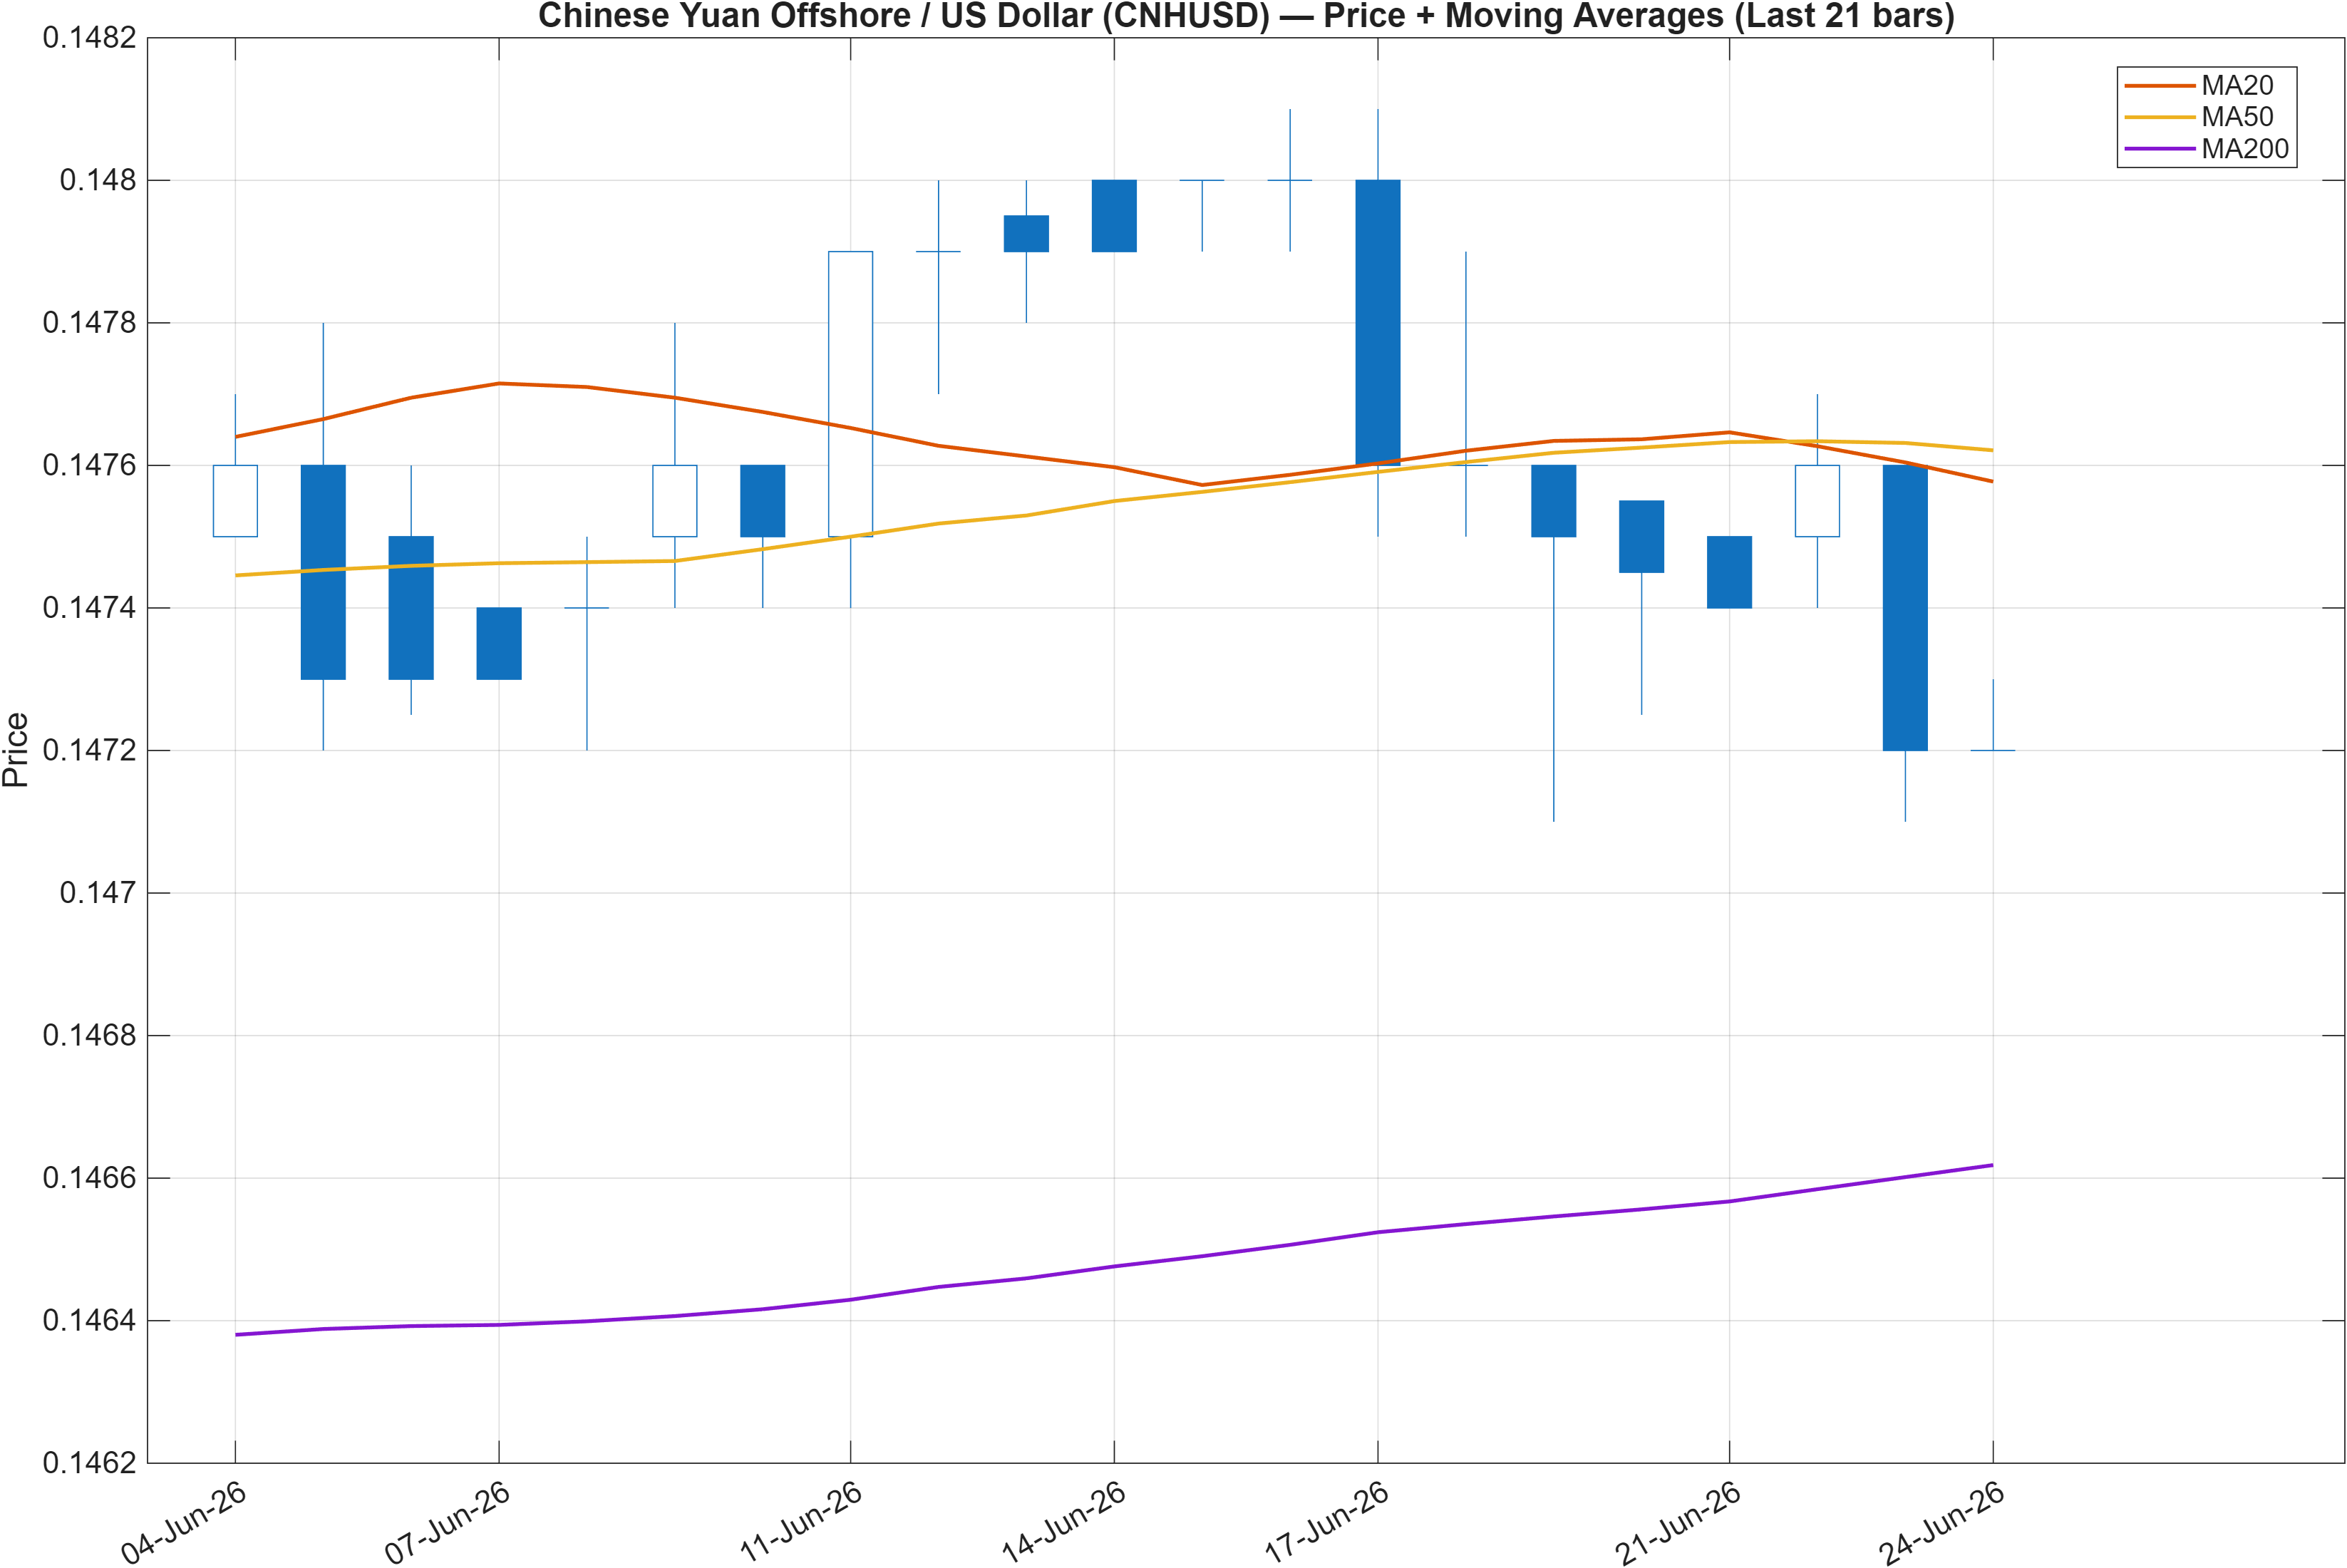
Interpretation: Close vs MA50 = Bearish, MA50 vs MA200 = Bullish.
Mixed trend structure: near-term pressure vs longer-term residual support
The moving-average configuration is explicitly split: price vs MA50 is bearish, while MA50 vs MA200 is bullish. That combination often appears during regime transitions or extended consolidations—when the market is losing near-term traction but has not yet confirmed a broader trend reversal. For CNHUSD, this helps explain why the daily rank is neutral even as intermediate ranks remain bearish: short-term conditions can stabilize inside a still-unfavorable medium-term comparative backdrop.
From a market-structure perspective, the most relevant takeaway is that the shorter lookback is acting as an active constraint. As long as the close is below the MA50, rallies tend to be judged against that reference as potential “tests,” not confirmations. Meanwhile, a still-bullish MA50/MA200 relationship implies the longer baseline has not decisively rolled over, which can reduce the speed of follow-through unless other indicators (momentum and level breaks) align.
This is also consistent with the narrowly defined nearby levels in the report—support ~0.1463 and resistance ~0.1480. When price trades in a tight corridor while moving averages disagree, the market often expresses itself through range behavior and failed breakouts rather than a clean trend. Any sustained move that resolves the corridor can “force” the moving-average picture to converge, but until then, the balance of evidence favors caution given the bearish tilt across weekly/monthly rankings.
3) Momentum & volatility dashboard
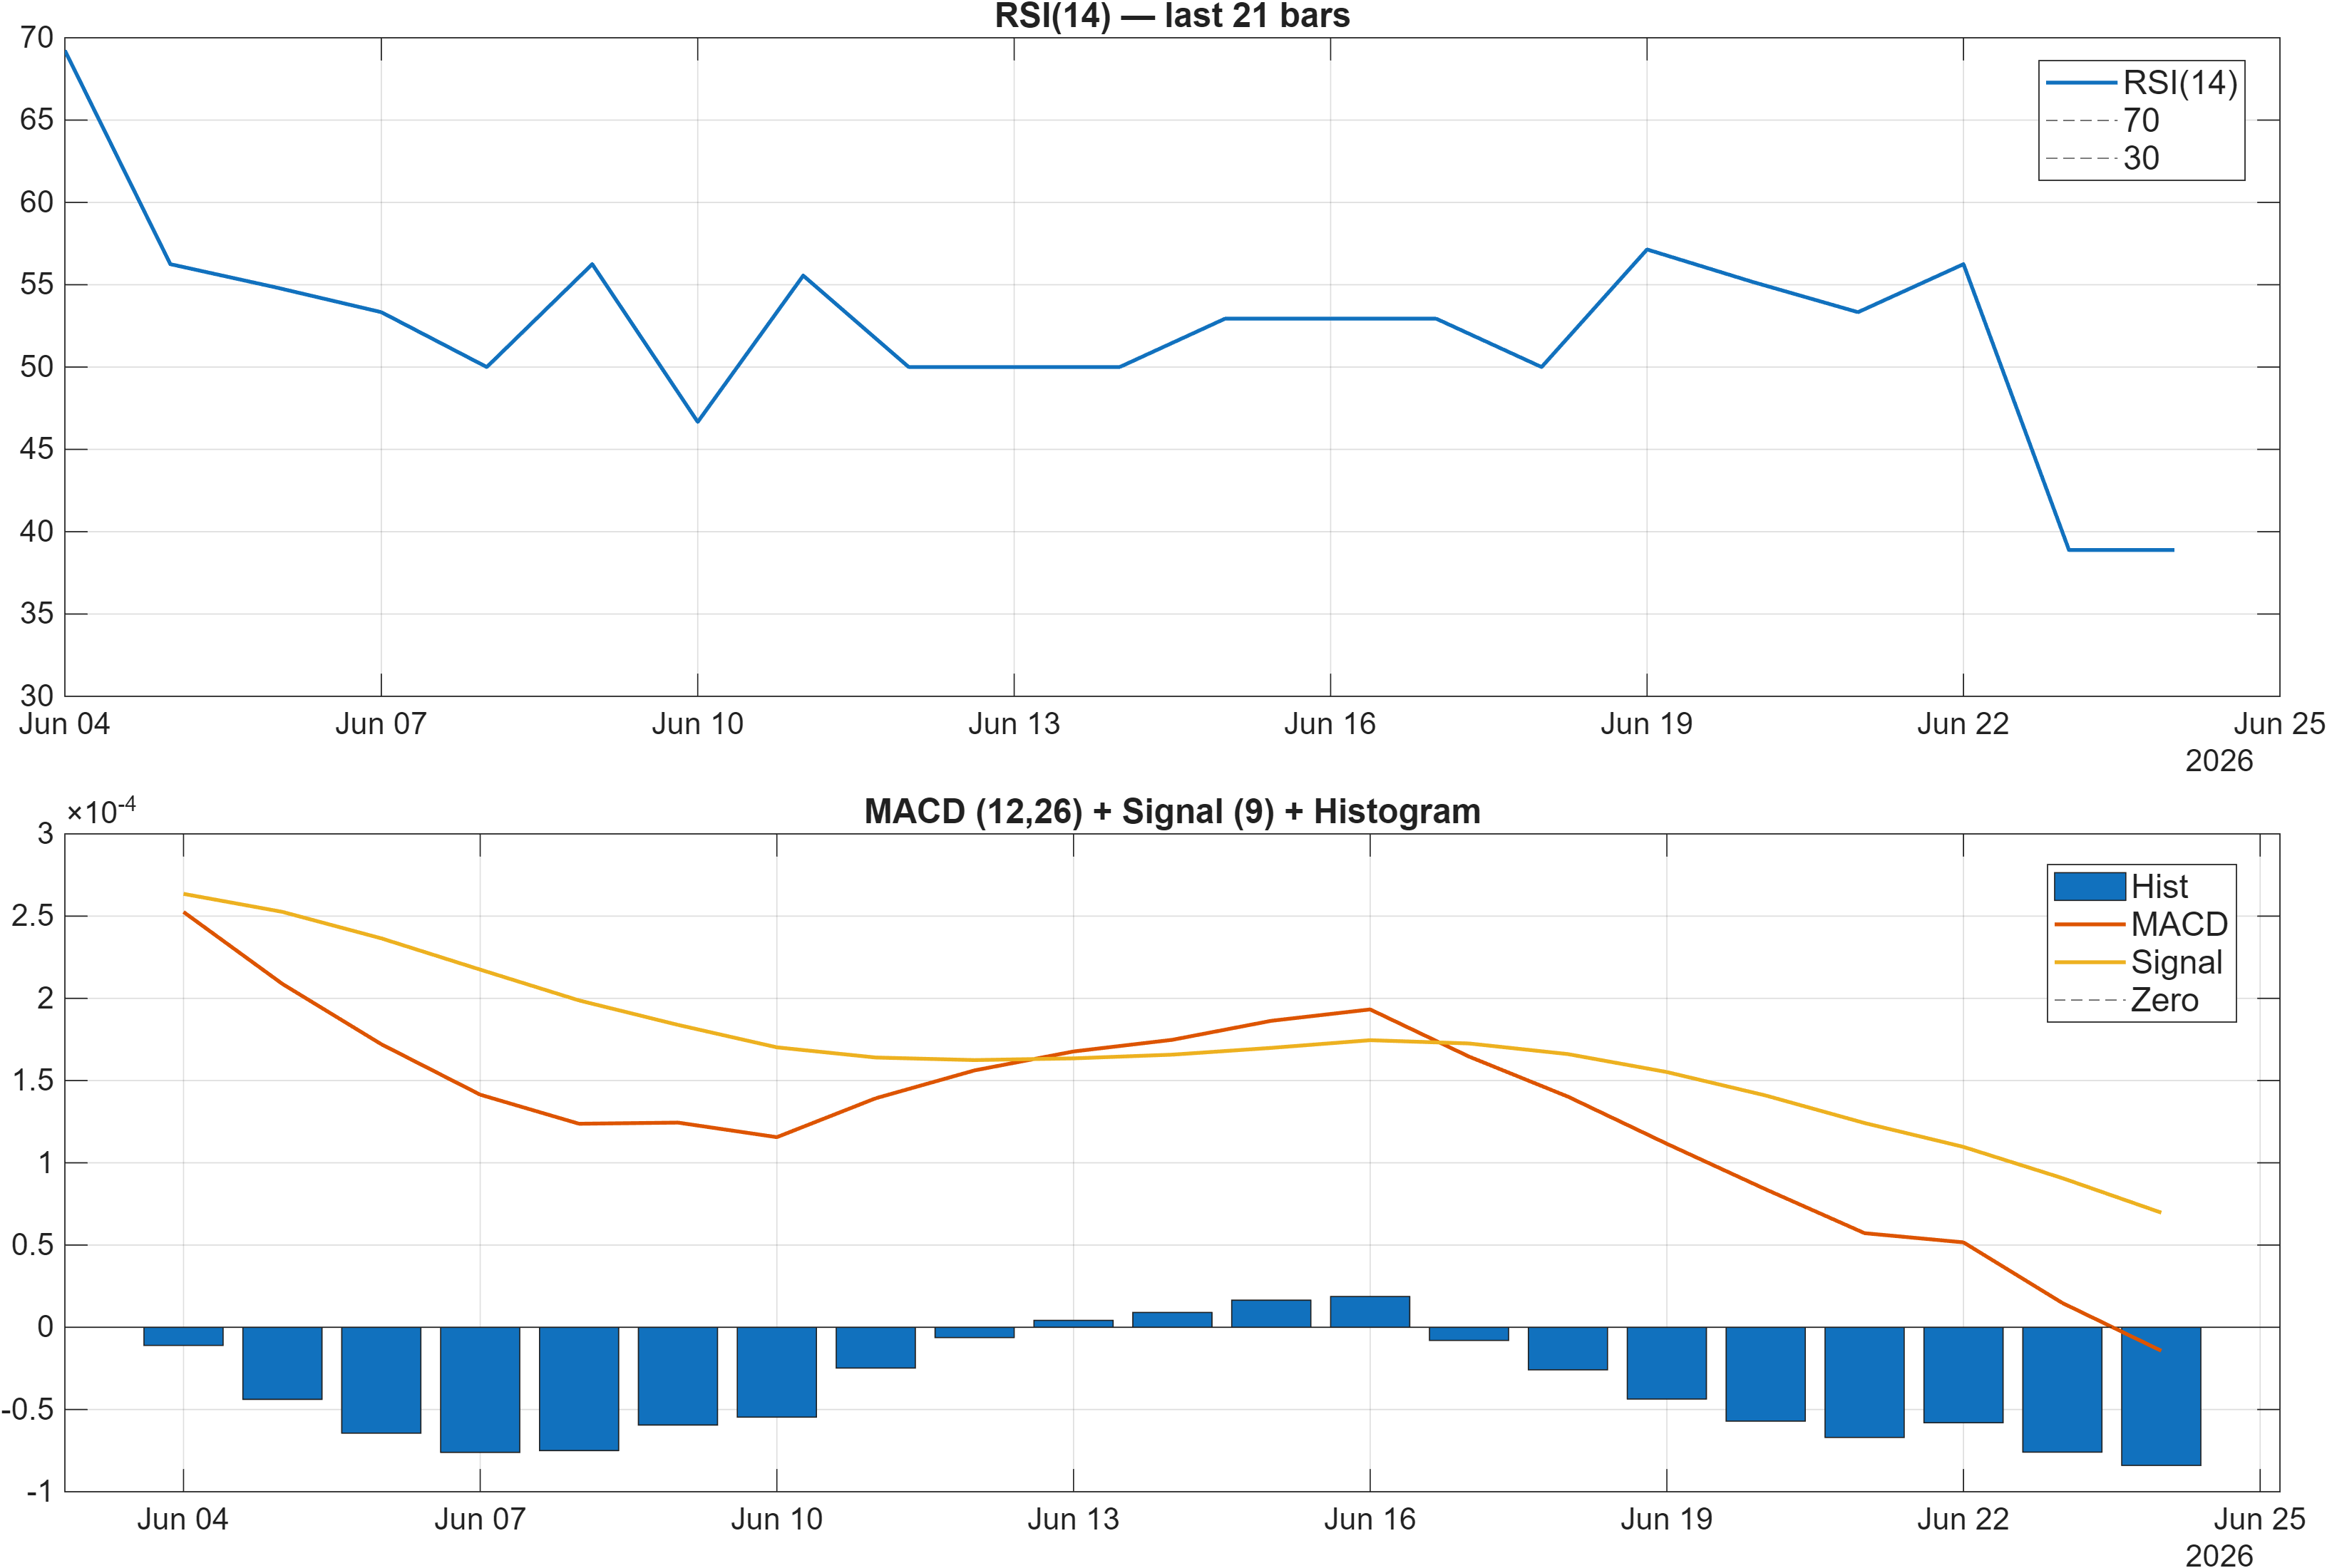
Interpretation: RSI bias = Bearish, MACD hist = -0.0001.
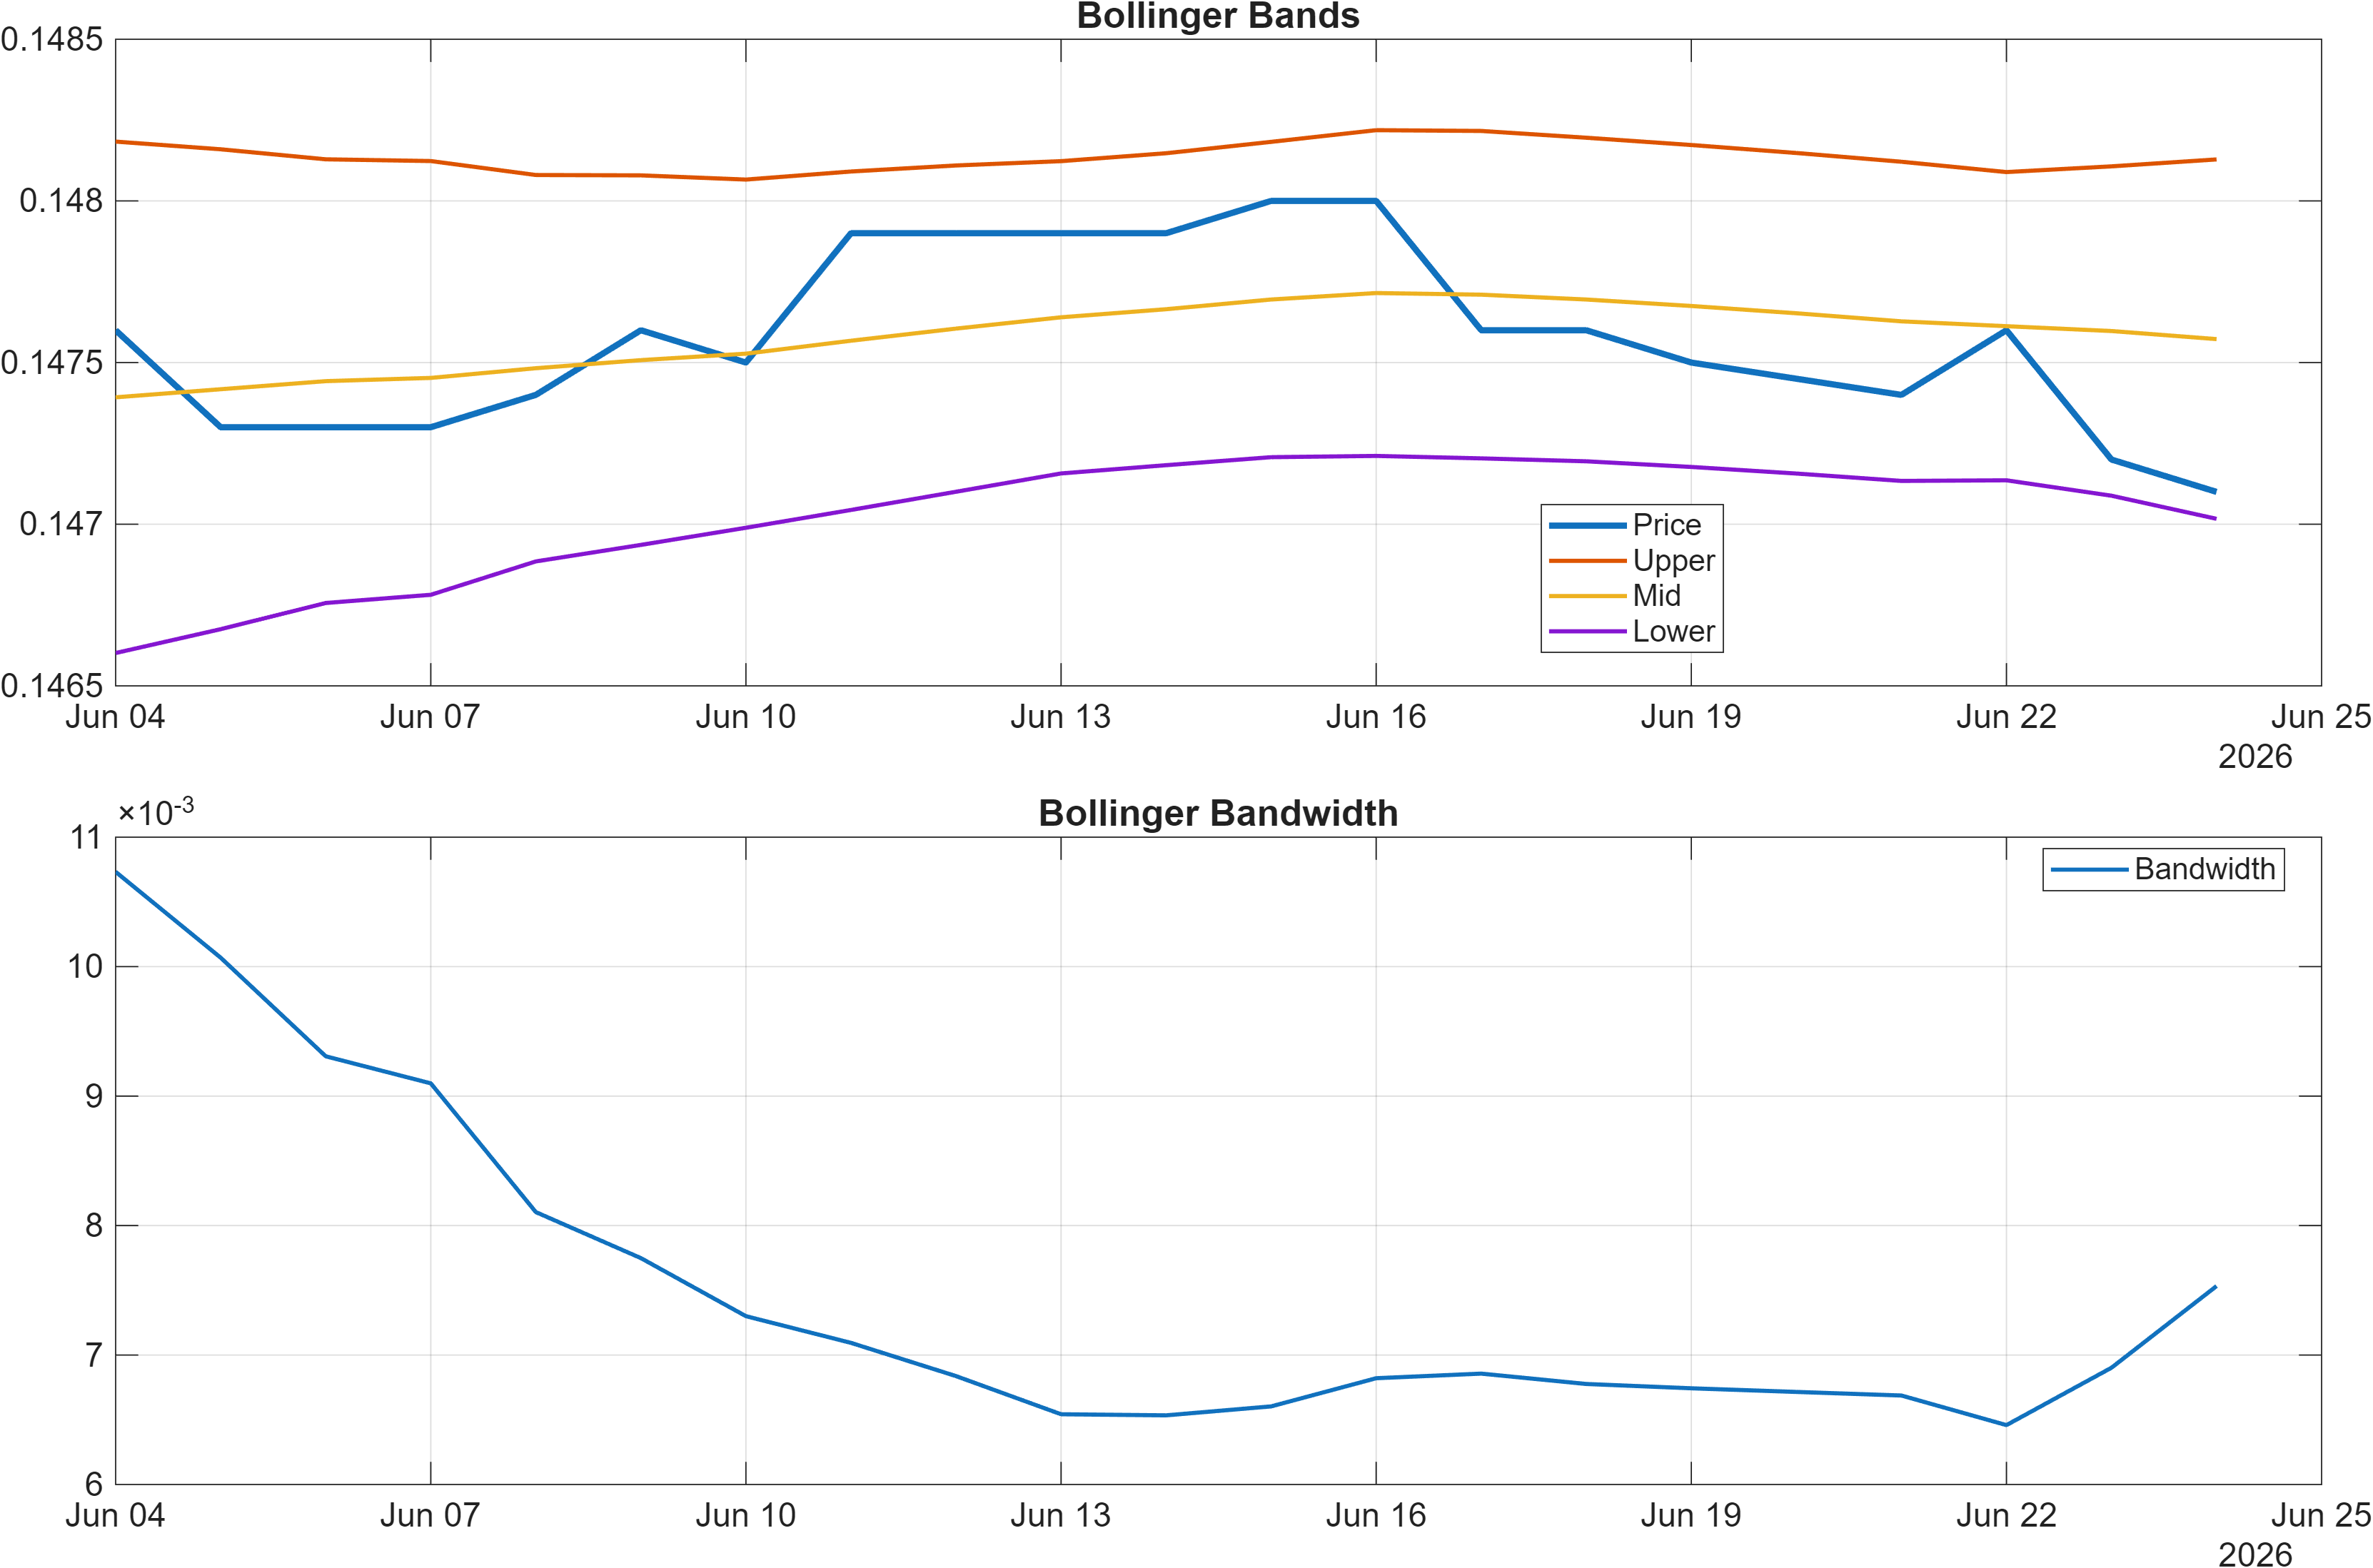
Interpretation: Bandwidth (volatility regime) latest = 0.0075.
Momentum softness with contained volatility: pressure without capitulation
Momentum readings lean bearish without showing an extreme washout. RSI(14) at 38.89 sits below the typical 50 midline associated with neutral momentum, aligning with the report’s bearish RSI bias. At the same time, the MACD histogram at -0.0001 is only modestly negative, which can be interpreted as soft negative momentum rather than aggressive downside acceleration. In FX pairs, that combination commonly corresponds to drifting weakness or repeated failures at resistance rather than a disorderly move.
Volatility context supports that interpretation. Bollinger bandwidth is reported at 0.0075, suggesting a relatively contained regime rather than an expanding, trend-chasing environment. When volatility is compressed while momentum is negative, markets can become more level-sensitive: breaks may require less follow-through to trigger stops, yet false breaks can also occur if volatility remains capped and liquidity conditions are stable.
The interplay between momentum and volatility is particularly relevant given the close proximity of the key zones (support 0.1463, resistance 0.1480). With bandwidth muted, CNHUSD may oscillate through smaller moves, but a level resolution can still matter because it shifts the probability of momentum re-acceleration (either by lifting RSI back toward neutral or by pushing MACD histogram further negative). In the current configuration, evidence favors a cautious stance: momentum is not confirming strength, and volatility is not providing the expansion typically associated with a durable trend change.
4) Support / Resistance zones
Support ~ 0.1463 | Resistance ~ 0.1480
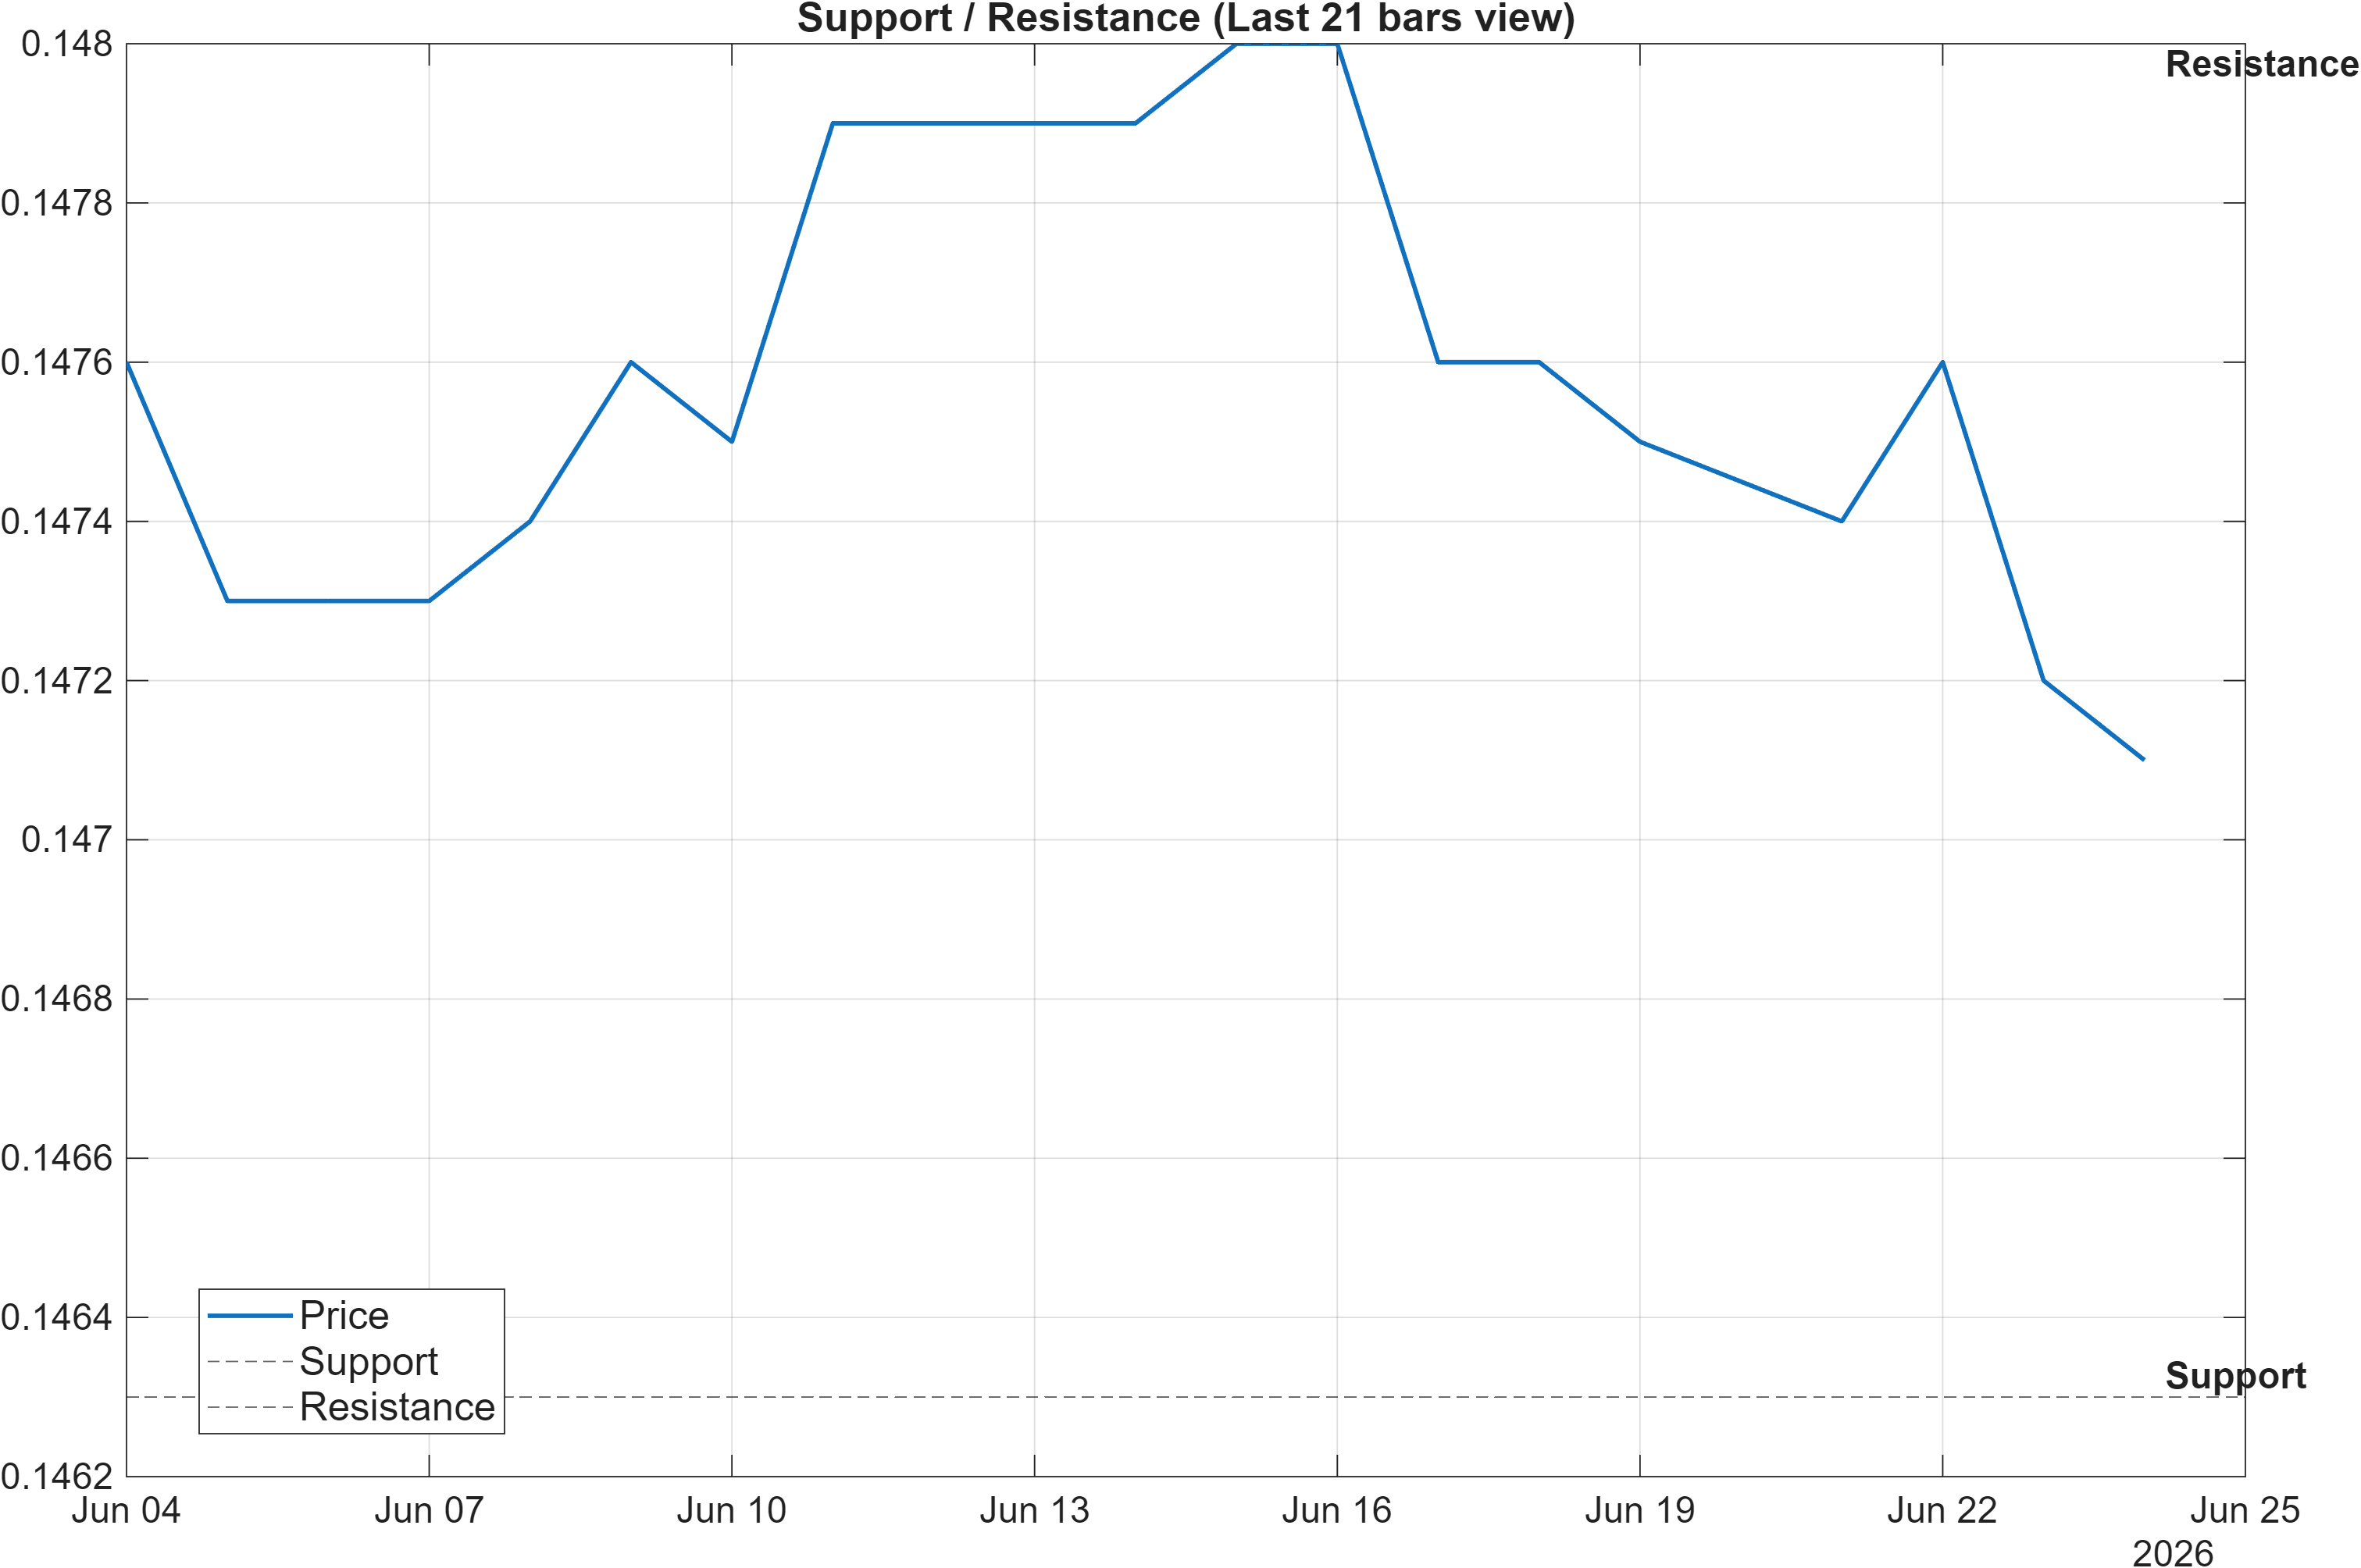
Scenario view: Break above resistance with volume → continuation. Close below support → signal deterioration risk.
Tight decision corridor: asymmetric information around 0.1463–0.1480
CNHUSD is framed by a narrow, clearly defined corridor: 0.1463 support against 0.1480 resistance. When levels are this close, the analytical focus shifts from “distance to target” to quality of acceptance or rejection at the boundary. In a compressed-volatility setting (bandwidth 0.0075), even modest moves can test these zones frequently; what matters is whether price can hold above resistance or fail and revert back into the range.
The level framework also interacts with the trend split noted earlier (close vs MA50 bearish; MA50 vs MA200 bullish). A resistance reclaim near 0.1480 would be more informative if it coincides with improving momentum—particularly if the negative MACD histogram (-0.0001) compresses toward zero and RSI stabilizes from 38.89. Conversely, a close below 0.1463 would align with the intermediate bearish rank cluster (weekly through 6-month ranks in the #855–#870 region), reinforcing the probability that the medium-term regime remains dominant.
Because this is FX, “volume” may not be consistently available in every venue; the scenario language still serves as a proxy for participation and follow-through. In practice, traders often use persistence (multiple closes) and reduced snapback as functional substitutes for volume confirmation. Until a boundary is resolved, the evidence set argues for treating the corridor as a probabilistic decision zone rather than an outright directional signal.
5) Quant Technical Dashboard (18 Signals)
KGNAI AI Technical Analysis Score (Deep Reinforcement Learning): Rank #887 out of 927 (Rank 1 represents the strongest technical positioning and a higher probability of favorable price behavior. As ranks increase toward the maximum, the probability of favorable outcomes weakens and bearish positioning becomes more dominant.) | Label: Bearish | Score: -0.914
18-Signal Technical Confluence Score: -0.222 (Neutral)
Overall Technical Score (18-signal confluence + DRL rank blend): -0.430 (Bearish)
Note: The blended score reflects signal strength weighted against broader AI technical ranking, which may temporarily diverge.
Blended technical score breakdown: -0.430 (Bearish | Bull 3 / Bear 7 / Neutral 8)
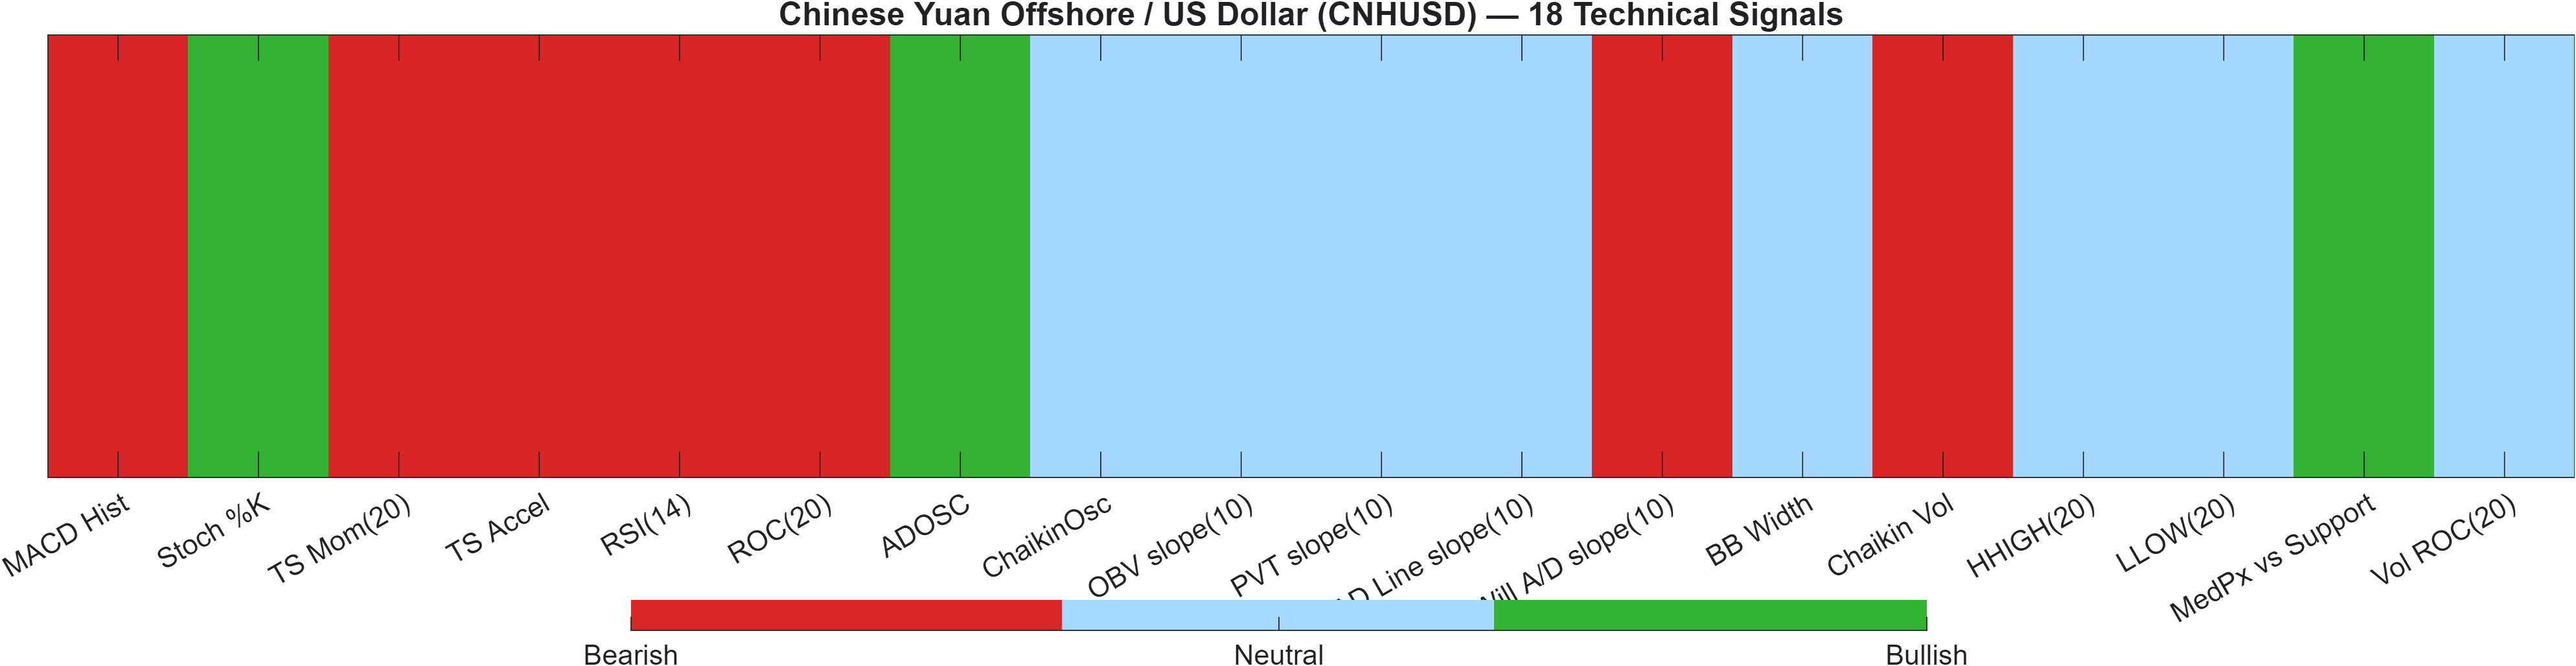
Confluence vs model rank: neutrality at the surface, bearish in the blend
The dashboard highlights a meaningful alignment vs divergence dynamic between signal aggregation and model-based technical ranking. On one hand, the 18-signal confluence score is -0.222 (Neutral), indicating a mixed set where bearish evidence is present but not overwhelming. On the other hand, the Deep Reinforcement Learning technical rank is #887 out of 927 with a -0.914 score, pulling the overall blended technical score to -0.430 (Bearish). This is a classic case where the model layer interprets the configuration as weaker than the raw signal mix alone would suggest.
The internal distribution supports that caution: Bull 3 / Bear 7 / Neutral 8 implies the plurality is neutral, yet bearish signals outnumber bullish. In practice, this often corresponds to a market that is not in a clean downtrend day-to-day, but where downside conditions are more “available” than upside when a catalyst arrives (e.g., a level break or momentum pickup).
A few indicator anchors underline the mix: RSI(14) at 38.89 and MACD Hist -8.399e-05 point to negative momentum bias, while Stoch %K at 10 can occur during oversold conditions that sometimes precede short rebounds. Volatility measures are not screaming expansion either (BB Width 0.007533 neutral), reinforcing the “compressed but fragile” profile. Net: the confluence is not aggressively bearish, but the blended framework treats the setup as skewed to unfavorable outcomes unless price behavior improves through resistance and momentum confirmation.
Signal table (Bull/Bear/Neutral)
| Indicator | Value | Signal |
|---|---|---|
| MACD Hist | -8.399e-05 | Bearish |
| Stoch %K | 10 | Bullish |
| TS Mom(20) | -0.0001 | Bearish |
| TS Accel | -0.0006 | Bearish |
| RSI(14) | 38.89 | Bearish |
| ROC(20) | -0.1358 | Bearish |
| ADOSC | 50 | Bullish |
| ChaikinOsc | 0 | Neutral |
| OBV slope(10) | 0 | Neutral |
| PVT slope(10) | 0 | Neutral |
| AD Line slope(10) | 0 | Neutral |
| Will A/D slope(10) | -0.0009 | Bearish |
| BB Width | 0.007533 | Neutral |
| Chaikin Vol | 24.49 | Bearish |
| HHIGH(20) | 0.1481 | Neutral |
| LLOW(20) | 0.1471 | Neutral |
| MedPx vs Support | 0.00095 | Bullish |
| Vol ROC(20) | — | Neutral |
Interpretation: Indicator-level signals form the base confluence, which is then adjusted using a separate AI-driven technical ranking model. The final technical score summarizes this combined view.
6) News sentiment + extractive gist
Note: Instrument-specific news matches were not found, so the digest includes broader market/sector headlines. Links are provided for verification.
Sentiment score (avg): 0.024 | Positive: 12% | Neutral: 75% | Negative: 12%
KGNAI AI News Sentiment Score (normalized -1 to +1): 0.42 (as of 2026-06-22) | Label: Bullish | Overall news score: 0.29
Positive Developments
Recent coverage across major financial outlets indicates a modestly constructive macro-news backdrop for USD-related pricing, with the aggregated sentiment model registering 0.42 (bullish label) even though instrument-specific matches were not available in the provided data. The tone is supported by commentary emphasizing ongoing US dollar firmness and selective resilience in rate-sensitive narratives. For CNHUSD, that matters less as a direct catalyst and more as an environmental factor: when the US dollar is broadly supported, CNHUSD upside attempts can require cleaner technical confirmation to override the intermediate bearish rank cluster (weekly to 6-month ranks concentrated in the #855–#870 area). In addition, some coverage highlights inflation and pricing dynamics in key global economies, which can influence cross-currency volatility expectations, even if CNHUSD remains in a relatively compressed realized-volatility regime (bandwidth near 0.0075). Overall, the “positive” element here is primarily contextual: constructive tone can reduce shock risk, but it does not replace price-level confirmation near 0.1480.
Neutral / Mixed Developments
The dominant sentiment distribution is still 75% neutral, consistent with a market narrative that is informative rather than directional. Macro coverage appears to be balancing competing forces: incremental changes in policy expectations, currency strength discussions, and risk-asset rotation themes. For CNHUSD, this neutrality aligns with the technical picture of contained volatility (BB Width 0.007533 neutral) and only mildly negative momentum (MACD histogram -0.0001). In such environments, markets often remain range-bound until a discrete trigger appears—typically a level break or a clearer momentum turn. Neutral news flow also increases the likelihood that technical levels dominate near-term behavior, placing higher emphasis on the tight support/resistance corridor at 0.1463–0.1480.
Negative / Risk Signals
Risk-oriented coverage across major outlets continues to reference cross-asset volatility episodes and uncertainty around the path of global policy rates. Even without direct CNHUSD-specific items, this matters because FX pairs can reprice quickly when volatility transmits through broader USD strength, risk-off positioning, or shifts in rates expectations. In the current setup, the technical backdrop is not positioned to absorb negative shocks comfortably: RSI(14) at 38.89 and multiple momentum measures skew bearish, while the blended technical score remains -0.430 (Bearish) due in part to the DRL technical rank at #887. If risk narratives intensify, the key vulnerability is a breakdown below 0.1463, which would better align price action with the bearish intermediate ranks. As always, the presence of risk signals should be treated as a conditional bias rather than a deterministic driver.
- Whether CNHUSD can sustain acceptance above 0.1480 rather than briefly spiking and reverting.
- Momentum repair signals: RSI holding above 38.89 and MACD histogram compressing from -0.0001 toward zero.
- Any volatility expansion from the current bandwidth near 0.0075, which would increase the odds of a decisive range resolution.
Sources referenced: Reuters, Bloomberg, Yahoo Finance, MarketWatch, Investing.com
Snapshot: AI Rank (Short–Mid–Long): Bearish (Bearish–Bearish–Bearish) · Technical Confluence: Neutral · Key Levels: Support ~0.15 | Resistance ~0.15 · News Sentiment: Neutral
7) Sources
- USD/CAD Price Forecast: Rally extends beyond 1.4200 on US Dollar’s continued outperformance — https://www.fxstreet.com/news/usd-cad-price-forecast-rally-extends-beyond-14200-on-us-dollars-continued-outperformance-202606240700
- United States Dollar Index Price Forecast: Gains ground above 101.50 amid overbought RSI signals — https://www.fxstreet.com/news/united-states-dollar-index-price-forecast-gains-ground-above-10150-amid-overbought-rsi-signals-202606240656
- Gold: Fed expectations keep prices vulnerable – ING — https://www.fxstreet.com/news/gold-fed-expectations-keep-prices-vulnerable-ing-202606240652
- Indian Rupee: Supported by policy measures against US Dollar – Commerzbank — https://www.fxstreet.com/news/indian-rupee-supported-by-policy-measures-against-us-dollar-commerzbank-202606240642
- RBA’s Hauser: Still have work to do to reduce inflation, which remains far too high — https://www.fxstreet.com/news/rbas-hauser-still-have-work-to-do-to-reduce-inflation-which-remains-far-too-high-202606240640
- Gold bounces off two-week low; not out of the woods yet amid Fed hike bets, firmer USD — https://www.fxstreet.com/news/4-050-gold-dives-to-fresh-two-week-low-as-fed-rate-hike-bets-boost-us-dollar-202606240340
- EUR/GBP Price Forecasts: Testing 10-month lows at 0.8611 in risk-off markets — https://www.fxstreet.com/news/eur-gbp-price-forecasts-testing-10-month-lows-at-08611-in-risk-off-markets-202606240632
- Equities: Rotation persists as tech sells off – Danske Bank — https://www.fxstreet.com/news/equities-rotation-persists-as-tech-sells-off-danske-bank-202606240629
You may also like: How KGNAI AI ranks instruments across global markets
Disclaimer: KGNAI provides AI-generated analytics and educational market commentary only. This is not financial advice. Markets involve risk. Always do your own research.