
GFARM2-USD (Gains Farm v2) — 31-May-2026 Technicals Stay Bearish as Higher-Timeframe Ranks Remain Constructive
GFARM2-USD (Gains Farm v2) enters 31-May-2026 with a clear split between relative positioning and spot technical posture. Cross-sectional KGNAI ranks show a constructive longer-horizon profile—monthly and 3-month ranks sit in the upper tier of the 800-instrument universe—while near-term ranks remain neutral, implying mixed follow-through risk. On the chart, the moving-average read is internally conflicted (close vs MA50 bearish, MA50 vs MA200 bullish), consistent with a market that may be transitioning rather than trending cleanly. Momentum is currently stressed: RSI(14) is deeply weak at 21.48 and MACD histogram remains negative (-3.6449), while volatility is comparatively contained with Bollinger bandwidth at 0.1501. With support near 1317.0392 and resistance near 1499.7398, validation hinges on whether price can reclaim resistance with participation or instead fails through support, converting a pullback into broader deterioration.
- Rank stance: Short-term Neutral (Daily #283; Weekly #193) vs Mid/Long Bullish (Monthly #60; 3-Month #13)
- Technical confluence: Bearish (18-signal confluence -0.389; blended overall -0.328)
- Key levels: Support ~ 1317.0392 | Resistance ~ 1499.7398
- News sentiment bias: Neutral (avg 0.000; 75% neutral; 12% positive; 12% negative)
- Confirmation / invalidation: A break above 1499.7398 with volume supports continuation; a close below 1317.0392 increases deterioration risk.
KGNAI evaluates assets using large cross-sectional datasets built from millions of structured data points. Inputs incorporate fundamental metrics, technical structures, and systematically processed news sentiment. Statistical models, machine learning, and AI frameworks are used to assess relative positioning, signal alignment, and probabilistic behavior across broad universes.
- Ranks are comparative across the tracked universe, not absolute price targets.
- Confluence reflects alignment among independent signal groups.
- Support/resistance levels are probabilistic decision zones, not guarantees.
- Sentiment provides contextual bias within the broader analytical framework.
1) KGNAI AI Analysis
Region: CRYPTO
Total universe size: 800 ranked instruments
- Daily rank: #283 out of 800 — Neutral
- Weekly rank: #193 out of 800 — Neutral
- Monthly rank: #60 out of 800 — Bullish
- 3-Monthly rank: #13 out of 800 — Bullish
The rank stack is the dominant macro signal in this report: GFARM2-USD improves materially as the horizon extends. The 3-month rank (#13) places the asset in the upper tier of the 800-instrument universe, while the monthly rank (#60) stays inside the upper quartile. That longer-window strength contrasts with neutral short-horizon ranks (daily #283, weekly #193), consistent with a setup where broader relative behavior remains favorable but the near-term tape is not yet confirming.
In market-structure terms, this pattern often appears when longer-horizon participants have not fully capitulated (supporting medium/long positioning), while shorter-horizon liquidity and momentum are still digesting a drawdown. It creates a timing risk: the asset can remain relatively well-positioned cross-sectionally while still experiencing unstable short-term swings.
The practical implication is to treat the longer-horizon rank as a contextual tailwind, not a substitute for near-term confirmation. With ranks improving sharply from daily/weekly into monthly/3-month, the key question becomes whether subsequent technical evidence (trend, momentum, and volatility) begins to converge toward that constructive longer-horizon ranking—or whether the divergence persists and pressures those higher-timeframe ranks to mean-revert.
Term view: Short-term: Neutral. Mid-term: Bullish. Long-term: Bullish.
Want the full universe and complete rank tables? Unlock full access on KGNAI: https://www.kgnai.com/pricing
2) Price & trend overview
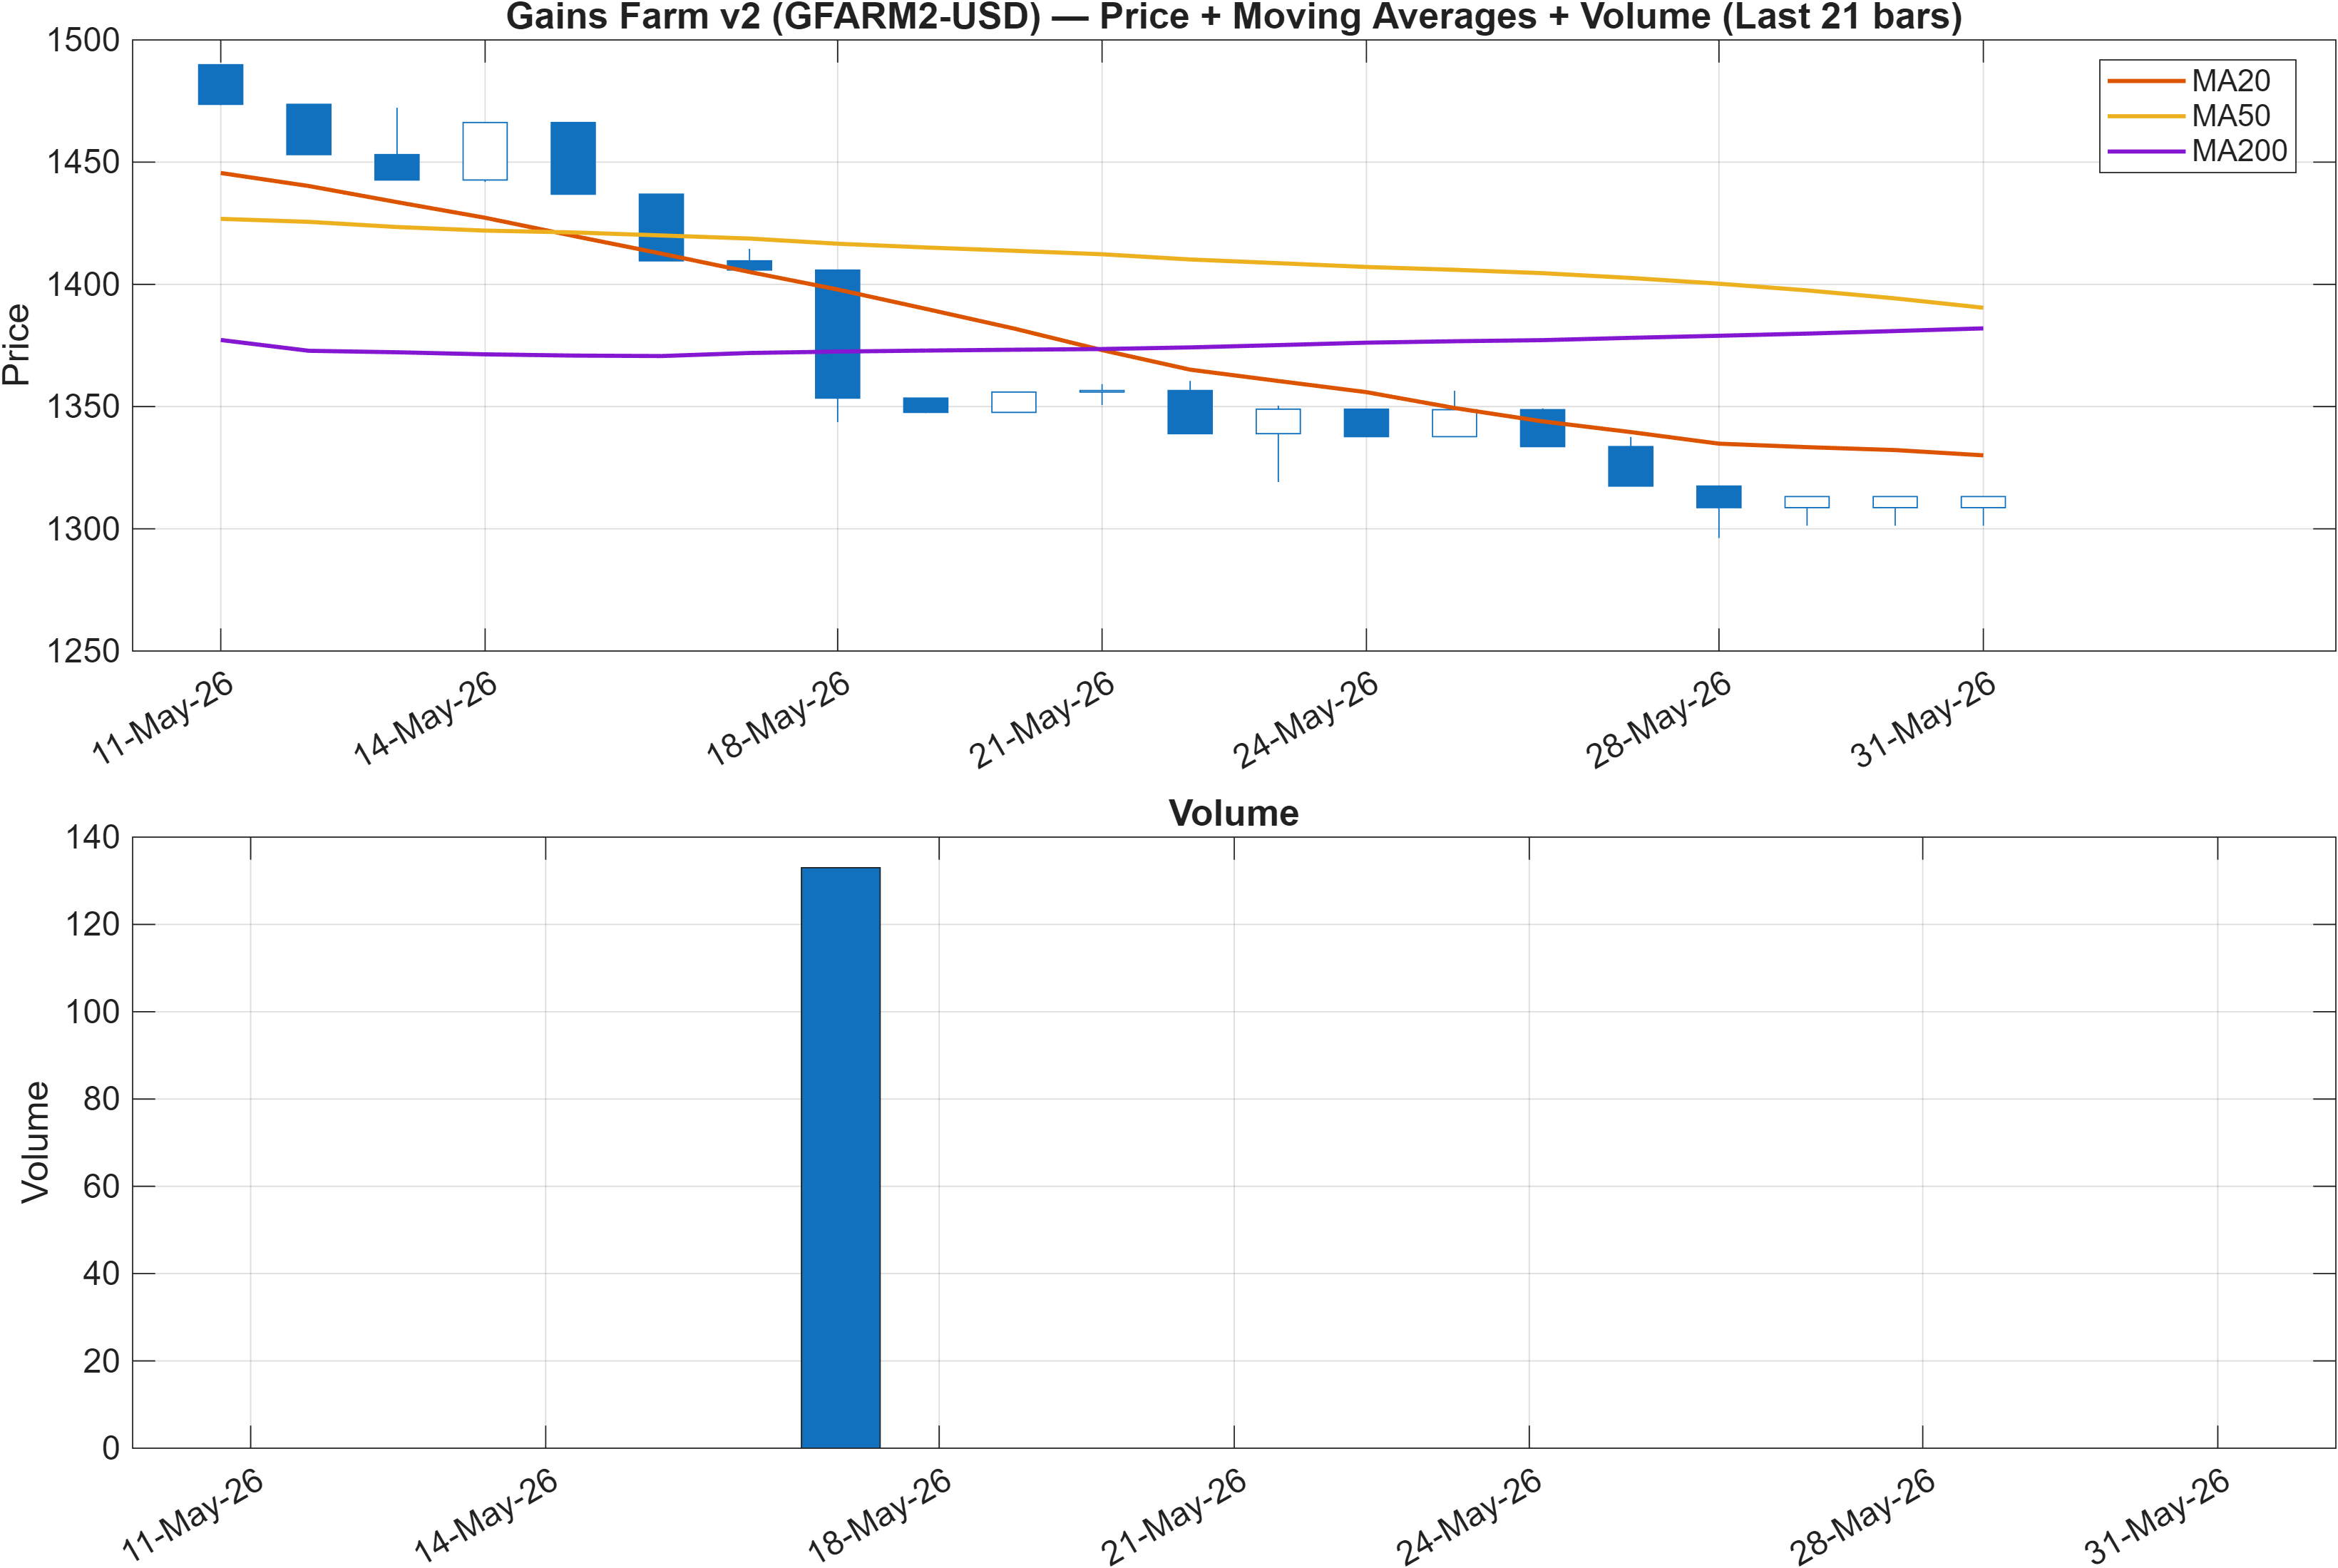
Interpretation: Close vs MA50 = Bearish, MA50 vs MA200 = Bullish.
Trend regime: longer-cycle structure vs near-term damage
The moving-average state is non-uniform: price is below the MA50 (bearish near-term trend posture), yet the MA50 remains above the MA200 (bullish longer-cycle structure). This is a classic regime where the market is either (a) undergoing a correction inside a still-constructive longer trend, or (b) in the early stages of a transition that has not yet flipped the longer baseline.
Confluence with ranks: confirmation still pending
This trend split lines up with the rank curve: neutral daily/weekly ranks alongside bullish monthly/3-month ranks. If the longer-cycle trend is going to reassert, the gap between spot price and the MA50 typically narrows, and momentum stops deteriorating. Here, momentum remains pressured (RSI(14) 21.48 and MACD histogram -3.6449 in the momentum section), so the trend picture reads as structurally constructive but tactically fragile.
Volume as the tie-breaker (contextual)
With trend measures sending mixed signals, follow-through often depends on whether participation returns during attempts to reclaim key areas. The report’s scenario framework reinforces that: a move above the 1499.7398 resistance area “with volume” is treated as continuation evidence, while weakness through 1317.0392 increases deterioration risk. Until one side is resolved, the trend regime should be read as range-to-transition rather than a clean directional trend.
3) Momentum & volatility dashboard
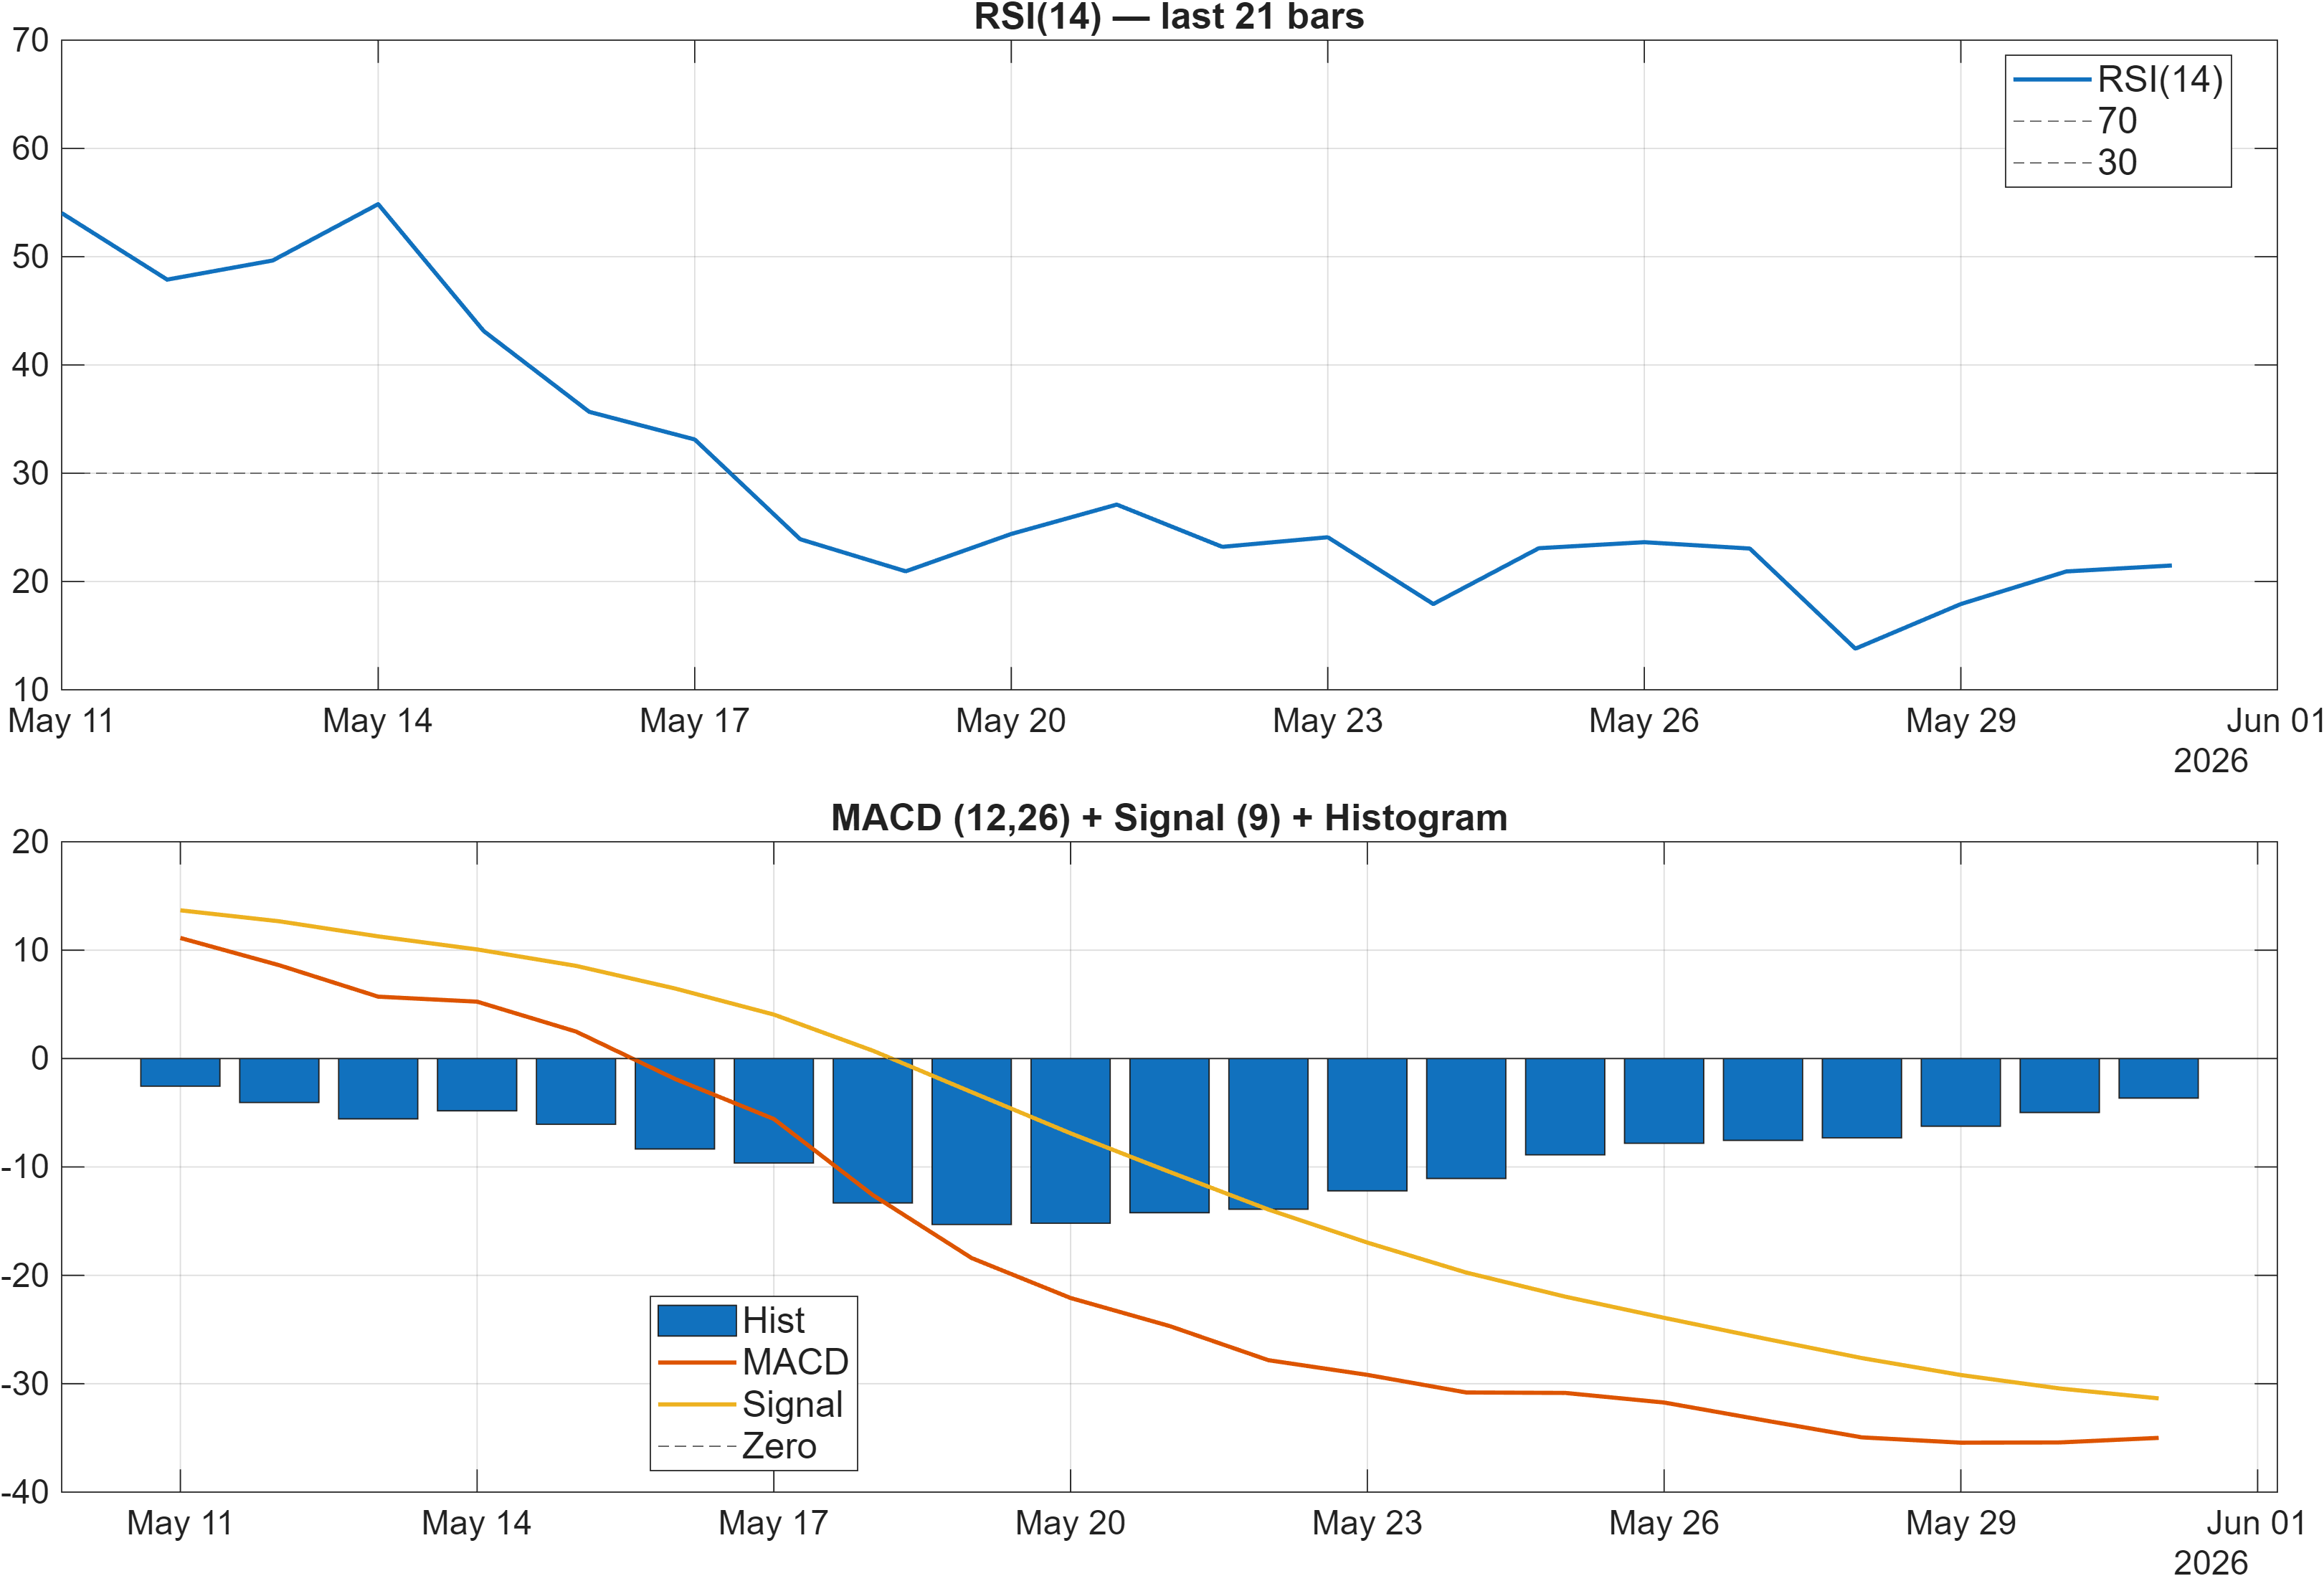
Interpretation: RSI bias = Bearish, MACD hist = -3.6449.
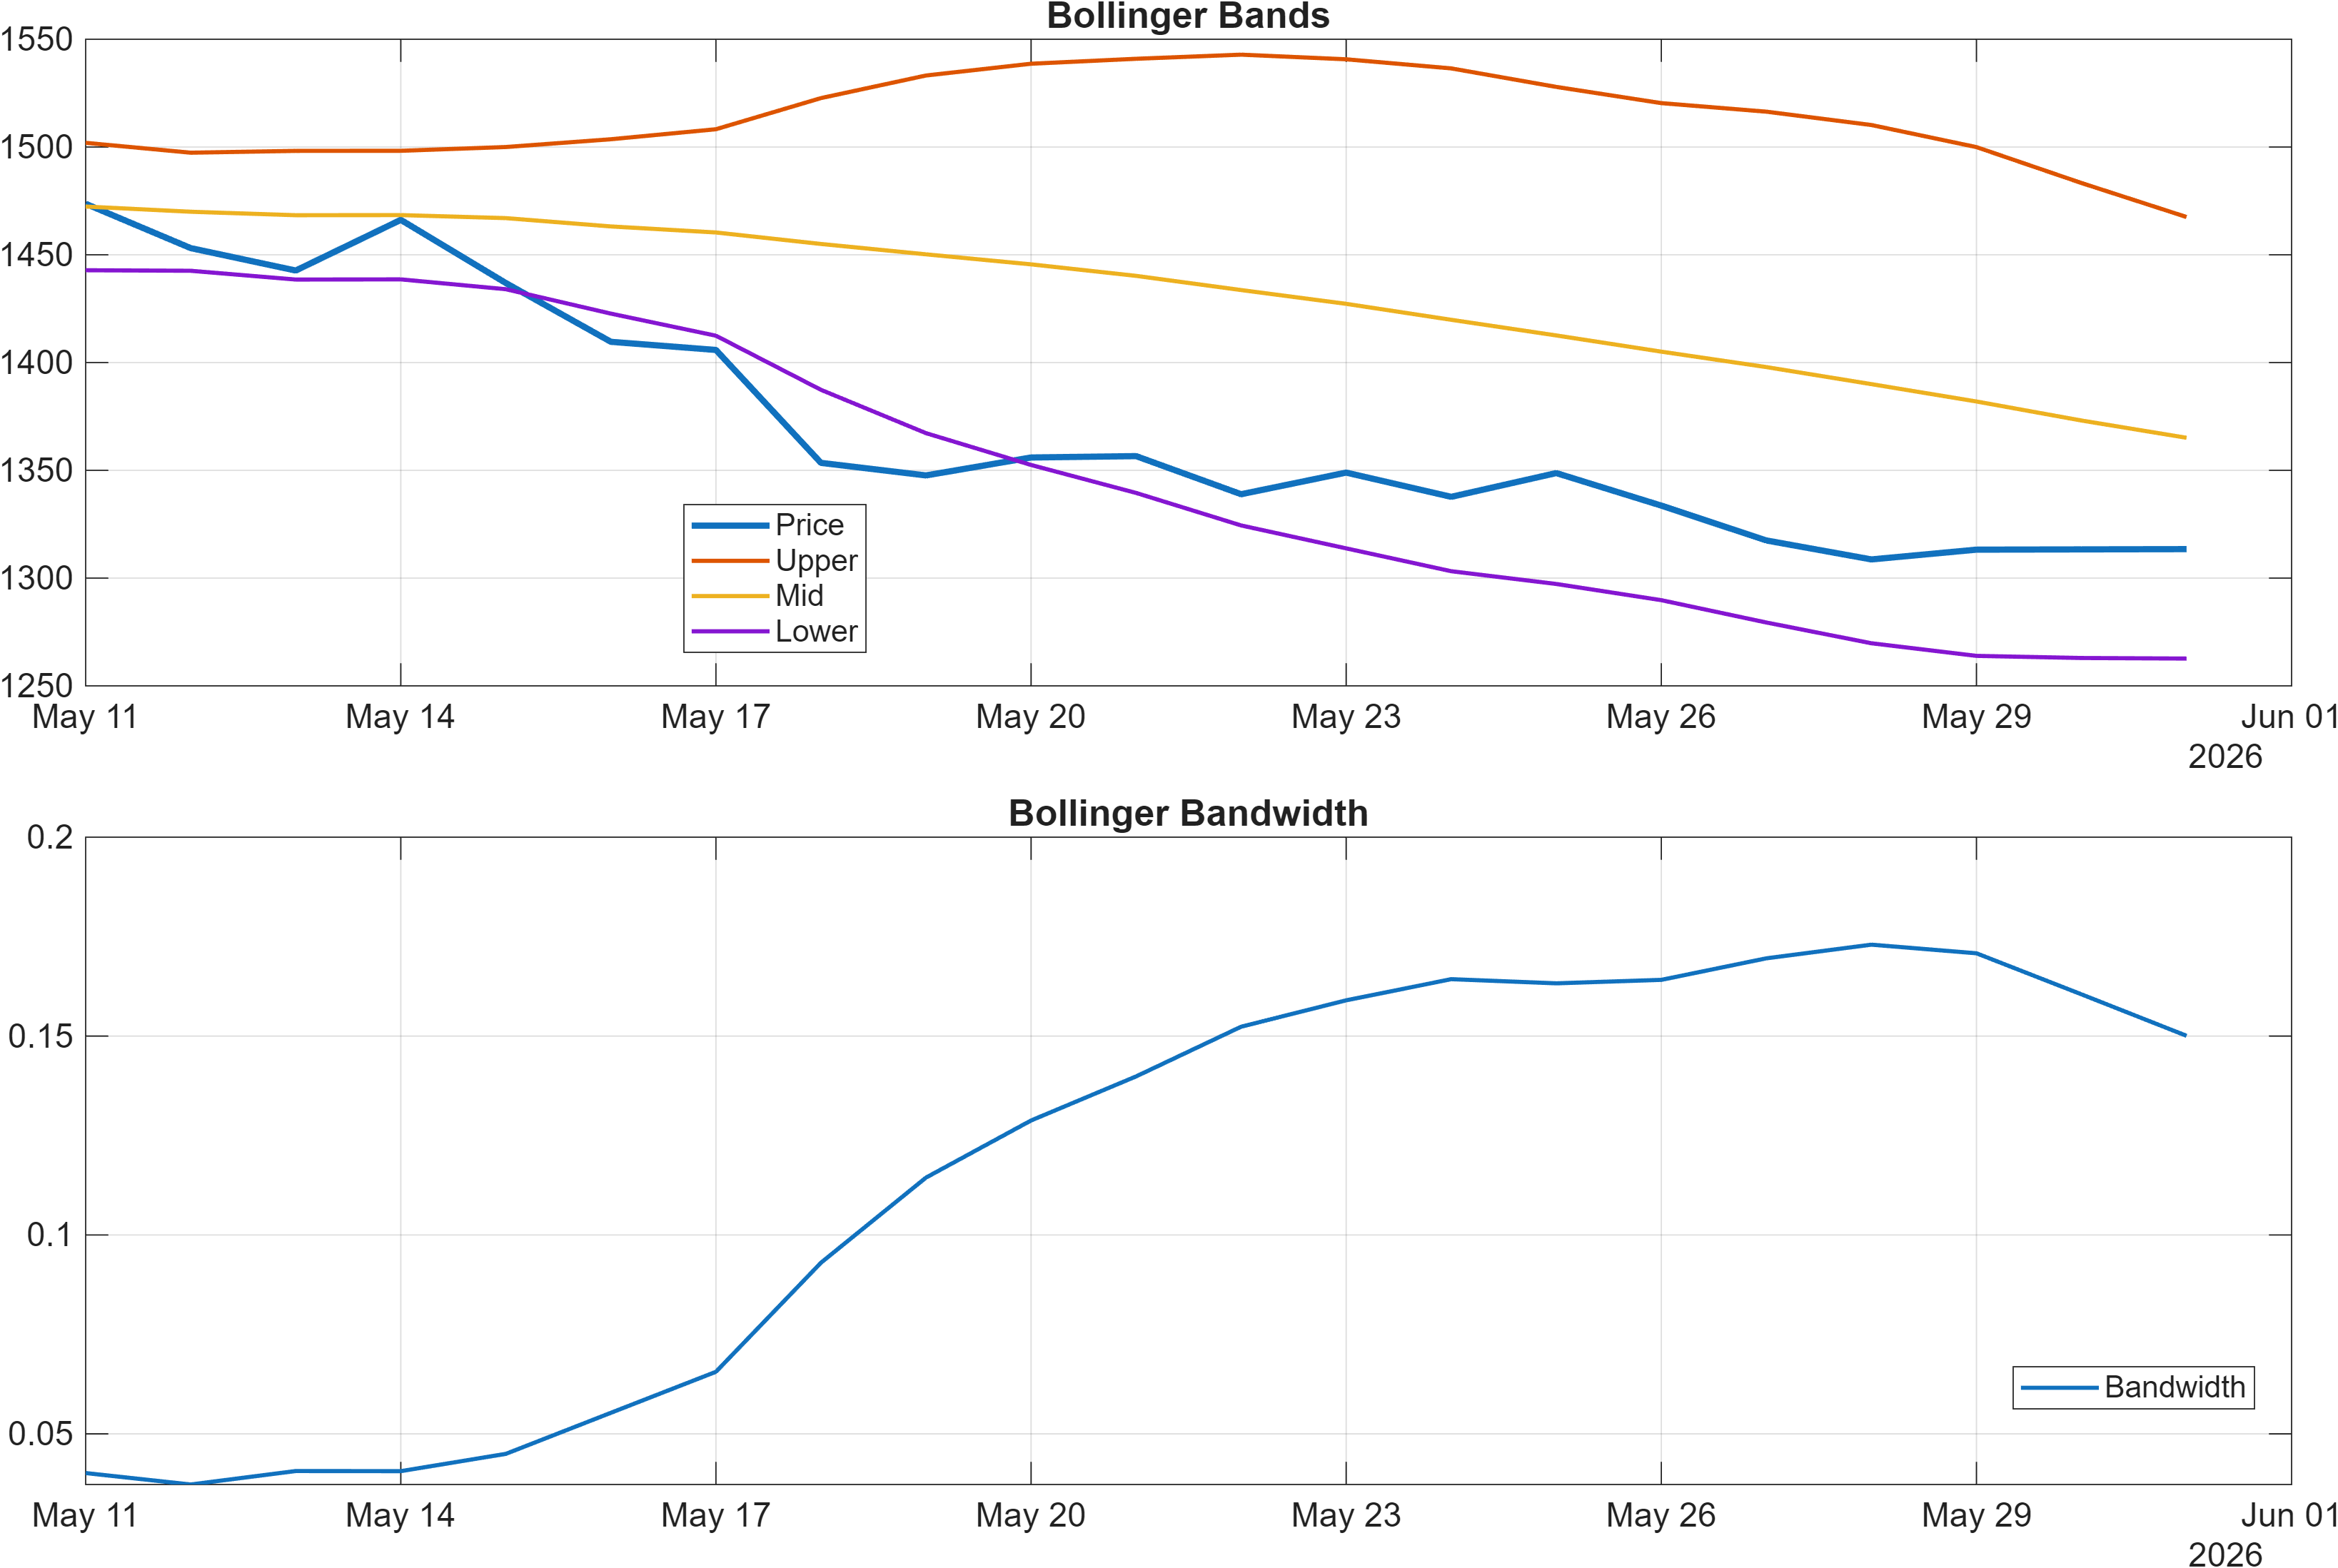
Interpretation: Bandwidth (volatility regime) latest = 0.1501.
Momentum stress: oversold conditions without reversal confirmation
Momentum is firmly risk-off in the immediate window. RSI(14) at 21.48 signals deeply weak conditions, while the MACD histogram at -3.6449 indicates bearish momentum persistence rather than a completed turn. Oversold readings can coincide with rebounds, but this dashboard does not yet show a definitive momentum inflection—meaning the probability of mean-reversion attempts may rise while the probability of sustained follow-through still depends on confirmation.
Volatility regime: compression that can amplify the next move
Bollinger bandwidth at 0.1501 sits in a relatively contained regime versus what typically accompanies strong breakouts or capitulation moves. When momentum is bearish but volatility is not expanding aggressively, the market can be in a controlled decline or a pause before repricing. This matters because volatility expansion tends to be directional: once bandwidth begins to widen, it often coincides with a decisive break from consolidation dynamics.
Cross-check against the signal set
The broader signal table supports the same message: ROC(20) is -9.611 (bearish), and trend-state measures (TS Mom(20) -139.9, TS Accel -118.1) remain negative. In contrast, some flow/accumulation elements are not uniformly bearish (ADOSC 69.03 is bullish and several slope metrics are neutral), suggesting momentum weakness may not be perfectly matched by distribution—another reason to demand a clear price/level confirmation before treating oversold as a durable bottom.
4) Support / Resistance zones
Support ~ 1317.0392 | Resistance ~ 1499.7398
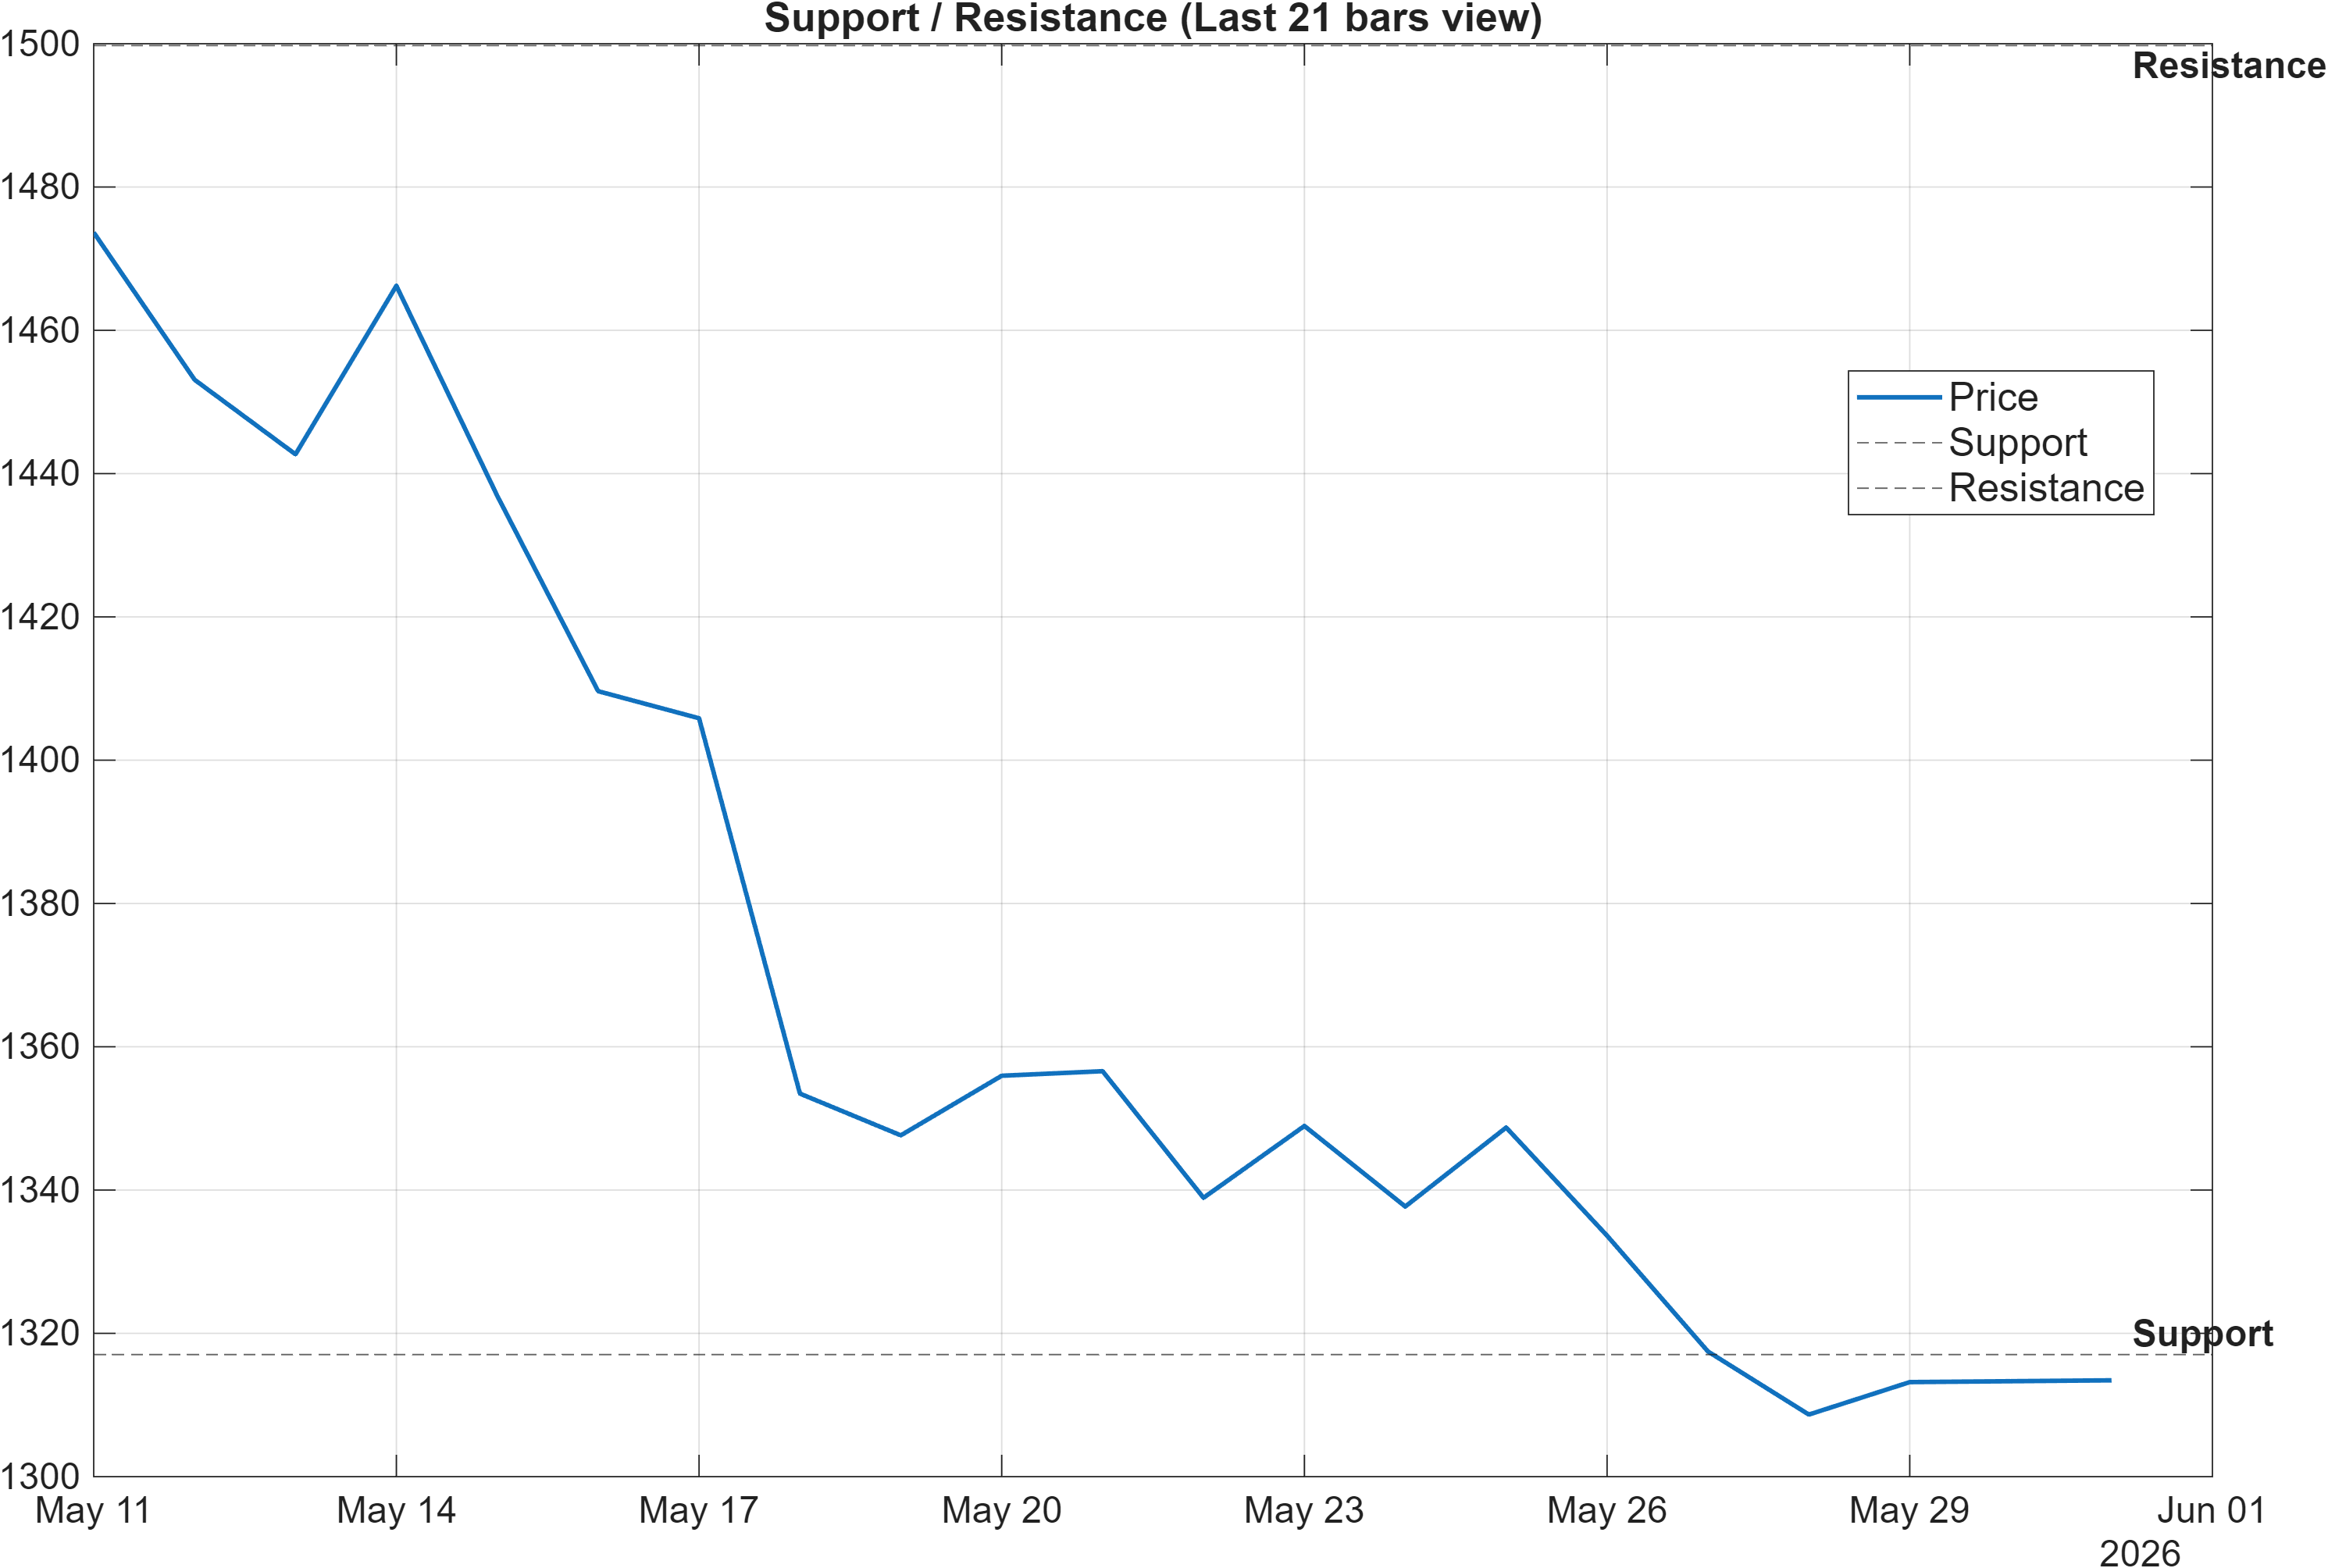
Scenario view: Break above resistance with volume → continuation. Close below support → signal deterioration risk.
Levels as decision zones: where regime clarity is most likely to emerge
With trend indicators split and momentum bearish, the 1317.0392–1499.7398 framework becomes the most actionable structure in the dataset. The support level near 1317.0392 is the line where tactical weakness risks graduating into broader deterioration. A close below that zone would align with the bearish momentum complex (RSI 21.48, MACD histogram -3.6449) and would be consistent with the overall bearish blended technical score (-0.328).
Resistance as the confirmation threshold (not a target)
Resistance near 1499.7398 is the threshold that can reconcile the current divergence: higher-timeframe ranks are bullish (monthly #60, 3-month #13), but short-term evidence remains constrained. A break above resistance “with volume,” per the scenario statement, would represent the cleanest confirmation that the longer-horizon rank strength is translating into price behavior, particularly if it is accompanied by improving momentum measures.
Range logic and signal interaction
Several table entries reinforce the idea of a bounded structure: HHIGH(20) is 1474 and LLOW(20) is 1296, bracketing the level map. Meanwhile, “MedPx vs Support” at -9.798 is bearish, highlighting that price behavior is currently uncomfortably close to the risk boundary. In this configuration, level interactions tend to matter more than marginal indicator shifts—because the next confirmed break often determines whether the market transitions back into continuation or into a deeper drawdown regime.
5) Quant Technical Dashboard (18 Signals)
KGNAI AI Technical Analysis Score (Deep Reinforcement Learning): Rank #474 out of 800 (Rank 1 represents the strongest technical positioning and a higher probability of favorable price behavior. As ranks increase toward the maximum, the probability of favorable outcomes weakens and bearish positioning becomes more dominant.) | Label: Neutral | Score: -0.185
18-Signal Technical Confluence Score: -0.389 (Bearish)
Overall Technical Score (18-signal confluence + DRL rank blend): -0.328 (Bearish)
Note: The blended score reflects signal strength weighted against broader AI technical ranking, which may temporarily diverge.
Blended technical score breakdown: -0.328 (Bearish | Bull 1 / Bear 8 / Neutral 9)
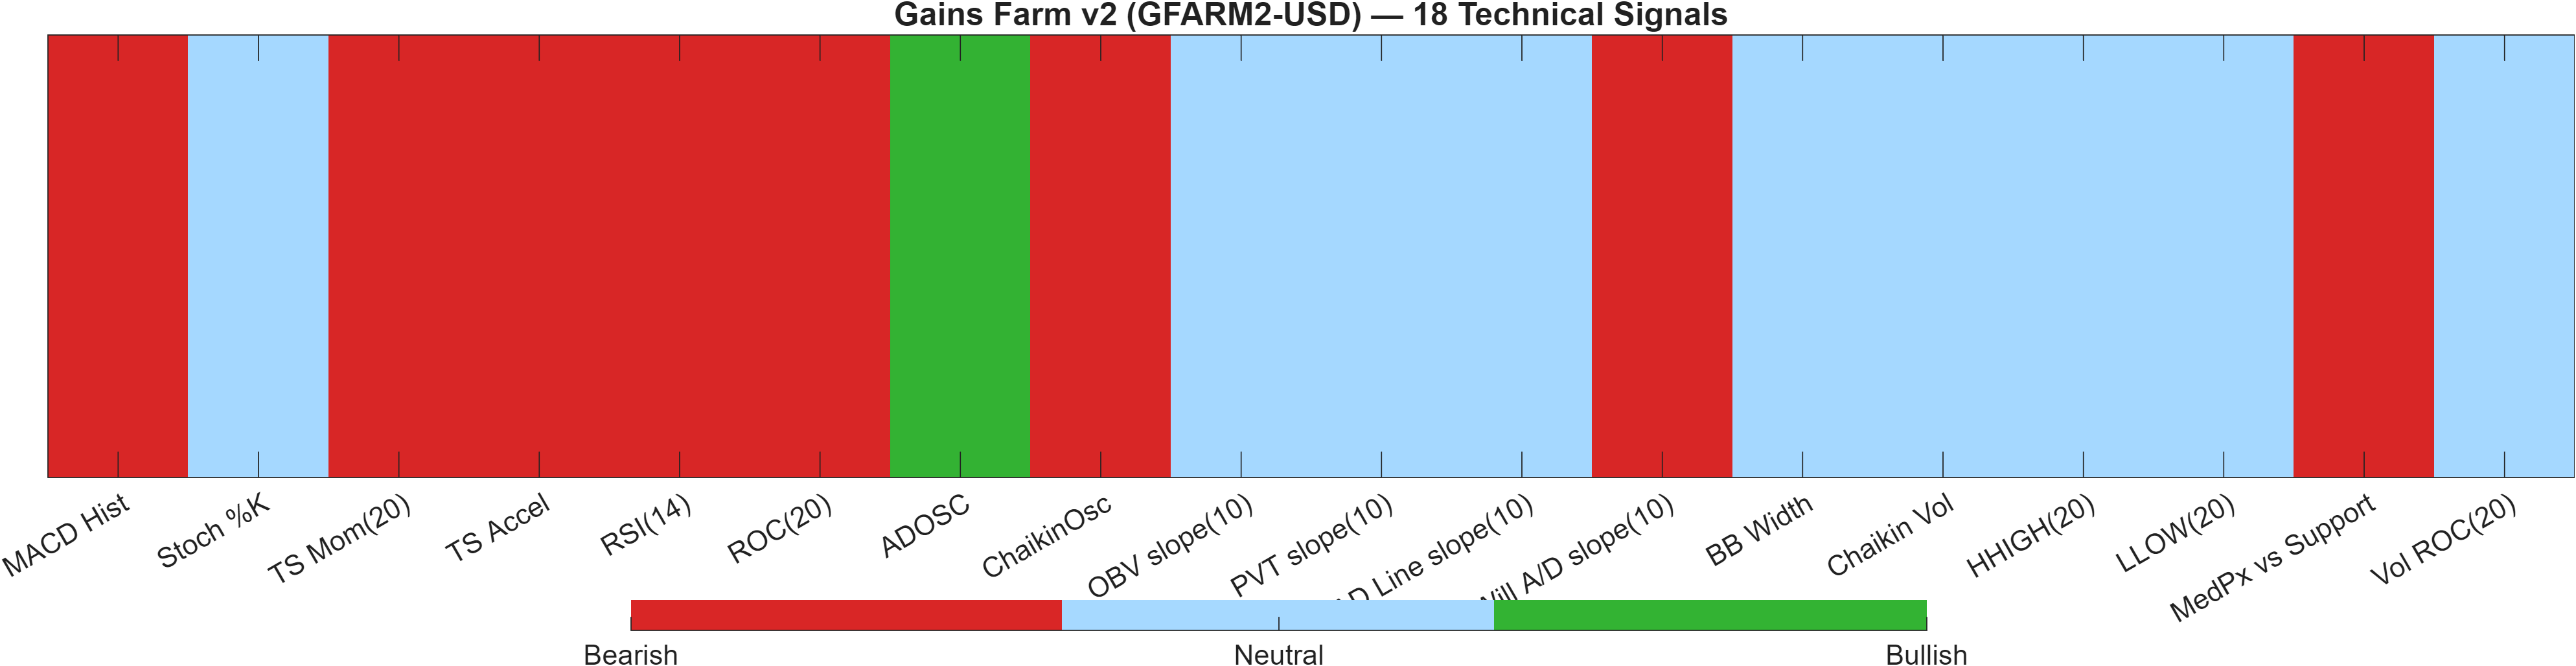
Signal table (Bull/Bear/Neutral)
| Indicator | Value | Signal |
|---|---|---|
| MACD Hist | -3.645 | Bearish |
| Stoch %K | 26.39 | Neutral |
| TS Mom(20) | -139.9 | Bearish |
| TS Accel | -118.1 | Bearish |
| RSI(14) | 21.48 | Bearish |
| ROC(20) | -9.611 | Bearish |
| ADOSC | 69.03 | Bullish |
| ChaikinOsc | -5.472 | Bearish |
| OBV slope(10) | 0 | Neutral |
| PVT slope(10) | 0 | Neutral |
| AD Line slope(10) | 0 | Neutral |
| Will A/D slope(10) | -24.8 | Bearish |
| BB Width | 0.1501 | Neutral |
| Chaikin Vol | -17.34 | Neutral |
| HHIGH(20) | 1474 | Neutral |
| LLOW(20) | 1296 | Neutral |
| MedPx vs Support | -9.798 | Bearish |
| Vol ROC(20) | — | Neutral |
Interpretation: Indicator-level signals form the base confluence, which is then adjusted using a separate AI-driven technical ranking model. The final technical score summarizes this combined view.
Confluence vs model rank: a controlled divergence
The dashboard is explicitly bearish on confluence: the 18-signal score is -0.389, and the blended overall technical score remains bearish at -0.328. Yet the DRL technical rank is labeled neutral at #474 with a score of -0.185. That spread suggests the reinforcement-learning layer is not as negative as the raw signal stack—often a sign that broader pattern context is less bearish than point-in-time oscillators.
Breadth of signals: bearish skew, but not a full cascade
The breakdown (Bull 1 / Bear 8 / Neutral 9) matters because it indicates dispersion rather than unanimity. The bearish cluster is concentrated in momentum and trend-change components (MACD histogram -3.645, RSI(14) 21.48, ROC(20) -9.611, TS Mom(20) -139.9, TS Accel -118.1), which typically dominate during drawdowns. Meanwhile, multiple volume/flow slopes are neutral (OBV slope(10) 0, PVT slope(10) 0, AD Line slope(10) 0), indicating the sell pressure is not being confirmed by a broad deterioration in every participation proxy in this snapshot.
What would reduce the bearish reading without adding new data
Given the existing indicators, improvement would most credibly show up as MACD histogram moving toward zero from -3.645 and RSI lifting from 21.48, alongside price behavior that respects support 1317.0392 and challenges resistance 1499.7398. Without that, the bearish confluence remains the higher-weight near-term signal even with longer-horizon ranks staying constructive.
6) News sentiment + extractive gist
Note: Instrument-specific news matches were not found, so the digest includes broader market/sector headlines. Links are provided for verification.
Sentiment score (avg): 0.000 | Positive: 12% | Neutral: 75% | Negative: 12%
KGNAI AI News Sentiment Score (normalized -1 to +1): Not available (as of —) | Label: Not available | Overall news score: 0.00
Positive Developments
Recent coverage across major financial outlets indicates a market narrative that remains open to constructive interpretations even amid choppy tape. Flows and positioning themes are being discussed in a way that can be read as contrarian-supportive when outflow or de-risking becomes extended, potentially setting the stage for reflexive rebounds. In parallel, ongoing regulatory attention is being framed not only as constraint but also as a mechanism that can clarify operating boundaries over time—an angle that can reduce uncertainty for some participants, even if implementation is uneven. For GFARM2-USD, the most relevant takeaway is not a token-specific catalyst (not available in the provided data), but the idea that broader crypto risk appetite can oscillate quickly. With ranks remaining constructive on the 3-month window (#13) while technicals are bearish (-0.328 blended score), a supportive macro-news tone could become the marginal ingredient that helps price challenge the 1499.7398 resistance zone.
Neutral / Mixed Developments
The dominant news tone is neutral in the dataset (75% neutral; sentiment average 0.000), which aligns with a market that is processing cross-currents rather than reacting to a single decisive catalyst. Policy and legislative discussions continue to create episodic volatility, but the directionality is often ambiguous—headlines can be interpreted as either incremental clarity or added friction depending on timing and implementation. The absence of instrument-specific matches also limits granularity: the news layer provides context for sector beta rather than a direct driver of GFARM2-USD idiosyncratic price behavior. In this environment, technical levels—support at 1317.0392 and resistance at 1499.7398—tend to matter more than narrative shifts unless the narrative produces measurable participation changes.
Negative / Risk Signals
Risk coverage remains focused on enforcement actions, fraud cases, and macro/market-function concerns—factors that can tighten liquidity conditions and increase risk premia across crypto assets. These themes often amplify sensitivity to technical deterioration: when market participants see higher perceived operational or regulatory risk, they tend to demand stronger technical confirmation before re-engaging. That matters here because the technical stack is already soft (RSI(14) 21.48, MACD histogram -3.6449, 18-signal confluence -0.389), leaving less buffer against headline-driven drawdowns. With a symmetric sentiment distribution (12% positive vs 12% negative), the news layer does not currently provide a supportive skew that would offset weak momentum. As a result, downside narrative shocks would most likely express through whether price holds the 1317.0392 support zone.
- Whether broad crypto risk tone shifts from neutral (75%) toward a clear positive or negative skew.
- Any liquidity/flow narrative that coincides with a resistance test near 1499.7398.
- Escalation in enforcement/fraud themes alongside a support test near 1317.0392.
Sources referenced: Reuters, Bloomberg, Yahoo Finance, MarketWatch, Investing.com
Snapshot: AI Rank (Short–Mid–Long): Mixed (Bullish tilt) (Neutral–Bullish–Bullish) · Technical Confluence: Bearish · Key Levels: Support ~1317.04 | Resistance ~1499.74 · News Sentiment: Neutral
7) Sources
- Bitcoin is at ‘pivotal level’ as $65K downside risk looms: Analyst — https://cointelegraph.com/news/bitcoin-is-at-pivotal-level-and-faces-threat-to-65k-analyst?utm_source=rss_feed&utm_medium=rss&utm_campaign=rss_partner_inbound
- Senator Lummis says China will 'write the rules' of the new financial era if CLARITY fails — https://cointelegraph.com/news/senator-lummis-says-china-will-beat-the-us-to-the-punch-if-clarity-is-not-passed?utm_source=rss_feed&utm_medium=rss&utm_campaign=rss_partner_inbound
- Circle freezes $12.6M of USDC linked to privacy protocol Zama — https://cointelegraph.com/news/circle-freezes-126m-of-usdc-linked-to-privacy-protocol-zama?utm_source=rss_feed&utm_medium=rss&utm_campaign=rss_partner_inbound
- SEC charges Texas man with $12.3M crypto fraud using fake AI trading bots — https://cointelegraph.com/news/sec-charges-texas-man-with-123m-crypto-fraud-fake-ai-trading-bots?utm_source=rss_feed&utm_medium=rss&utm_campaign=rss_partner_inbound
- Here’s what happened in crypto today — https://cointelegraph.com/news/what-happened-in-crypto-today?utm_source=rss_feed&utm_medium=rss&utm_campaign=rss_partner_inbound
- Spot Bitcoin ETFs see record 10-day outflow streak, analyst calls it ‘contrarian indicator’ — https://cointelegraph.com/news/spot-bitcoin-etfs-see-record-10-day-outflow-streak-analyst-calls-it-contrarian-indicator?utm_source=rss_feed&utm_medium=rss&utm_campaign=rss_partner_inbound
- Bitcoin treasury space still has fair share of ‘carnival barkers’: BSTR founder — https://cointelegraph.com/news/bitcoin-treasury-space-still-has-fair-share-of-carnival-barkers-bstr-founder?utm_source=rss_feed&utm_medium=rss&utm_campaign=rss_partner_inbound
- US has seized nearly $1 billion in Iranian crypto, Treasury secretary says — https://cointelegraph.com/news/us-has-seized-nearly-1-billion-in-iranian-crypto-treasury-secretary-says?utm_source=rss_feed&utm_medium=rss&utm_campaign=rss_partner_inbound
You may also like: How KGNAI AI ranks instruments across global markets
Disclaimer: KGNAI provides AI-generated analytics and educational market commentary only. This is not financial advice. Markets involve risk. Always do your own research.