QNT-USD (Quant) — 05-Jun-2026 Technicals Bearish Despite Bullish Mid-to-Long Rank Tilt
Quant (QNT-USD) presents a split-profile setup as of 05-Jun-2026: mid-to-long horizon KGNAI ranks lean constructive while near-term technicals remain pressured. Within an 800-instrument crypto universe, the monthly rank sits in the upper tier at #46, with the 3-month rank also supportive at #80, suggesting comparatively stronger positioning on broader horizons. In contrast, the daily view is more equivocal at #401, aligning with a bearish technical stack that includes RSI(14) at 30.6 and a MACD histogram of -0.5268. Volatility context is moderate rather than extreme, with Bollinger Bandwidth at 0.1739, leaving room for either stabilization or renewed directional expansion. Key decision zones remain clearly defined: support near 68.3858 and resistance near 80.1447. News sentiment is mechanically Neutral in the provided dataset, offering limited directional bias.
Key Takeaways
- Rank stance: Short-term Neutral | Mid-term Bullish | Long-term Bullish
- Technical confluence: Bearish (18-signal and blended scores remain negative)
- Key levels: Support 68.3858 | Resistance 80.1447
- News sentiment bias: Neutral (avg 0.000; 100% neutral in provided data)
- Confirmation / invalidation: A break above 80.1447 with volume supports continuation; a close below 68.3858 increases deterioration risk per the scenario framework.
What KGNAI Measures
KGNAI evaluates assets using large cross-sectional datasets built from millions of structured data points. Inputs incorporate fundamental metrics, technical structures, and systematically processed news sentiment. Statistical models, machine learning, and AI frameworks are used to assess relative positioning, signal alignment, and probabilistic behavior across broad universes.
How to Read This Report
- Ranks are comparative across the tracked universe, not absolute price targets.
- Confluence reflects alignment among independent signal groups.
- Support/resistance levels are probabilistic decision zones, not guarantees.
- Sentiment provides contextual bias within the broader analytical framework.
1) KGNAI AI Analysis
Region: CRYPTO
Total universe size: 800 ranked instruments
- Daily rank: #401 out of 800 — Neutral
- Weekly rank: #197 out of 800 — Neutral
- Monthly rank: #46 out of 800 — Bullish
- 3-Monthly rank: #80 out of 800 — Bullish
Cross-horizon ranking is the main signal tension in QNT-USD. The monthly rank (#46) places QNT in the upper portion of the 800-instrument universe, while the 3-month rank (#80) remains similarly constructive, consistent with a stronger comparative profile when noise is smoothed. However, the daily rank (#401) sits near the middle of the universe and reads Neutral, suggesting that the recent tape has not yet validated the longer-horizon strength.
The weekly rank (#197) acts as a bridge between these regimes: it is better than the daily view but still categorized as neutral. This “neutral-short / bullish-mid-to-long” profile often appears when a market is attempting to transition from drawdown repair into trend rebuilding, but the transition is not confirmed by shorter-term participation and momentum.
KGNAI treats rank movements as relative probability shifts rather than directional guarantees; the practical implication here is to separate horizon intent. If an investor is aligning with the mid-to-long bullish tilt, the expectation should be that confirmation arrives through improving shorter-horizon ranks and technical alignment, not solely from the monthly/3-month placement. Conversely, if shorter-term weakness persists, the longer-horizon advantage may remain latent rather than actionable.
Term view: Short-term: Neutral. Mid-term: Bullish. Long-term: Bullish.
Want the full universe and complete rank tables? Unlock full access on KGNAI: https://www.kgnai.com/pricing
2) Price & trend overview
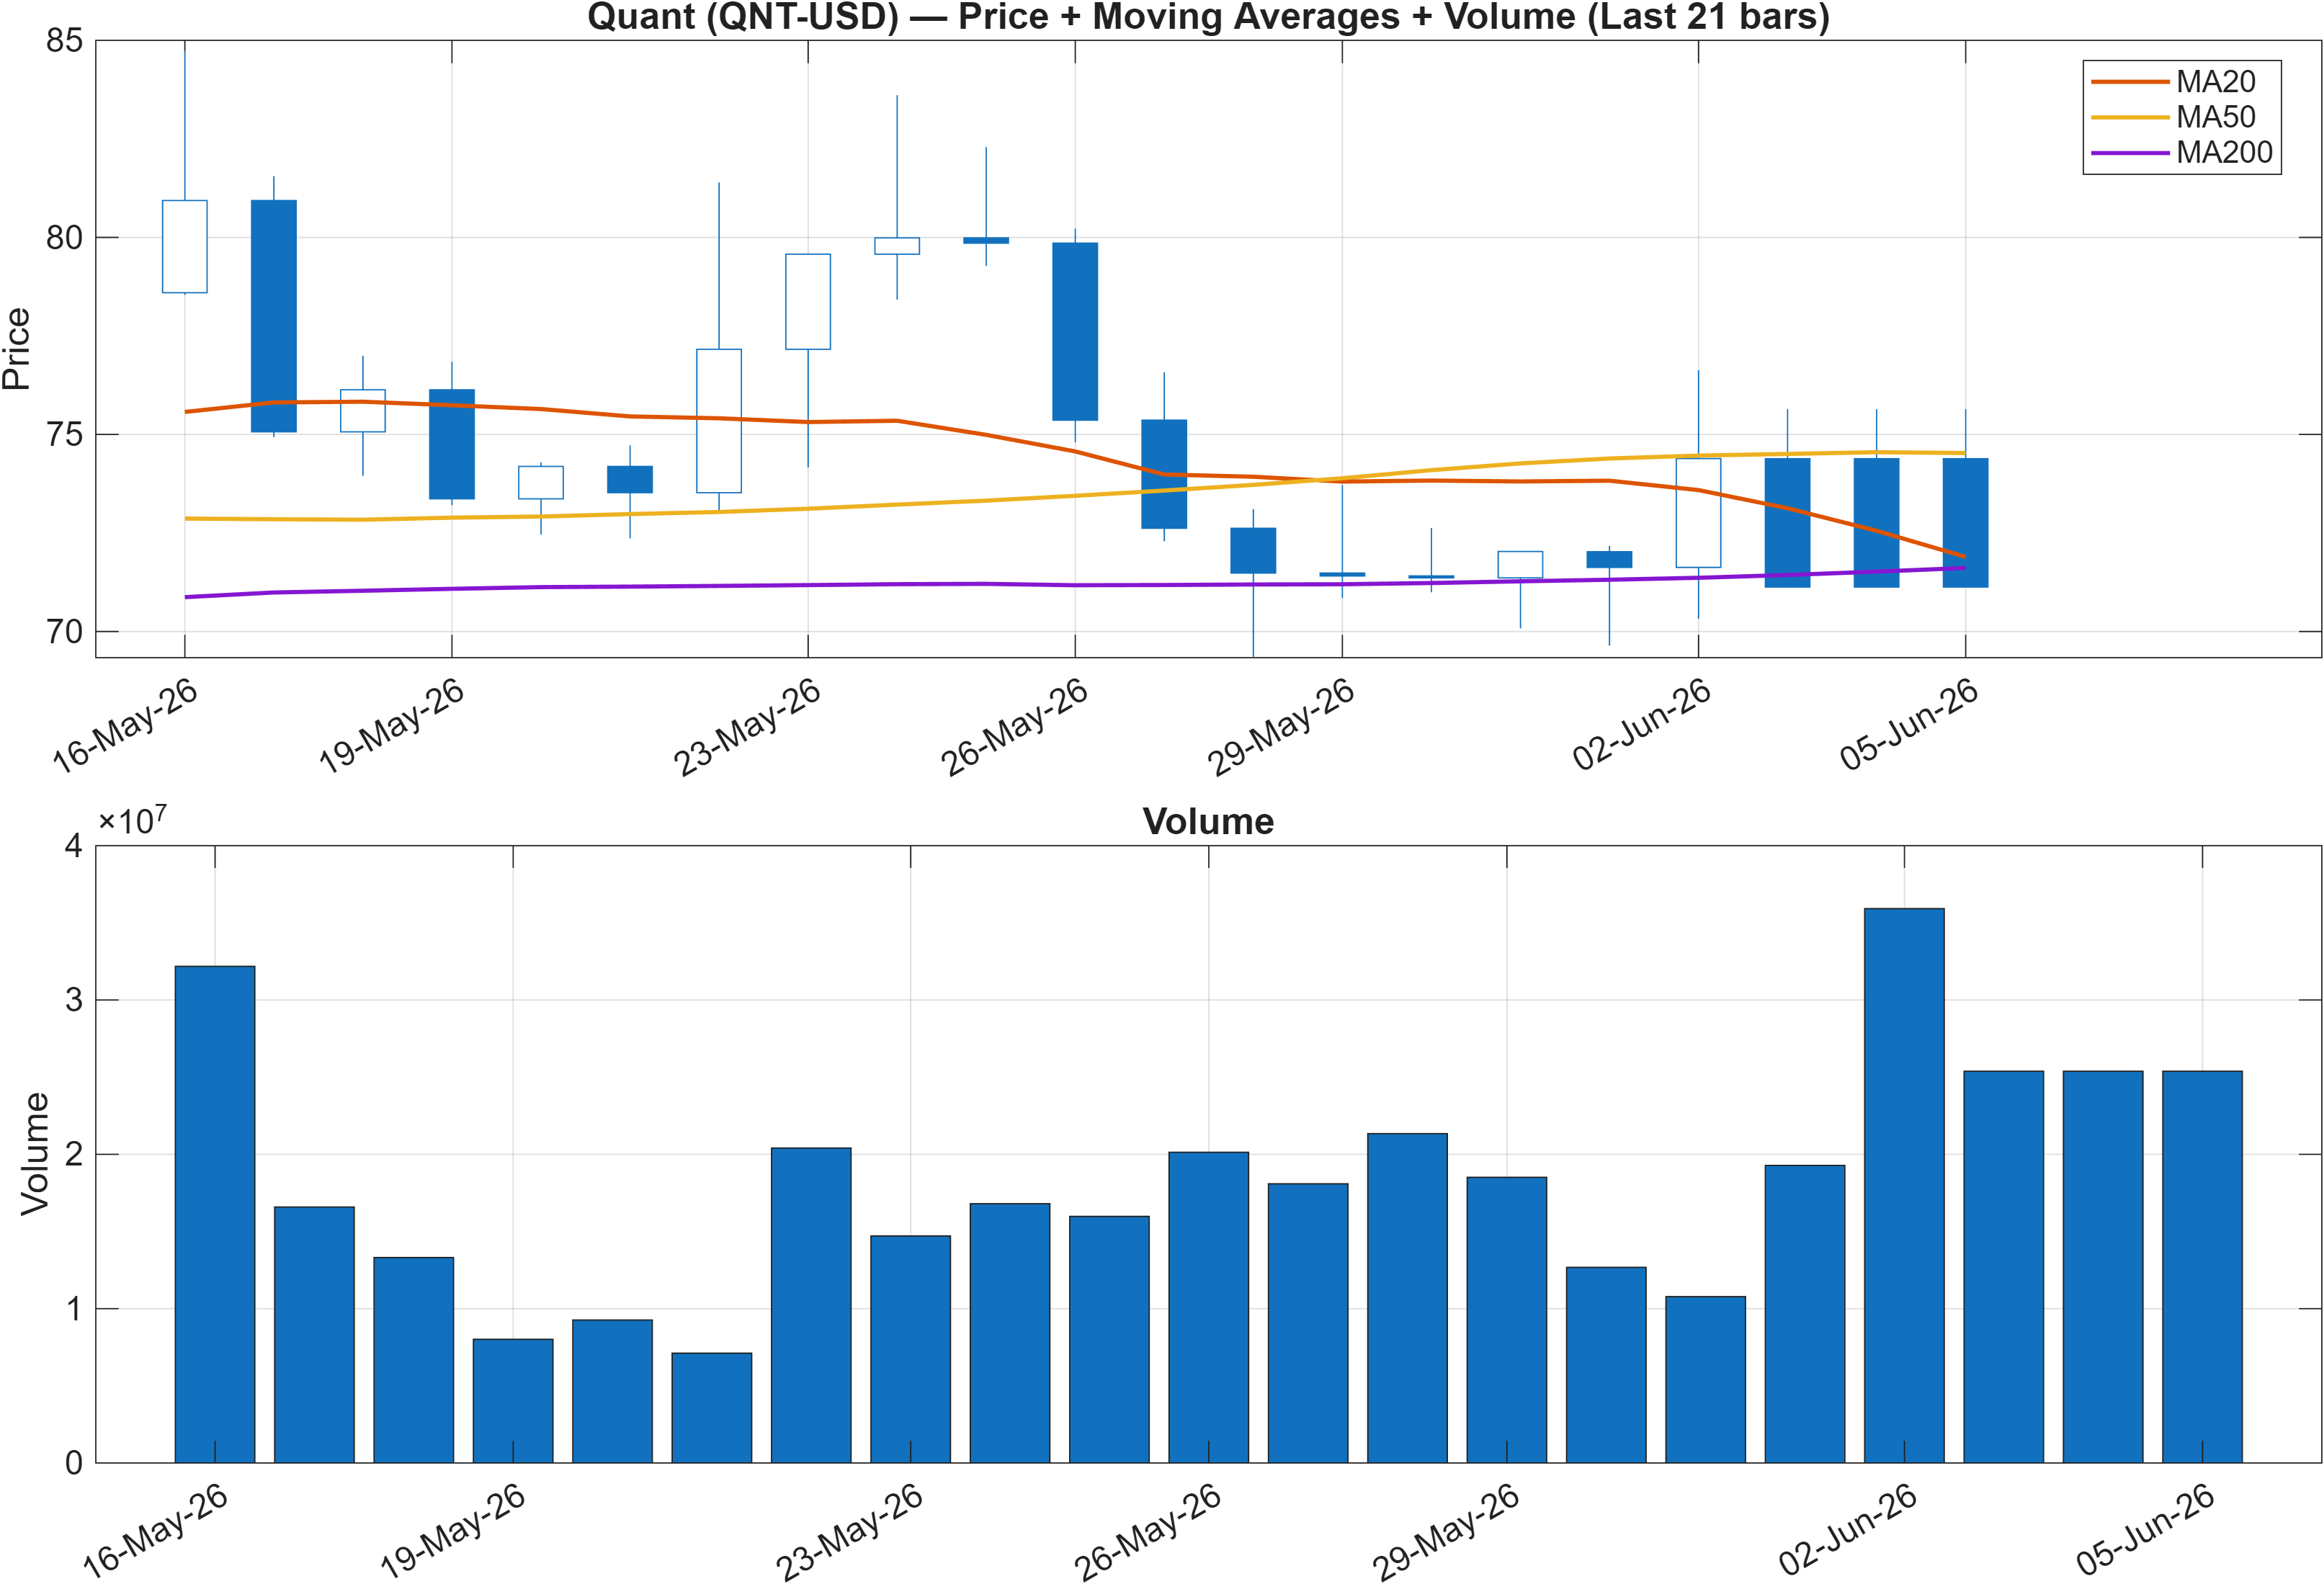
Interpretation: Close vs MA50 = Bearish, MA50 vs MA200 = Bullish.
The moving-average structure communicates a “two-speed” trend state. The close versus MA50 is flagged as Bearish, indicating nearer-term trend pressure and limited follow-through from recent bounces. At the same time, MA50 versus MA200 remains Bullish, a configuration that can be consistent with longer-horizon trend integrity even while price is undergoing consolidation or retracement.
This divergence matters because it frames whether weakness is best interpreted as a pullback within a broader structure or the start of a deeper regime change. The rank stack supports the former on higher horizons (#46 monthly, #80 3-month), but the near-term metrics lean cautious (daily rank #401). In such states, continuation typically requires the tape to re-assert itself via improved momentum and more consistent closes relative to the shorter moving average.
The decision zones later in the report help anchor the trend discussion. A market trading below a key trend filter (here, the MA50 relationship) becomes more sensitive to support validation. With support at 68.3858 and resistance at 80.1447, the trend debate is effectively a range-resolution question: holding the lower zone keeps the longer-horizon bullish structure plausible; reclaiming the upper zone increases the odds that the bearish close-vs-MA50 condition is temporary rather than persistent.
3) Momentum & volatility dashboard
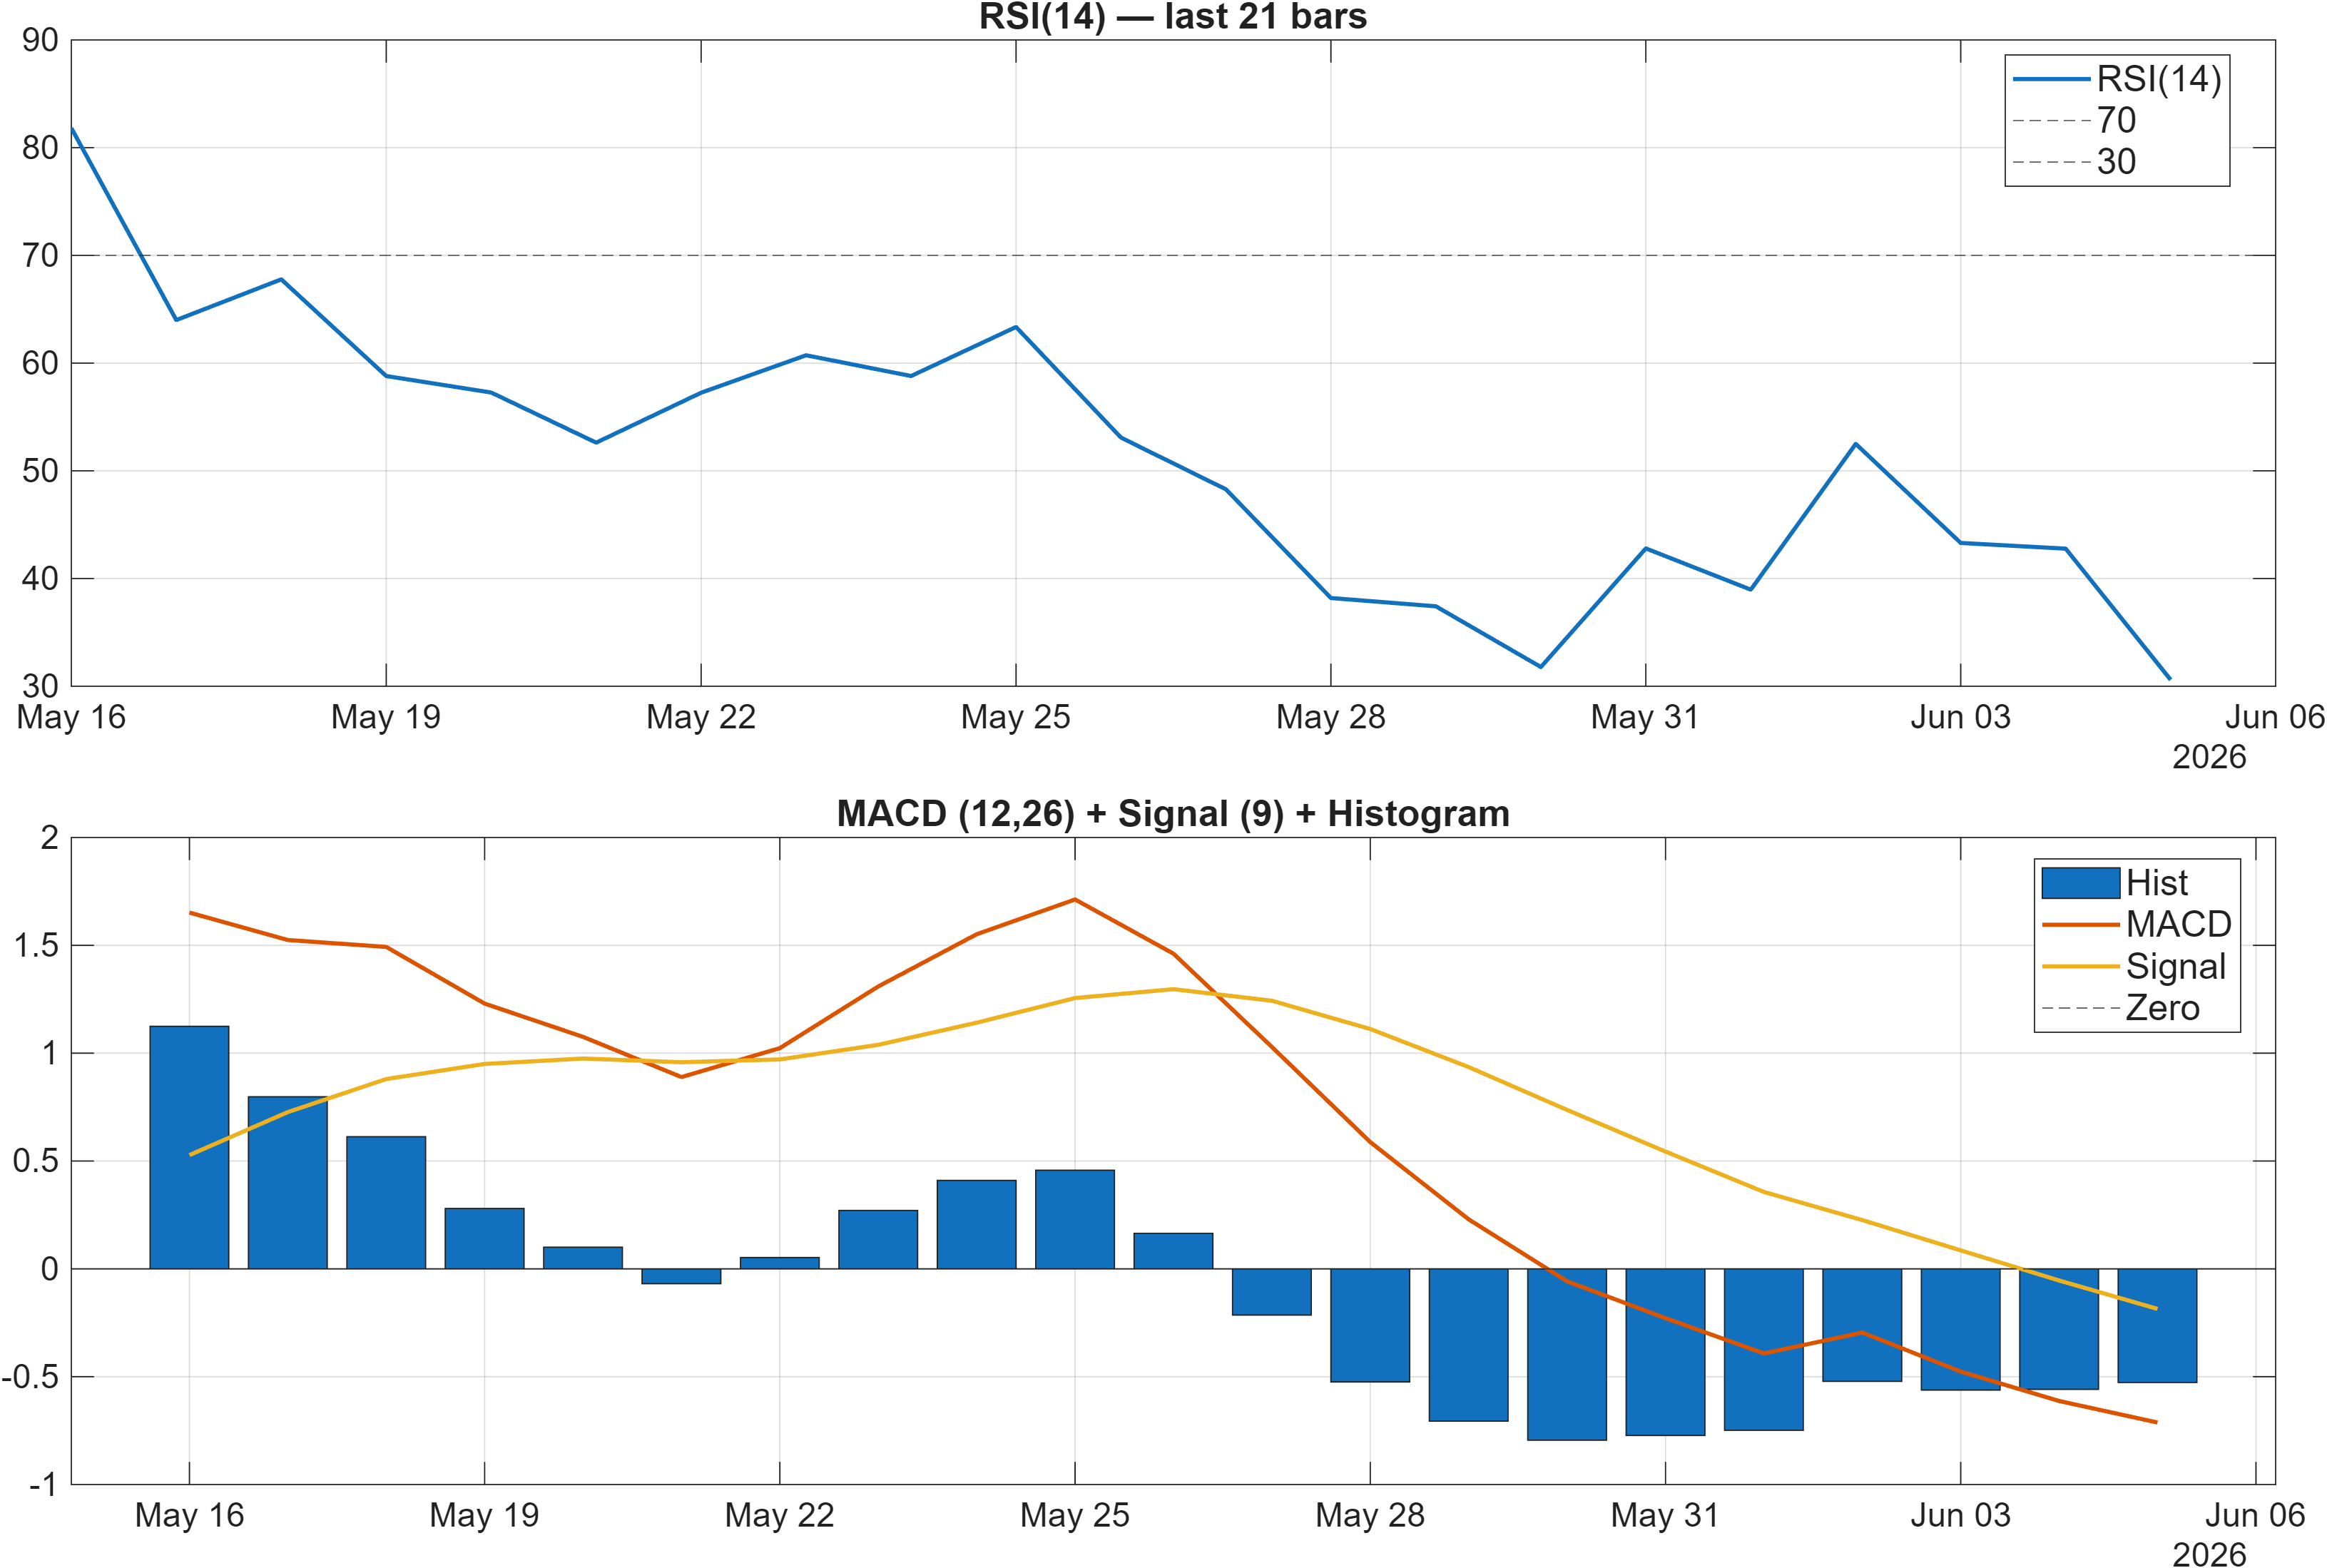
Interpretation: RSI bias = Bearish, MACD hist = -0.5268.
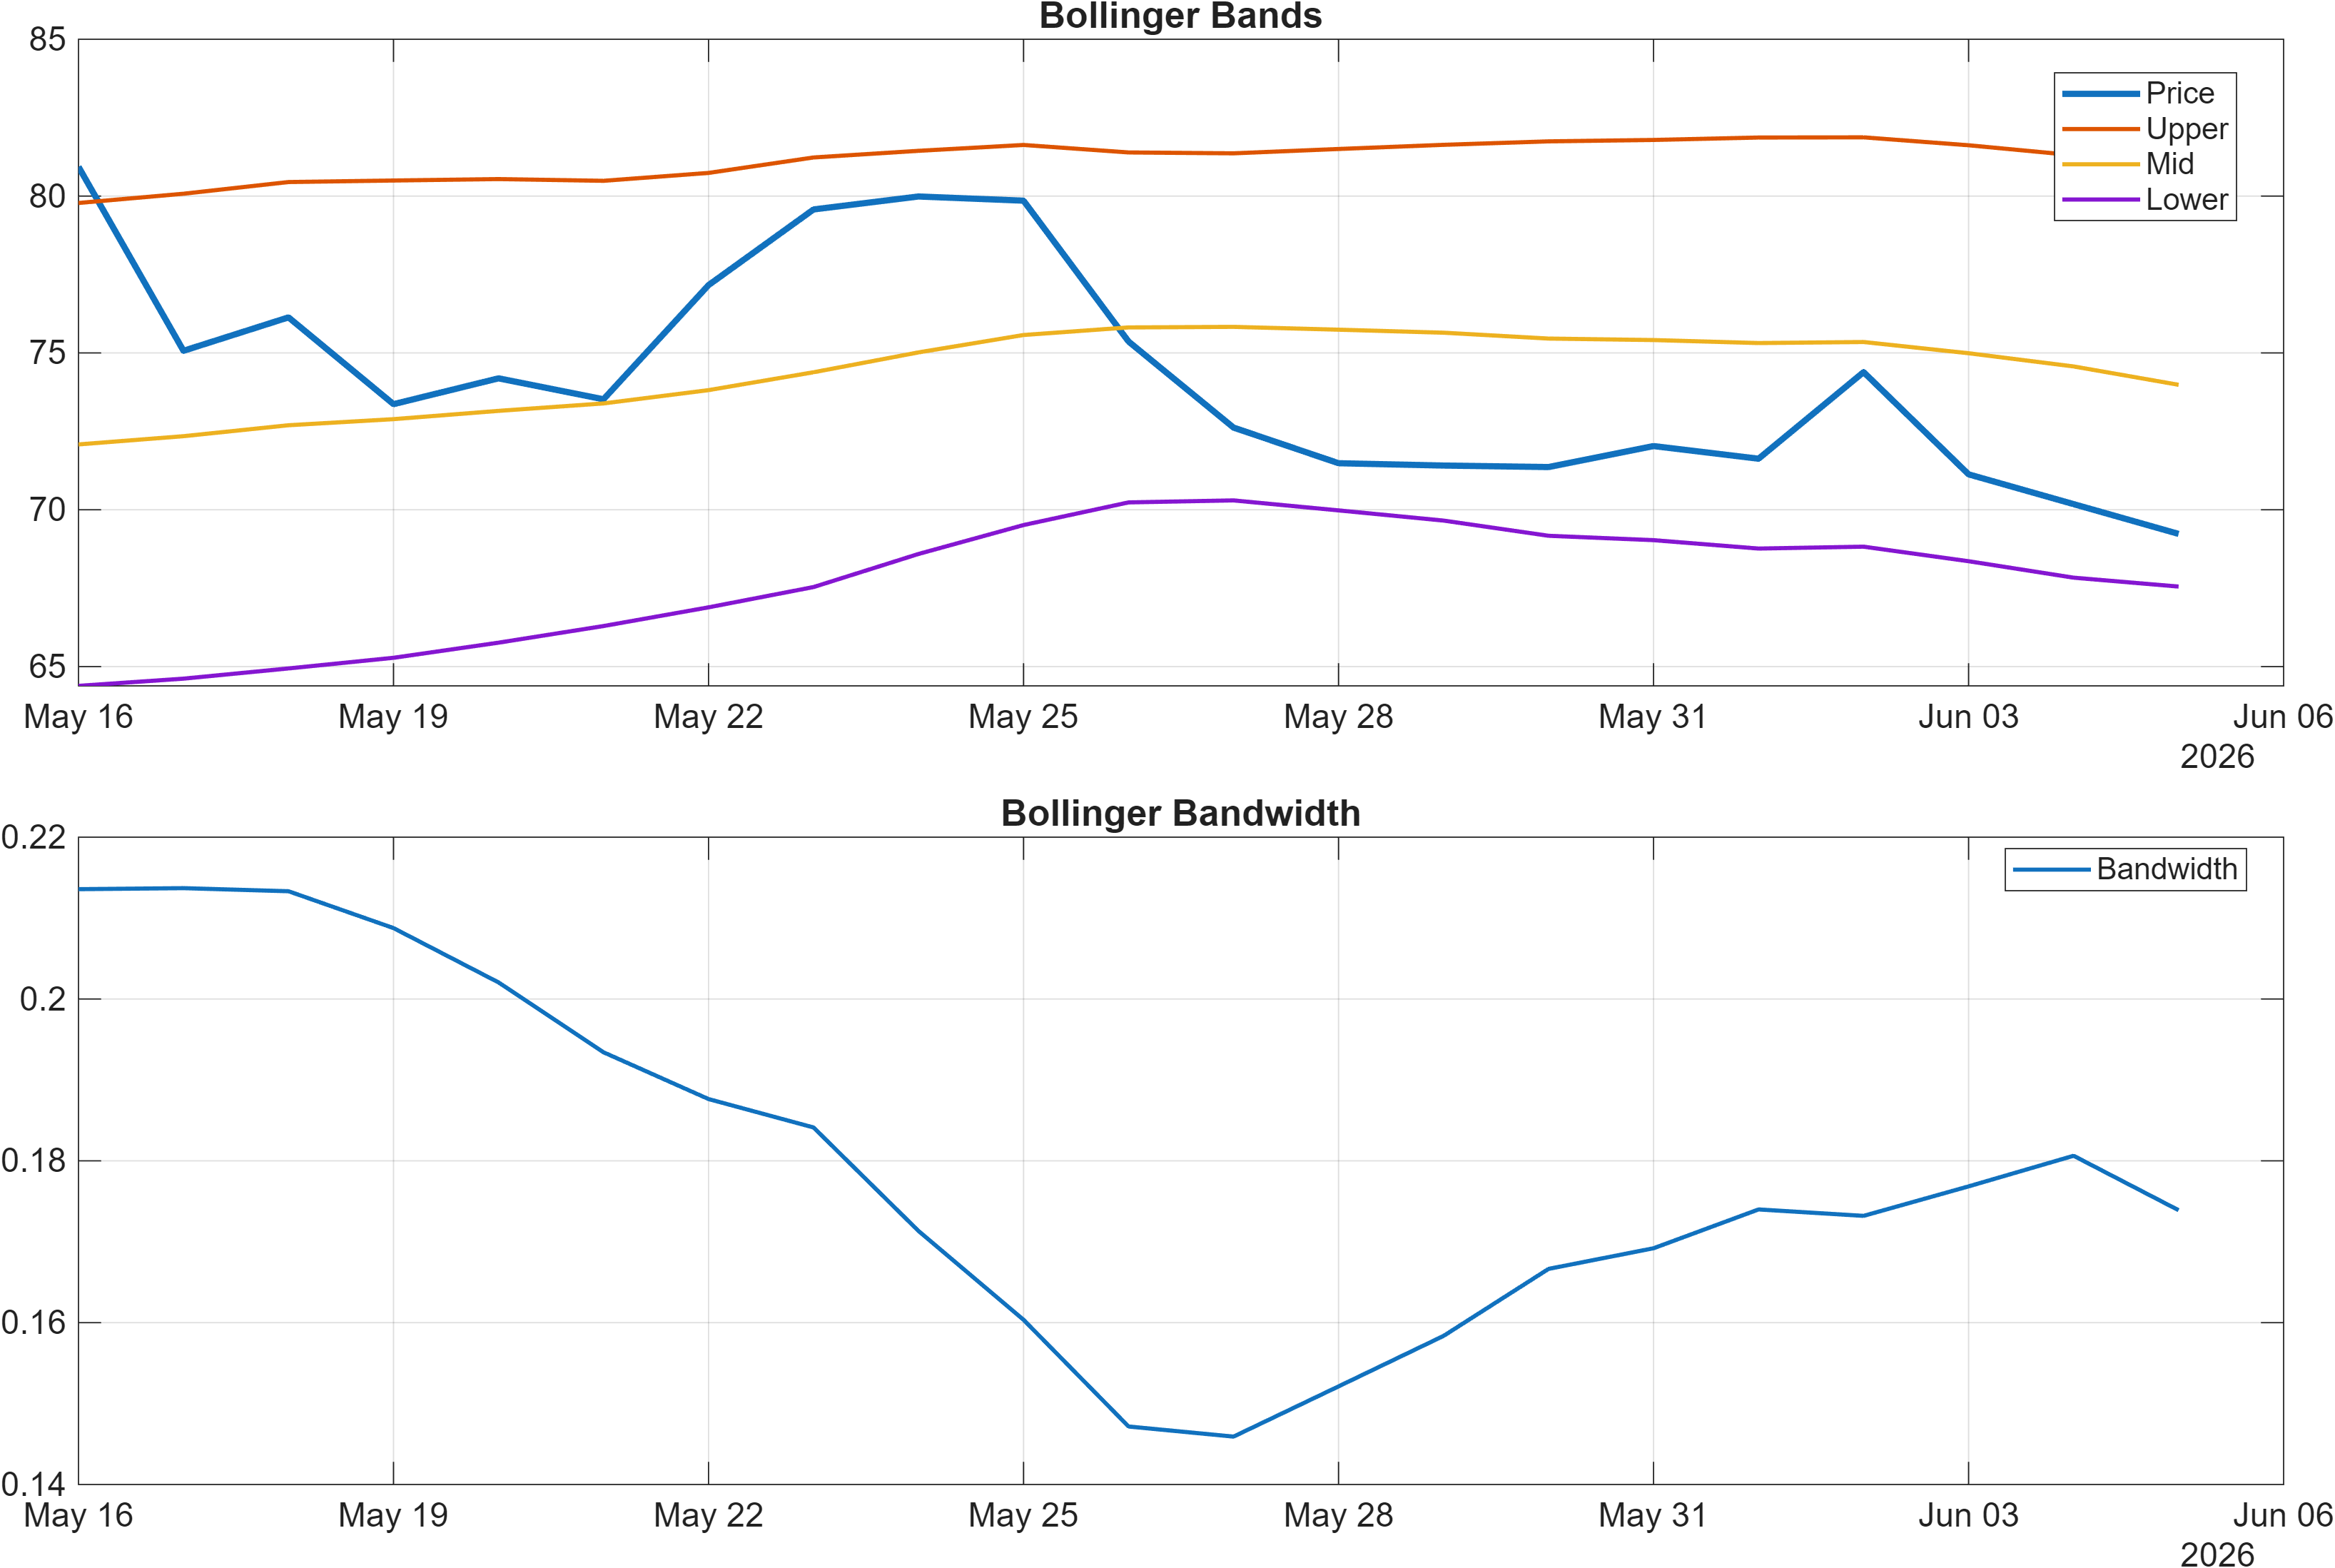
Interpretation: Bandwidth (volatility regime) latest = 0.1739.
Momentum is presently the constraint on the bullish mid-to-long rank narrative. The RSI(14) at 30.6 is tagged Bearish, placing QNT near the zone that often coincides with drawdown persistence unless buyers re-engage. In parallel, the MACD histogram of -0.5268 is also bearish, reinforcing that downside momentum has not yet meaningfully decelerated in the indicator set used here.
Volatility context is more nuanced. Bollinger Bandwidth at 0.1739 signals a moderate regime rather than an outright volatility squeeze or a fully expanded “panic” condition. This reduces confidence in interpreting the RSI reading as a completed exhaustion signal on its own; instead, it suggests momentum can remain negative without an immediate volatility-driven reversal.
The dashboard also implies a sequencing issue: for the longer-horizon ranks (#46 and #80) to translate into sustained price behavior, the short-horizon momentum complex typically needs to improve first. In practice, that would show up as a less negative MACD histogram and RSI recovering from the low 30s toward a more neutral posture. Until then, rebounds may remain tactical rather than trend-confirming, and the resistance band near 80.1447 becomes an important test for whether upside attempts are absorbing supply or stalling below prior decision points.
4) Support / Resistance zones
Support ~ 68.3858 | Resistance ~ 80.1447
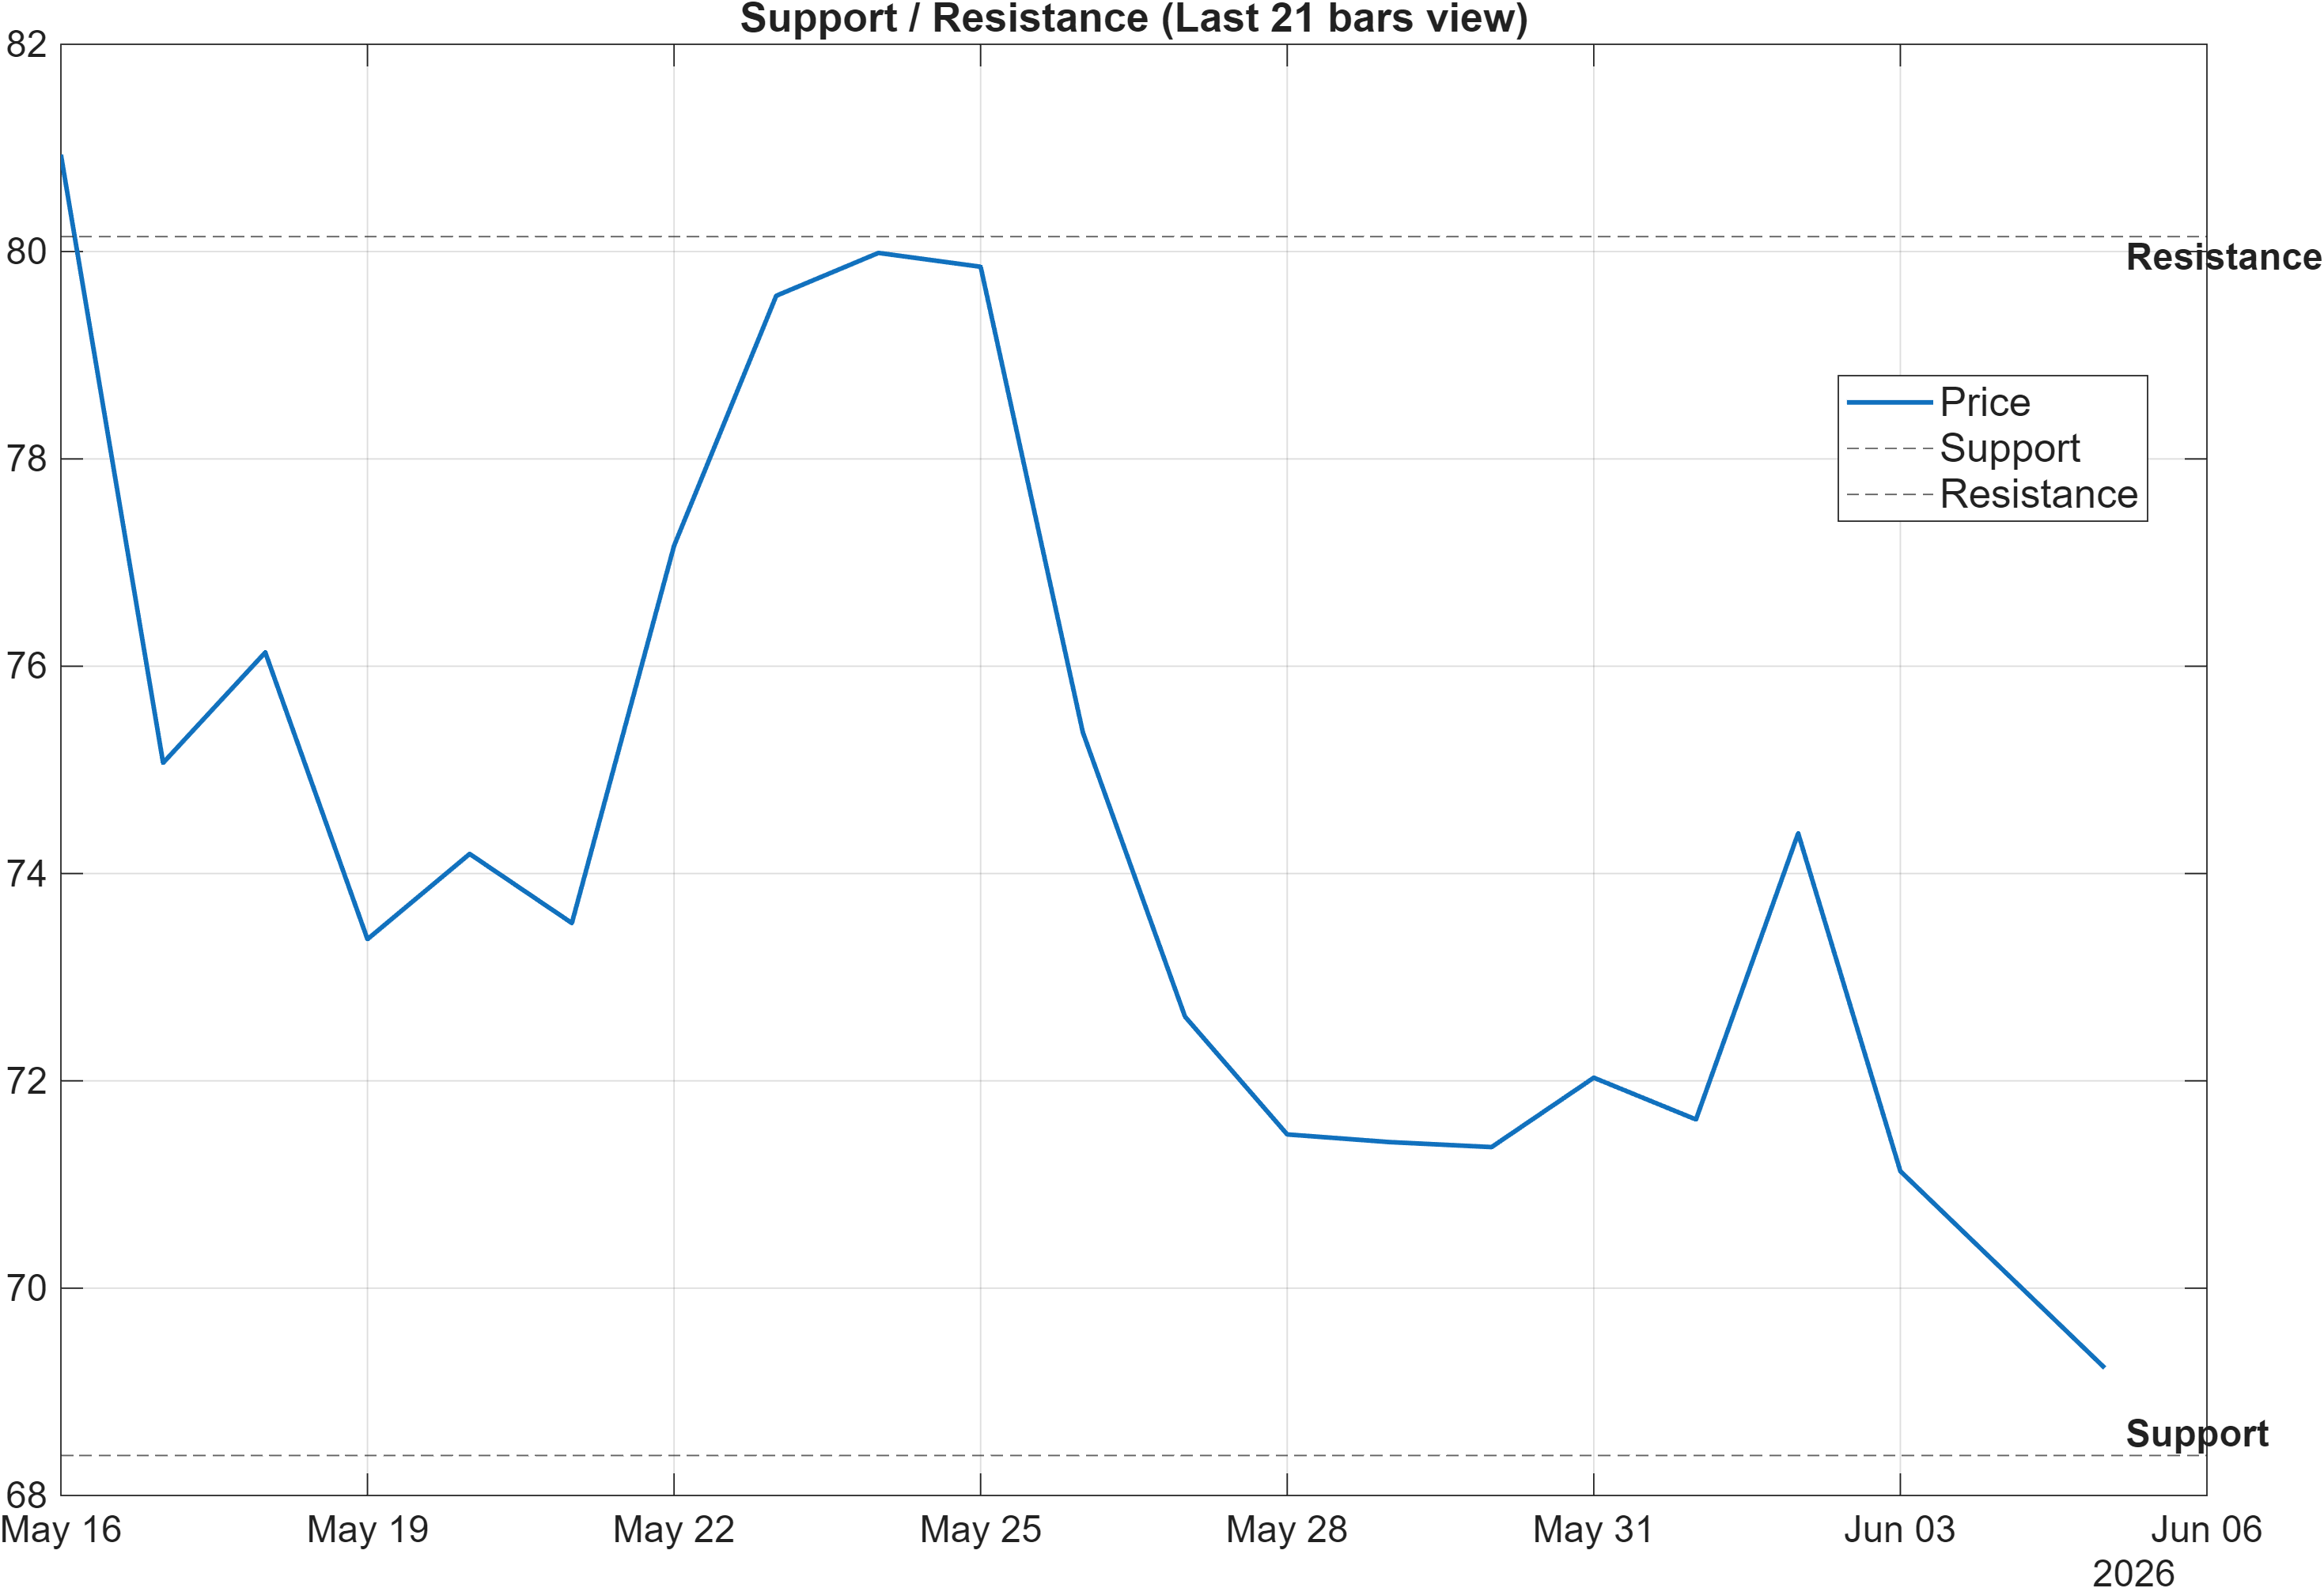
Scenario view: Break above resistance with volume → continuation. Close below support → signal deterioration risk.
The level map is tight enough to function as a clean risk framework. With support at 68.3858 and resistance at 80.1447, QNT is effectively framed by a defined range where the next durable signal likely comes from acceptance beyond one boundary rather than incremental oscillations inside it.
The bearish momentum posture (for example, RSI(14) 30.6 and MACD hist -0.5268) makes the lower boundary especially relevant: supports tend to be tested more frequently when short-term impulse remains negative. A sustained hold above 68.3858 helps keep the mid-to-long bullish rank tilt (monthly #46, 3-month #80) consistent with a “pullback within broader strength” interpretation. Conversely, a close below that support aligns with the scenario’s “deterioration risk,” and would also be directionally consistent with the weak blended technical scoring discussed later.
On the upside, 80.1447 is not simply a number to watch; it is the level where the market must demonstrate that demand can overwhelm the selling pressure implied by the current bearish technical confluence. The scenario explicitly emphasizes “break above resistance with volume,” which is a practical filter to reduce false breaks, particularly in a moderate volatility regime (bandwidth 0.1739) where moves can stall without follow-through.
Structurally, these zones also operate as confirmation gates between horizons: a resistance break would better align the neutral daily/weekly ranks (#401 and #197) with the bullish monthly/3-month profile, while a support failure would deepen the existing divergence.
5) Quant Technical Dashboard (18 Signals)
KGNAI AI Technical Analysis Score (Deep Reinforcement Learning): Rank #781 out of 800 (Rank 1 represents the strongest technical positioning and a higher probability of favorable price behavior. As ranks increase toward the maximum, the probability of favorable outcomes weakens and bearish positioning becomes more dominant.) | Label: Bearish | Score: -0.952
18-Signal Technical Confluence Score: -0.389 (Bearish)
Overall Technical Score (18-signal confluence + DRL rank blend): -0.558 (Bearish)
Note: The blended score reflects signal strength weighted against broader AI technical ranking, which may temporarily diverge.
Blended technical score breakdown: -0.558 (Bearish | Bull 3 / Bear 10 / Neutral 5)
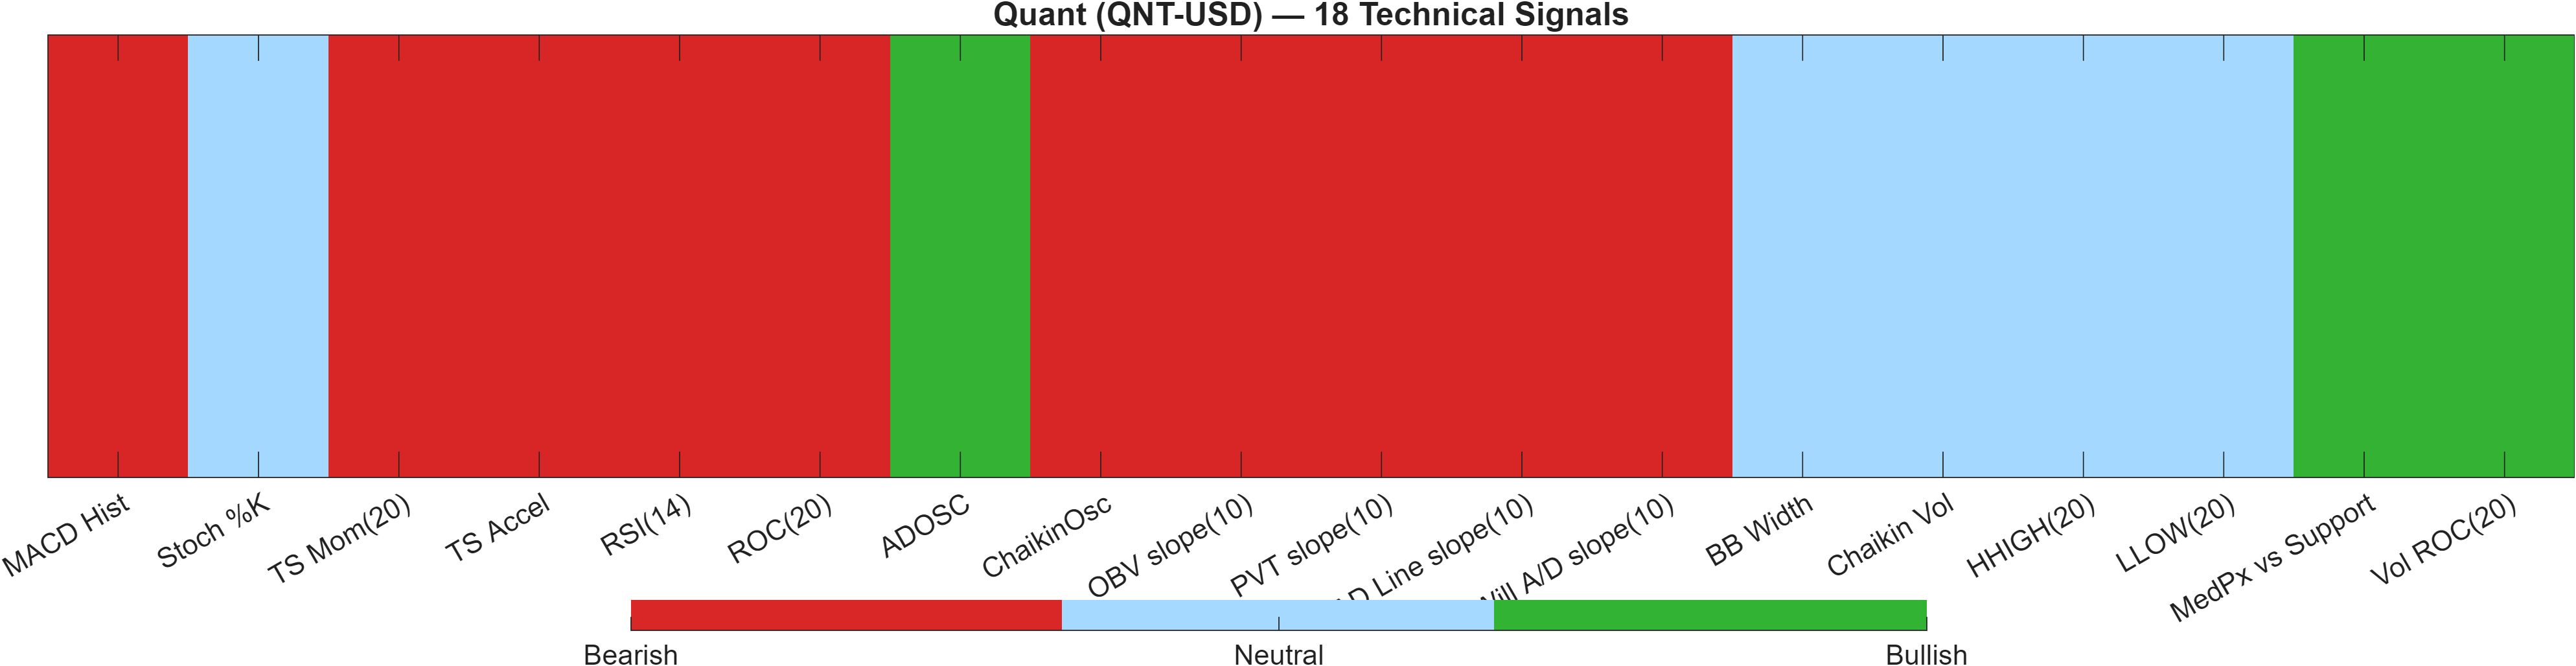
The technical dashboard consolidates the near-term caution into a single message: bearish signal dominance despite supportive mid-to-long ranks. The Deep Reinforcement Learning technical rank at #781 out of 800 sits in the lowest tier of the universe and carries a Bearish label with a score of -0.952. That reading is consistent with a market where pattern/structure features remain unfavorable relative to peers, even if longer-horizon ranks indicate potential improvement over time.
The 18-signal layer also leans negative: the confluence score (-0.389) and the overall blended technical score (-0.558) are both bearish. The distribution (Bull 3 / Bear 10 / Neutral 5) suggests breadth of weakness rather than a single-indicator anomaly. This is important because it reduces the odds that one “fix” (for example, a small RSI bounce) meaningfully changes the overall technical posture without broader participation.
Select indicator readings illustrate the mechanism. RSI(14) at 30.6 and MACD hist -0.5268 are both bearish, aligning with the momentum discussion. At the same time, there are pockets of constructive behavior—ADOSC at 13.93 is bullish in the table, indicating some accumulation-style characteristics even while price momentum is weak. This kind of internal conflict can occur during basing attempts, but it is not confirmation by itself.
The key analytical takeaway is alignment: the technical stack is currently more consistent with the neutral daily rank (#401) than with the bullish monthly rank (#46). A durable shift would usually require the blended technical score to improve alongside a reclaim of resistance near 80.1447.
Signal table (Bull/Bear/Neutral)
| Indicator | Value | Signal |
|---|---|---|
| MACD Hist | -0.5268 | Bearish |
| Stoch %K | 24.58 | Neutral |
| TS Mom(20) | -3.939 | Bearish |
| TS Accel | -9.854 | Bearish |
| RSI(14) | 30.6 | Bearish |
| ROC(20) | -7.776 | Bearish |
| ADOSC | 13.93 | Bullish |
| ChaikinOsc | -2.628e+07 | Bearish |
| OBV slope(10) | -6.858e+07 | Bearish |
| PVT slope(10) | -7.546e+05 | Bearish |
| AD Line slope(10) | -7.455e+07 | Bearish |
| Will A/D slope(10) | -8.196 | Bearish |
| BB Width | 0.1739 | Neutral |
| Chaikin Vol | -9.009 | Neutral |
| HHIGH(20) | 83.61 | Neutral |
| LLOW(20) | 69.34 | Neutral |
| MedPx vs Support | 4.999 | Bullish |
| Vol ROC(20) | 53.03 | Bullish |
Interpretation: Indicator-level signals form the base confluence, which is then adjusted using a separate AI-driven technical ranking model. The final technical score summarizes this combined view.
6) News sentiment + extractive gist
Sentiment score (avg): 0.000 | Positive: 0% | Neutral: 100% | Negative: 0%
KGNAI AI News Sentiment Score (normalized -1 to +1): Not available (as of —) | Label: Not available | Overall news score: 0.00
Positive Developments
Recent coverage across major financial outlets indicates limited directional skew in the captured dataset, yet the underlying narrative tone can still influence attention and liquidity conditions. In the provided feed, the content centers on “QNT” as a trading symbol in a context that is not clearly connected to QNT-USD’s crypto market structure, which can nonetheless generate occasional search and social spillover. When attention rises without a corresponding change in technical posture, the primary “positive” effect tends to be awareness and incremental participation, rather than a durable catalyst. For QNT-USD specifically, any constructive impact would be better confirmed by market-based measures already present in this report—such as improving momentum from RSI(14) 30.6 and a less negative MACD histogram (-0.5268)—and by price behavior relative to 80.1447. In short, the dataset does not provide a strong bullish news impulse, but it does suggest conditions where attention could matter if technical confirmation appears.
Neutral / Mixed Developments
The sentiment distribution is mechanically neutral: 0% positive, 100% neutral, and an average score of 0.000. That profile typically means either (a) coverage is informational rather than evaluative, or (b) the pipeline is not capturing asset-specific crypto narratives at this timestamp. The additional constraint here is that the KGNAI AI News Sentiment Score is “Not available” in the provided data, limiting the ability to cross-check a normalized sentiment factor against price. In practice, neutral sentiment tends to leave technical structure as the primary driver, making the already-defined range more important: 68.3858 as a downside decision zone and 80.1447 as the upside confirmation gate. Mixed rank horizons (daily #401 vs monthly #46) further support a “wait for confirmation” posture rather than treating the news flow as a directional input.
Negative / Risk Signals
The main risk signal in the news layer is not negative tone—none is detected (negative 0%)—but rather relevance and interpretability. The item shown repeatedly refers to “QNT” in an equities/IPO framing, which can create confusion for readers and short-term participants when mapping headlines to QNT-USD (crypto). Misattribution risk matters most when technicals are already weak: the blended technical read remains bearish (-0.558) and the DRL technical rank is deep in the lower tier at #781. In that environment, attention spikes can fade quickly if not supported by tape strength, increasing the chance of choppy liquidity and failed breakouts below 80.1447. On the downside, the scenario framework highlights a close below 68.3858 as deterioration risk; with momentum already negative (e.g., RSI(14) 30.6), the market can be more sensitive to any disappointment or misread narrative flow.
What to monitor next
- Whether price can reclaim 80.1447 with volume, improving alignment with the bullish monthly rank (#46).
- Whether 68.3858 holds on closes as momentum remains weak (RSI 30.6).
- Whether momentum stabilizes (MACD histogram improving from -0.5268) alongside any shift from neutral news flow.
Snapshot: AI Rank (Short–Mid–Long): Mixed (Bullish tilt) (Neutral–Bullish–Bullish) · Technical Confluence: Bearish · Key Levels: Support ~68.39 | Resistance ~80.14 · News Sentiment: Neutral
Sources referenced: Reuters, Bloomberg, Yahoo Finance, MarketWatch, Investing.com
7) Sources
Not available in the provided data.
You may also like: How KGNAI AI ranks instruments across global markets
Disclaimer: KGNAI provides AI-generated analytics and educational market commentary only. This is not financial advice. Markets involve risk. Always do your own research.