
Scallop (SCA29679-USD) — Neutral Rank Profile with Mixed Technical Alignment (03-Jun-2026)
Scallop (SCA29679-USD) screens as a no-clear-advantage setup in KGNAI’s cross-sectional crypto universe as of 03-Jun-2026. The instrument’s Daily (#535/800), Weekly (#634/800), and Monthly (#614/800) ranks cluster in the lower portion of the universe, consistent with a Neutral probabilistic profile rather than a dominant edge. Technically, the picture is more nuanced: trend context remains pressured with Close vs MA50 = Bearish and MA50 vs MA200 = Bearish, yet the AI technical model flags stronger relative positioning via a DRL technical rank of #61/800 and a blended overall technical score of 0.449 (Bullish). Momentum and volatility metrics lean balanced-to-cautious, with RSI(14) at 41.96 and Bollinger bandwidth at 0.1939. Key decision zones remain support ~0.0162 and resistance ~0.0227, while sector-level news sentiment is broadly neutral (0.013 average).
Key Takeaways
- Rank stance (Short / Mid / Long): Neutral / Neutral / Neutral (Daily #535/800, Weekly #634/800, Monthly #614/800)
- Technical confluence label: 18-signal confluence 0.278 (Neutral); blended technical score 0.449 with DRL rank #61/800 Bullish
- Key levels: Support ~ 0.0162 | Resistance ~ 0.0227
- News sentiment bias: Broad market/sector digest reads Neutral (avg 0.013; Neutral 94%)
- Confirmation / invalidation condition: A break above 0.0227 with volume supports continuation; a close below 0.0162 increases deterioration risk
What KGNAI Measures
KGNAI evaluates assets using large cross-sectional datasets built from millions of structured data points. Inputs incorporate fundamental metrics, technical structures, and systematically processed news sentiment. Statistical models, machine learning, and AI frameworks are used to assess relative positioning, signal alignment, and probabilistic behavior across broad universes.
How to Read This Report
- Ranks are comparative across the tracked universe, not absolute price targets.
- Confluence reflects alignment among independent signal groups.
- Support/resistance levels are probabilistic decision zones, not guarantees.
- Sentiment provides contextual bias within the broader analytical framework.
1) KGNAI AI Analysis
Region: CRYPTO
Total universe size: 800 ranked instruments
- Daily rank: #535 out of 800 — Neutral
- Weekly rank: #634 out of 800 — Neutral
- Monthly rank: #614 out of 800 — Neutral
- 3-Monthly rank: Not available for this horizon — Not available
Cross-sectional positioning: neutral and clustered in the lower half
The rank structure places SCA29679-USD in a neutral probability band across the primary horizons that are available, with the Daily rank at #535, Weekly at #634, and Monthly at #614 out of 800. In cross-sectional terms, this is not the profile typically associated with persistent leadership; rather, it suggests the asset is more often behaving like the broader tail of the universe where signal quality can be inconsistent.
The horizon-to-horizon pattern is also informative: weekly and monthly ranks are both weaker than the daily reading, implying that any short-term stabilization has not yet translated into stronger medium-horizon relative behavior. That structure is consistent with a market still requiring confirmation before treating rallies as more than reactionary moves.
The 3-Monthly rank is Not available in the provided data. Without that longer view, the most disciplined interpretation is to emphasize the alignment across the available windows: all are labeled Neutral, and none are strong enough to dominate the balance of evidence.
Term view: Short-term: Neutral. Mid-term: Neutral. Long-term: Neutral.
2) Price & trend overview
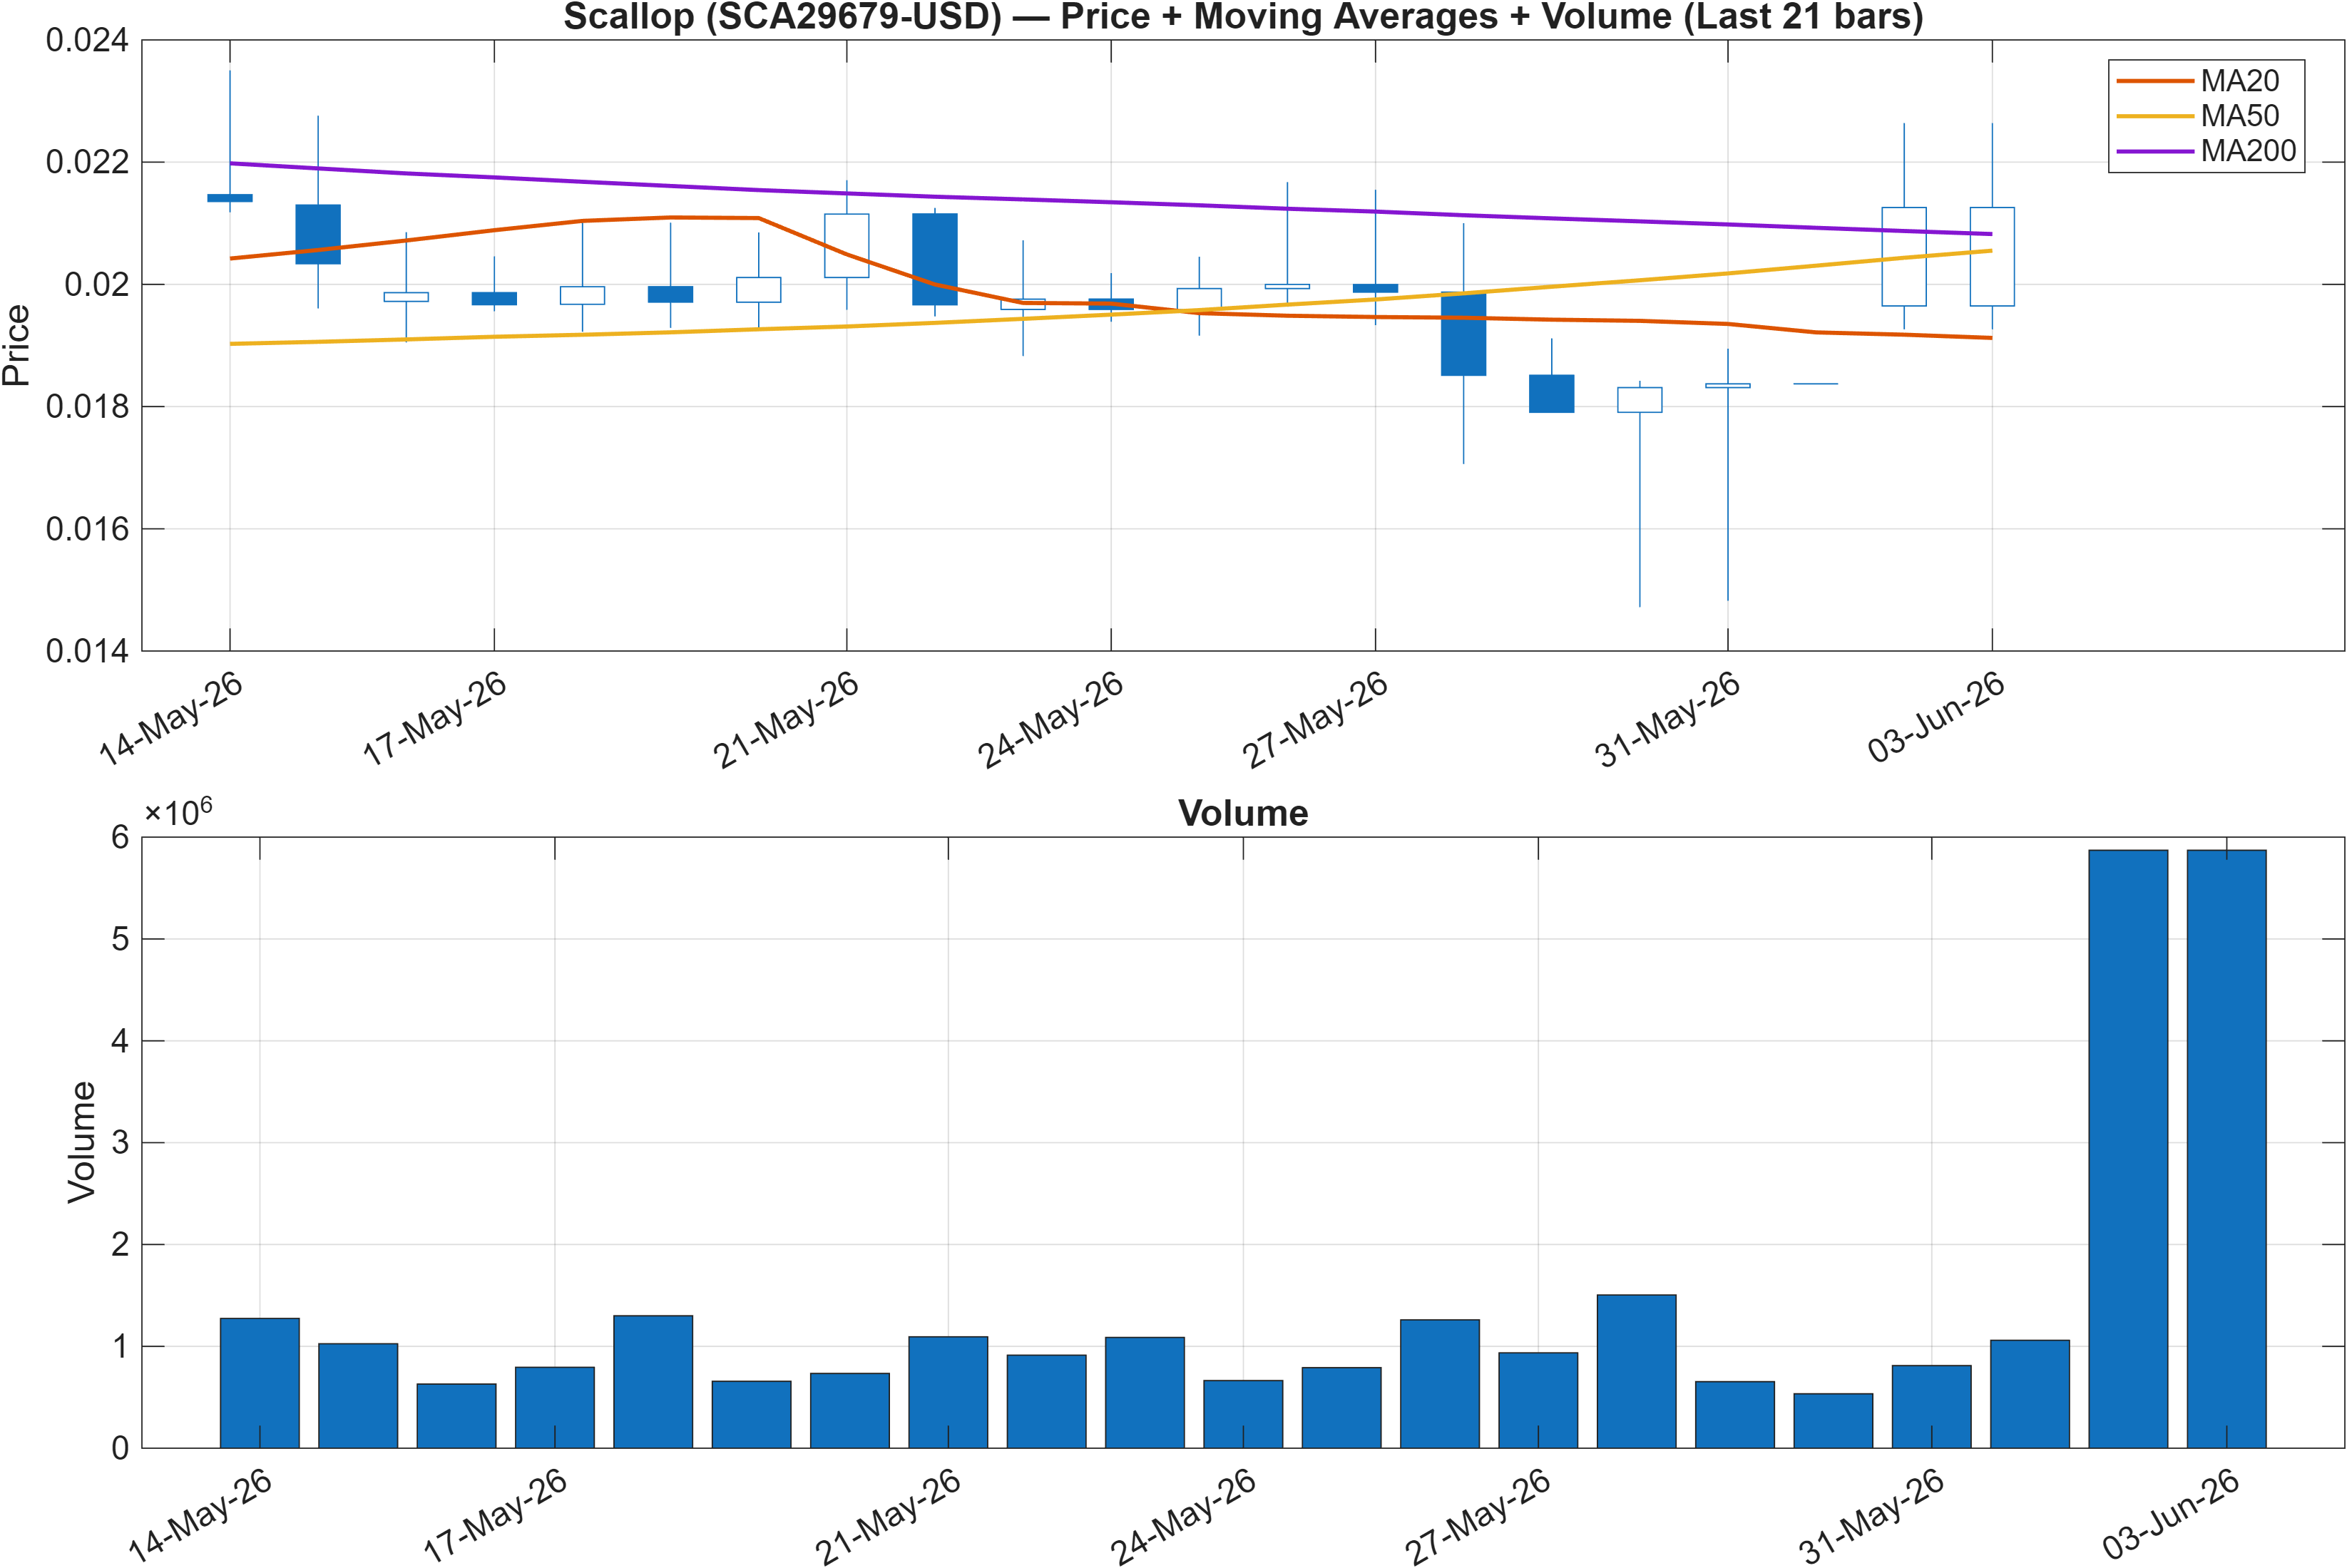
Trend regime: bearish moving-average structure vs tactical stabilization risk
The trend read is unambiguous at the moving-average layer: Close vs MA50 = Bearish and MA50 vs MA200 = Bearish. This is the classical definition of a market trading below its intermediate trend while the intermediate trend itself remains below the long-term baseline—conditions that typically require more evidence before treating upside moves as durable.
What prevents the trend regime from becoming a one-sided conclusion is the broader evidence set: the AI ranking profile remains Neutral (Daily #535/800), and later sections show a materially stronger AI technical model rank (#61/800) despite the bearish MA stack. That combination often appears when the market is transitioning from trend-down to base-building, but confirmation is still pending at the price-structure layer.
From a risk framing perspective, the most actionable element of the trend view is not prediction but state identification: while the MA regime is bearish, subsequent momentum and breadth proxies include both supportive and cautionary readings (e.g., MACD histogram 0.0001 vs RSI(14) 41.96). That mix argues for treating trend as still negative until price proves otherwise through the defined resistance zone.
Interpretation: Close vs MA50 = Bearish, MA50 vs MA200 = Bearish.
3) Momentum & volatility dashboard
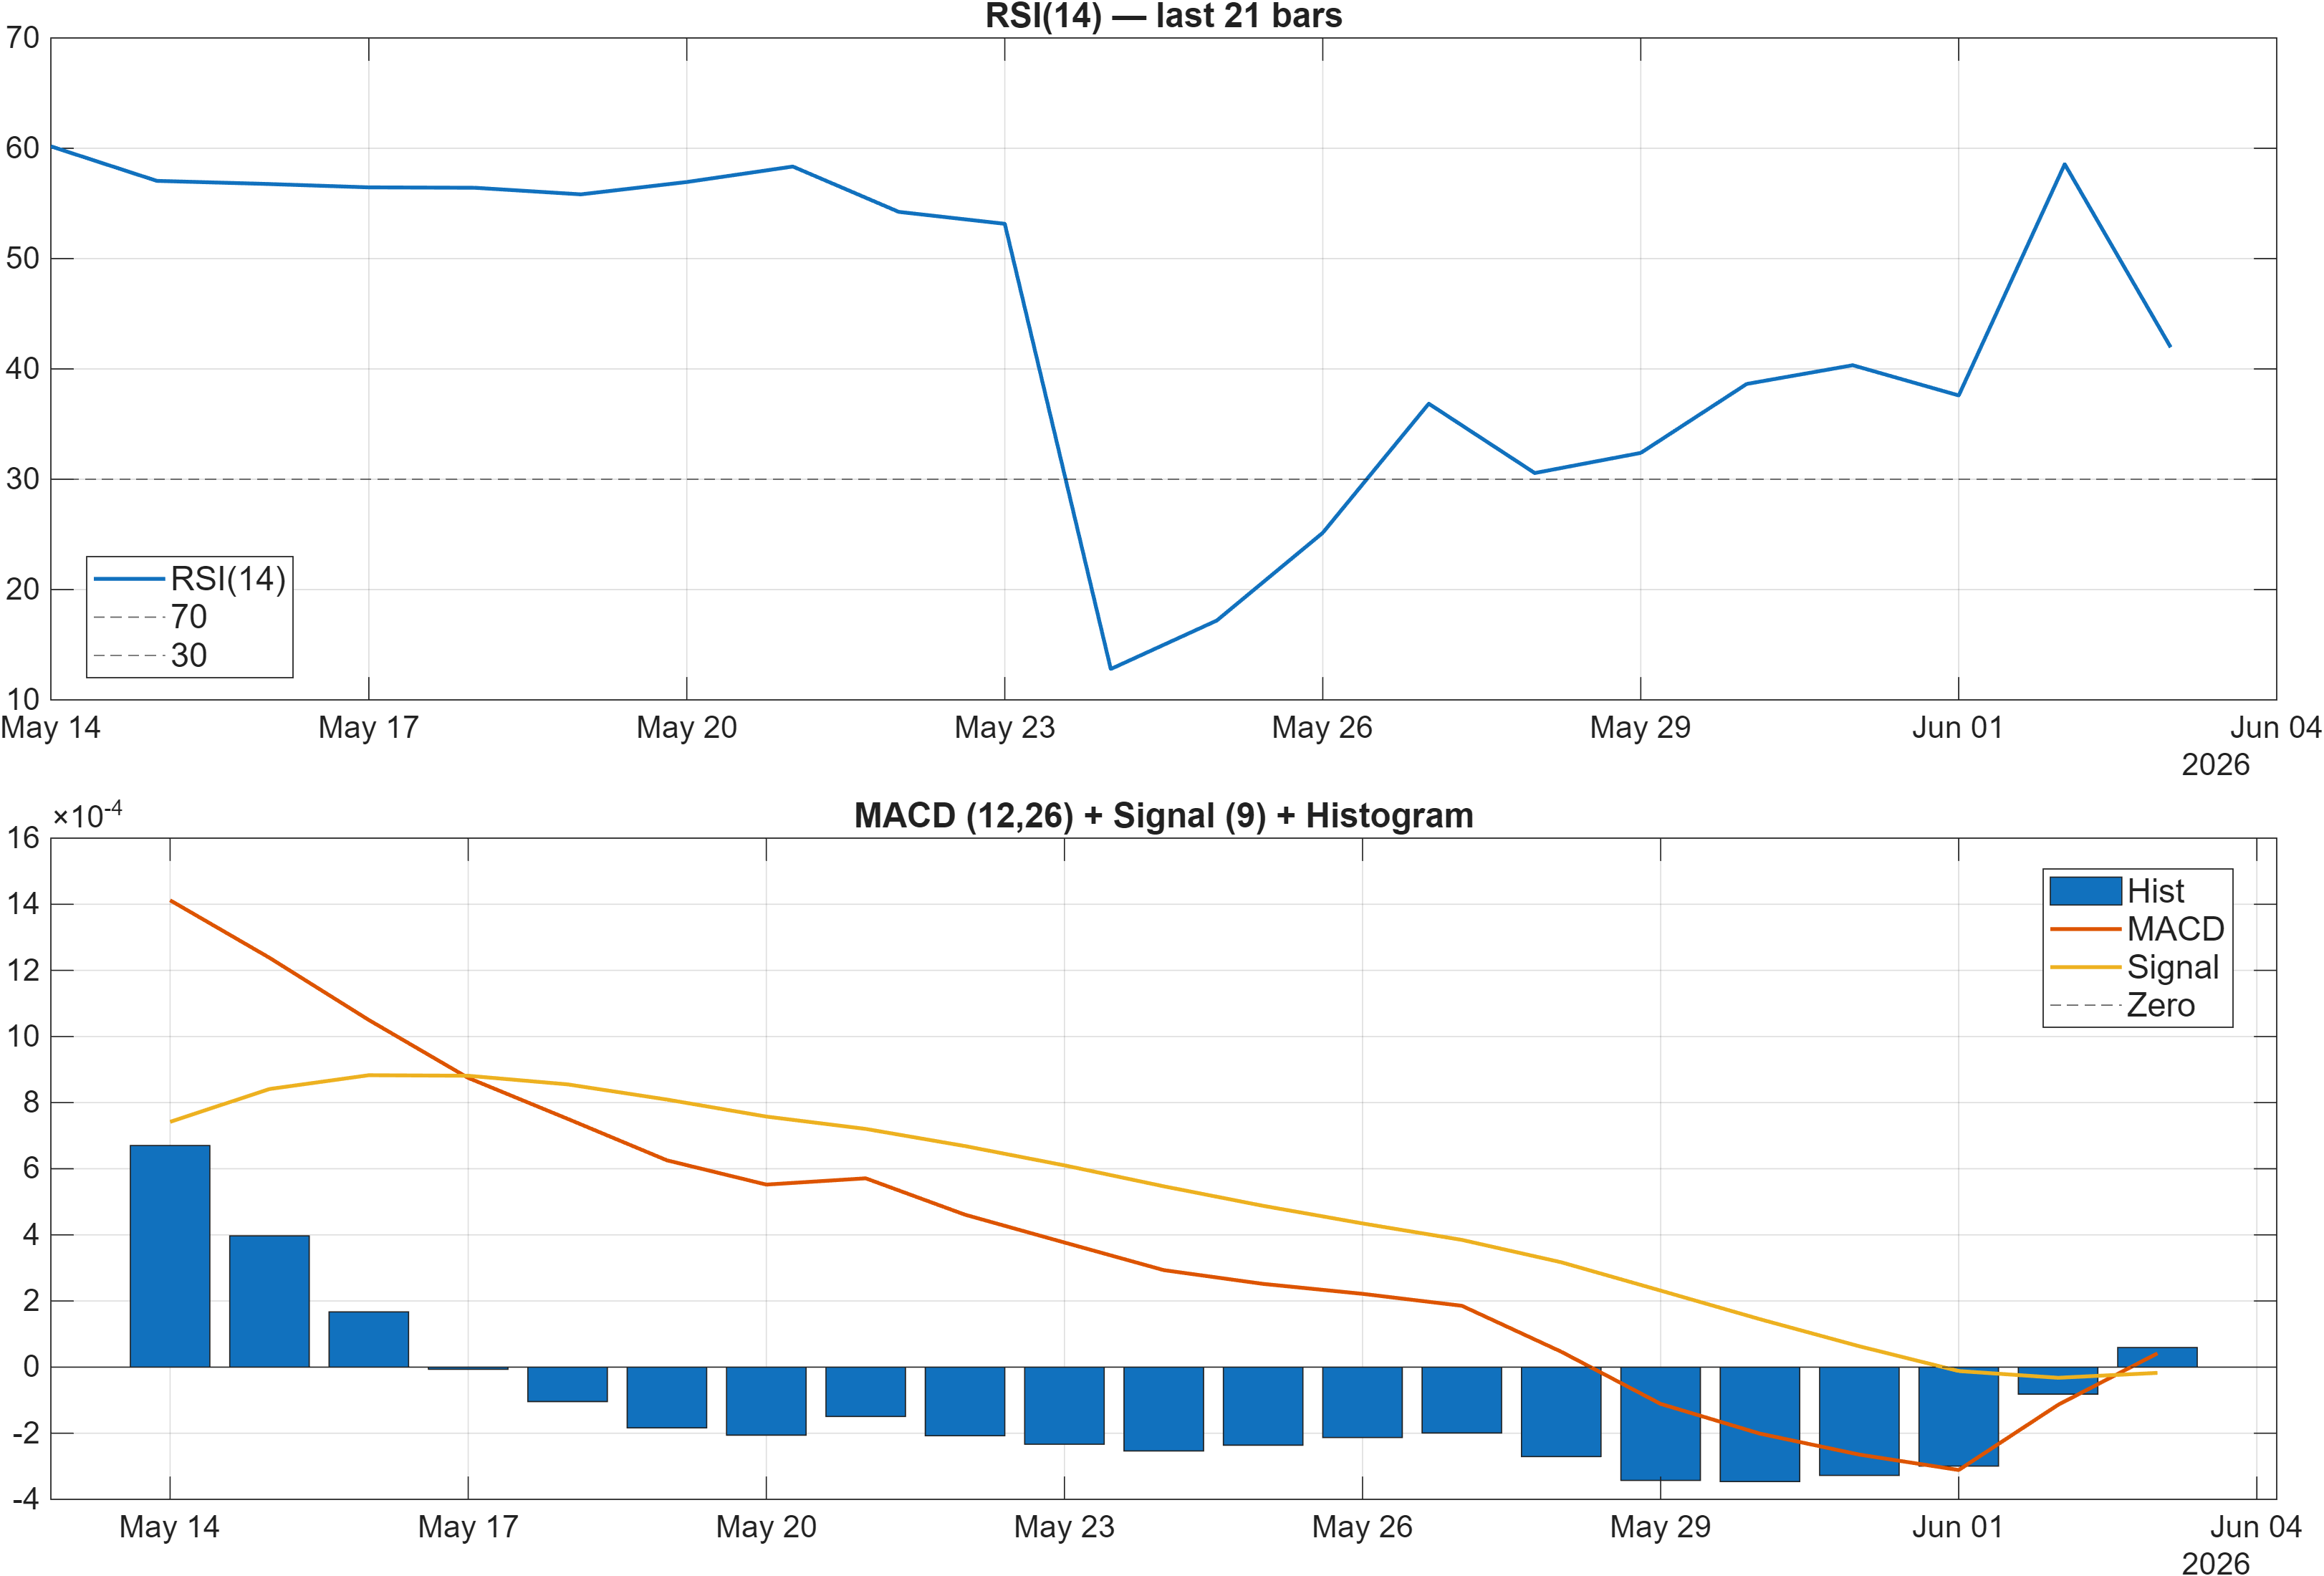
Momentum: modest positive impulse vs still-soft oscillator tone
Momentum diagnostics are not uniformly directional. The MACD histogram is slightly positive at 0.0001, which can signal early improvement in incremental momentum. However, the oscillator backdrop is still subdued: RSI(14) at 41.96 is interpreted as Bearish in the signal table context, consistent with a market that has not regained typical bullish momentum ranges.
This is a classic divergence between a rate-of-change improvement (MACD histogram turning marginally positive) and a level-based weakness (RSI still below the midline region). In practical trading terms, it tends to produce choppy price action until either RSI climbs meaningfully or the MACD improvement fades.
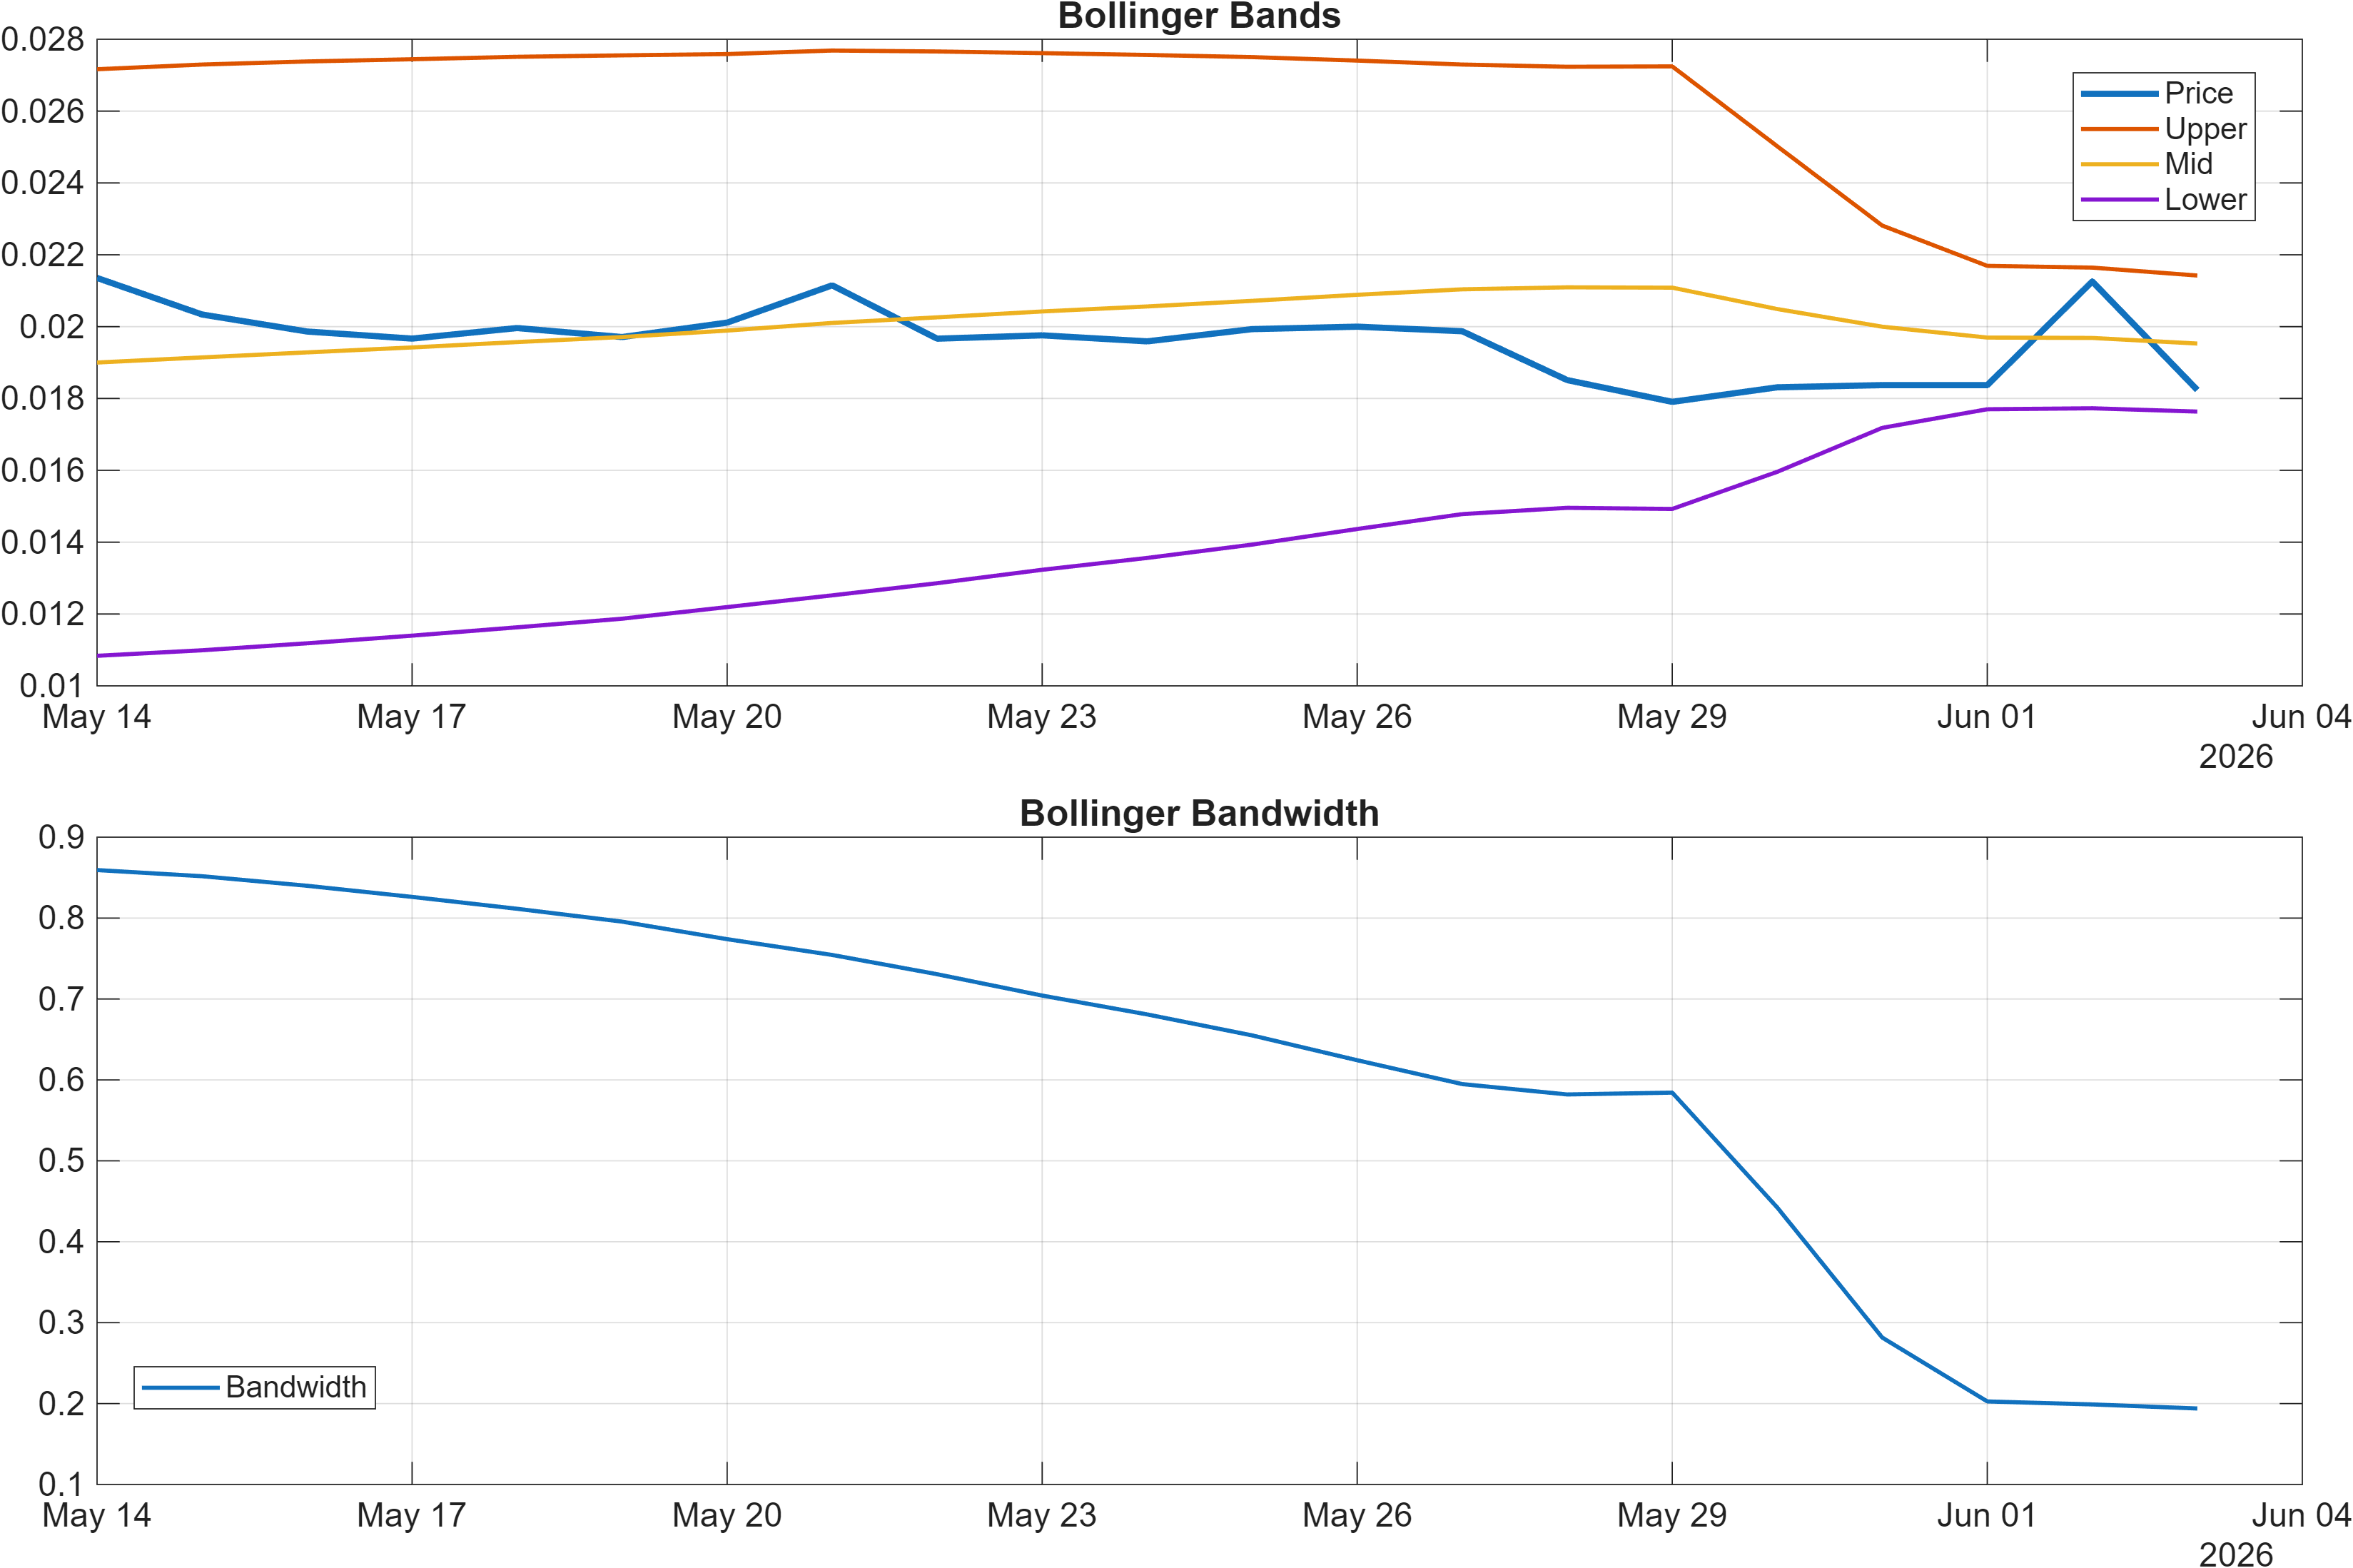
Volatility regime: neither compressed nor fully expanded
Volatility, as proxied by Bollinger bandwidth, is 0.1939. Interpreted alongside the neutral label in the 18-signal set, this suggests a regime that is not at an extreme squeeze (often preceding breakouts) nor in a high-volatility dislocation. That matters because signals that rely on expansion (trend continuation) tend to be less reliable when bandwidth is middling; conversely, mean-reversion setups can also struggle when volatility is not compressed.
With momentum indicators sending mixed messages (MACD hist 0.0001 vs RSI 41.96) and bandwidth neutral (0.1939), the dashboard supports a “wait for range resolution” stance anchored to the explicit support/resistance bands.
Interpretation: RSI bias = Neutral, MACD hist = 0.0001.
Interpretation: Bandwidth (volatility regime) latest = 0.1939.
4) Support / Resistance zones
Support ~ 0.0162 | Resistance ~ 0.0227
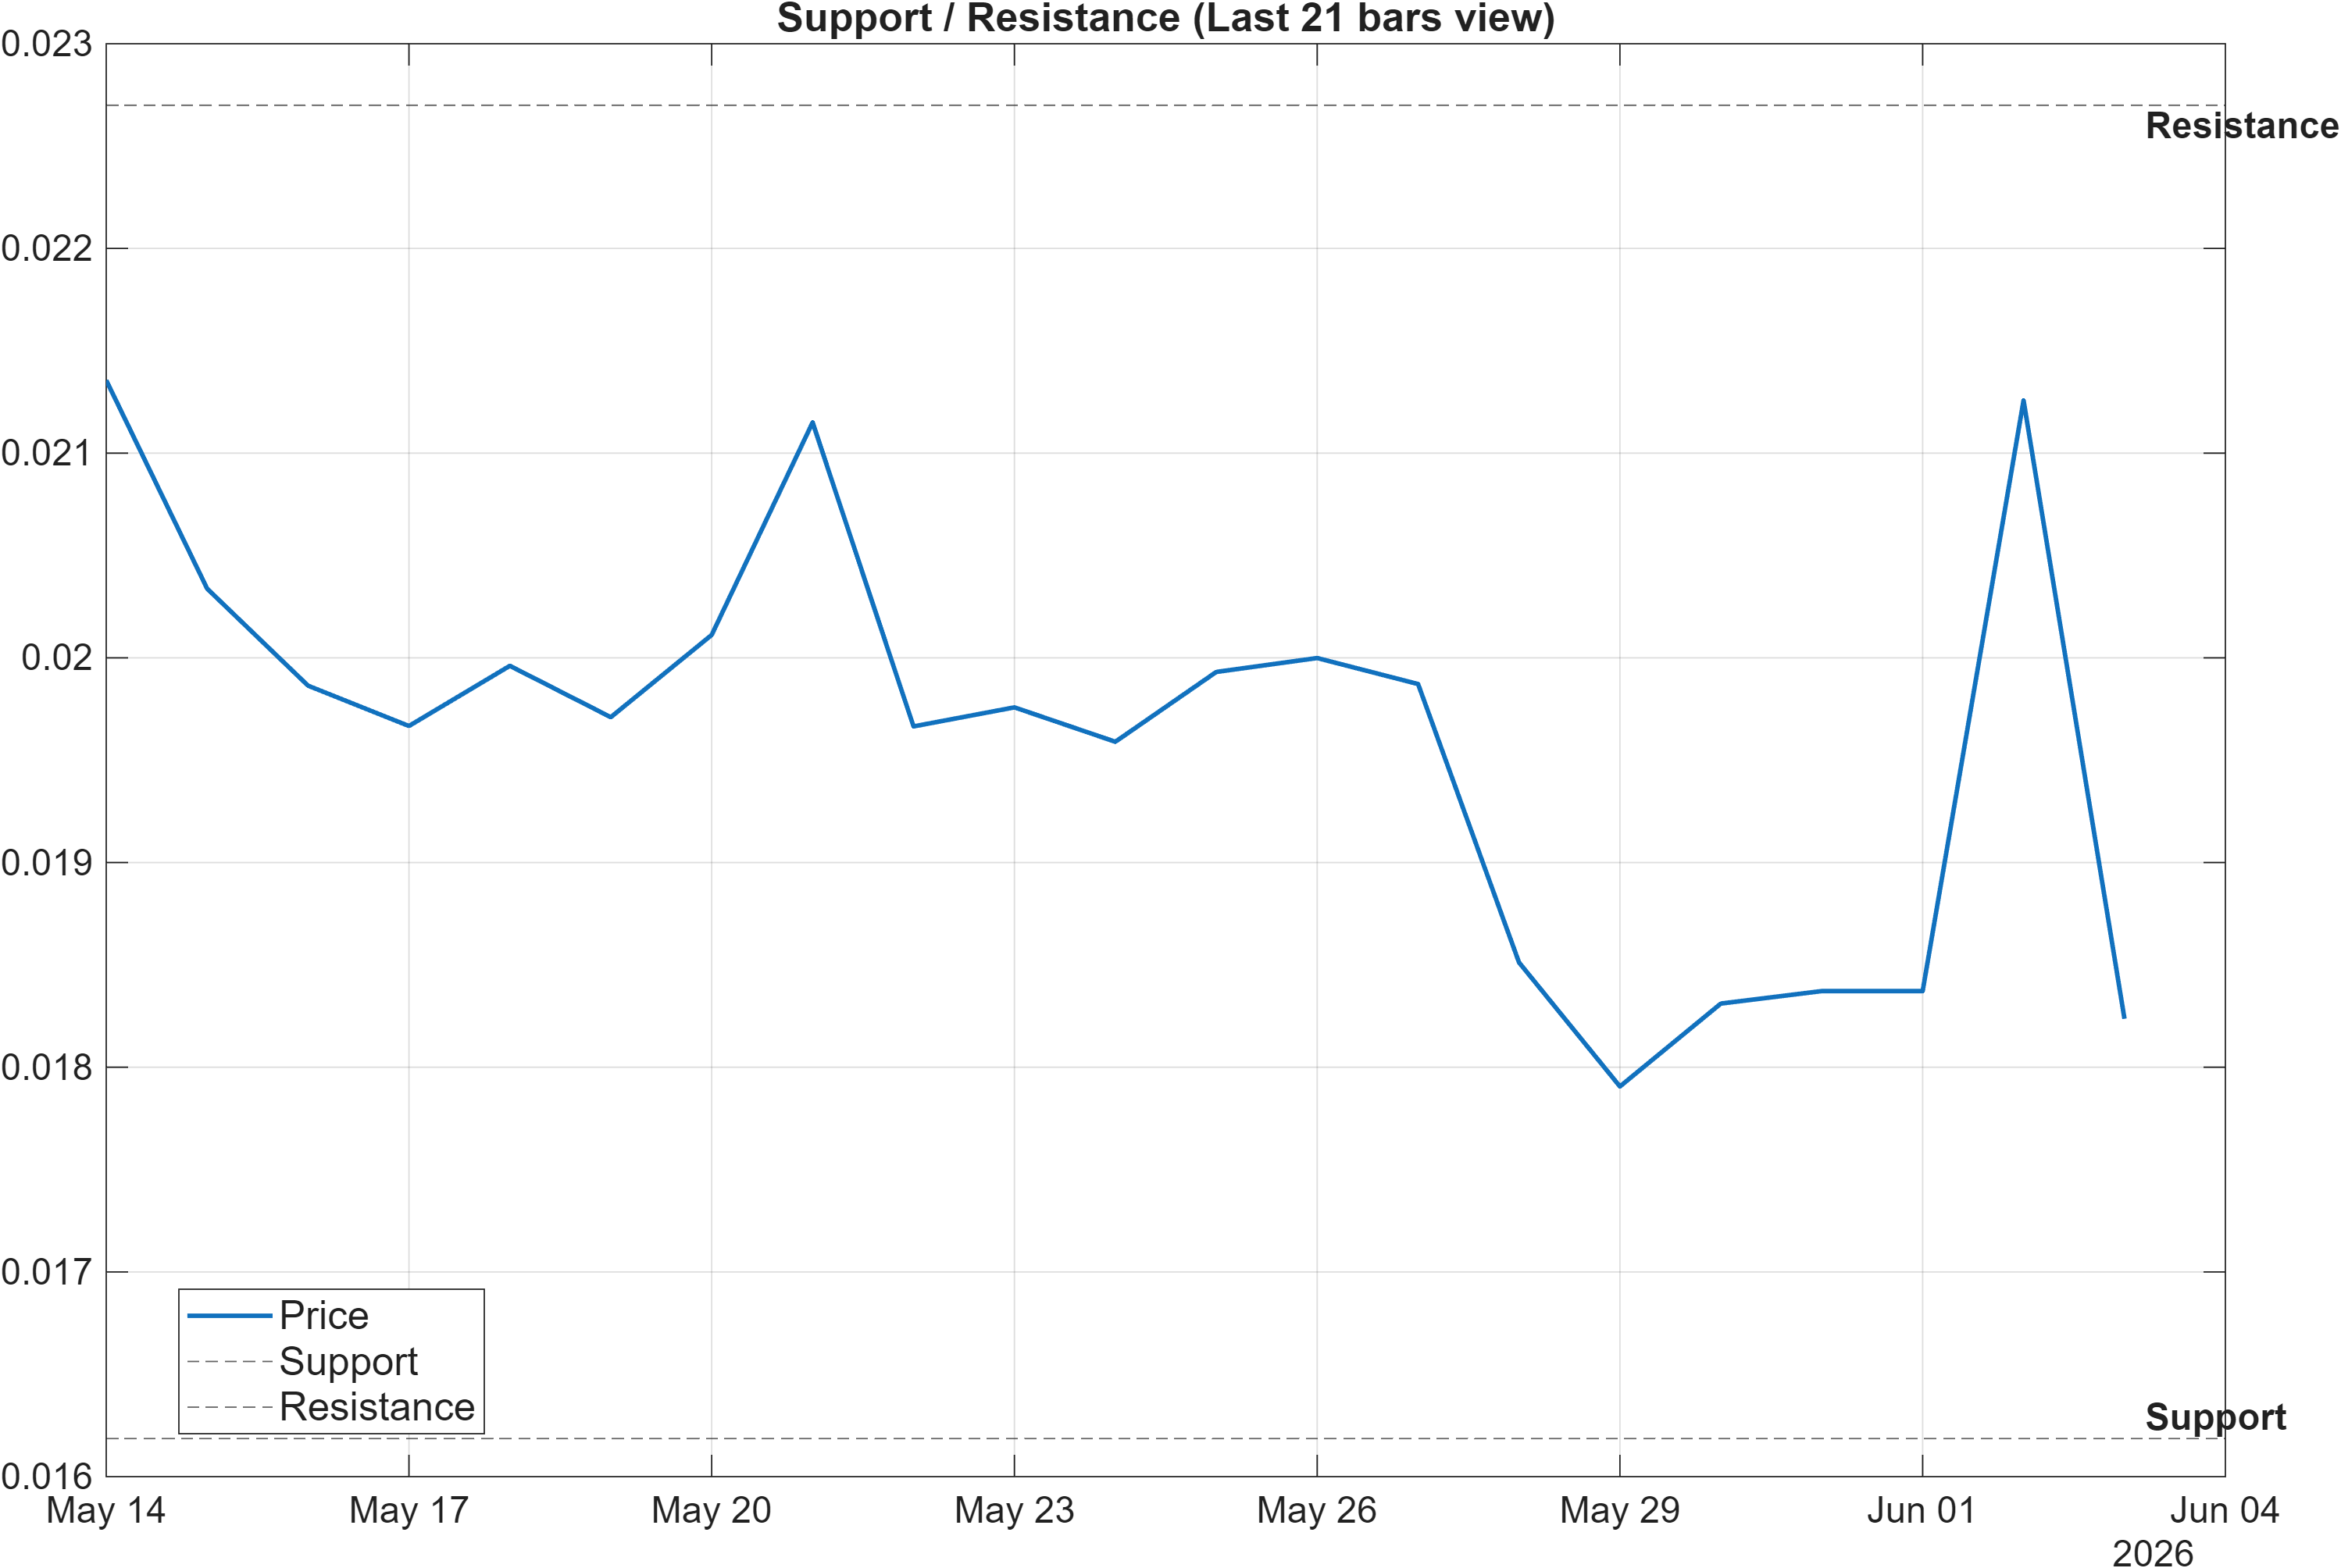
Decision zones: defining continuation vs deterioration without overfitting
The technical map is clean: support ~0.0162 and resistance ~0.0227. With the trend regime still bearish (Close below MA50; MA50 below MA200), the resistance band becomes the primary filter for distinguishing a counter-trend bounce from a structure change. A credible upside sequence typically requires price to reclaim resistance and hold above it, ideally with confirming participation.
On the downside, the support level functions as a risk boundary: a close below 0.0162 would align with the weaker cross-sectional ranks (Weekly #634/800, Monthly #614/800) and would be consistent with a renewed downside regime. This is particularly relevant because several momentum components already show fragility (e.g., ROC(20) -10.33 and RSI(14) 41.96 reading bearish in the signal table).
Importantly, these zones also provide a framework to interpret “mixed” indicator behavior. When oscillators and model outputs disagree—as they do here with a strong AI technical rank (#61/800) but bearish MA structure—support/resistance often becomes the most robust, least model-dependent arbiter of whether the market is accepting higher prices or rejecting them.
Scenario view: Break above resistance with volume → continuation. Close below support → signal deterioration risk.
5) Quant Technical Dashboard (18 Signals)
KGNAI AI Technical Analysis Score (Deep Reinforcement Learning): Rank #61 out of 800 (Rank 1 represents the strongest technical positioning and a higher probability of favorable price behavior. As ranks increase toward the maximum, the probability of favorable outcomes weakens and bearish positioning becomes more dominant.) | Label: Bullish | Score: 0.848
18-Signal Technical Confluence Score: 0.278 (Neutral)
Overall Technical Score (18-signal confluence + DRL rank blend): 0.449 (Bullish)
Note: The blended score reflects signal strength weighted against broader AI technical ranking, which may temporarily diverge.
Blended technical score breakdown: 0.449 (Bullish | Bull 10 / Bear 5 / Neutral 3)
Alignment vs divergence: strong model rank, neutral confluence
The standout feature in the technical dashboard is the divergence between the composite confluence and the AI model layer. The 18-signal confluence score is 0.278 (Neutral), yet the Deep Reinforcement Learning technical rank is #61 out of 800 with a 0.848 score, producing a blended overall technical score of 0.449 (Bullish). That pattern is consistent with a market where the model detects favorable structure relative to peers even though traditional indicator agreement is incomplete.
Internally, the blend is supported by the distribution of indicator states: Bull 10 / Bear 5 / Neutral 3. Several participation-style measures are constructive (e.g., OBV slope(10) and AD Line slope(10) are flagged bullish), while classic momentum risk flags remain present (RSI(14) 41.96 and ROC(20) -10.33 are bearish). This is less a “strong trend” profile and more a “potential stabilization with uneven momentum” profile.
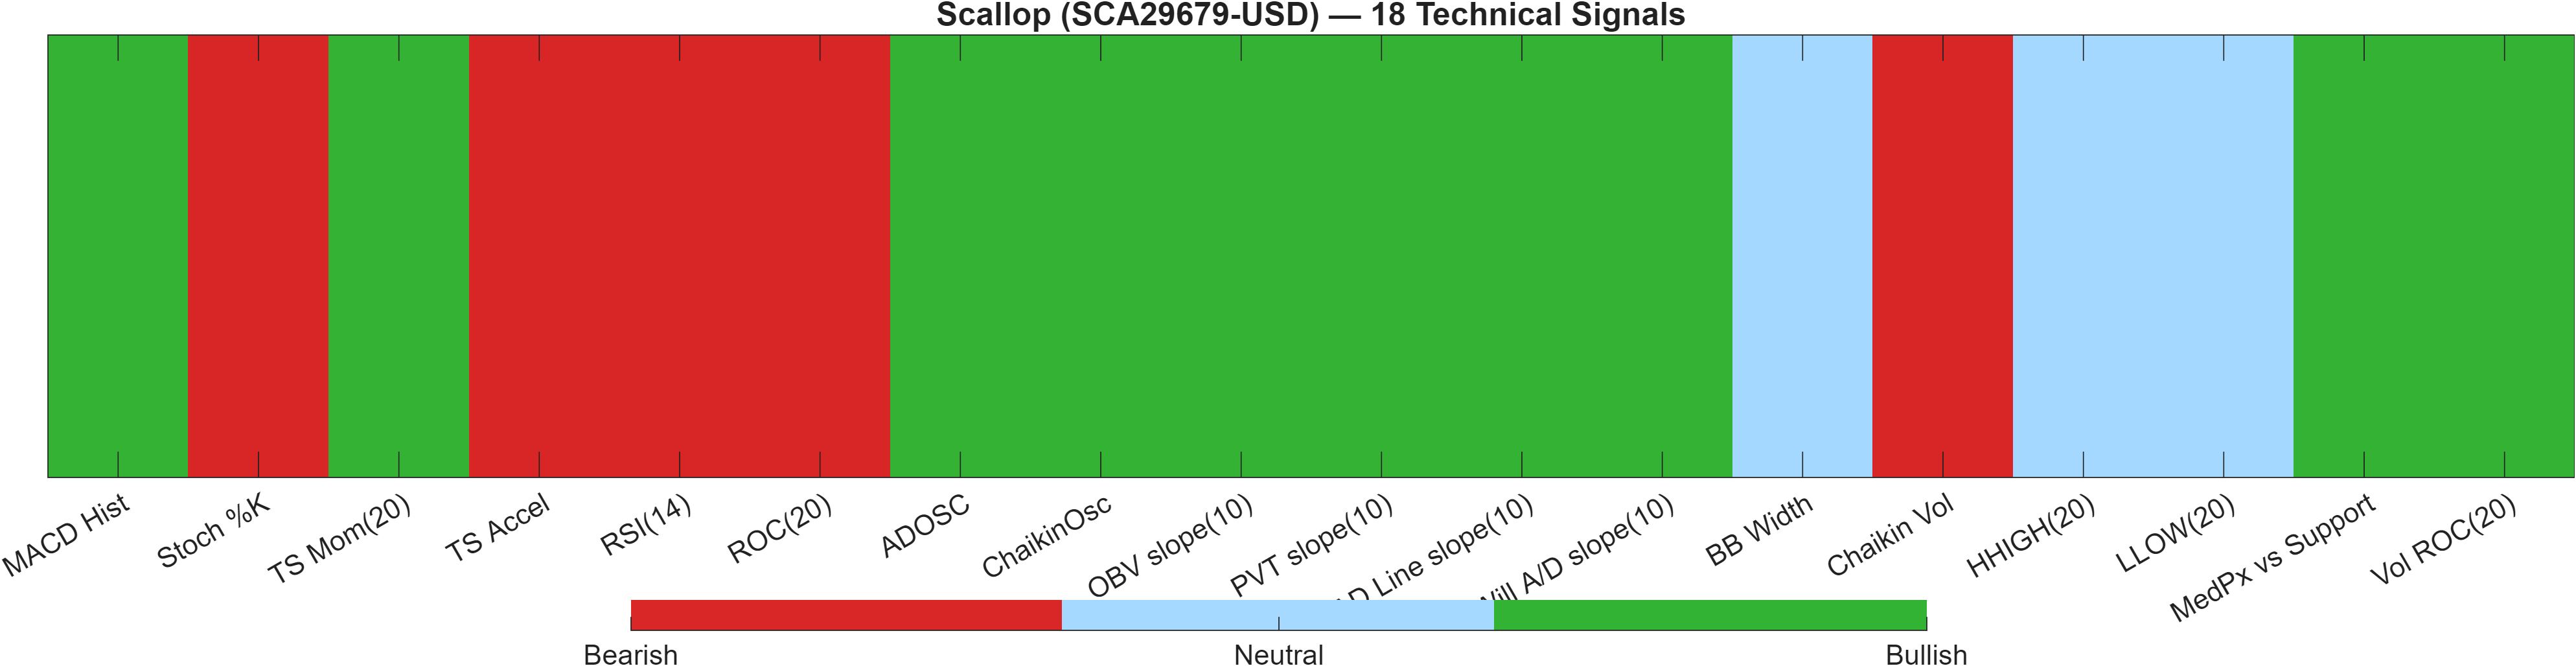
Signal table (Bull/Bear/Neutral)
| Indicator | Value | Signal |
|---|---|---|
| MACD Hist | 5.922e-05 | Bullish |
| Stoch %K | 82.56 | Bearish |
| TS Mom(20) | 0.0009195 | Bullish |
| TS Accel | -0.002353 | Bearish |
| RSI(14) | 41.96 | Bearish |
| ROC(20) | -10.33 | Bearish |
| ADOSC | 73.86 | Bullish |
| ChaikinOsc | 4.791e+05 | Bullish |
| OBV slope(10) | 6.173e+06 | Bullish |
| PVT slope(10) | 8.247e+05 | Bullish |
| AD Line slope(10) | 1.039e+06 | Bullish |
| Will A/D slope(10) | 0.005789 | Bullish |
| BB Width | 0.1939 | Neutral |
| Chaikin Vol | 42.86 | Bearish |
| HHIGH(20) | 0.02276 | Neutral |
| LLOW(20) | 0.01472 | Neutral |
| MedPx vs Support | 0.004765 | Bullish |
| Vol ROC(20) | 472.5 | Bullish |
The table reinforces the “mixed alignment” thesis: a few bearish flags (e.g., Stoch %K 82.56 marked bearish and TS Accel -0.002353 bearish) coexist with multiple bullish participation measures and a neutral volatility posture (BB Width 0.1939). In this configuration, follow-through typically depends more on whether price can reclaim and hold above the stated resistance band than on any single indicator.
Interpretation: Indicator-level signals form the base confluence, which is then adjusted using a separate AI-driven technical ranking model. The final technical score summarizes this combined view.
6) News sentiment + extractive gist
Note: Instrument-specific news matches were not found, so the digest includes broader market/sector headlines. Links are provided for verification.
Sentiment score (avg): 0.013 | Positive: 6% | Neutral: 94% | Negative: 0%
KGNAI AI News Sentiment Score (normalized -1 to +1): Not available (as of —) | Label: Not available | Overall news score: 0.01
Positive Developments
Recent coverage across major financial outlets indicates a constructive undercurrent for the broader crypto complex, centered on longer-horizon adoption narratives and institutional framing rather than immediate, instrument-specific catalysts. In the provided digest, the most supportive tone comes from discussions that treat crypto as part of a wider macro and asset-allocation conversation, which can help stabilize risk appetite during choppy tape. This backdrop is consistent with the sentiment distribution skewing heavily to Neutral (94%) with a smaller Positive (6%) share and 0% negative classification in the scoring summary. For SCA29679-USD, this “benign but not catalytic” news environment aligns with the technical ambiguity: a neutral confluence score (0.278) paired with a stronger model-driven technical rank (#61/800) often needs incremental confidence from the tape rather than from headlines.
Neutral / Mixed Developments
The dominant informational theme is regulatory and policy discussion, which tends to be directionally mixed: it can reduce uncertainty over time but can also introduce intermittent risk-premium repricing as rules are debated, clarified, or tightened. Because the digest is sector-level rather than instrument-specific, it functions primarily as context for volatility and liquidity conditions rather than as a direct driver of Scallop’s flow. This helps explain why the average sentiment score sits near flat at 0.013 and why the platform’s normalized AI sentiment score is Not available in the provided data. In an environment where the narrative is more procedural than catalytic, price tends to respect technical decision zones—here, 0.0162 and 0.0227—more consistently than it responds to incremental news.
Negative / Risk Signals
Risk discussion in the digest concentrates on the possibility of stricter oversight and the potential for policy-driven constraints around crypto usage in retirement or stablecoin frameworks. Even when framed as “guardrails,” these debates can pressure sentiment at the margin by raising the perceived cost of compliance or narrowing participation channels. For a smaller or less-covered instrument such as SCA29679-USD (with no direct news matches), the key risk is indirect: a sector-wide risk-off impulse can reinforce existing bearish trend structure (Close vs MA50 = Bearish; MA50 vs MA200 = Bearish) and challenge the market’s ability to reclaim resistance near 0.0227. With momentum already mixed—RSI(14) 41.96 bearish in the signal set despite a slightly positive MACD histogram—headline-driven risk aversion would most likely show up as failed breakouts and heavier reactions near support.
- Whether price acceptance improves above 0.0227 alongside participation/volume confirmation.
- Whether weakness propagates into a close below 0.0162, aligning trend, rank, and momentum risk.
- Whether sector policy/regulatory tone shifts from neutral process to market-moving constraints.
Sources referenced: Reuters, Bloomberg, Yahoo Finance, MarketWatch, Investing.com
7) Sources
Not available in the provided data.
You may also like: How KGNAI AI ranks instruments across global markets
Disclaimer: KGNAI provides AI-generated analytics and educational market commentary only. This is not financial advice. Markets involve risk. Always do your own research.