
CCEP.LSE — Coca-Cola Europacific Partners PLC(UK) Technical & Rank Report (19-Jun-2026) | Market Structure Leans Positive
Coca-Cola Europacific Partners PLC(UK) (CCEP.LSE) screens with a broadly constructive cross-horizon profile in the KGNAI ranking framework, supported by trend structure and a mostly bullish indicator mix. Across a 1396-instrument European universe, ranks remain in the upper tier (notably weekly #47 and 3-month #42), suggesting relative strength that has persisted beyond a single session. Technically, the moving-average configuration is bullish (close above MA50; MA50 above MA200), while momentum remains elevated with RSI(14) at 84.38 and a positive MACD histogram reading (14.9871). Volatility conditions are not extreme—Bollinger bandwidth prints 0.1429—so the primary question becomes whether price can convert momentum into follow-through without losing the defined decision zone around support (6686.6667). News sentiment in the provided dataset is fully neutral (0.000 average; 100% neutral), leaving price/technical structure as the dominant input today.
Key Takeaways
- Rank stance (Short / Mid / Long): Bullish / Bullish / Bullish (daily #139, weekly #47, yearly #183 out of 1396).
- Technical confluence: Bullish (18-signal confluence 0.611; overall technical score 0.494).
- Key levels: Support ~ 6686.6667 | Resistance ~ 7404.1667.
- News sentiment bias: Neutral (avg 0.000; Neutral 100%).
- Confirmation / invalidation: Continuation risk-control framework centers on a sustained move above 7404.1667 versus deterioration risk on a close below 6686.6667.
What KGNAI Measures
KGNAI evaluates assets using large cross-sectional datasets built from millions of structured data points. Inputs incorporate fundamental metrics, technical structures, and systematically processed news sentiment. Statistical models, machine learning, and AI frameworks are used to assess relative positioning, signal alignment, and probabilistic behavior across broad universes.
How to Read This Report
- Ranks are comparative across the tracked universe, not absolute price targets.
- Confluence reflects alignment among independent signal groups.
- Support/resistance levels are probabilistic decision zones, not guarantees.
- Sentiment provides contextual bias within the broader analytical framework.
1) KGNAI AI Analysis
Region: EUROPE
Total universe size: 1396 ranked instruments
- Daily rank: #139 out of 1396 — Bullish
- Weekly rank: #47 out of 1396 — Bullish
- Monthly rank: #79 out of 1396 — Bullish
- 3-Monthly rank: #42 out of 1396 — Bullish
- 6-Monthly rank: #72 out of 1396 — Bullish
- Yearly rank: #183 out of 1396 — Bullish
Cross-horizon persistence vs. single-period noise
The defining feature of CCEP.LSE in this snapshot is multi-horizon agreement. The weekly rank (#47) and 3-month rank (#42) sit firmly in the upper tier of the 1396-name universe, while the daily rank (#139) remains supportive rather than contradictory. That pattern typically matters more than an isolated “good day,” because it implies the model is detecting persistent relative strength across different lookback regimes rather than a transient move.
The monthly rank (#79) and 6-month rank (#72) reinforce the same directionality, indicating that the instrument has not only participated in recent strength but has also maintained a constructive profile through intermediate windows. The yearly rank (#183) is less aggressive than the shorter windows, but it remains in bullish territory and does not present a structural warning by itself; instead, it suggests that the strongest relative phase is more recent than it is long-dated.
From an alignment standpoint, the term view is explicitly bullish across short-, mid-, and long-term classifications. The practical analytical implication is that model-level dispersion is low here: the ranks cluster in a consistent “better-than-universe” band rather than whipsawing between extremes. Risk management, therefore, shifts toward monitoring whether technical confirmation remains intact (Sections 2–5) and whether key levels (Section 4) invalidate the broad ranking stance.
KGNAI ranks each instrument across large universes using multiple proprietary AI tests and statistical models (millions of data points). Lower ranks generally indicate stronger probability of favorable performance behavior, while higher ranks indicate weaker probability and more bearish positioning.
Term view: Short-term: Bullish. Mid-term: Bullish. Long-term: Bullish.
Want the full universe and complete rank tables? Unlock full access on KGNAI: https://www.kgnai.com/pricing
2) Price & trend overview
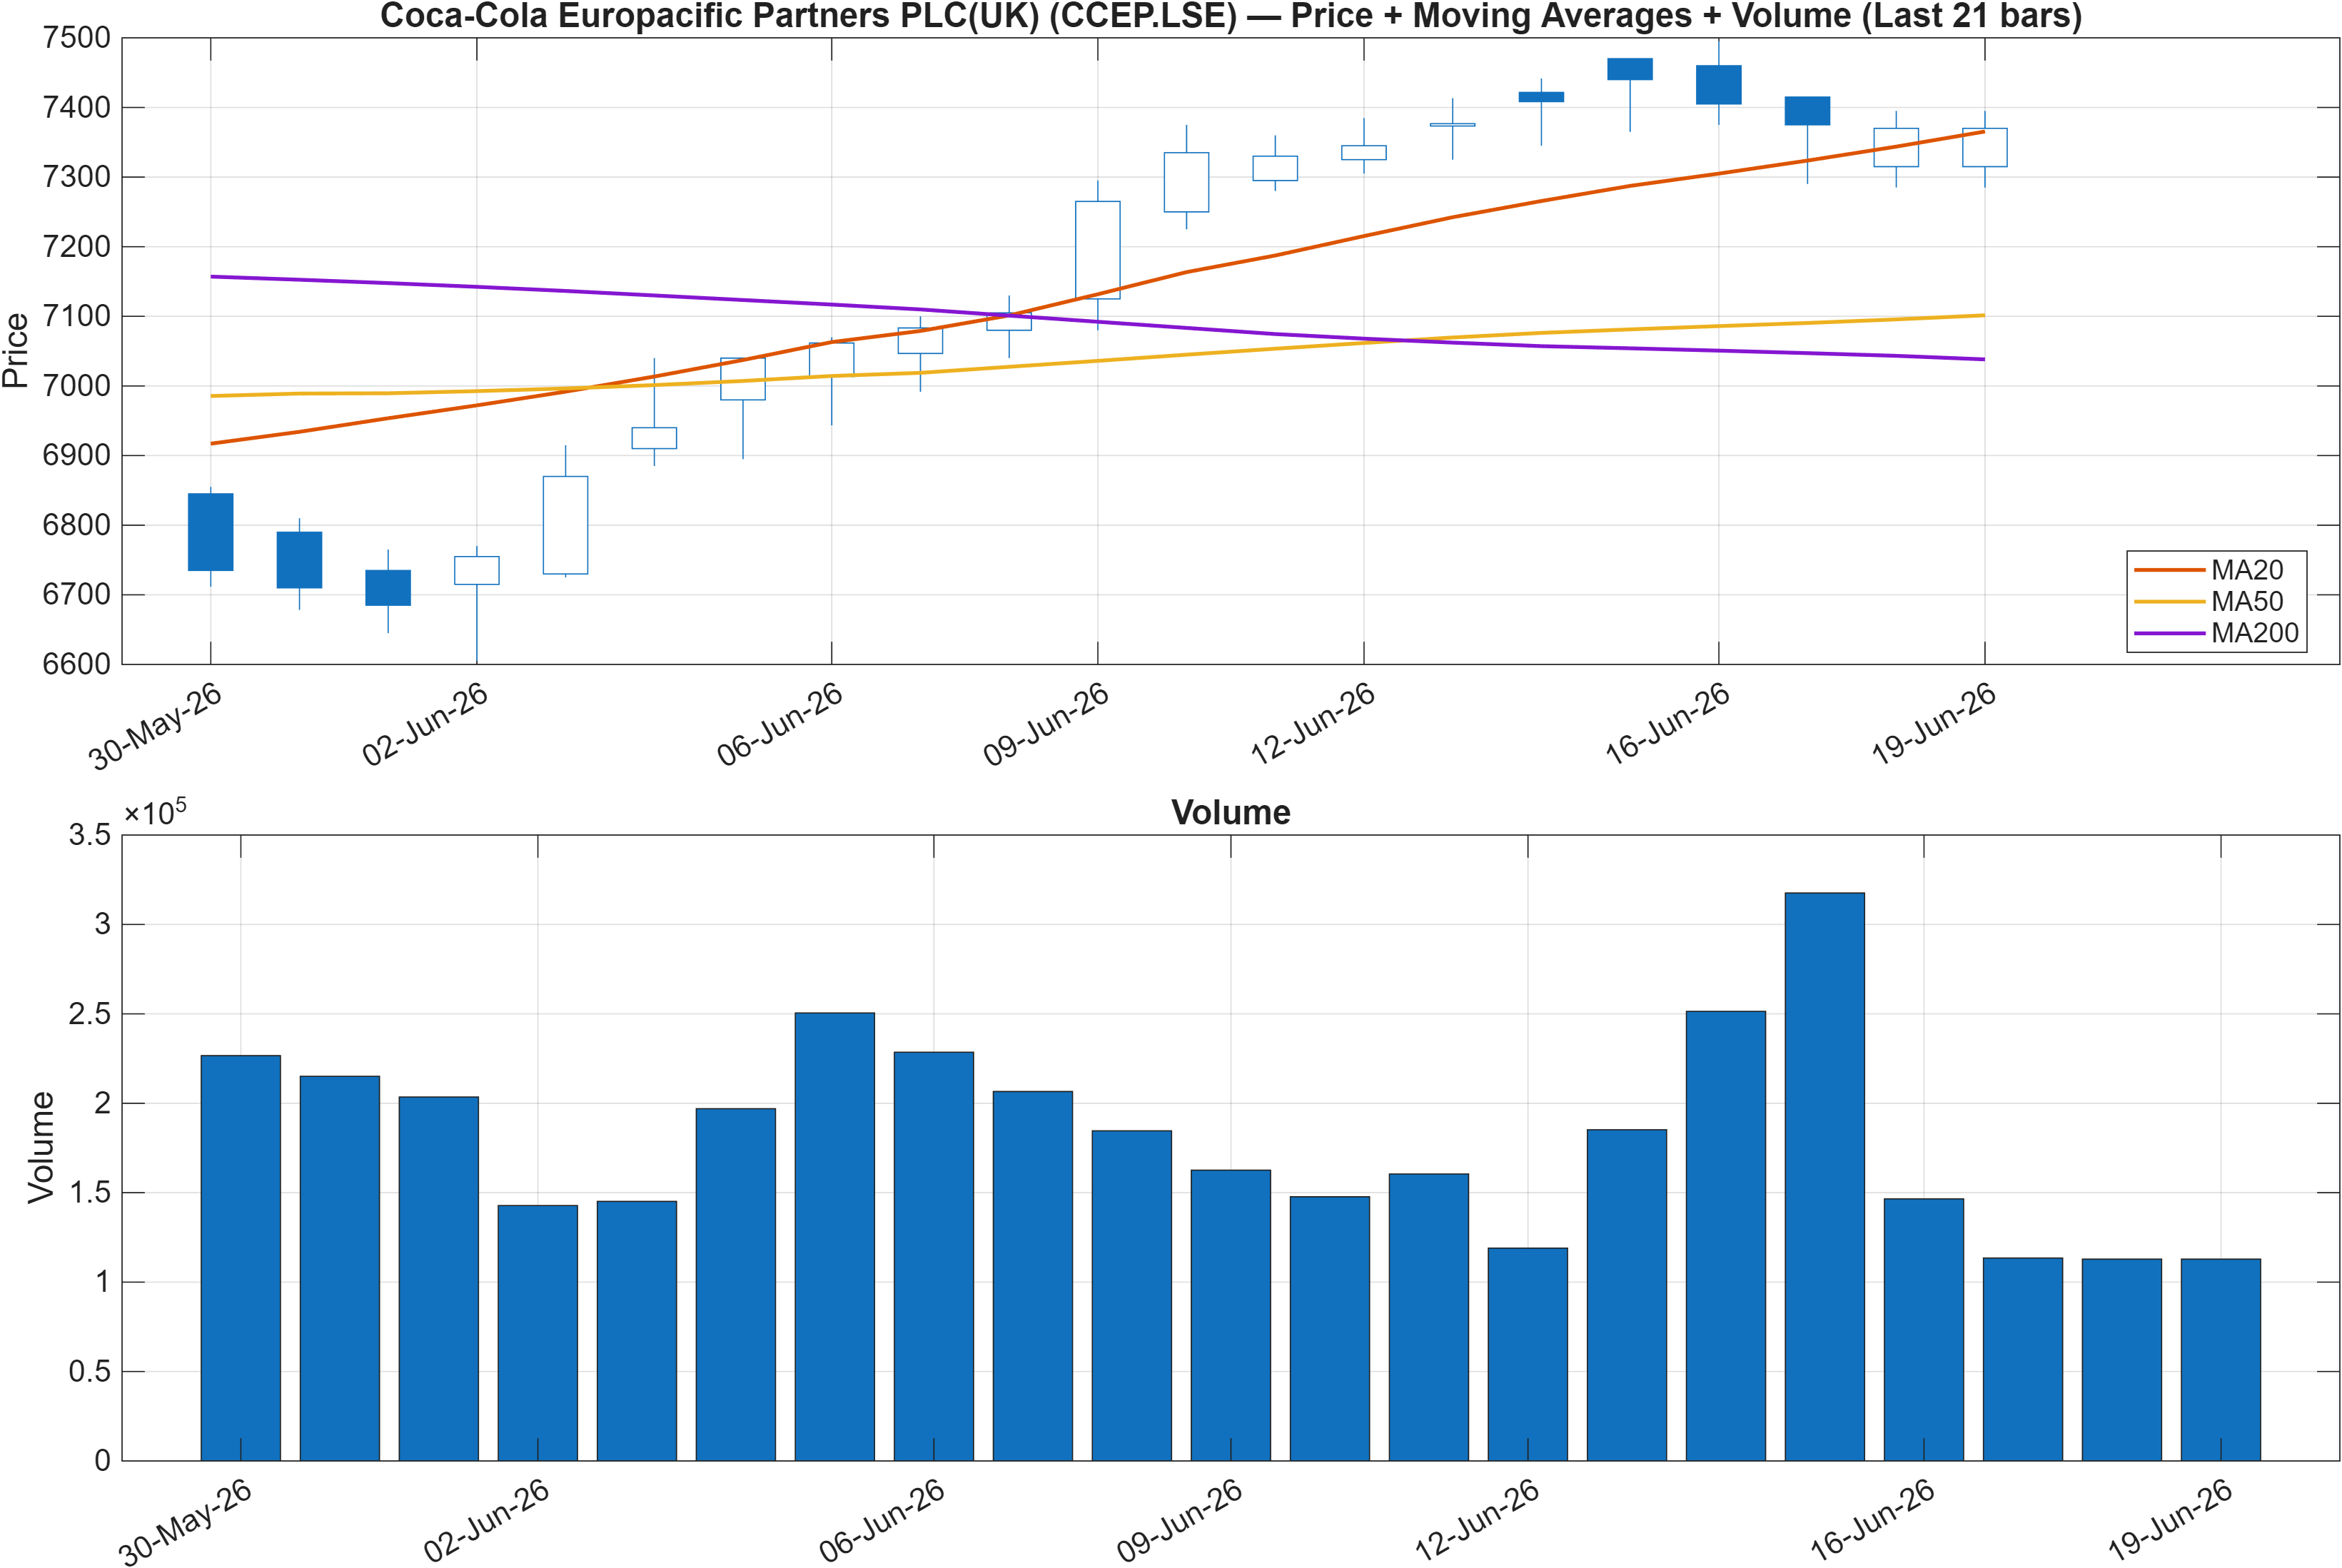
Trend confirmation: directional bias is positive, but requires level discipline
The trend read is constructive on standard market-structure definitions: close vs MA50 is bullish and MA50 vs MA200 is bullish. That combination generally signals that both the shorter trend and the longer trend are aligned, reducing the likelihood that strength is purely mean-reversion. In the context of the KGNAI ranks (weekly #47; 3-month #42), the moving-average structure acts as a mechanical confirmation layer rather than a separate, conflicting message.
The more nuanced question is whether the current advance is late-cycle within the trend or still in a phase where pullbacks remain shallow and bought quickly. In this dataset, momentum is clearly elevated (see RSI(14) at 84.38 in Section 3), which often coincides with trend persistence but can also increase sensitivity to short-term “air pockets” if liquidity/volume does not confirm. This matters because one signal in the 18-factor panel is explicitly bearish: Vol ROC(20) at -47.54. Negative volume rate-of-change can coexist with price strength, but it can also hint that marginal participation is not accelerating.
Structurally, the market is best framed as a bull trend with defined invalidation. The support/resistance map (support ~6686.6667; resistance ~7404.1667) becomes the practical gating mechanism: if the instrument is trending and simultaneously pressing toward resistance, the next “information event” for the tape is whether it can sustain acceptance above 7404.1667 without giving back the move. Conversely, losing 6686.6667 would challenge the idea that the MA-aligned uptrend remains dominant.
Interpretation: Close vs MA50 = Bullish, MA50 vs MA200 = Bullish.
3) Momentum & volatility dashboard
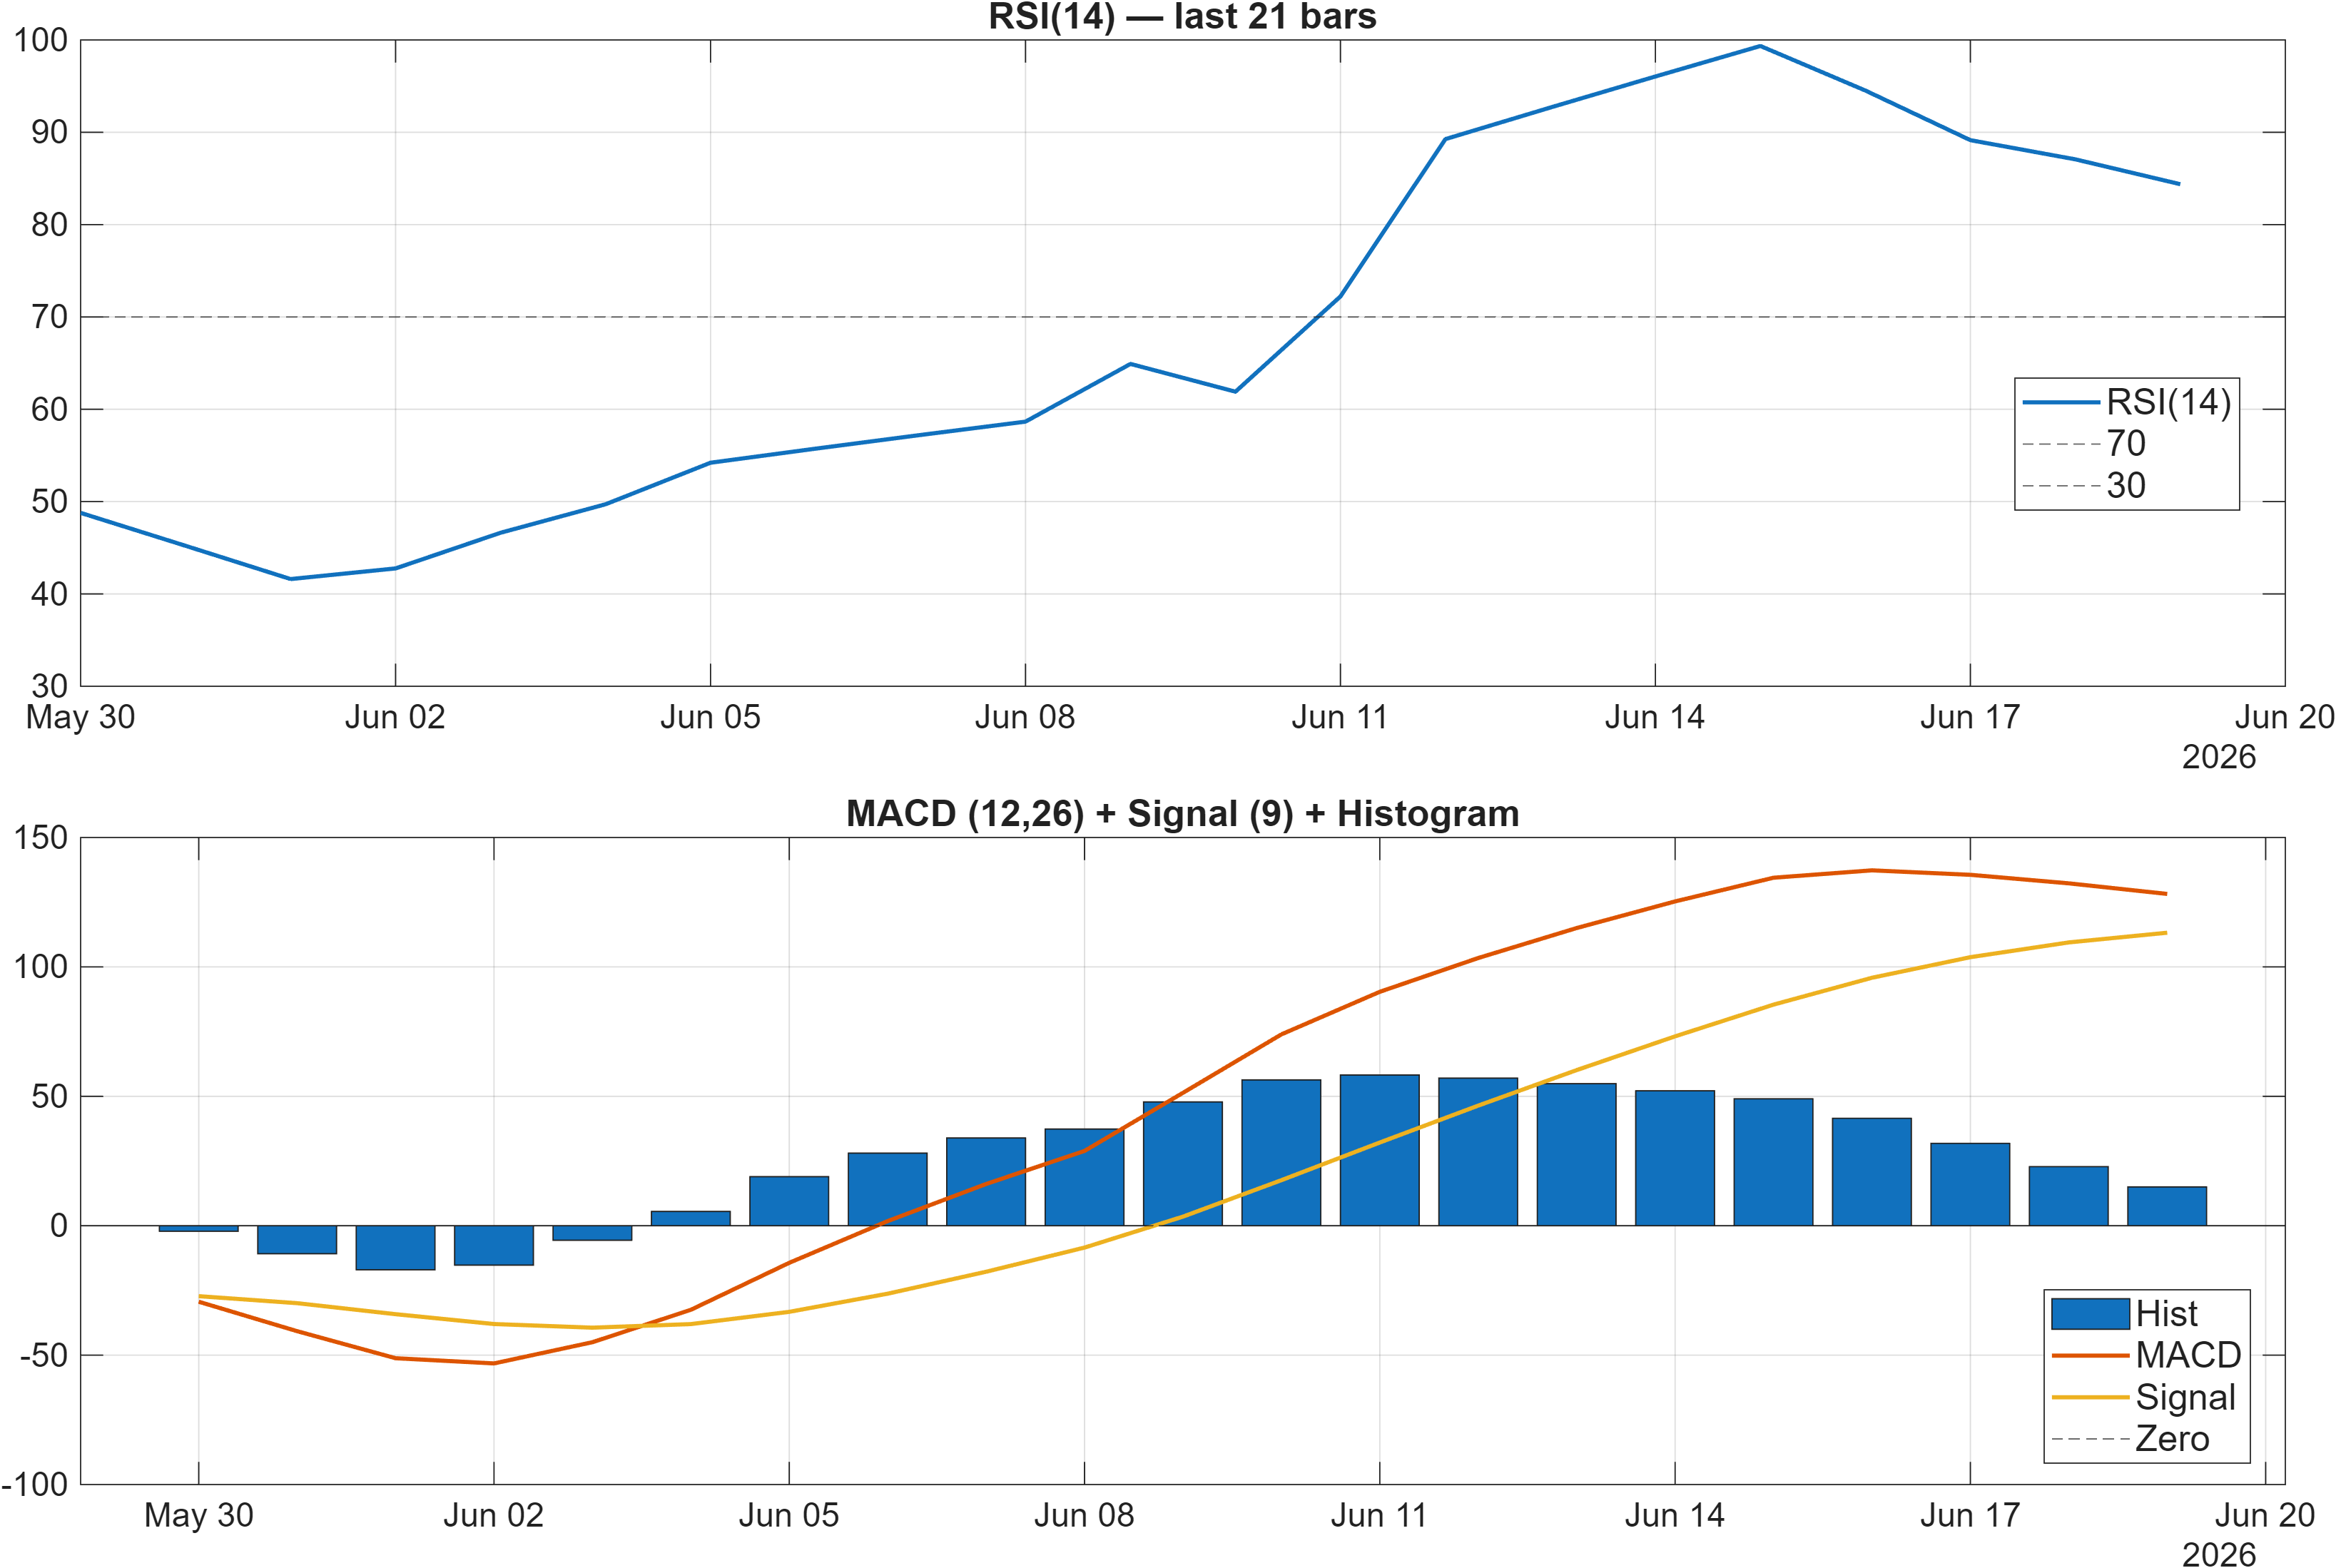
Interpretation: RSI bias = Bullish, MACD hist = 14.9871.
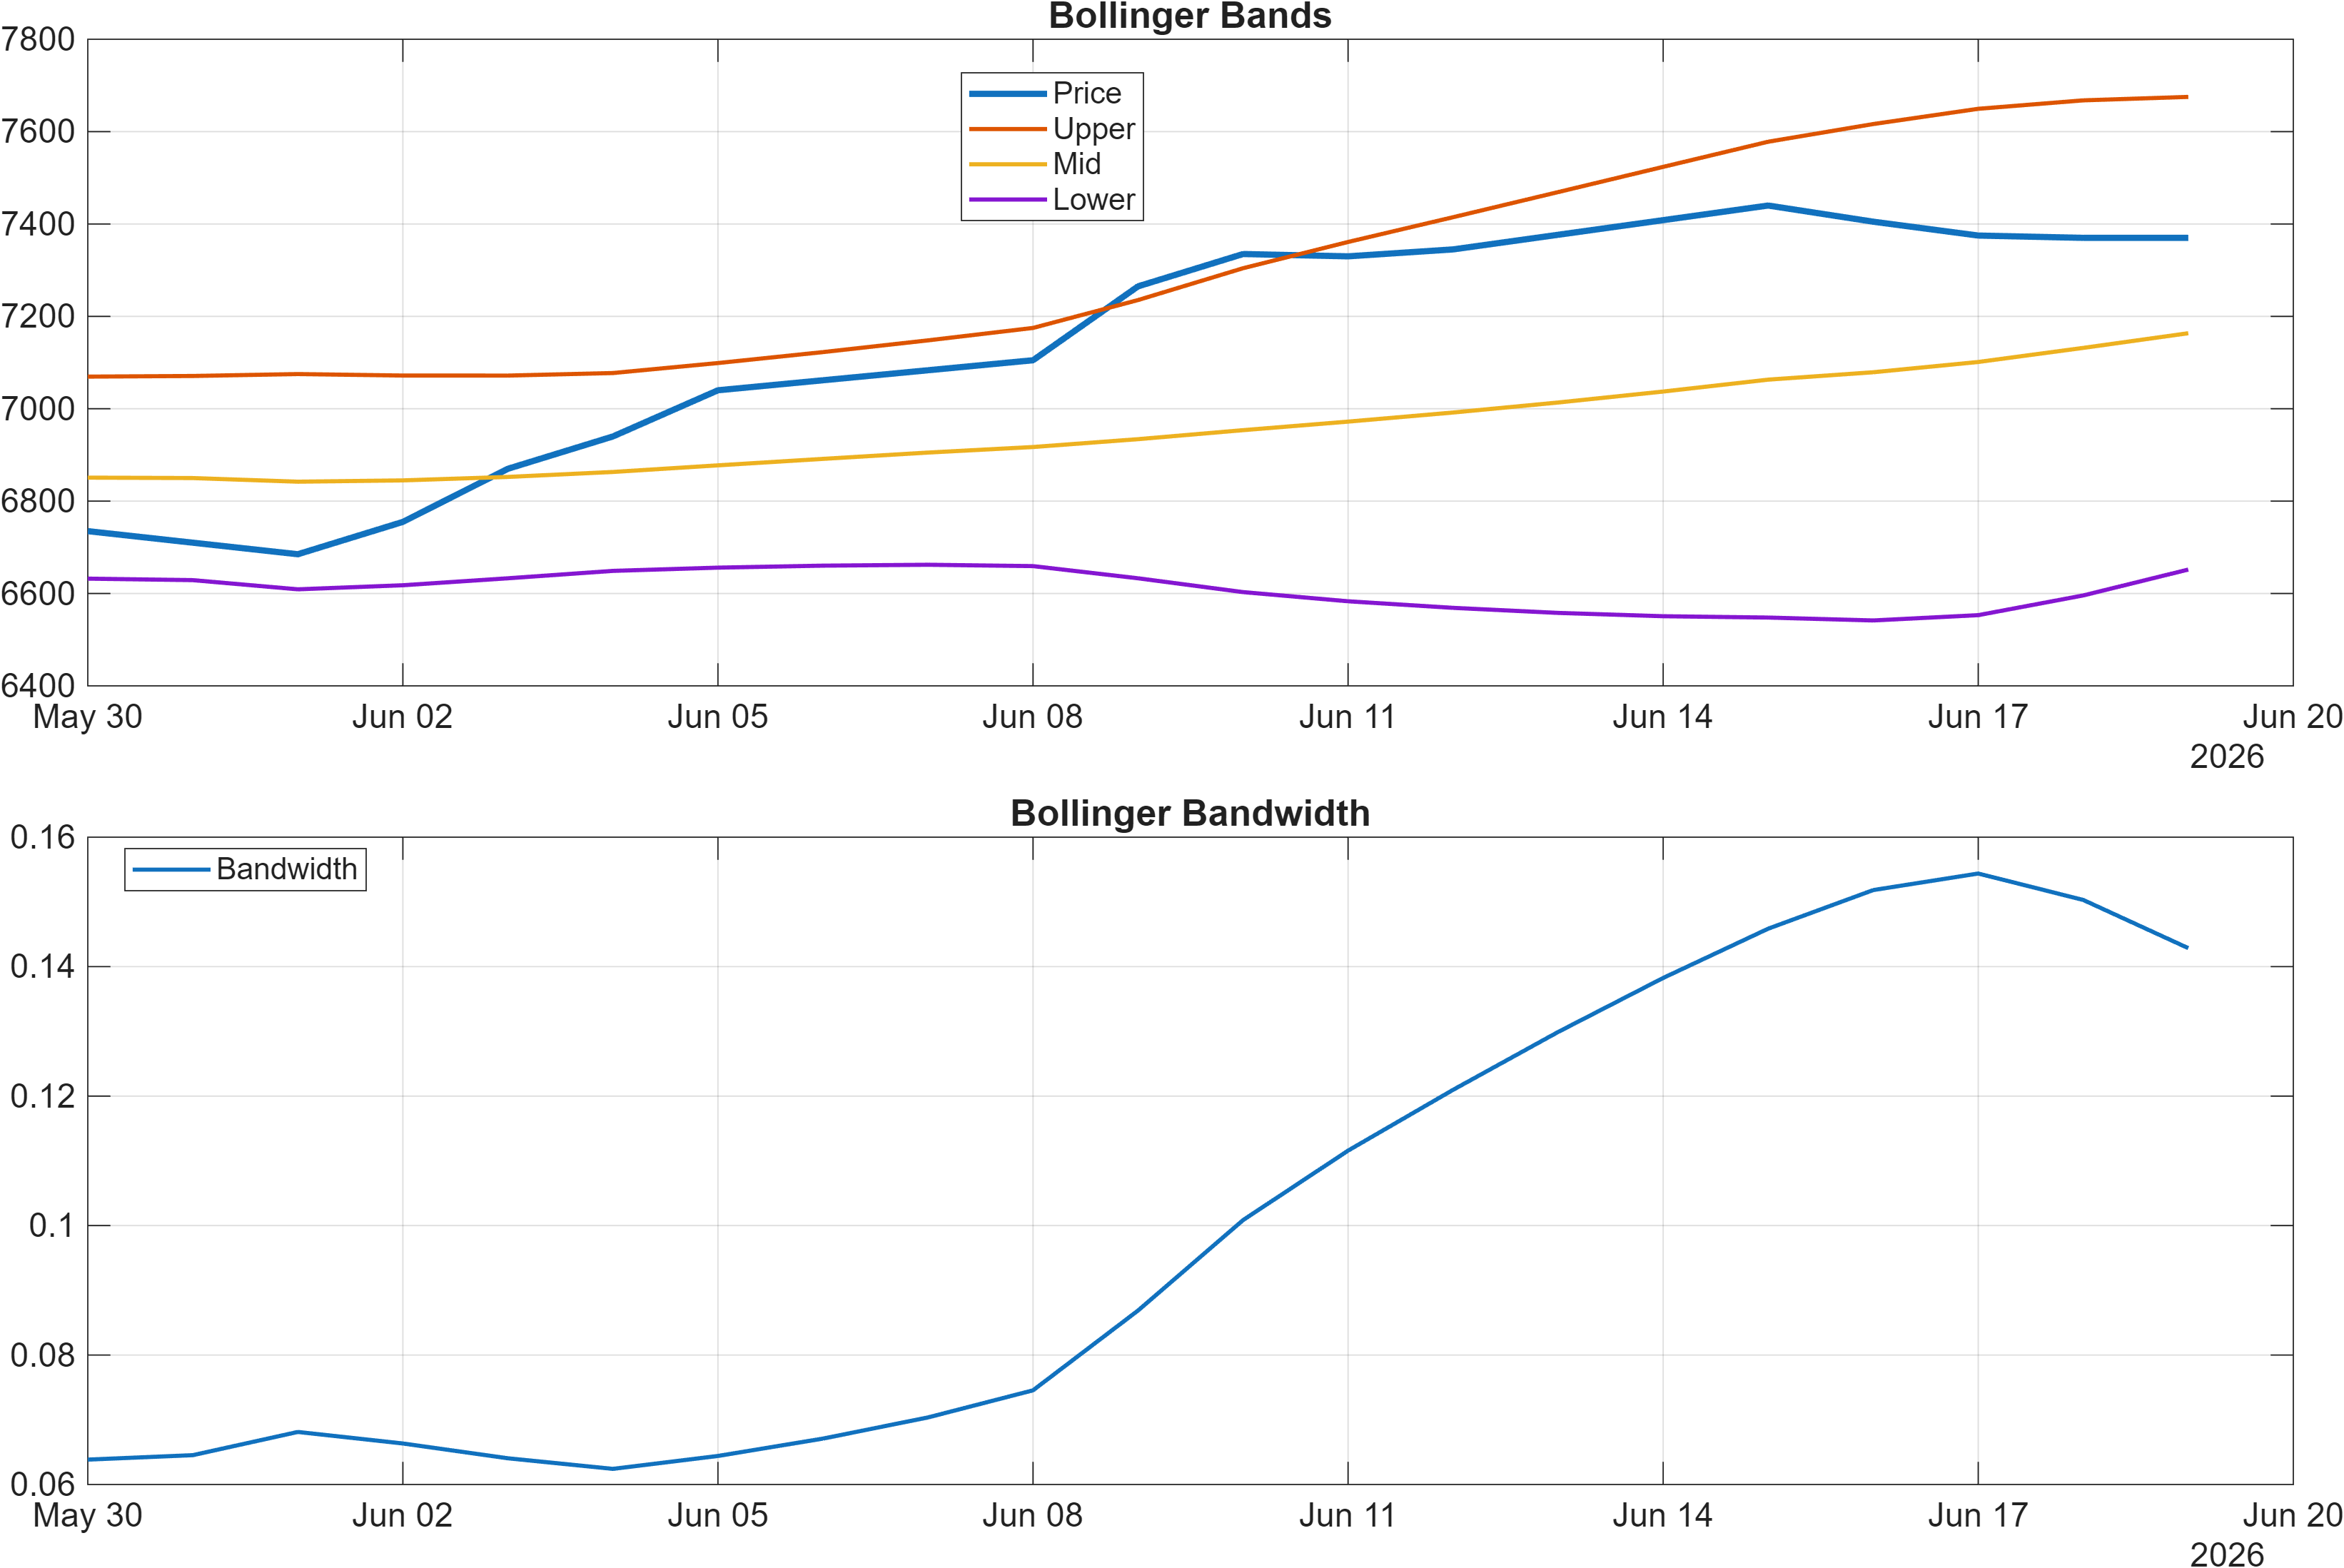
Interpretation: Bandwidth (volatility regime) latest = 0.1429.
Momentum extension vs. volatility containment
Momentum indicators are pointing in the same direction, but they are not expressing the same intensity. RSI(14) at 84.38 is consistent with a strongly bid market; it signals persistent upside pressure rather than a balanced two-sided regime. Meanwhile, the MACD histogram at 14.9871 is positive, supporting the view that upside momentum remains present rather than fading quietly beneath the surface.
Volatility, however, is not showing a parallel surge. The Bollinger bandwidth at 0.1429 reads as contained relative to a “breakout volatility” profile, which often implies one of two states: (1) a controlled advance where ranges remain orderly, or (2) a market that is extended on momentum without volatility expansion, which can become vulnerable if price stops grinding higher and volatility mean-reverts upward. The dataset also shows several volatility-adjacent signals as neutral (BB Width neutral; Chaikin Vol at -22.35 neutral), reinforcing the idea of momentum without clear volatility escalation.
Internally, the picture is closer to trend persistence with late-stage momentum than to a fresh impulse from a low-momentum base. That interpretation aligns with the rank structure—strong across weekly (#47) and 3-month (#42)—but it raises a practical monitoring question: whether momentum can remain elevated as the instrument interacts with resistance (~7404.1667), or whether momentum rolls over while volatility picks up. Either outcome would change the risk balance even if the longer moving averages remain bullish.
4) Support / Resistance zones
Support ~ 6686.6667 | Resistance ~ 7404.1667
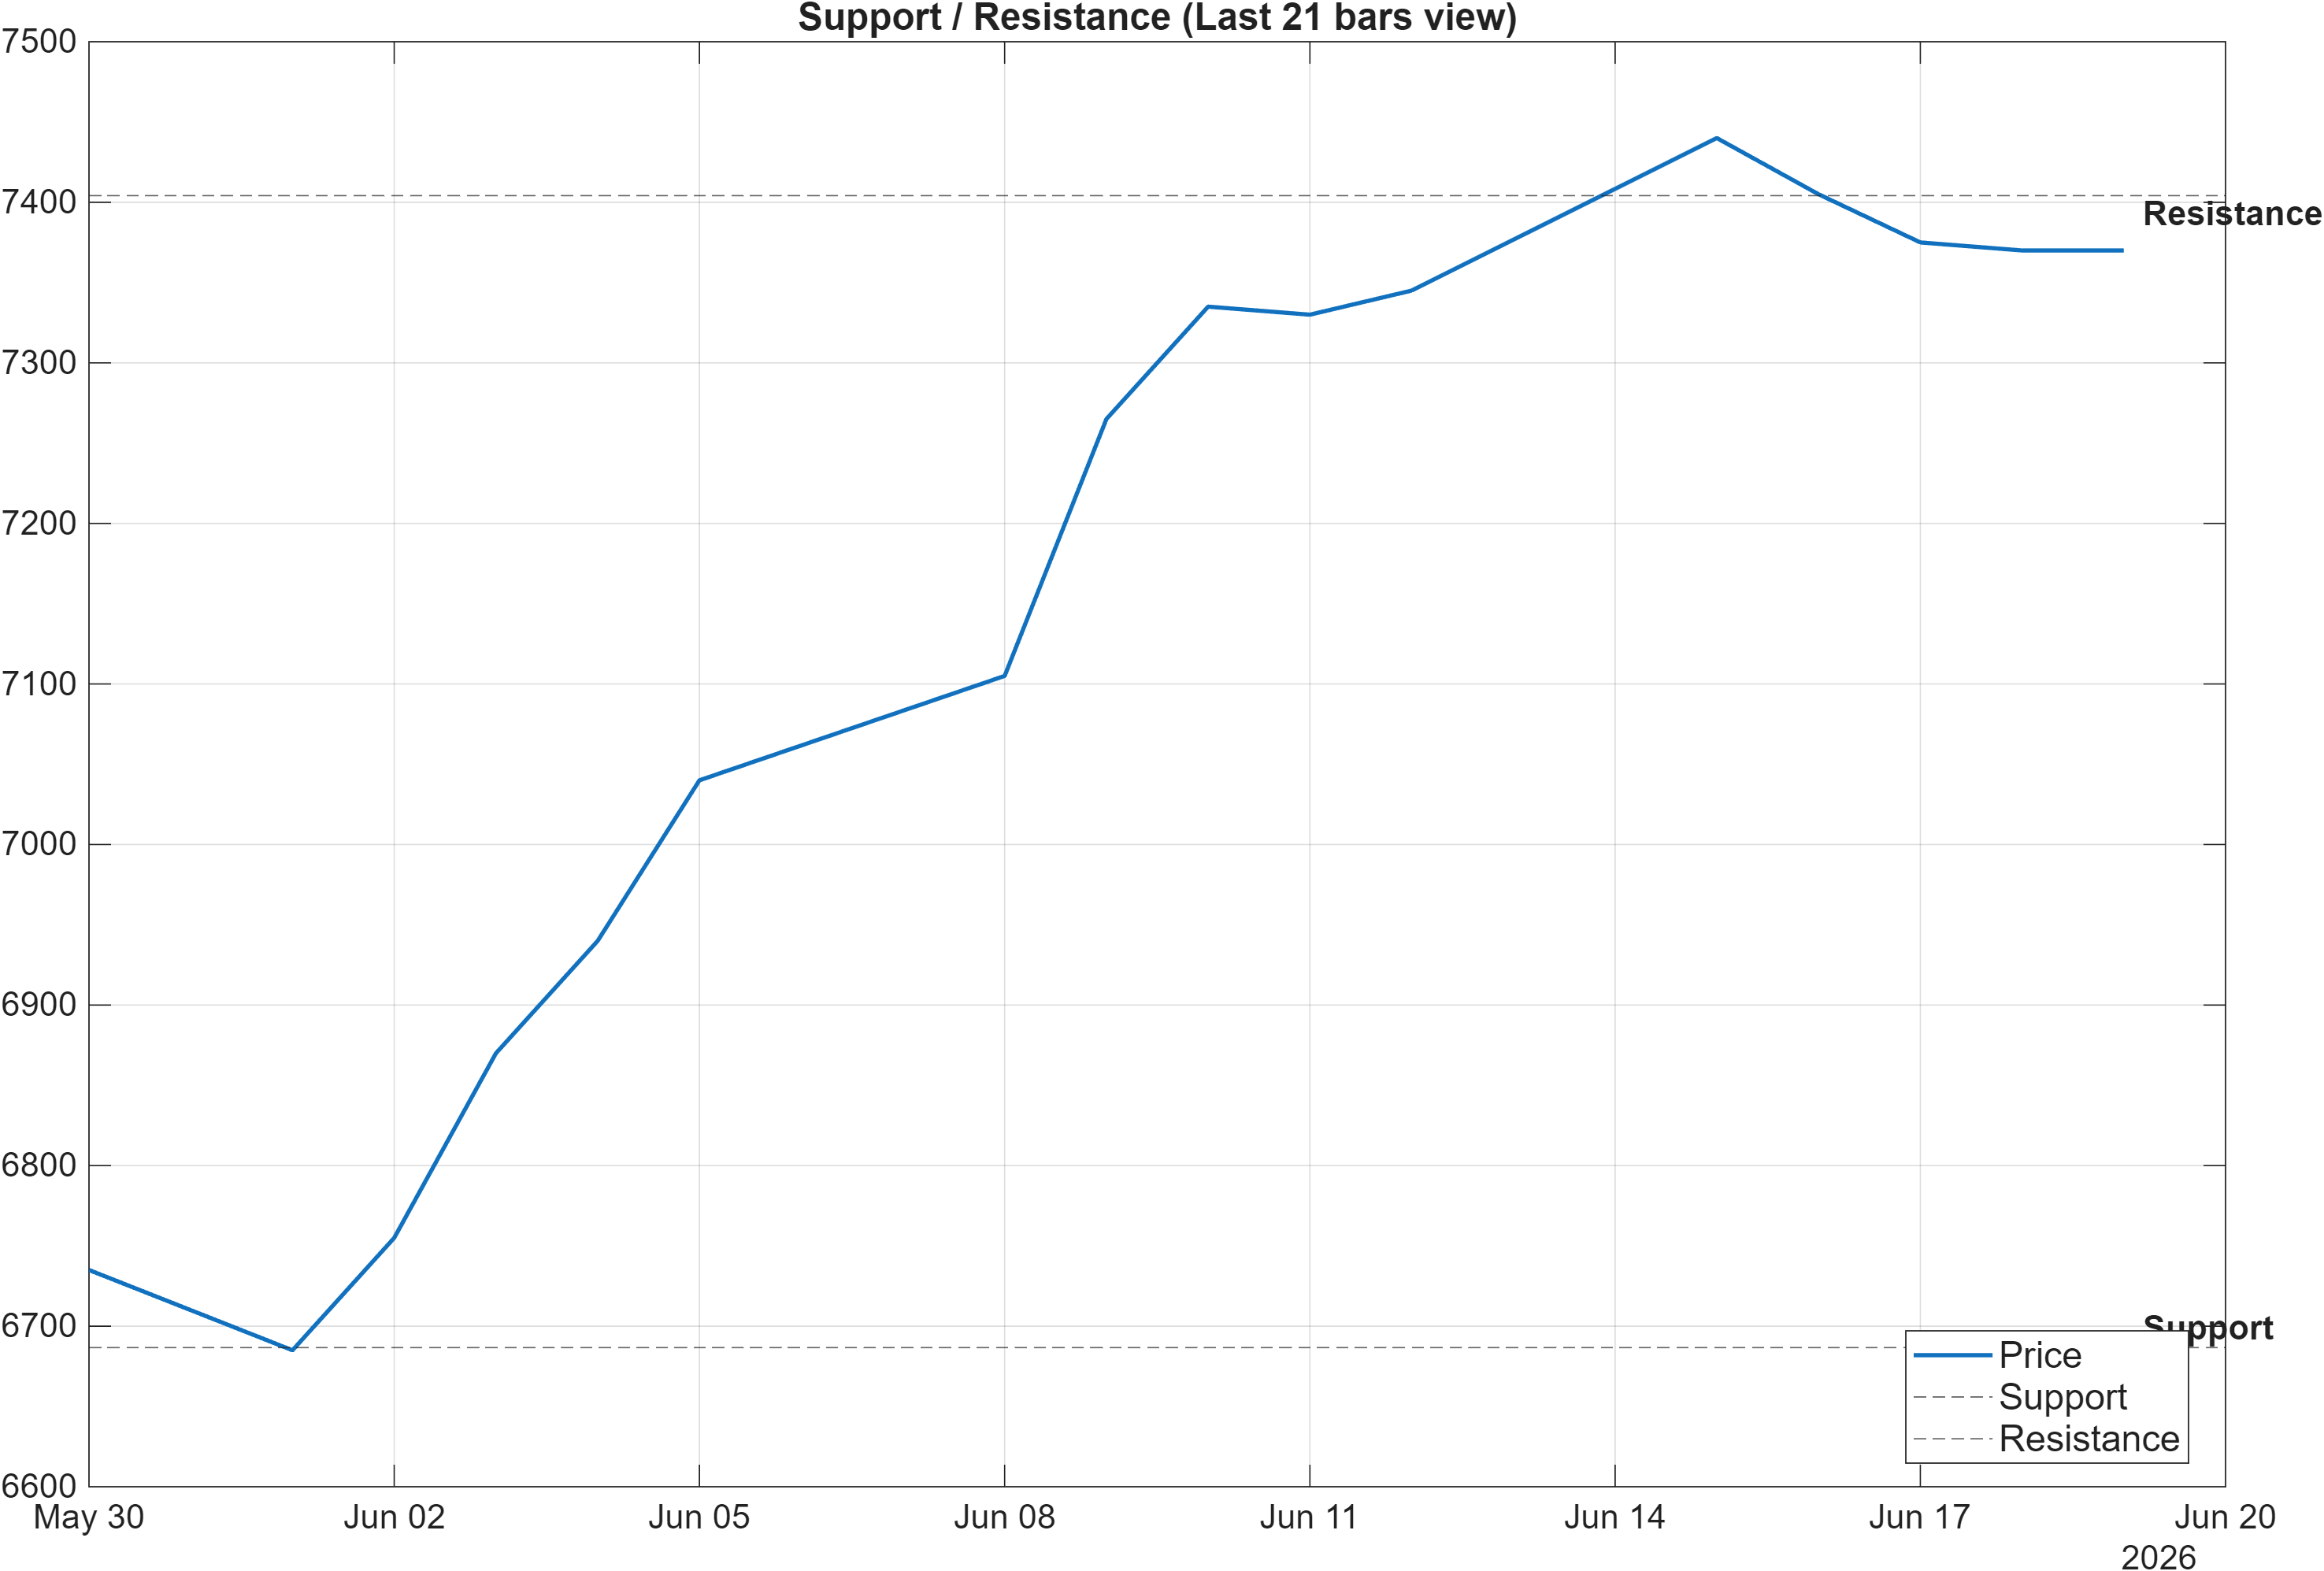
Decision zones: continuation test overhead, deterioration risk below
The level map is clean and relatively narrow in terms of decision-making: 6686.6667 defines the main downside reference, while 7404.1667 defines the overhead continuation gate. With trend signals bullish (close above MA50; MA50 above MA200) and momentum elevated (RSI(14) 84.38), resistance becomes more than a price ceiling—it becomes the zone where trend strength must translate into acceptance.
A key nuance in this dataset is that the broader 20-day structure is not signaling immediate breakdown risk: the 20-day low reference appears at LLOW(20) = 6605, which sits below the named support zone and provides a secondary context point for pullback tolerance. On the upside, the 20-day high reference is HHIGH(20) = 7495, slightly above resistance, implying the market has recently explored higher levels; whether it can hold above 7404.1667 is therefore a question of sustainability rather than discovery.
From a market-structure standpoint, this is a classic “risk-defined” configuration. If price remains above 6686.6667, the broader alignment across ranks (weekly #47; 3-month #42) and technical confluence (0.611) remains coherent. If price closes below 6686.6667, the note’s main risk is not that every signal flips immediately, but that the move would represent a regime transition: momentum extension would be forced to unwind, and neutral-to-bearish undercurrents (e.g., Vol ROC(20) -47.54) could become more influential.
Scenario view: Break above resistance with volume → continuation. Close below support → signal deterioration risk.
5) Quant Technical Dashboard (18 Signals)
KGNAI AI Technical Analysis Score (Deep Reinforcement Learning): Rank #544 out of 1396 (Rank 1 represents the strongest technical positioning and a higher probability of favorable price behavior. As ranks increase toward the maximum, the probability of favorable outcomes weakens and bearish positioning becomes more dominant.) | Label: Neutral | Score: 0.221
18-Signal Technical Confluence Score: 0.611 (Bullish)
Overall Technical Score (18-signal confluence + DRL rank blend): 0.494 (Bullish)
Note: The blended score reflects signal strength weighted against broader AI technical ranking, which may temporarily diverge.
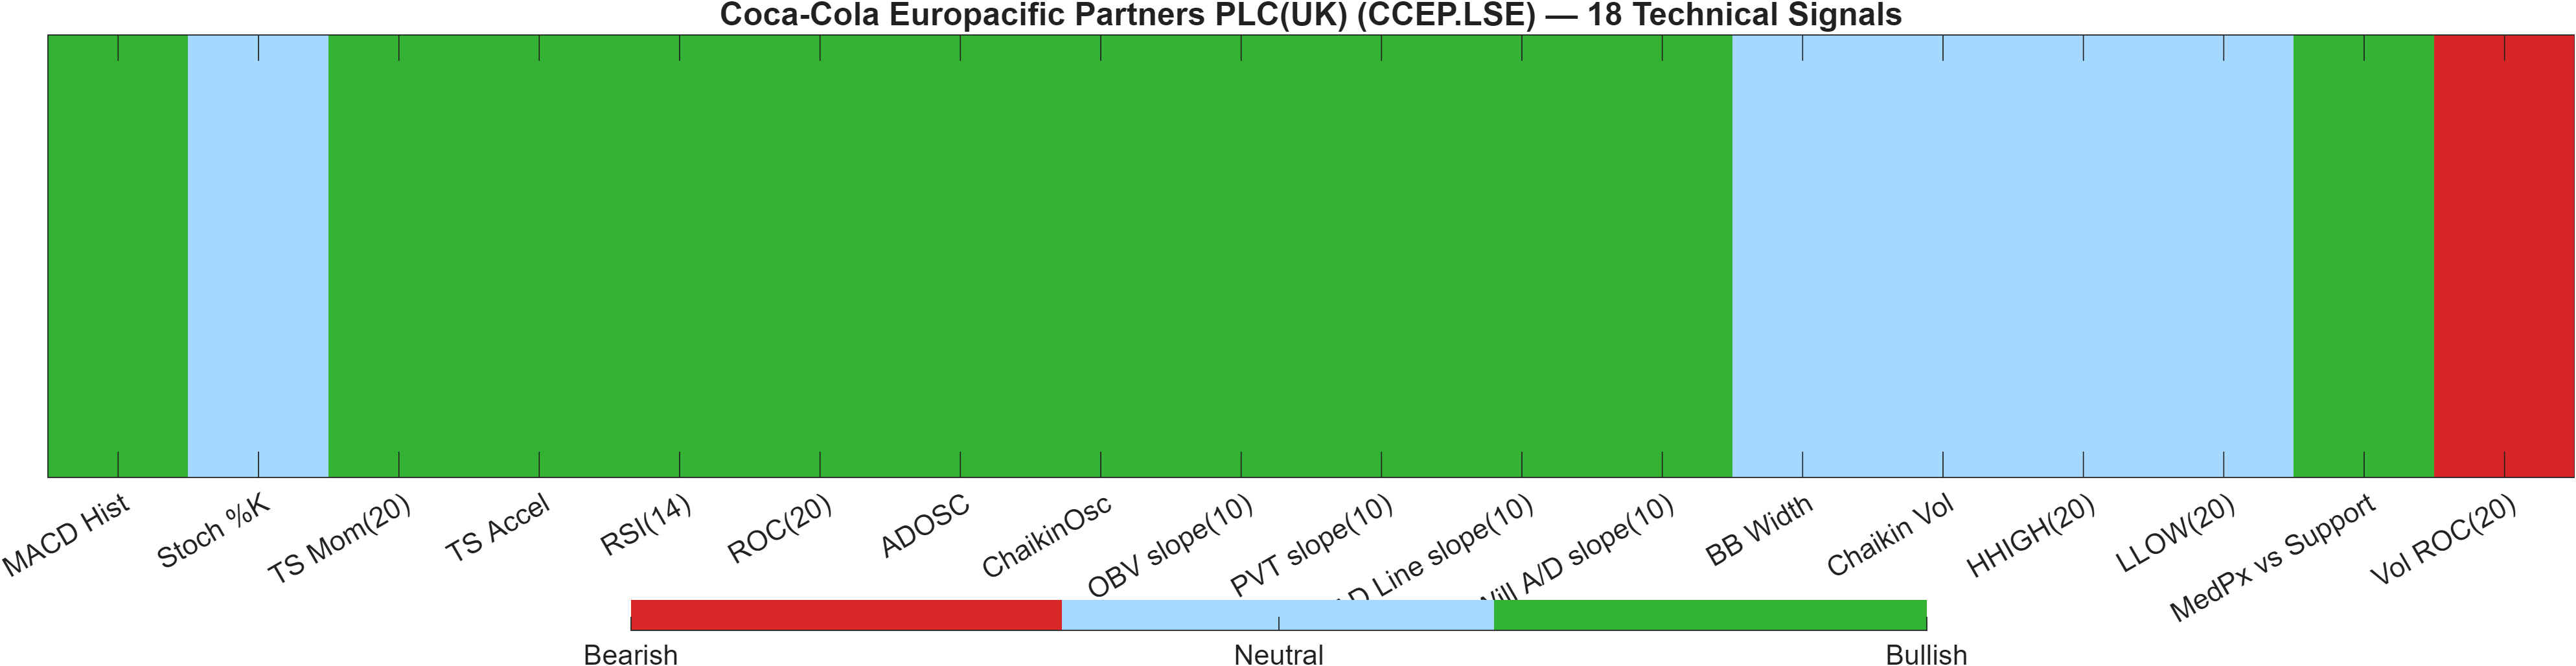
Blended technical score breakdown: 0.494 (Bullish | Bull 12 / Bear 1 / Neutral 5)
Confluence vs. model divergence: why “bullish” can still carry friction
The 18-signal layer is decisively constructive: confluence score 0.611 (Bullish) with Bull 12 / Bear 1 / Neutral 5. That breadth matters because it reduces dependency on any single indicator; multiple, independent measures are leaning the same way. The blended result remains bullish as well (overall technical score 0.494), indicating the aggregate technical state is supportive even after model blending.
The main friction point is the separate Deep Reinforcement Learning technical rank: #544 out of 1396, labeled Neutral with a score of 0.221. This is not a contradiction that automatically invalidates the bullish confluence; instead, it suggests that while many classic signals are favorable, the broader AI technical ranking framework (which may emphasize different pattern/behavior features) is less convinced at this exact moment.
Looking under the hood, momentum is clearly a driver: RSI(14) 84.38 (Bullish) and ROC(20) 9.836 (Bullish) push the dashboard toward trend-following conditions. At the same time, participation is not uniformly reinforcing: Vol ROC(20) -47.54 is the lone bearish signal, consistent with the idea that price strength may be occurring without accelerating volume. In that environment, the most robust technical stance is typically conditional: confluence remains favorable while price holds the support regime (6686.6667) and while momentum does not abruptly compress.
Signal table (Bull/Bear/Neutral)
| Indicator | Value | Signal |
|---|---|---|
| MACD Hist | 14.99 | Bullish |
| Stoch %K | 53.7 | Neutral |
| TS Mom(20) | 660 | Bullish |
| TS Accel | 865 | Bullish |
| RSI(14) | 84.38 | Bullish |
| ROC(20) | 9.836 | Bullish |
| ADOSC | 75 | Bullish |
| ChaikinOsc | 1.747e+05 | Bullish |
| OBV slope(10) | 4.876e+05 | Bullish |
| PVT slope(10) | 3567 | Bullish |
| AD Line slope(10) | 4.453e+05 | Bullish |
| Will A/D slope(10) | 155 | Bullish |
| BB Width | 0.1429 | Neutral |
| Chaikin Vol | -22.35 | Neutral |
| HHIGH(20) | 7495 | Neutral |
| LLOW(20) | 6605 | Neutral |
| MedPx vs Support | 653.3 | Bullish |
| Vol ROC(20) | -47.54 | Bearish |
Interpretation: Indicator-level signals form the base confluence, which is then adjusted using a separate AI-driven technical ranking model. The final technical score summarizes this combined view.
6) News sentiment + extractive gist
Note: Instrument-specific news matches were not found, so the digest includes broader market/sector headlines. Links are provided for verification.
Sentiment score (avg): 0.000 | Positive: 0% | Neutral: 100% | Negative: 0%
KGNAI AI News Sentiment Score (normalized -1 to +1): Not available (as of —) | Label: Not available | Overall news score: 0.00
Positive Developments
Recent coverage across major financial outlets is dominated by macro and geopolitical narratives rather than CCEP.LSE-specific catalysts, which explains the dataset’s fully neutral sentiment split (0.000 average; 100% neutral). Even so, a constructive interpretation for markets is that risk discussions are being processed without an immediate shift in the model’s sentiment polarity. For an instrument with bullish ranks across timeframes (weekly #47; 3-month #42) and a bullish technical confluence score (0.611), a neutral news backdrop can function as a stabilizer: price is less likely to be “explained away” by a single headline impulse and more likely to reflect endogenous positioning. In this context, trend-following inputs—such as MA alignment and positive MACD histogram (14.9871)—remain the primary drivers in the KGNAI framework.
Neutral / Mixed Developments
The provided digest indicates a mix of informational themes (diplomacy, policy direction, and economic demand commentary) that are not clearly pro- or anti-risk on their own. That matches the neutral classification and the absence of an available normalized sentiment score. For CCEP.LSE specifically, this neutrality means the technical map should carry more weight: RSI(14) at 84.38 signals a momentum-extended market, while Bollinger bandwidth at 0.1429 suggests volatility has not expanded aggressively. Mixed macro narratives can keep investors focused on execution at key levels—support ~6686.6667 and resistance ~7404.1667—rather than repricing the instrument due to sector-specific surprises (not available in the provided data).
Negative / Risk Signals
Risk-sensitive reporting themes (geopolitical tension and softer growth tone) can raise background volatility even when the immediate sentiment score remains neutral. The key technical risk is therefore indirect: if broader risk appetite contracts, momentum-heavy setups can react more sharply, particularly when one participation measure is already weak. In the 18-signal table, Vol ROC(20) is bearish at -47.54, which can be consistent with a market that advances without increasing turnover. If macro risk triggers a volatility response, momentum can compress quickly even with trend still intact, turning the support zone (~6686.6667) into the primary “line in the sand.” In this dataset, there is no quantified negative sentiment tilt (Negative 0%), but the regime remains sensitive to external risk shocks.
- Whether price can sustain acceptance above 7404.1667 without volatility expansion beyond the current bandwidth (0.1429).
- Whether momentum cools from RSI(14) 84.38 while support (6686.6667) remains intact.
- Whether participation improves from the bearish Vol ROC(20) -47.54 reading as the market tests key levels.
Snapshot: AI Rank (Short–Mid–Long): Bullish (Bullish–Bullish–Bullish) · Technical Confluence: Bullish · Key Levels: Support ~6686.67 | Resistance ~7404.17 · News Sentiment: Neutral
Sources referenced: Reuters, Bloomberg, Yahoo Finance, MarketWatch, Investing.com
7) Sources
- Iran postponed US talks due to Israeli strikes on Lebanon, diplomats say — https://www.ft.com/content/9cd814af-6144-4646-ad1c-a6292391e613
- Reaching a nuclear deal with Iran will be much harder than in 2015 — https://www.ft.com/content/8c4d2158-c681-4c44-92f2-b05476d8eaed
- Xi wants China to boost demand. Why isn’t it working? — https://www.ft.com/content/7db72916-3f9f-42c6-bd28-b5c7f51ed573
- The world may not like Trump’s Gaza plan — but there is no alternative — https://www.ft.com/content/2472e584-758b-4a3f-83d1-9fba042a9312
- Are insurers becoming dangerously addicted to private credit ratings? — https://www.ft.com/content/bfcb04a7-8e13-480a-aa59-a13dee53c698
- Burnham storms to by-election victory in challenge to Starmer — https://www.ft.com/content/095b3f3d-8c66-46fa-bb2a-1b8186f3f054
- Starmer says he would stand in a Labour leadership race — https://www.ft.com/content/44e1e71d-dcd2-4935-a14b-b14ed3b24bf8
- EU official’s outreach to Russia backfires — https://www.ft.com/content/e8b5bd9f-c664-4455-be03-b4be6bb153f0
You may also like: How KGNAI AI ranks instruments across global markets
Disclaimer: KGNAI provides AI-generated analytics and educational market commentary only. This is not financial advice. Markets involve risk. Always do your own research.