
ENO.MC (Elecnor S.A.) Technical & Rank Outlook — 21-Jun-2026 | Long-term strength, short-term technical stress
Elecnor S.A. (ENO.MC) presents a split profile on 21-Jun-2026: longer-horizon KGNAI ranks remain strong while nearer-term technical conditions lean risk-off. The 6-Monthly rank (#20 out of 1396) and 3-Monthly rank (#78) sit in the top decile/upper tier of the tracked universe, but the Weekly rank (#1326) is in the lower tail, signaling near-term fragility. This tension is reinforced by technical blends: the 18-signal confluence is -0.444 and the blended overall technical score is -0.541, both labeled Bearish, while the MA regime is mixed (Close vs MA50 Bearish; MA50 vs MA200 Bullish). Momentum indicators add to the caution with RSI(14) at 35.3 and MACD histogram at -0.1978. Key decision zones cluster around support ~36.3083 and resistance ~41.2917, with a neutral distribution in the news digest (0% positive / 100% neutral / 0% negative).
- Rank stance: Short-term Bearish | Mid-term Neutral | Long-term Bullish
- Technical confluence: Bearish (Overall Technical Score -0.541; DRL rank #1232)
- Key levels: Support 36.3083 | Resistance 41.2917
- News sentiment bias: Neutral (avg 0.000; distribution 100% neutral)
- Confirmation / invalidation: A break above 41.2917 with volume would favor continuation; a close below 36.3083 increases deterioration risk.
KGNAI evaluates assets using large cross-sectional datasets built from millions of structured data points. Inputs incorporate fundamental metrics, technical structures, and systematically processed news sentiment. Statistical models, machine learning, and AI frameworks are used to assess relative positioning, signal alignment, and probabilistic behavior across broad universes.
- Ranks are comparative across the tracked universe, not absolute price targets.
- Confluence reflects alignment among independent signal groups.
- Support/resistance levels are probabilistic decision zones, not guarantees.
- Sentiment provides contextual bias within the broader analytical framework.
1) KGNAI AI Analysis
Region: EUROPE
Total universe size: 1396 ranked instruments
- Daily rank: #873 out of 1396 — Neutral
- Weekly rank: #1326 out of 1396 — Bearish
- Monthly rank: #646 out of 1396 — Neutral
- 3-Monthly rank: #78 out of 1396 — Bullish
- 6-Monthly rank: #20 out of 1396 — Bullish
- Yearly rank: #162 out of 1396 — Bullish
ENO.MC’s rank curve is best read as a regime split: strength persists in longer windows while short-term positioning has weakened sharply. The 6-Monthly rank (#20) indicates top-decile relative standing, consistent with a longer-horizon uptrend profile still being recognized by the model. The 3-Monthly rank (#78) also remains bullish, reinforcing that the intermediate structure has not fully broken from a cross-sectional perspective.
The near-term picture is more defensive. The Weekly rank (#1326) sits deep in the lower tail of the 1396-instrument universe, suggesting a recent deterioration in the probabilistic profile that the ranking tests capture (trend, momentum, and related statistical behavior). Meanwhile the Daily rank (#873) and Monthly rank (#646) are neutral, which often appears when short-term stress is present but not yet resolved into a stable reversal or a renewed continuation signal.
This configuration generally implies higher sensitivity to confirmation from independent technical groups: if short-horizon measures stabilize, the longer-horizon bullish ranks can reassert more cleanly; if weakness persists, the longer-horizon strength becomes increasingly “legacy” and vulnerable to mean-reversion pressure. The published term view remains: Short-term Bearish, Mid-term Neutral, Long-term Bullish.
KGNAI ranks each instrument across large universes using multiple proprietary AI tests and statistical models (millions of data points). Lower ranks generally indicate stronger probability of favorable performance behavior, while higher ranks indicate weaker probability and more bearish positioning.
Term view: Short-term: Bearish. Mid-term: Neutral. Long-term: Bullish.
Want the full universe and complete rank tables? Unlock full access on KGNAI: https://www.kgnai.com/pricing
2) Price & trend overview
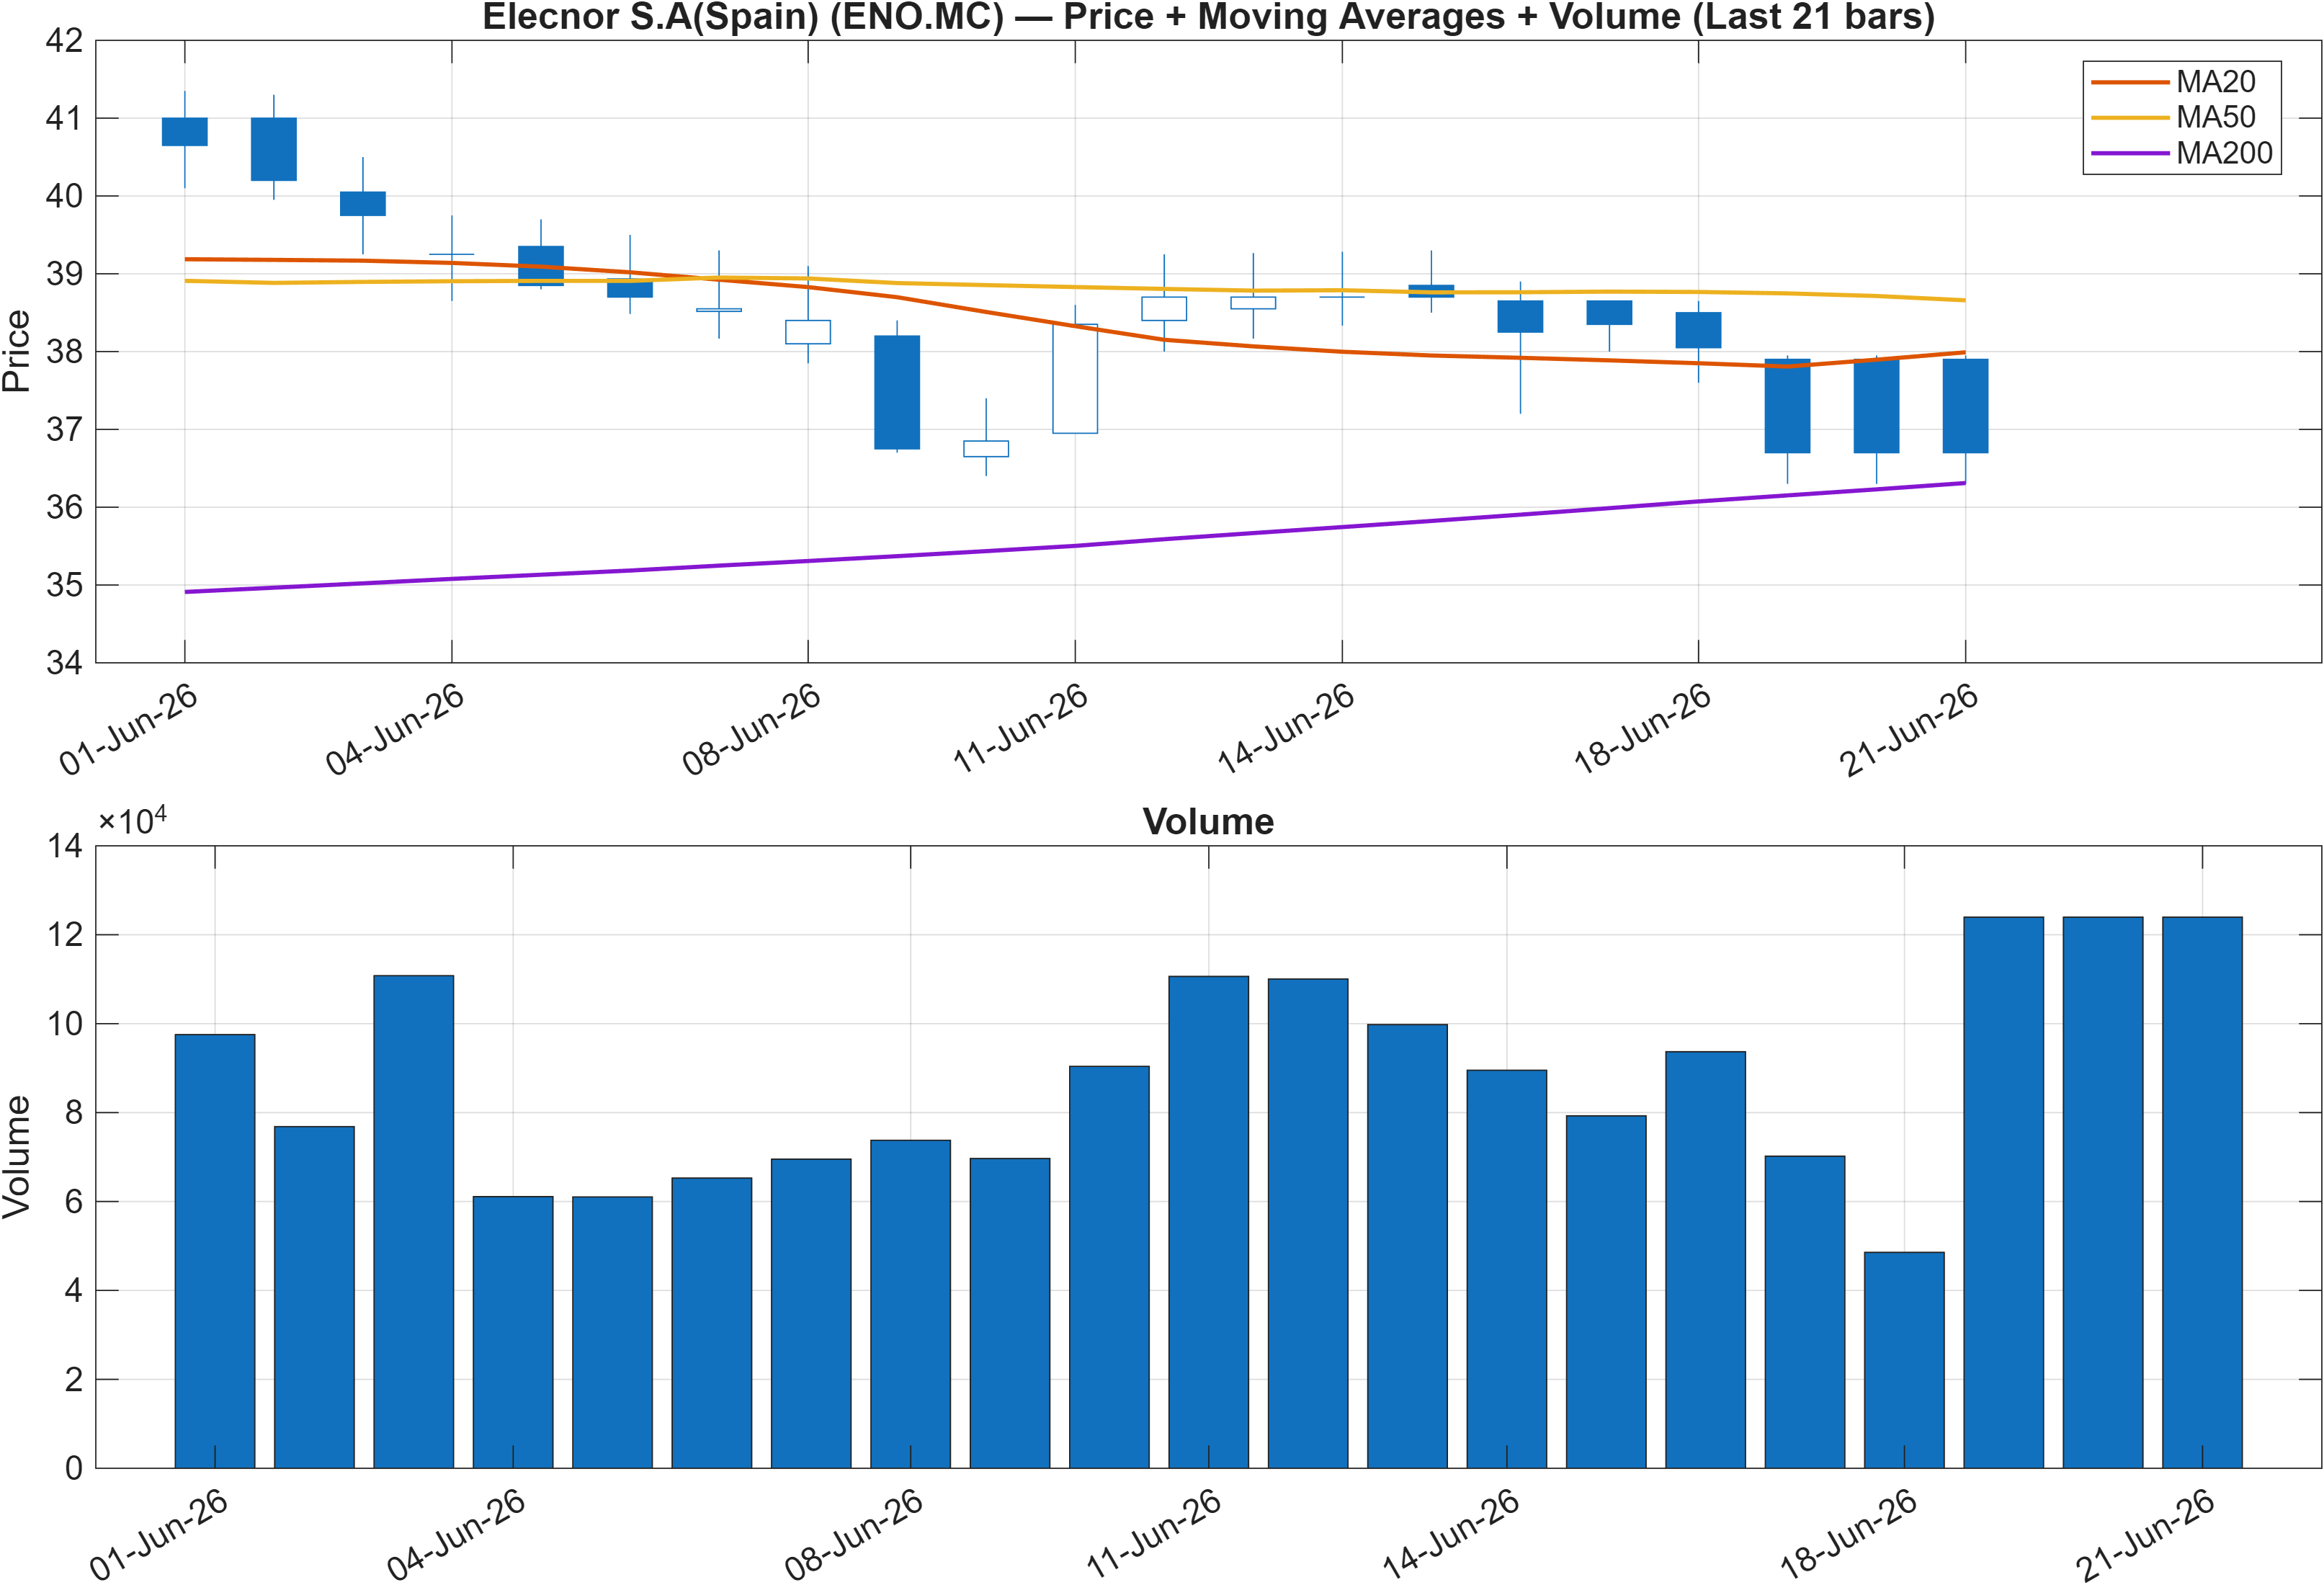
The moving-average configuration communicates conflict rather than clean trend consensus. The note “Close vs MA50 = Bearish” points to price trading below its 50-day moving average, a condition commonly associated with soft near-term trend control and more frequent failed rallies. At the same time, “MA50 vs MA200 = Bullish” indicates the 50-day remains above the 200-day, consistent with a longer-horizon uptrend structure not yet fully unwound.
When this split appears alongside the rank profile—6-Monthly #20 versus Weekly #1326—it often reflects a market transitioning from trend continuation to a late-cycle consolidation or corrective phase. The key question is whether the current pullback is corrective within a broader uptrend, or the early stage of a deeper reset that eventually drags the MA50 down toward the MA200.
In this regime, trend confirmation tends to depend on the market’s ability to reclaim and hold above shorter moving averages while preserving higher-timeframe structure. The nearby technical thresholds later defined by support ~36.3083 and resistance ~41.2917 become practical “decision zones” for interpreting whether the price is regaining trend integrity or remaining pinned in a distribution-like state.
Volume context is embedded in Figure 1, and it matters because reclaiming a moving-average structure without supportive participation can fail quickly. Consistent with the broader dashboard, trend is best described as longer-term constructive but tactically pressured until additional confirmation arrives from momentum and level behavior.
Interpretation: Close vs MA50 = Bearish, MA50 vs MA200 = Bullish.
3) Momentum & volatility dashboard
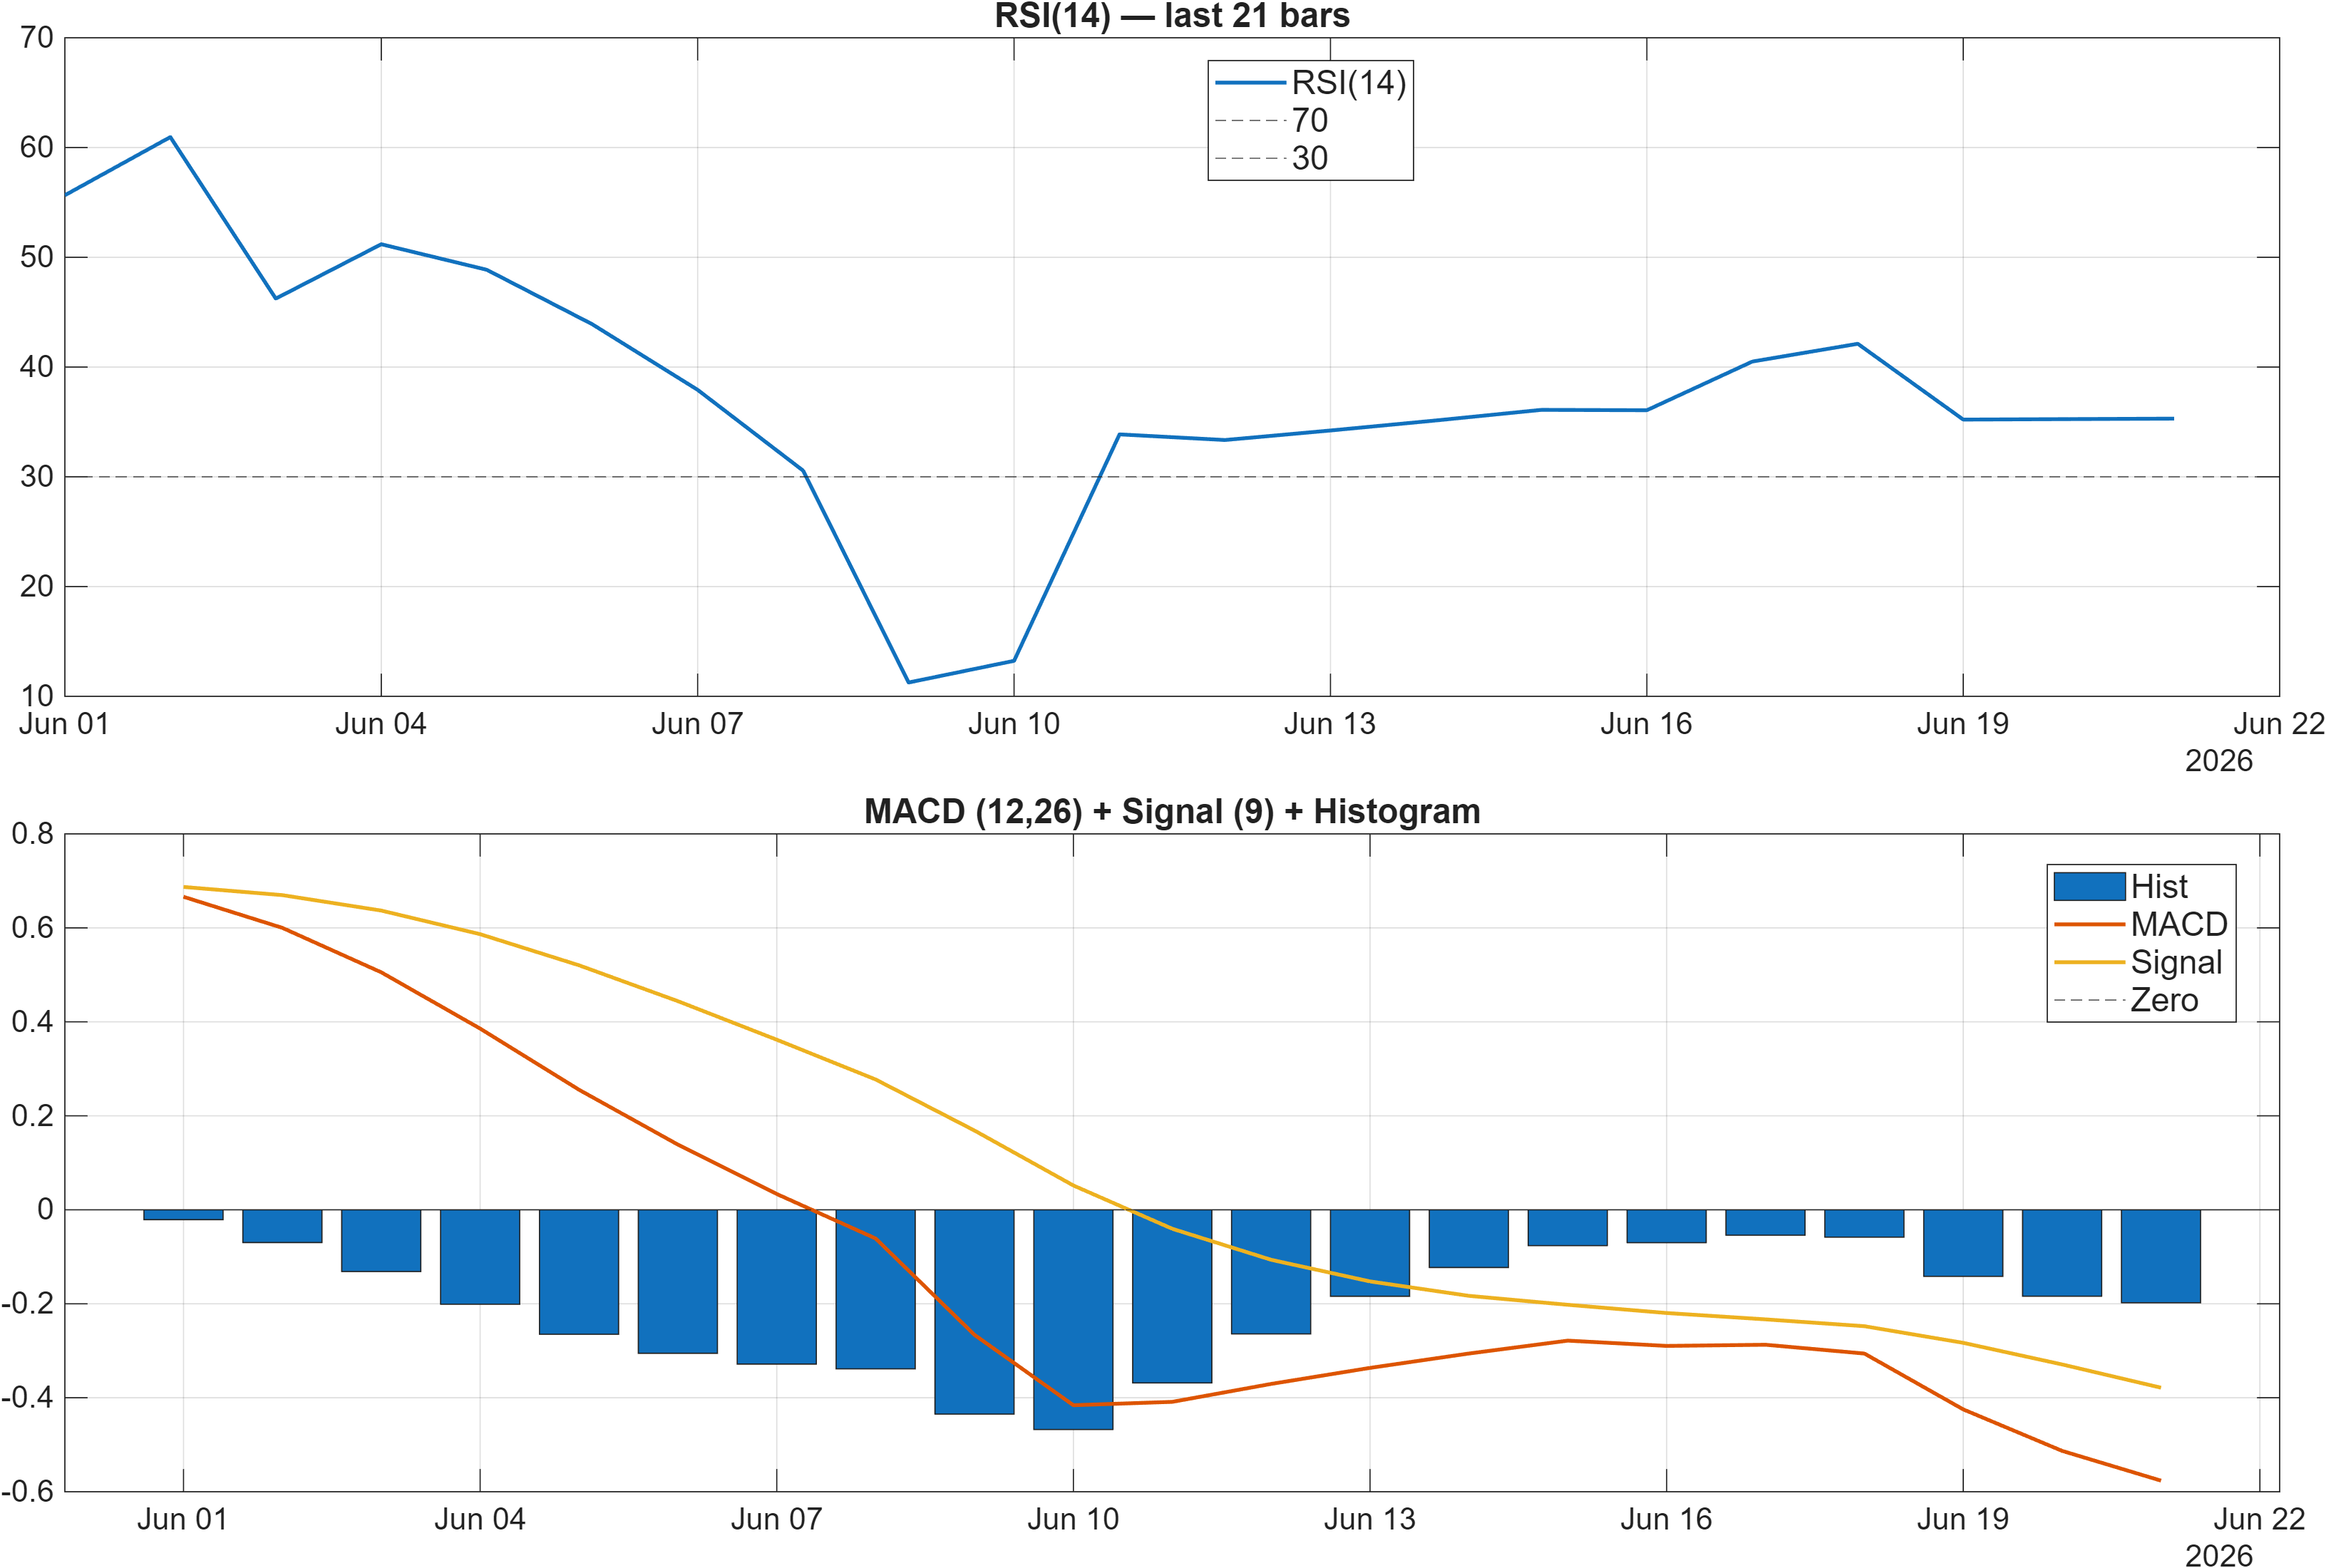
Momentum readings lean defensive, suggesting the short-term sell pressure has not fully exhausted. The RSI bias is flagged Bearish, and RSI(14) at 35.3 places momentum in the lower band of typical oscillator ranges, consistent with weak demand conditions. At the same time, the MACD histogram at -0.1978 indicates negative momentum persistence rather than a confirmed turn.
The important nuance is that weak RSI alone does not define a reversal; it defines stress. In combination with negative MACD histogram, it more often describes a market that can remain heavy unless price action begins to form higher lows or unless momentum indicators start compressing toward neutral. This aligns with the weekly rank sitting near the bottom of the universe (#1326), even while the 3–6 month ranks remain strong (#78 and #20).
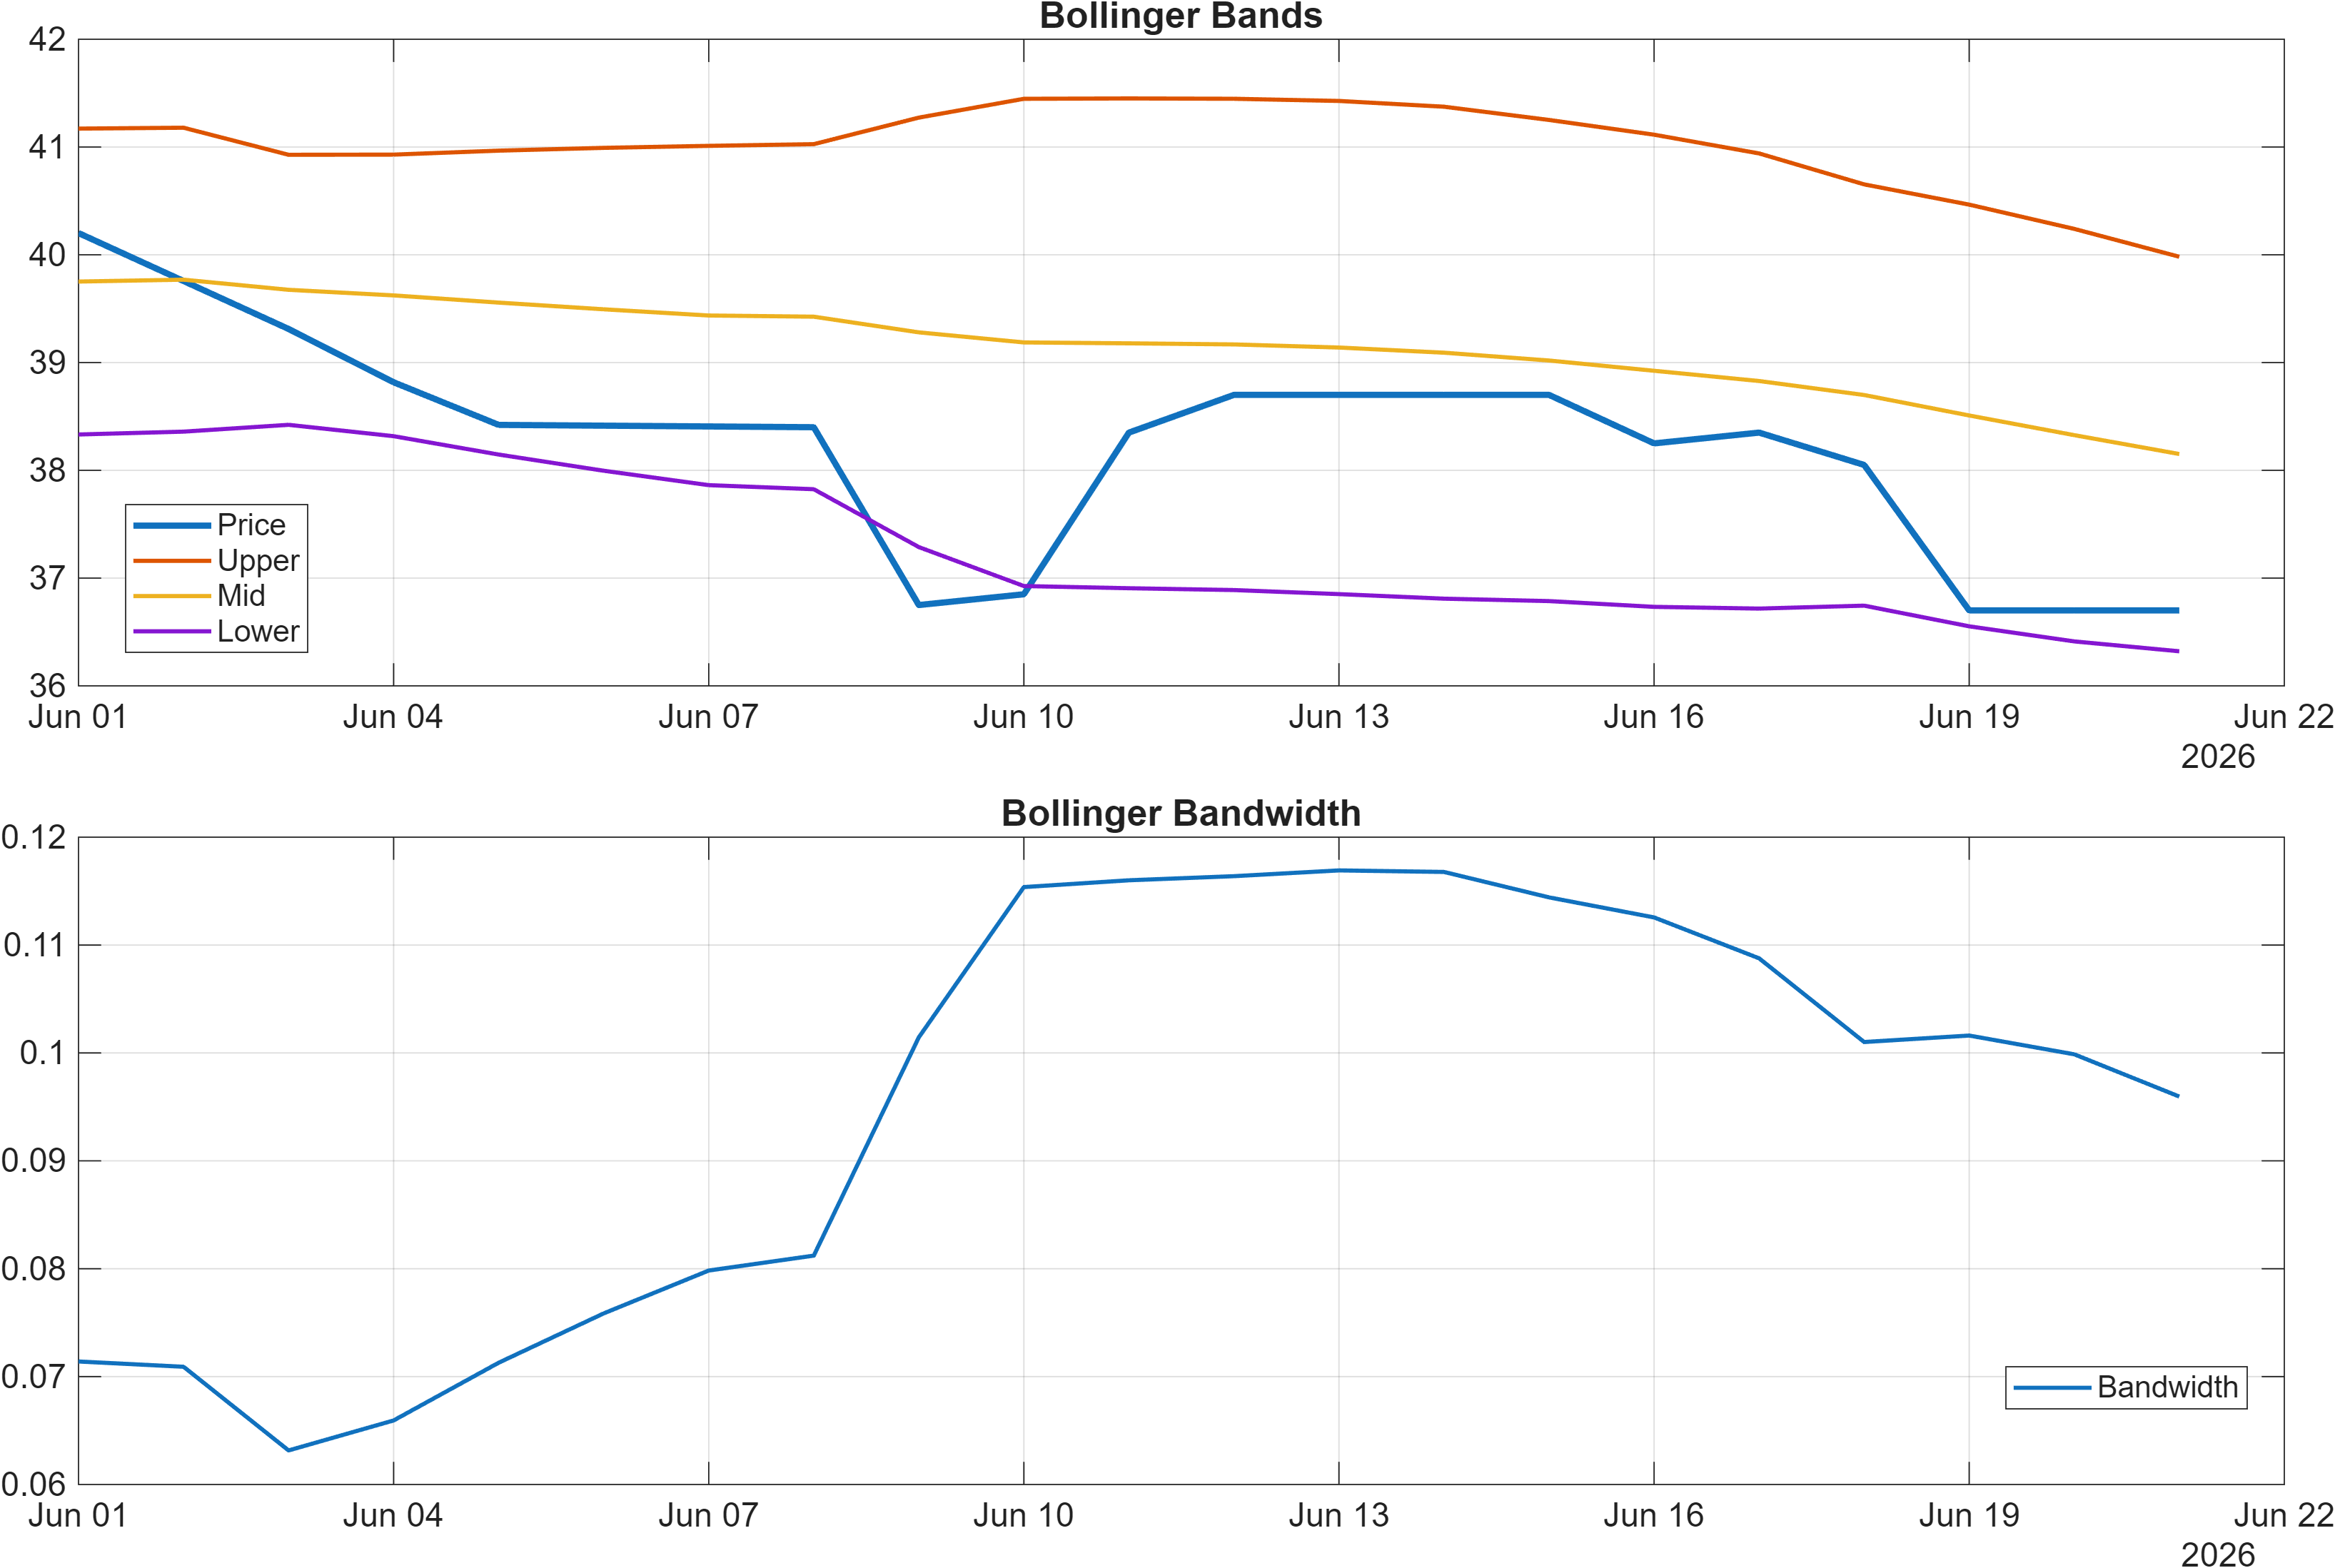
Volatility conditions look comparatively contained. Bollinger Bandwidth’s latest reading is 0.0960, which is consistent with a moderate volatility regime rather than a breakout-level expansion. When momentum is bearish but volatility is not expanding materially, markets often oscillate in a choppy corrective structure rather than trending cleanly. That reinforces the importance of level-based confirmation near 36.3083 and 41.2917 for determining whether momentum is stabilizing or simply pausing.
Interpretation: RSI bias = Bearish, MACD hist = -0.1978.
Interpretation: Bandwidth (volatility regime) latest = 0.0960.
4) Support / Resistance zones
Support ~ 36.3083 | Resistance ~ 41.2917
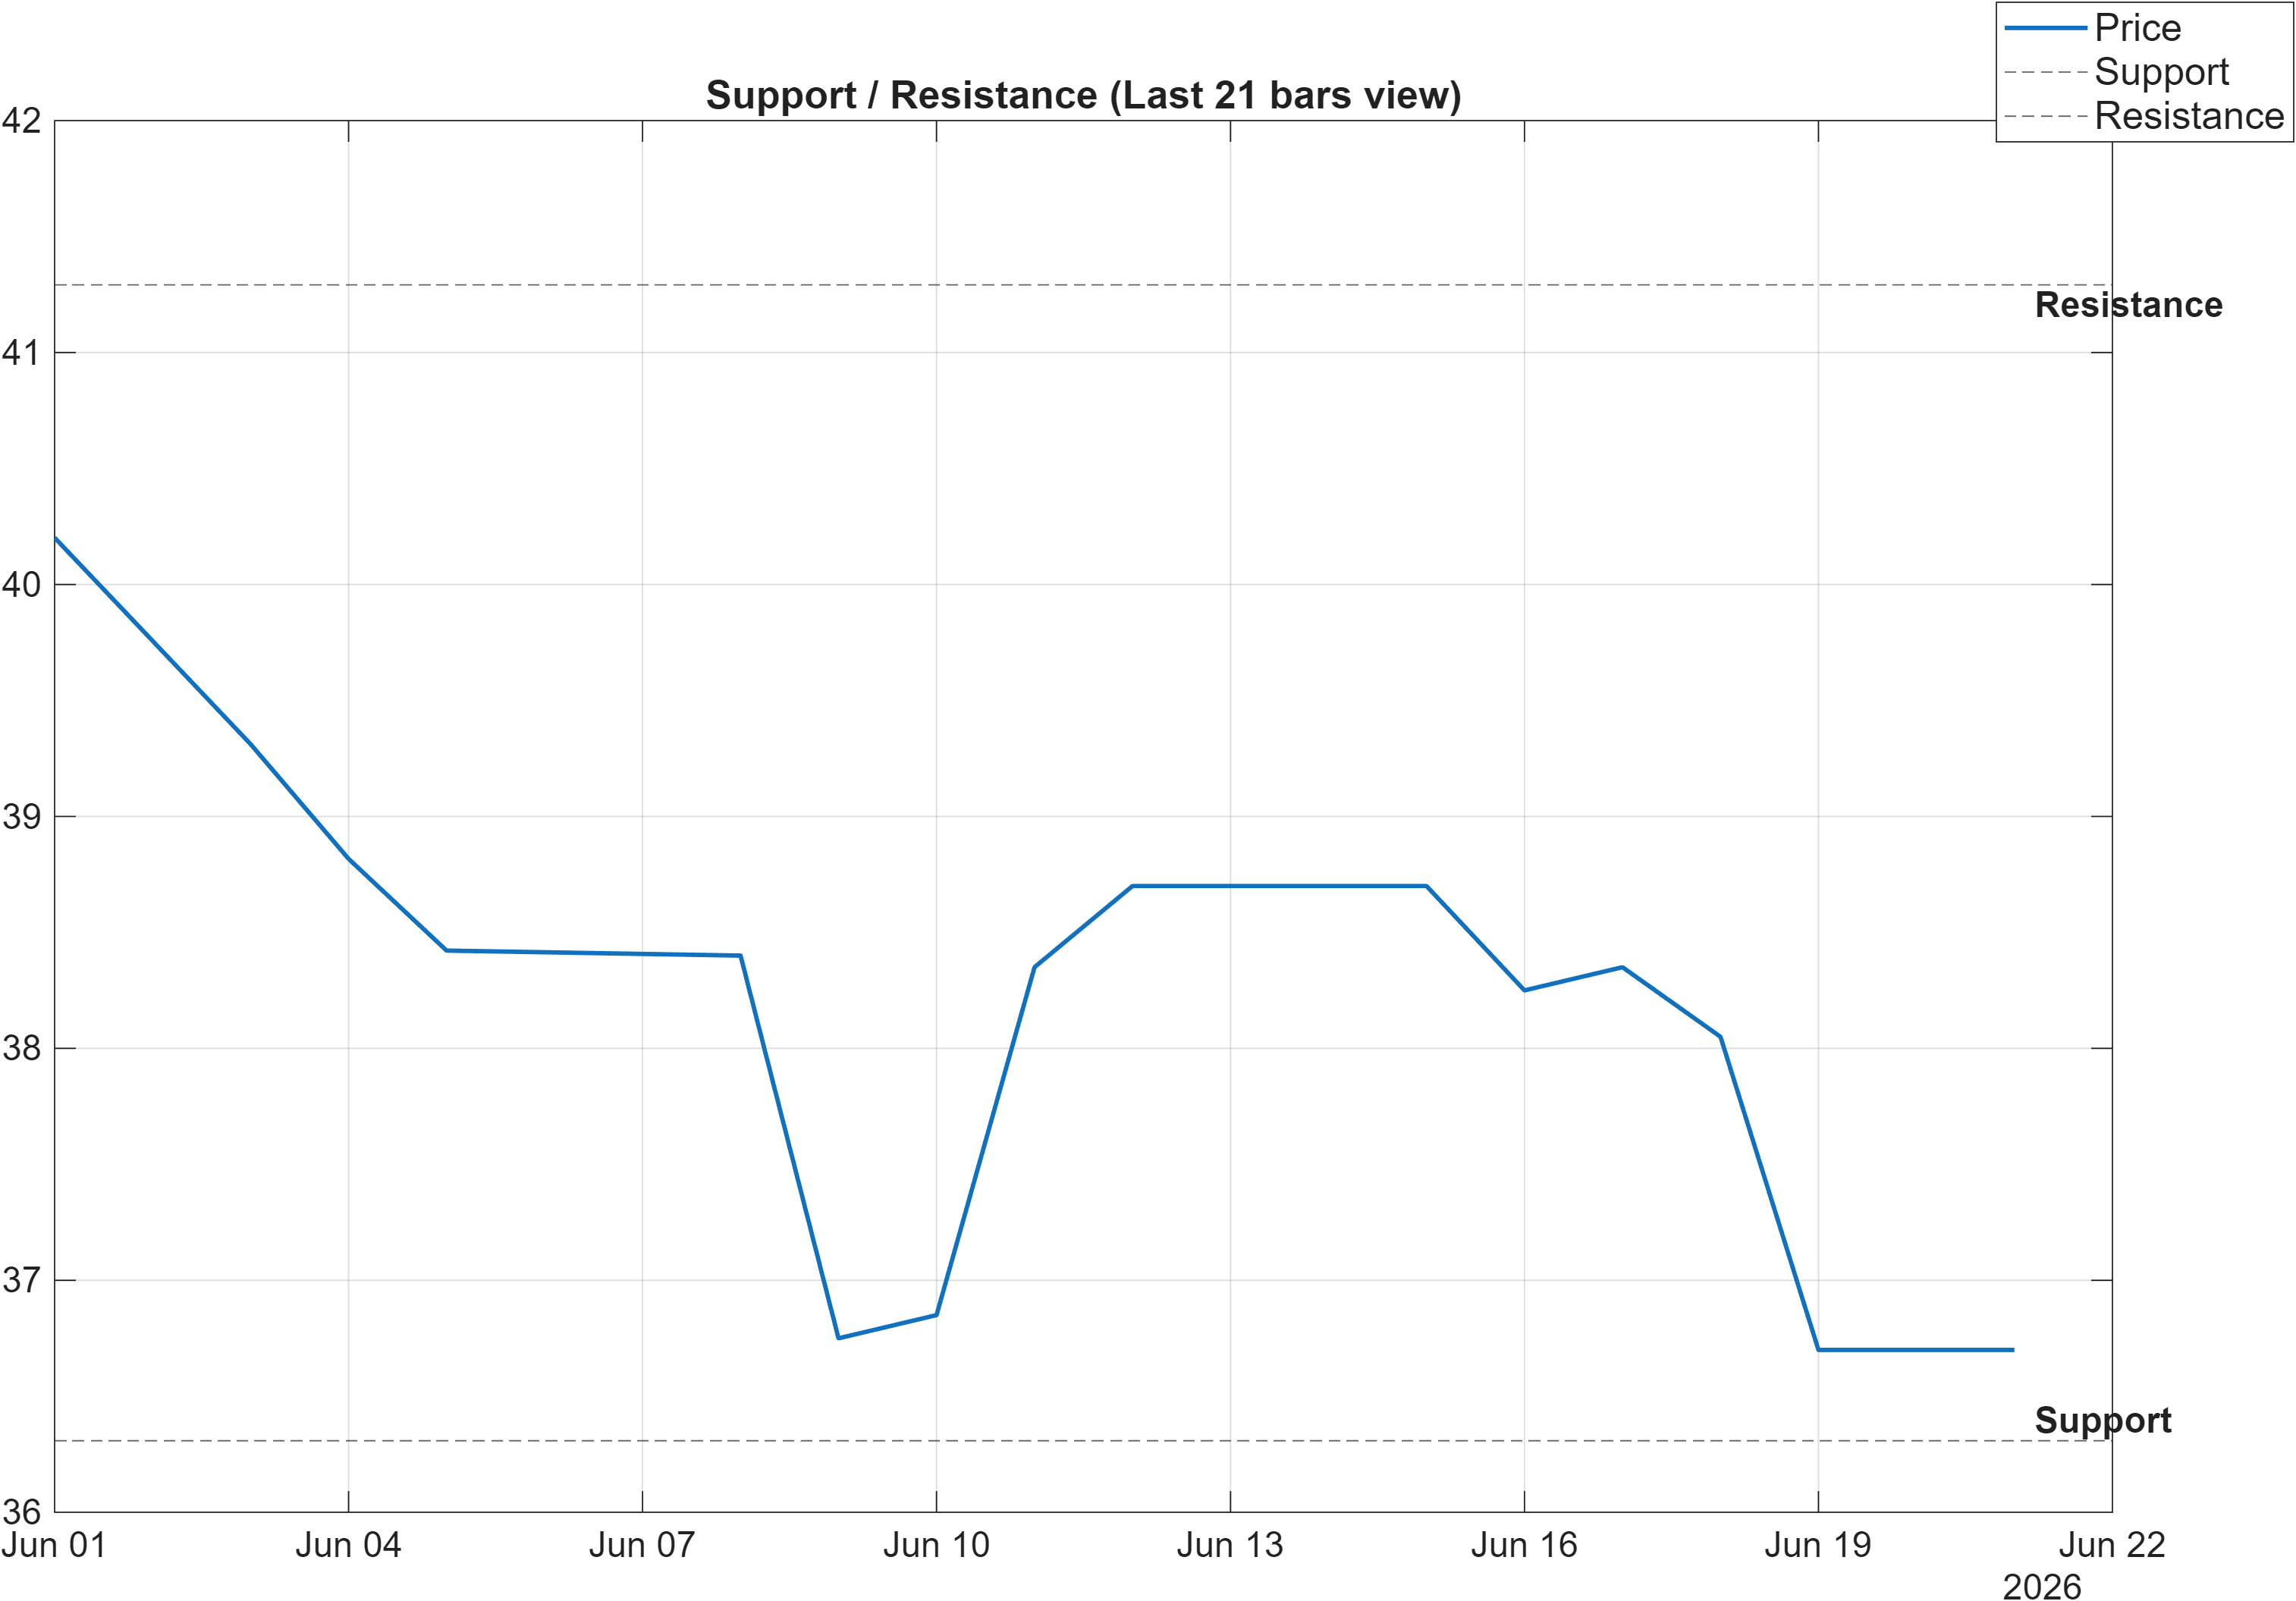
With mixed trend structure and bearish momentum, the distance to key zones becomes the primary map for risk calibration. The defined support near 36.3083 represents the area where prior demand has been sufficient to arrest declines. Given the broader technical scoring is bearish (-0.541 overall) and RSI is depressed (35.3), repeated tests of support without a clear rebound can increase the probability of breakdown behavior.
The resistance near 41.2917 functions as the main barrier to restoring short-term trend confidence. In a regime where Close vs MA50 is bearish, reclaiming resistance with participation is a stronger confirmation than a brief intraday spike—particularly because the MACD histogram remains negative (-0.1978). A sustained move above resistance would also better reconcile the strong longer-horizon ranks (#20 at 6 months) with the weak weekly rank (#1326), reducing the current cross-horizon divergence.
Structurally, these zones define a probabilistic corridor rather than a certainty: behavior around support often differentiates “controlled correction” from “trend damage,” while behavior into resistance differentiates “relief rally” from “trend resumption.” In this case, the signal language is already provided by the scenario view—volume-backed strength above 41.2917 favors continuation, while a close below 36.3083 elevates deterioration risk.
Scenario view: Break above resistance with volume → continuation. Close below support → signal deterioration risk.
5) Quant Technical Dashboard (18 Signals)
KGNAI AI Technical Analysis Score (Deep Reinforcement Learning): Rank #1232 out of 1396 (Rank 1 represents the strongest technical positioning and a higher probability of favorable price behavior. As ranks increase toward the maximum, the probability of favorable outcomes weakens and bearish positioning becomes more dominant.) | Label: Bearish | Score: -0.765
18-Signal Technical Confluence Score: -0.444 (Bearish)
Overall Technical Score (18-signal confluence + DRL rank blend): -0.541 (Bearish)
Note: The blended score reflects signal strength weighted against broader AI technical ranking, which may temporarily diverge.
Blended technical score breakdown: -0.541 (Bearish | Bull 4 / Bear 12 / Neutral 2)
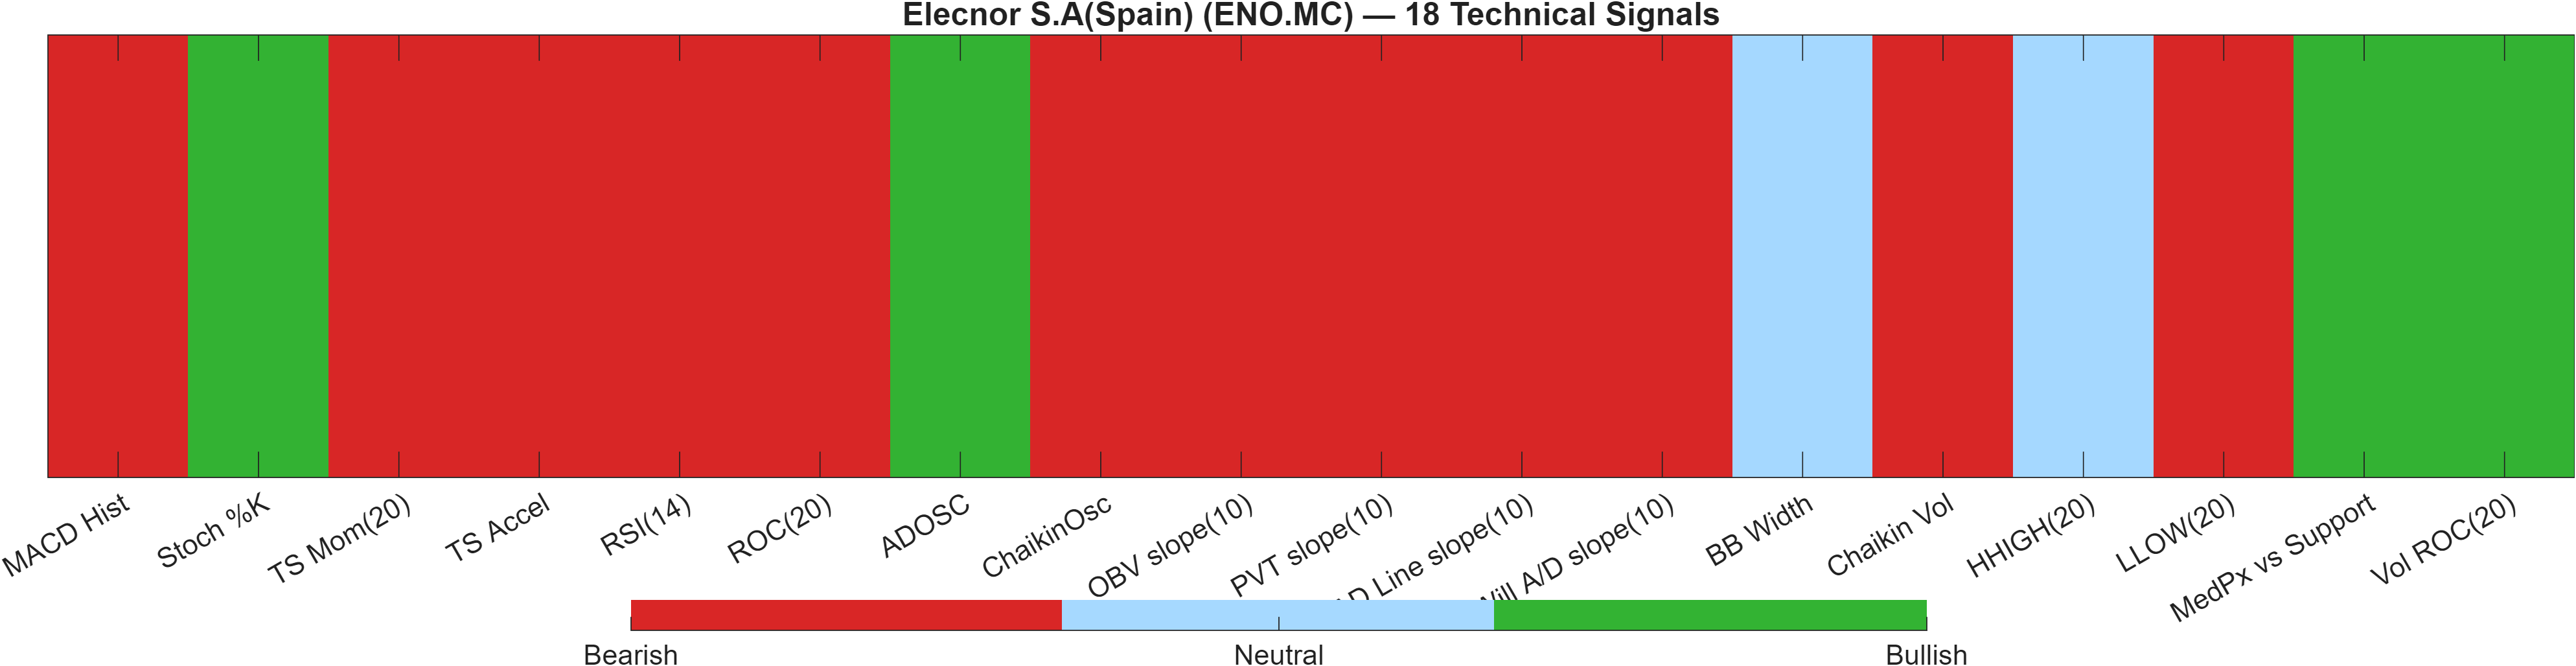
The technical dashboard indicates broad bearish agreement across independent indicators, even while the longer-horizon rank profile remains constructive. The Deep Reinforcement Learning technical rank is #1232 out of 1396 with a -0.765 score (Bearish), and the blended framework consolidates this with the 18-signal set into an overall technical score of -0.541. That blend is not a minor tilt: the breakdown shows Bear 12 versus Bull 4 with Neutral 2, a distribution typical of short-term pressure phases.
The indicator mix helps explain the character of that pressure. Momentum and rate-of-change inputs lean negative (e.g., MACD histogram -0.1978 and ROC(20) -7.689), while RSI remains weak (35.3). At the same time, there are selective stabilizers: Stoch %K at 13.33 is labeled Bullish, and Vol ROC(20) at 61.29 is also Bullish, suggesting higher activity that may accompany inflection attempts—though higher activity can occur in both accumulation and distribution.
Volatility is not signaling a decisive expansion: BB Width 0.09596 is Neutral, consistent with the bandwidth reading (0.0960) and implying that the market may still be operating inside a range-like correction. In that setting, the most actionable information often comes from whether bearish breadth begins to shrink (fewer Bearish signals) as price approaches 36.3083, or whether resistance at 41.2917 caps rebounds and preserves negative momentum.
Signal table (Bull/Bear/Neutral)
| Indicator | Value | Signal |
|---|---|---|
| MACD Hist | -0.1978 | Bearish |
| Stoch %K | 13.33 | Bullish |
| TS Mom(20) | -3.5 | Bearish |
| TS Accel | -2.05 | Bearish |
| RSI(14) | 35.3 | Bearish |
| ROC(20) | -7.689 | Bearish |
| ADOSC | 13.64 | Bullish |
| ChaikinOsc | -8.064e+04 | Bearish |
| OBV slope(10) | -8.596e+04 | Bearish |
| PVT slope(10) | -4679 | Bearish |
| AD Line slope(10) | -2.209e+05 | Bearish |
| Will A/D slope(10) | -1.55 | Bearish |
| BB Width | 0.09596 | Neutral |
| Chaikin Vol | 6.354 | Bearish |
| HHIGH(20) | 41.3 | Neutral |
| LLOW(20) | 36.3 | Bearish |
| MedPx vs Support | 0.8167 | Bullish |
| Vol ROC(20) | 61.29 | Bullish |
Interpretation: Indicator-level signals form the base confluence, which is then adjusted using a separate AI-driven technical ranking model. The final technical score summarizes this combined view.
6) News sentiment + extractive gist
Sentiment score (avg): 0.000 | Positive: 0% | Neutral: 100% | Negative: 0%
KGNAI AI News Sentiment Score (normalized -1 to +1): 0.99 (as of 2026-02-24) | Label: Bullish | Overall news score: 0.99
Positive Developments
Recent coverage across major financial outlets has leaned toward contextual, valuation-oriented discussion rather than event-driven catalysts. The recurring theme is heightened investor attention following a pullback, framed as an opportunity to re-check underlying assumptions. This tone can support a constructive bias when it coincides with strong longer-horizon quantitative posture—here reflected in the 6-Monthly rank (#20) and Yearly rank (#162). Importantly, the news distribution is entirely neutral in the provided digest (100% neutral), which suggests that the “positive” element is more about renewed focus than confirmed incremental developments. In practice, this tends to reduce the probability of sentiment-driven volatility spikes and shifts attention back to technical confirmation—particularly whether downside momentum (e.g., MACD hist -0.1978) begins to stabilize near defined levels.
Neutral / Mixed Developments
The sentiment panel is internally mixed: the average sentiment score is 0.000 with 0% positive / 100% neutral / 0% negative, yet the separate normalized KGNAI news sentiment score prints 0.99 (Bullish) as of 2026-02-24. Taken together, this looks less like a strong current narrative and more like low-intensity informational flow with a historically favorable skew captured by the model. Without fresh, directional news pressure, price action is more likely to be governed by technical structure—especially the support/resistance corridor (36.3083 to 41.2917) and the moderate volatility regime (bandwidth 0.0960).
Negative / Risk Signals
The principal risk signal from the news digest is not overt negativity (negative share is 0%), but rather the absence of new, definitive drivers while the technical stack remains bearish (overall technical score -0.541; DRL rank #1232). In such conditions, markets can continue to drift lower on weak momentum alone, particularly when RSI is already depressed (35.3) and trend confirmation is mixed (Close vs MA50 Bearish). The other practical risk is interpretive: recurring discussion of pullbacks can attract attention, but if price fails to reclaim key resistance (41.2917) and instead pressures support (36.3083), the narrative can quickly shift from “re-rating discussion” to “trend damage,” even without explicitly negative headlines.
- Whether price behavior strengthens above 41.2917 with volume confirmation.
- Whether momentum improves (RSI lifts from 35.3 and MACD histogram compresses from -0.1978).
- Whether repeated tests of 36.3083 hold without widening volatility beyond 0.0960 bandwidth.
Snapshot: AI Rank (Short–Mid–Long): Mixed (Bearish–Neutral–Bullish) · Technical Confluence: Bearish · Key Levels: Support ~36.31 | Resistance ~41.29 · News Sentiment: Neutral
Sources referenced: Reuters, Bloomberg, Yahoo Finance, MarketWatch, Investing.com
7) Sources
Source list is provided in the base dataset. For this report’s News section, items were aggregated and compressed per KGNAI editorial policy.
- A Look At Elecnor (BME:ENO) Valuation After Recent Share Price Pullback — https://finance.yahoo.com/news/look-elecnor-bme-eno-valuation-190951588.html?.tsrc=rss
You may also like: How KGNAI AI ranks instruments across global markets
Disclaimer: KGNAI provides AI-generated analytics and educational market commentary only. This is not financial advice. Markets involve risk. Always do your own research.