
CADINR (Canadian Dollar/Indian Rupee) — 13-Feb-2026 Technicals Balanced, Ranks Divergent
CADINR enters 13-Feb-2026 with a mixed cross-signal profile: longer-horizon KGNAI ranks tilt supportive (Weekly #140, 6-Monthly #141, Yearly #148), while near-term positioning remains softer (Daily #683 and Monthly #649). Price structure shows moving-average alignment that is constructive (Close vs MA50 = Bullish; MA50 vs MA200 = Bullish), but momentum is still working through a bearish patch, highlighted by RSI(14) at 32.26 and MACD histogram at -0.0521. Volatility remains comparatively compressed with Bollinger bandwidth at 0.0362, a regime that can amplify follow-through once price exits a decision zone. The key technical map is clear: support sits near 64.6671 and resistance near 67.2871. With news sentiment broadly neutral (avg 0.008; 25% positive / 50% neutral / 25% negative), confirmation should come from level acceptance rather than narrative.
Key Takeaways
- Rank stance: Short-term Neutral | Mid-term Neutral | Long-term Bullish
- Technical confluence: 18-signal score -0.222 Neutral; blended overall -0.326 Bearish
- Key levels: Support ~ 64.6671 | Resistance ~ 67.2871
- News sentiment bias: Avg 0.008 Neutral (25% positive / 50% neutral / 25% negative)
- Confirmation / invalidation: Acceptance above 67.2871 supports continuation; sustained closes below 64.6671 increase deterioration risk.
What KGNAI Measures
KGNAI ranks instruments by relative positioning across a large universe (here, 956) using multiple statistical tests and AI models. The output focuses on alignment across indicator families—trend, momentum, and volatility—rather than any single signal. Results are comparative and update as new market data enters the system.
How to Read This Report
- Ranks are comparative within the 956-instrument universe, not absolute “buy/sell” calls.
- Confluence summarizes agreement across signals; divergences often matter as much as the headline label.
- Support/resistance are decision zones where confirmation typically improves.
- Sentiment is contextual and can lag price; treat it as bias, not a trigger.
1) KGNAI AI Analysis
Region: FOREX
Total universe size: 956 ranked instruments
- Daily rank: #683 out of 956 — Neutral
- Weekly rank: #140 out of 956 — Bullish
- Monthly rank: #649 out of 956 — Neutral
- 3-Monthly rank: #357 out of 956 — Neutral
- 6-Monthly rank: #141 out of 956 — Bullish
- Yearly rank: #148 out of 956 — Bullish
The rank curve for CADINR is defined by timeframe divergence. Short-term placement is in the lower third of the universe (Daily #683), while the Weekly #140 and Yearly #148 sit closer to the upper quartile of the 956-instrument set. That gap typically indicates the market is in a consolidation or reset phase where shorter-term momentum has weakened, but higher-timeframe structure remains comparatively resilient.
The Monthly #649 and 3-Monthly #357 reinforce the “balanced” classification: mid-horizon conditions are neither strongly aligned nor fully deteriorated. In practical positioning terms, this mix often favors confirmation-based execution—waiting for price to validate direction at major levels—rather than relying on early signal anticipation.
The published term view is consistent with that framing: Short-term Neutral, Mid-term Neutral, and Long-term Bullish. When long-term ranks are supportive but near-term ranks lag, attention shifts to whether the next move is a trend continuation after a pullback, or a regime change that drags longer horizons lower. For CADINR, the decision is more likely to be resolved around the defined support/resistance bands (64.6671 / 67.2871) than within the middle of the range.
2) Price & trend overview
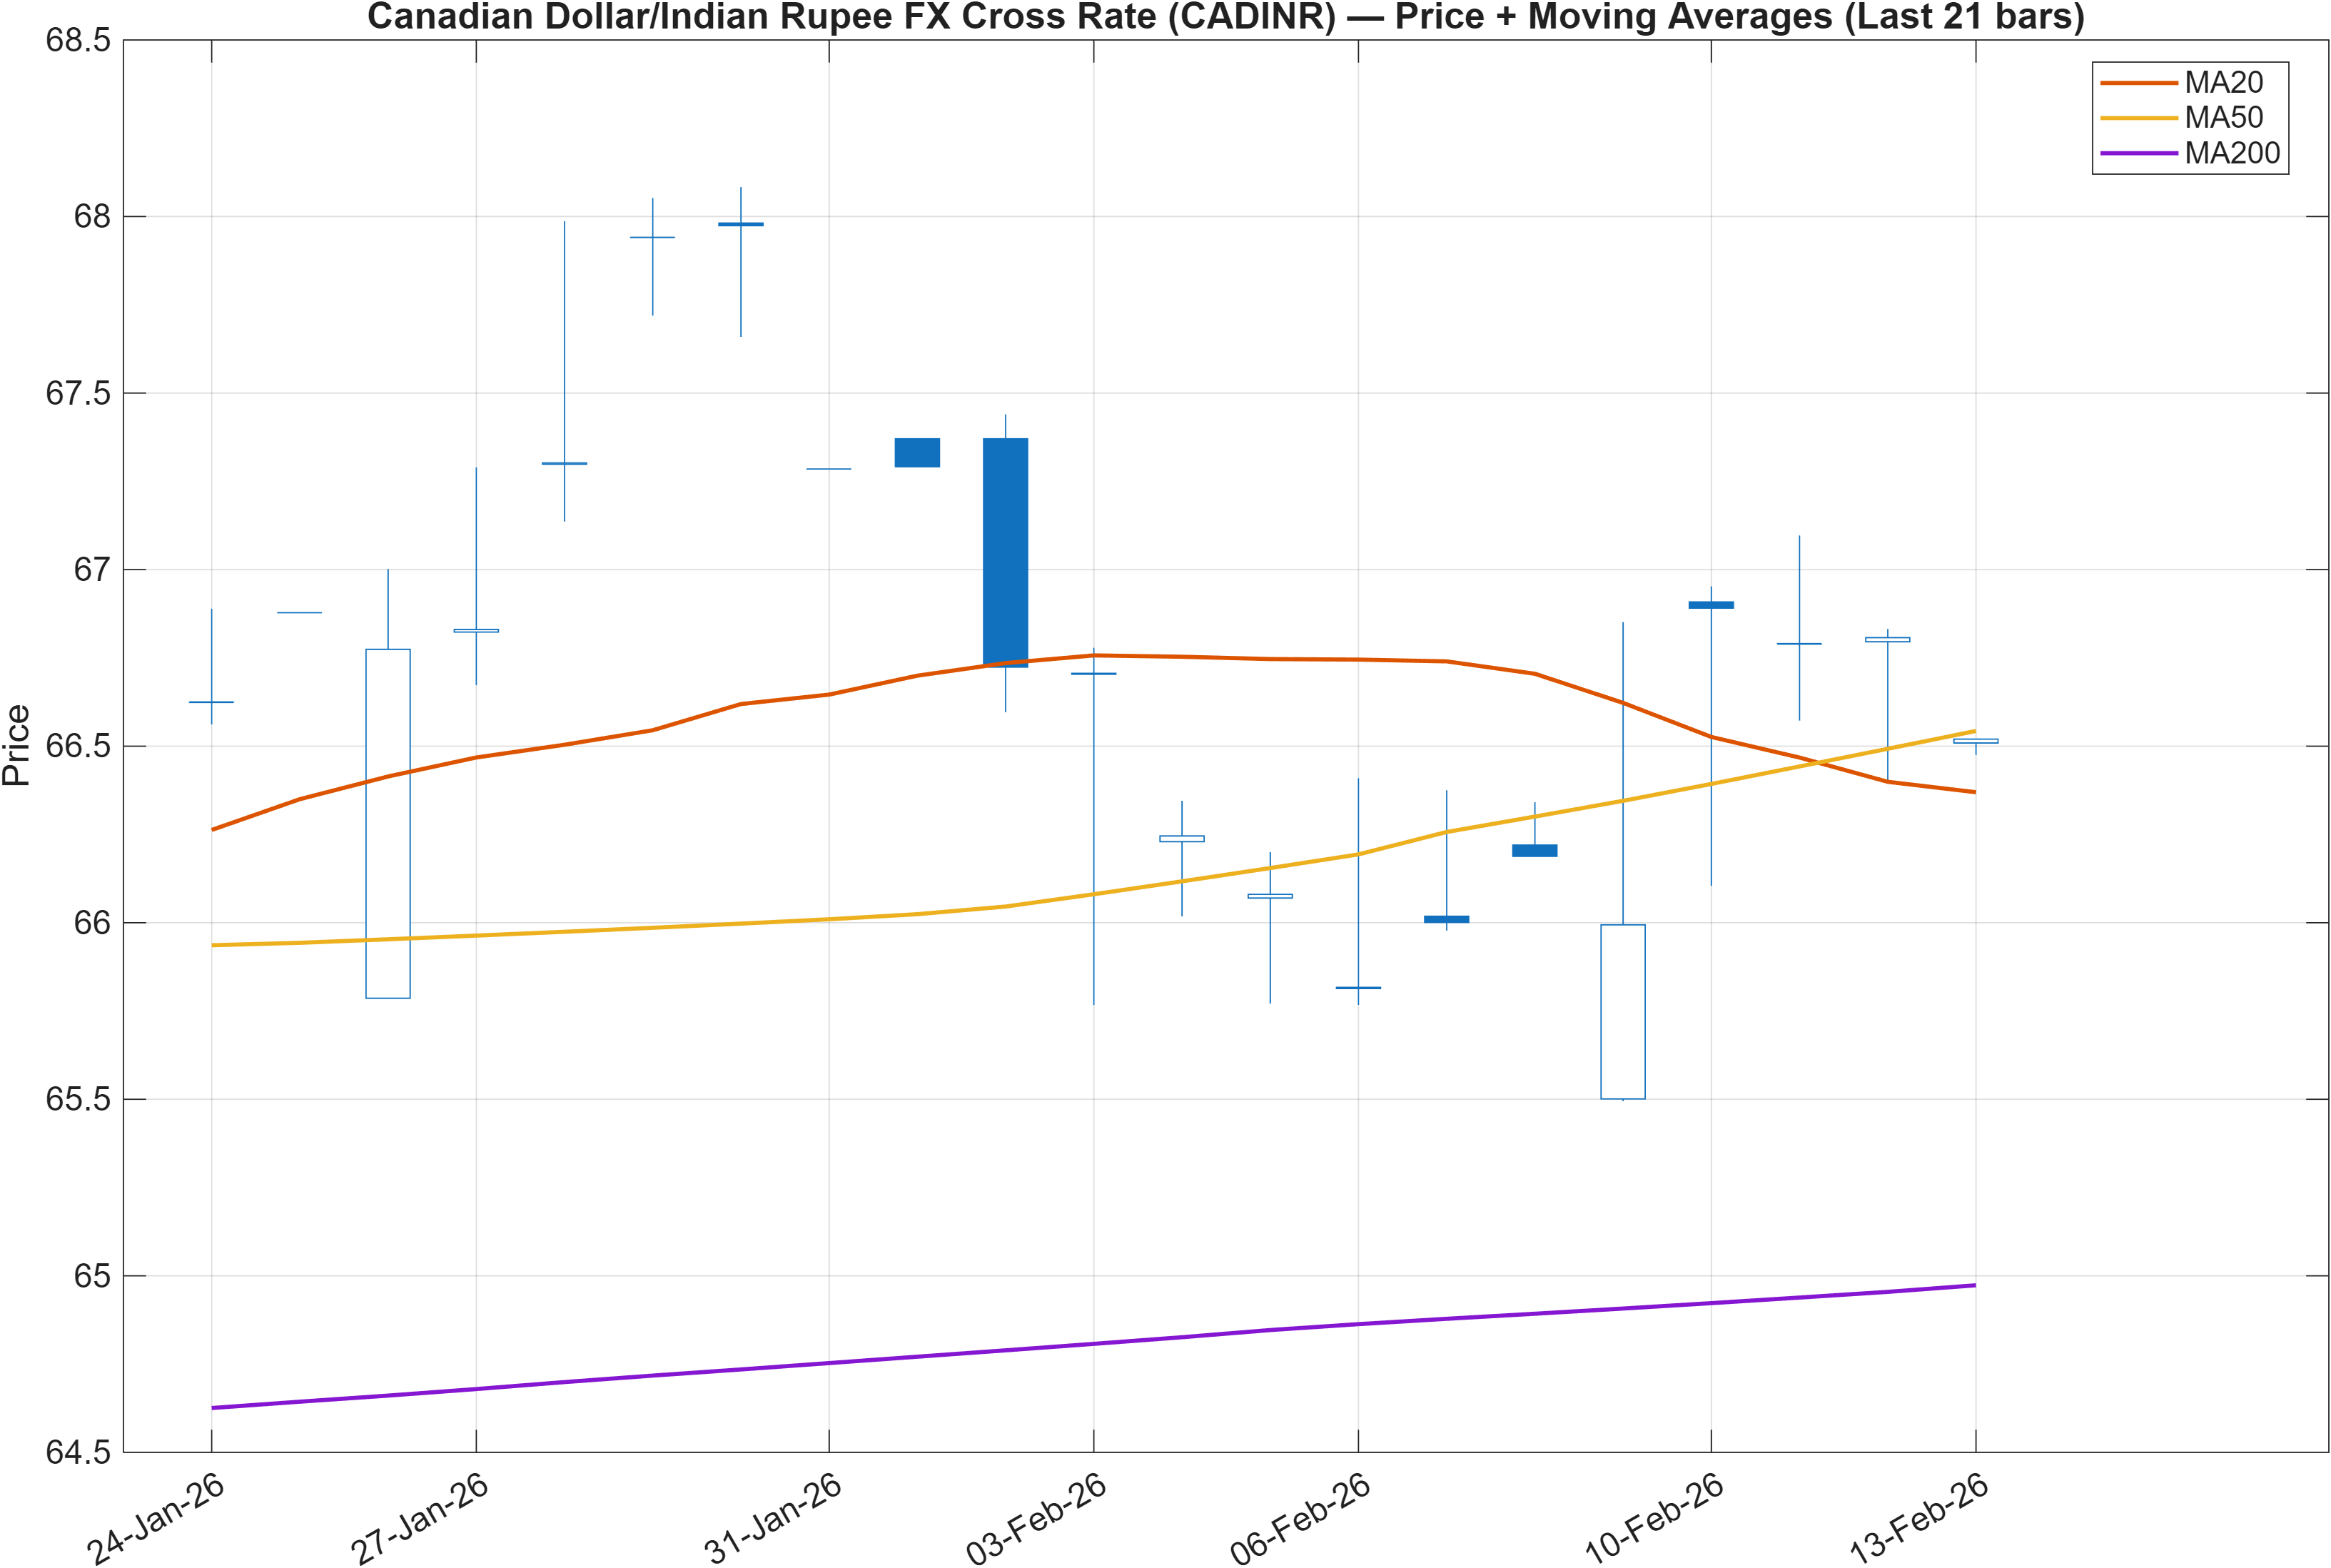
Interpretation: Close vs MA50 = Bullish, MA50 vs MA200 = Bullish.
The trend layer remains constructive on the evidence provided: Close vs MA50 is Bullish and MA50 vs MA200 is also Bullish. This is the classic “trend stack” that typically supports trend persistence—at least until momentum or volatility signals confirm a reversal. The current analytic tension is that the moving-average structure is aligned positively, while the momentum dashboard (RSI/MACD) leans bearish.
This type of configuration often appears during a corrective phase inside a broader uptrend, where price may still hold above key averages even as oscillators weaken. In CADINR’s case, that interpretation is consistent with the longer-horizon ranks (Weekly #140; 6-Monthly #141; Yearly #148) remaining bullish-leaning while Daily #683 is neutral and less supportive. The implication is not a forecast, but a process: require price confirmation before treating the MA alignment as sufficient evidence.
The most useful read-through is how price behaves as it approaches the mapped levels (support near 64.6671 and resistance near 67.2871). When MA alignment is bullish, failed breakdowns at support can quickly restore trend confidence; conversely, persistent trading below support would signal that the moving-average “bullish” read is lagging and that ranks may deteriorate into lower timeframes. Until one of those level outcomes occurs, the trend view stays constructive but not fully confirmed by momentum.
3) Momentum & volatility dashboard
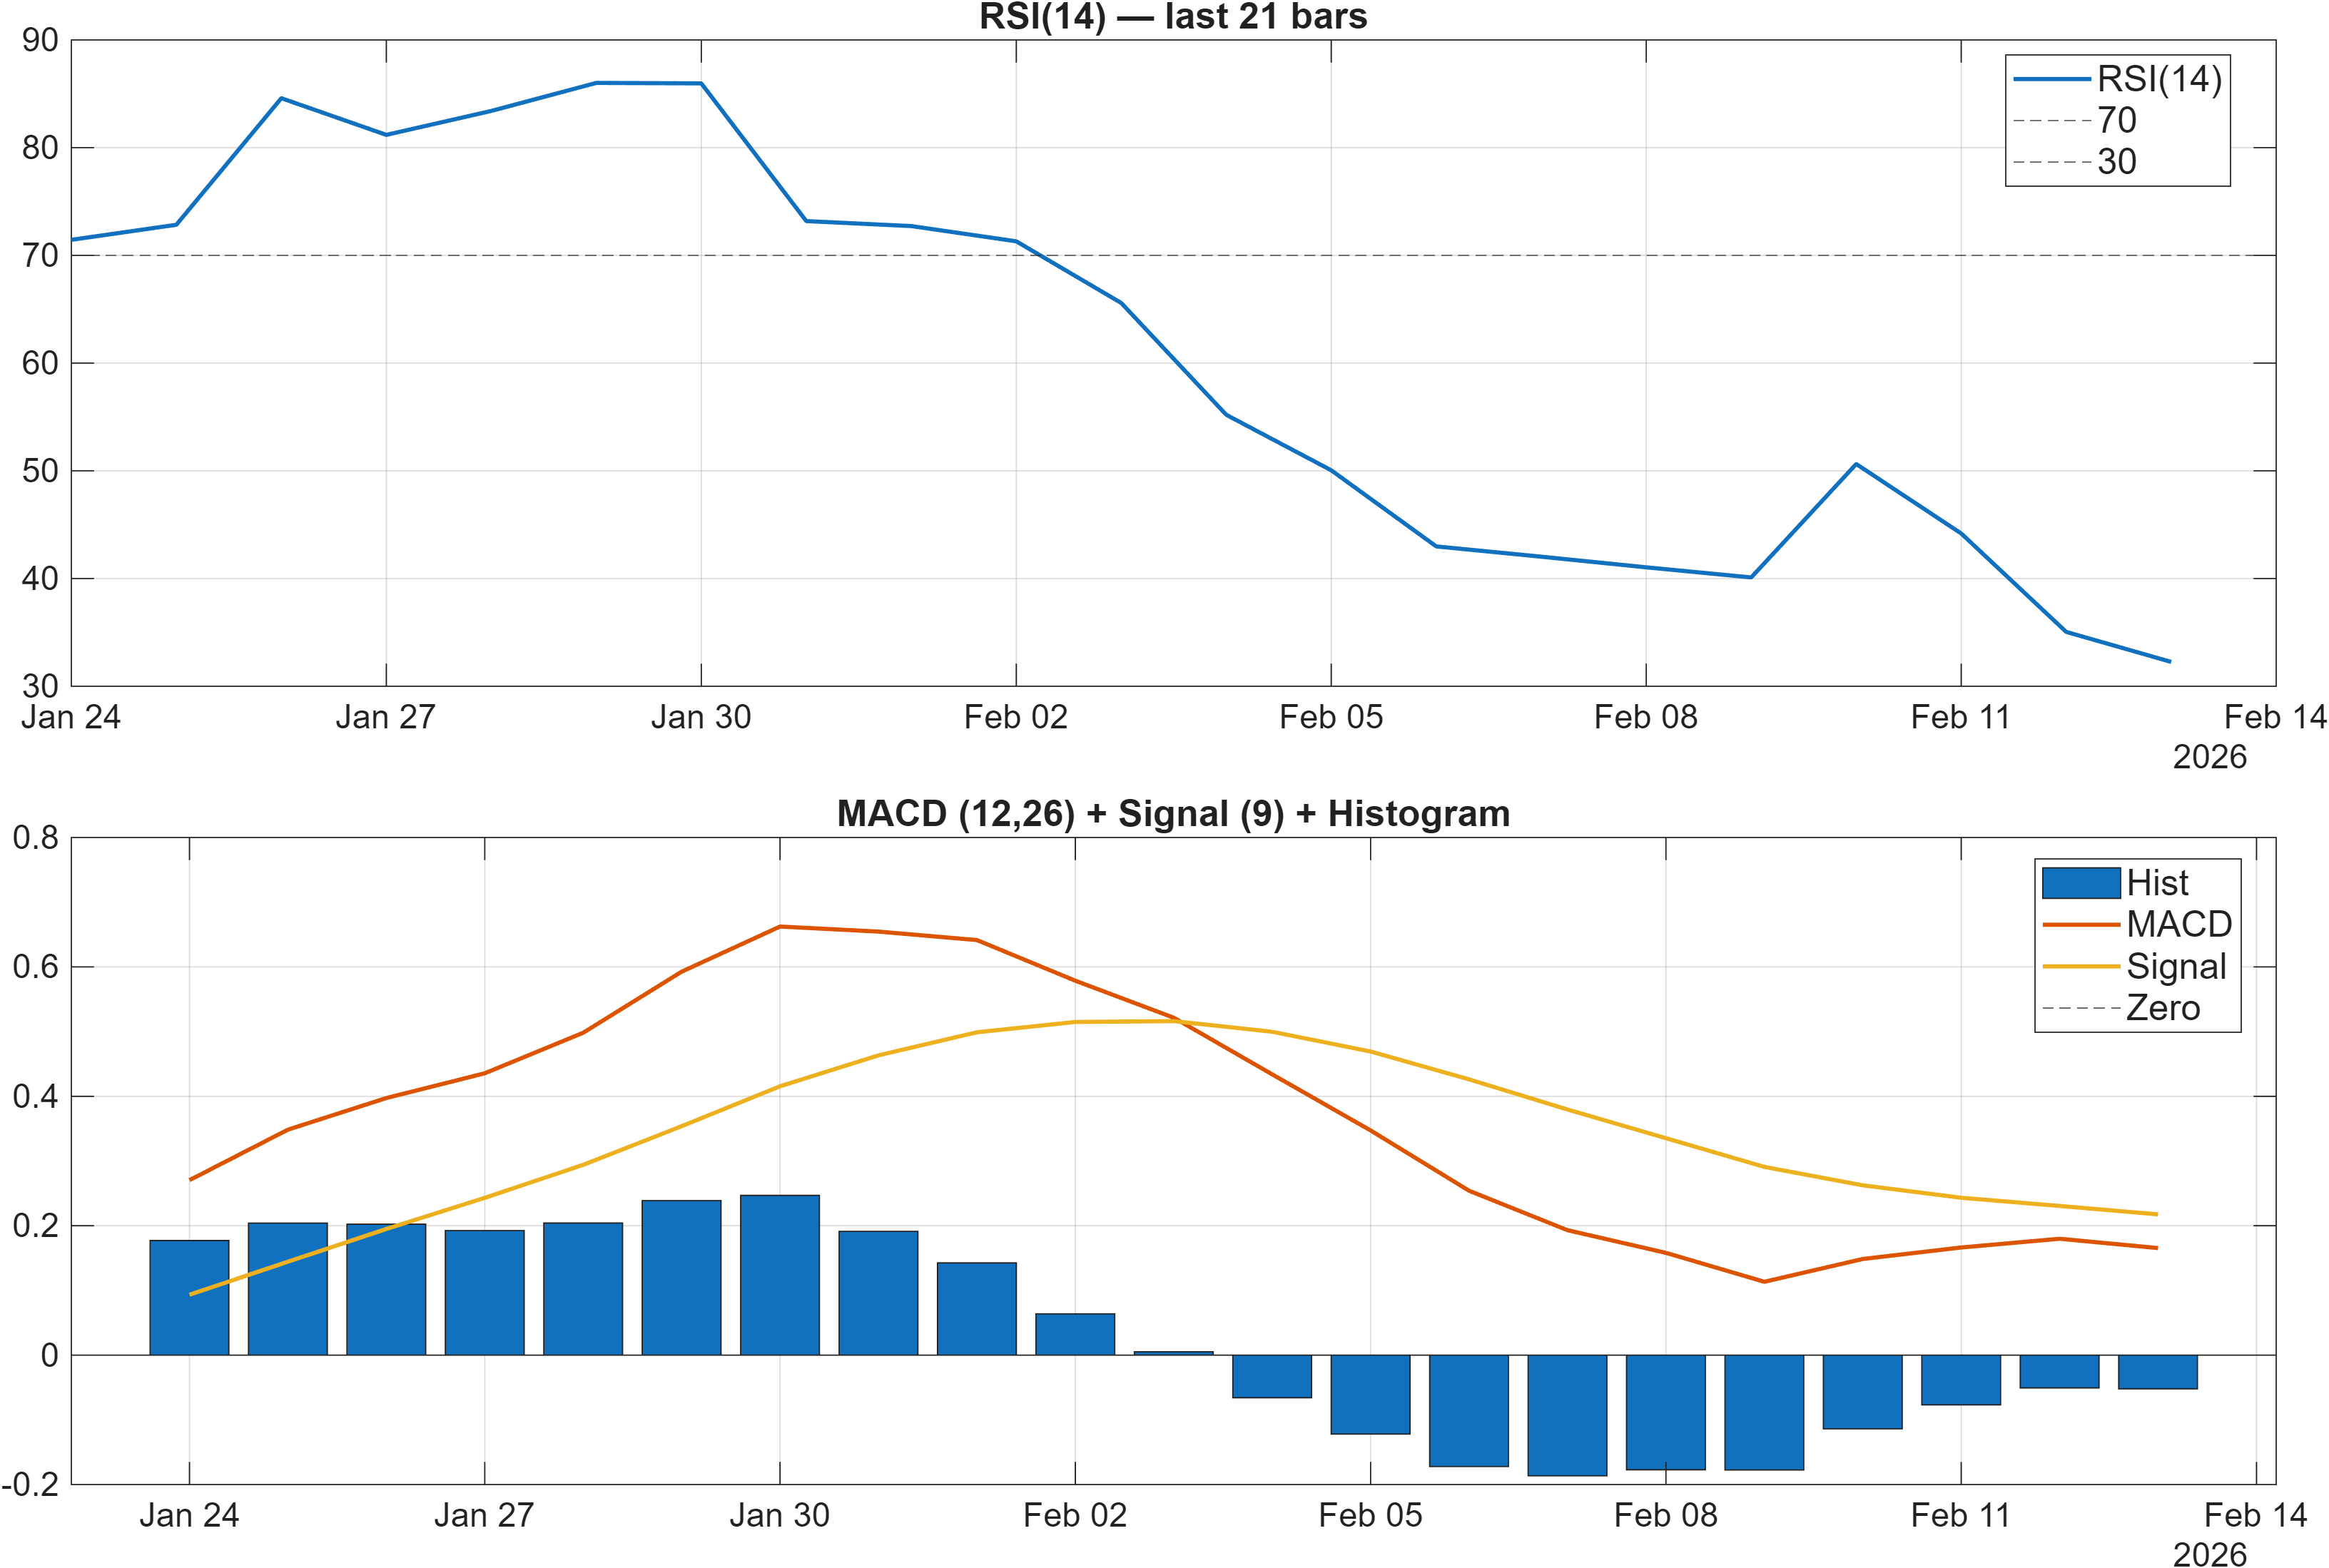
Interpretation: RSI bias = Bearish, MACD hist = -0.0521.
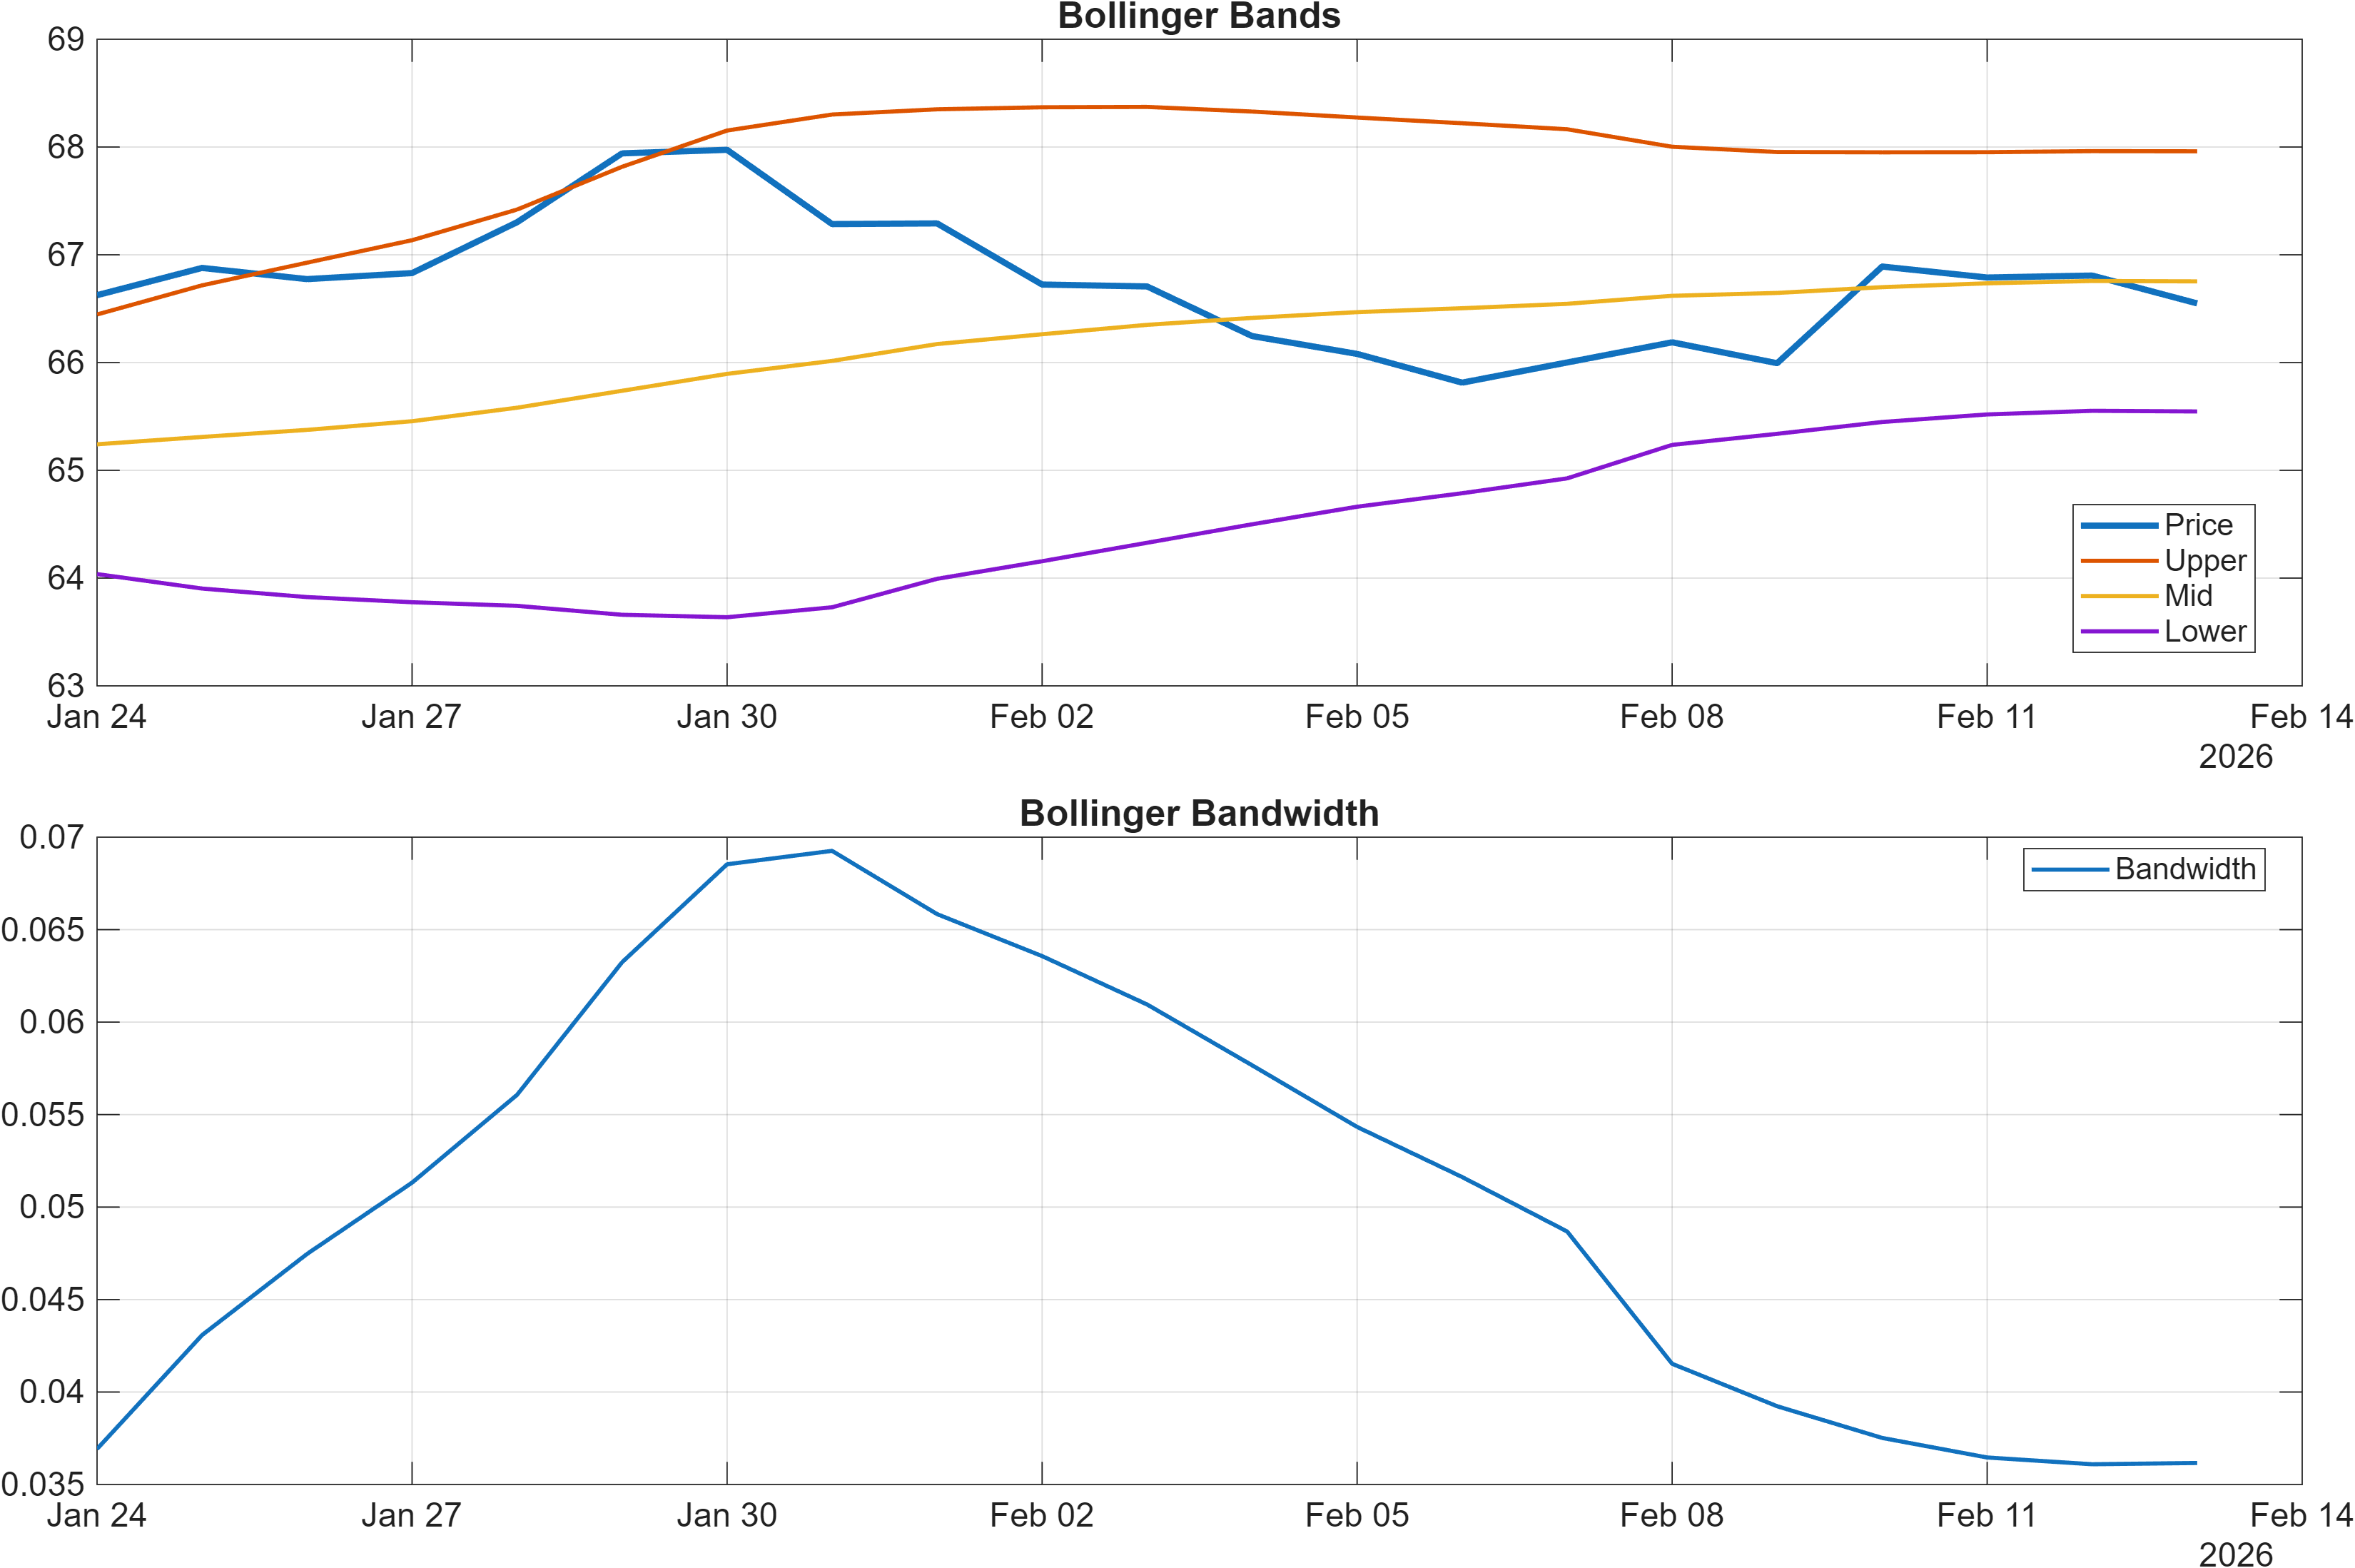
Interpretation: Bandwidth (volatility regime) latest = 0.0362.
Momentum currently argues for caution. RSI(14) is 32.26 and explicitly flagged as bearish, indicating downside pressure remains active even if a mean-reversion bounce can occur within that regime. MACD histogram at -0.0521 (and -0.05208 in the signal table) reinforces that negative momentum remains present rather than neutralizing.
The volatility read adds a second, distinct constraint: Bollinger bandwidth is 0.0362 (0.03616 in the table), a relatively compressed condition. Compression does not specify direction, but it does change the risk profile—moves can accelerate once price transitions away from equilibrium. In that environment, “being early” can carry higher whipsaw probability, particularly when ranks are mixed (Daily #683 vs Weekly #140) and confluence is not strongly positive.
The best analytical synthesis is to treat momentum as the near-term governor and volatility as the amplifier. If price strength develops toward resistance (67.2871) while MACD histogram improves from -0.0521 and RSI lifts away from 32.26, that would represent the kind of cross-confirmation that neutralizes the current bearish momentum bias. If RSI remains depressed and MACD stays negative while price tests support (64.6671), then the compressed-volatility backdrop increases the importance of that support holding cleanly; repeated failures in compressed regimes tend to degrade trend confidence faster than in high-volatility, two-sided markets.
4) Support / Resistance zones
Support ~ 64.6671 | Resistance ~ 67.2871
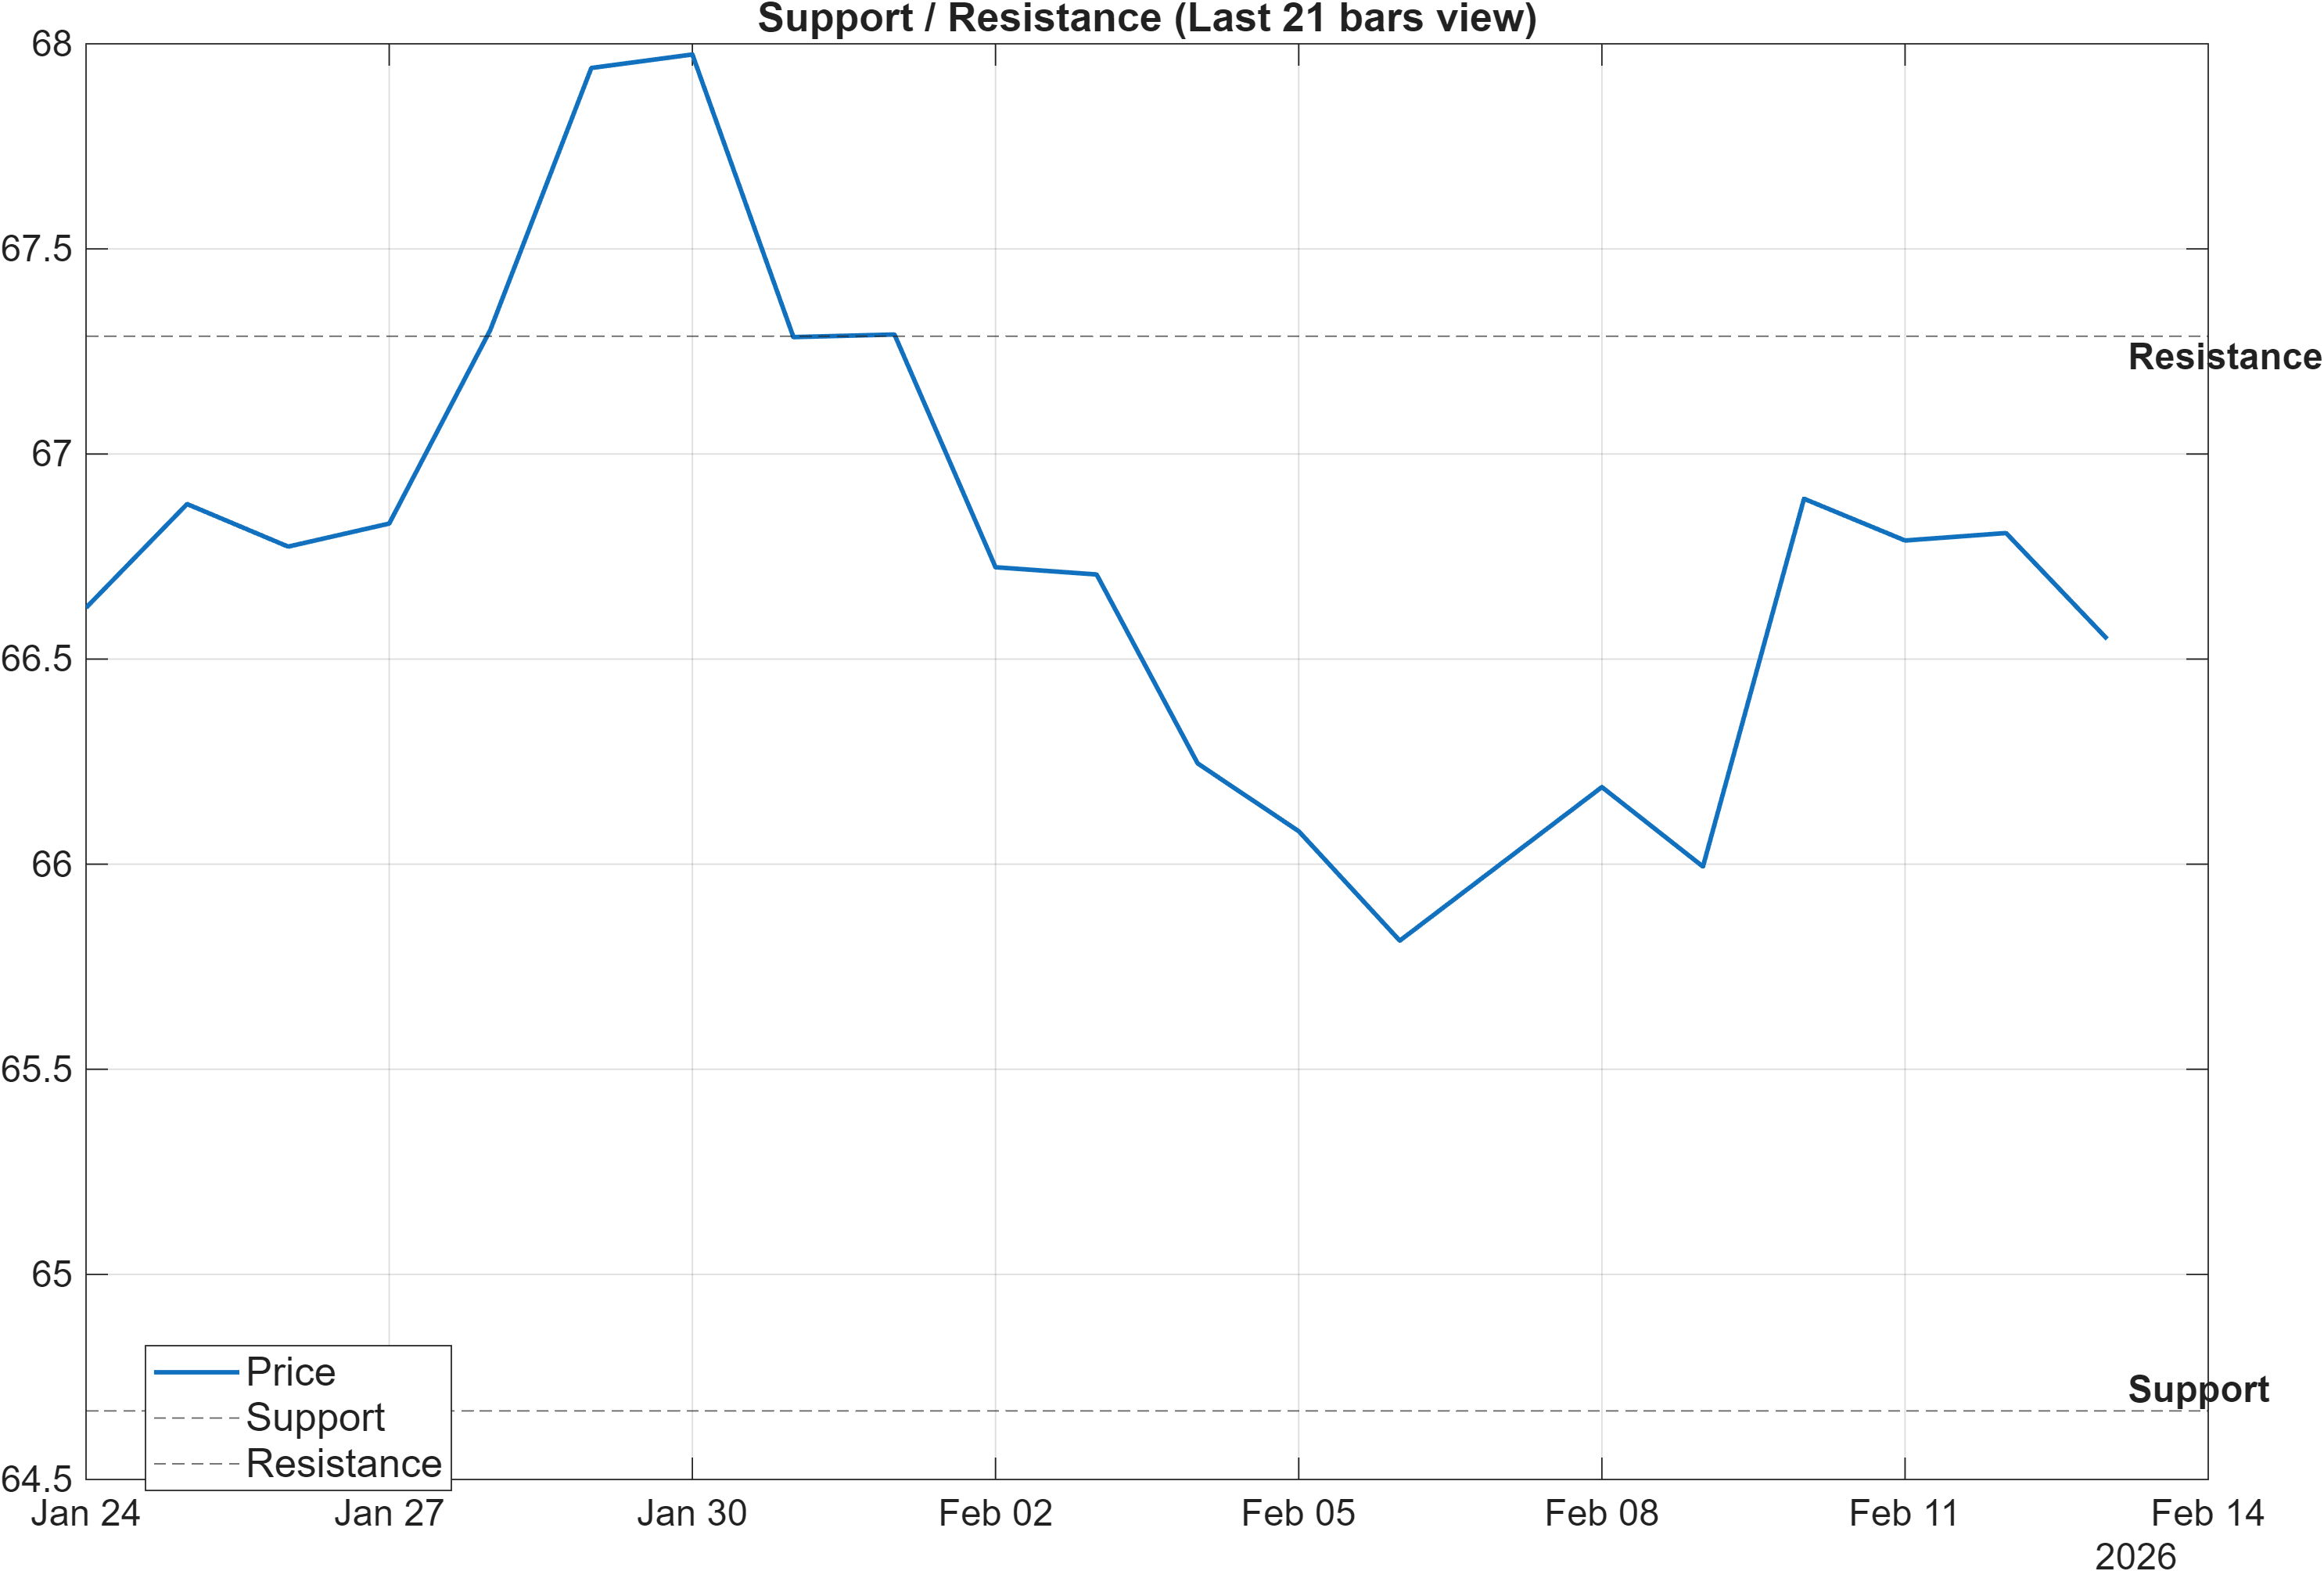
Scenario view: Break above resistance with volume → continuation. Close below support → signal deterioration risk.
The CADINR technical map is anchored by two actionable zones: 64.6671 as support and 67.2871 as resistance. With ranks mixed (Weekly #140 supportive versus Daily #683 neutral) and momentum bearish (RSI(14) 32.26; MACD histogram -0.0521), these levels function less as “targets” and more as validation points for which signal set is likely to dominate next.
From a continuation perspective, a sustained break and acceptance above 67.2871 would better align the bullish moving-average structure (Close vs MA50 Bullish; MA50 vs MA200 Bullish) with the longer-term rank stance (6-Monthly #141; Yearly #148). That is the cleanest path toward reducing the current divergence between trend and momentum. The scenario note explicitly emphasizes a break above resistance with volume as the continuation condition; absent that, strength can remain range-bound.
On the downside, the framework is equally explicit: a close below 64.6671 raises deterioration risk. This matters more in the present volatility regime because Bollinger bandwidth is only 0.0362; compressed conditions can lead to sharper directional sequences once a boundary gives way. In short, the nearer-term tactical question is whether price continues to respect support while momentum repairs, or whether weakness extends and forces the longer-horizon ranks to converge downward. Until one of these zones is decisively resolved, CADINR remains a level-driven trade environment rather than a pure indicator-driven one.
5) Quant Technical Dashboard (18 Signals)
KGNAI AI Technical Analysis Score (Deep Reinforcement Learning): Rank #749 out of 956 (Rank 1 represents the strongest technical positioning and a higher probability of favorable price behavior. As ranks increase toward the maximum, the probability of favorable outcomes weakens and bearish positioning becomes more dominant.) | Label: Neutral | Score: -0.567
18-Signal Technical Confluence Score: -0.222 (Neutral)
Overall Technical Score (18-signal confluence + DRL rank blend): -0.326 (Bearish)
Note: The blended score reflects signal strength weighted against broader AI technical ranking, which may temporarily diverge.
Blended technical score breakdown: -0.326 (Bearish | Bull 2 / Bear 6 / Neutral 10)
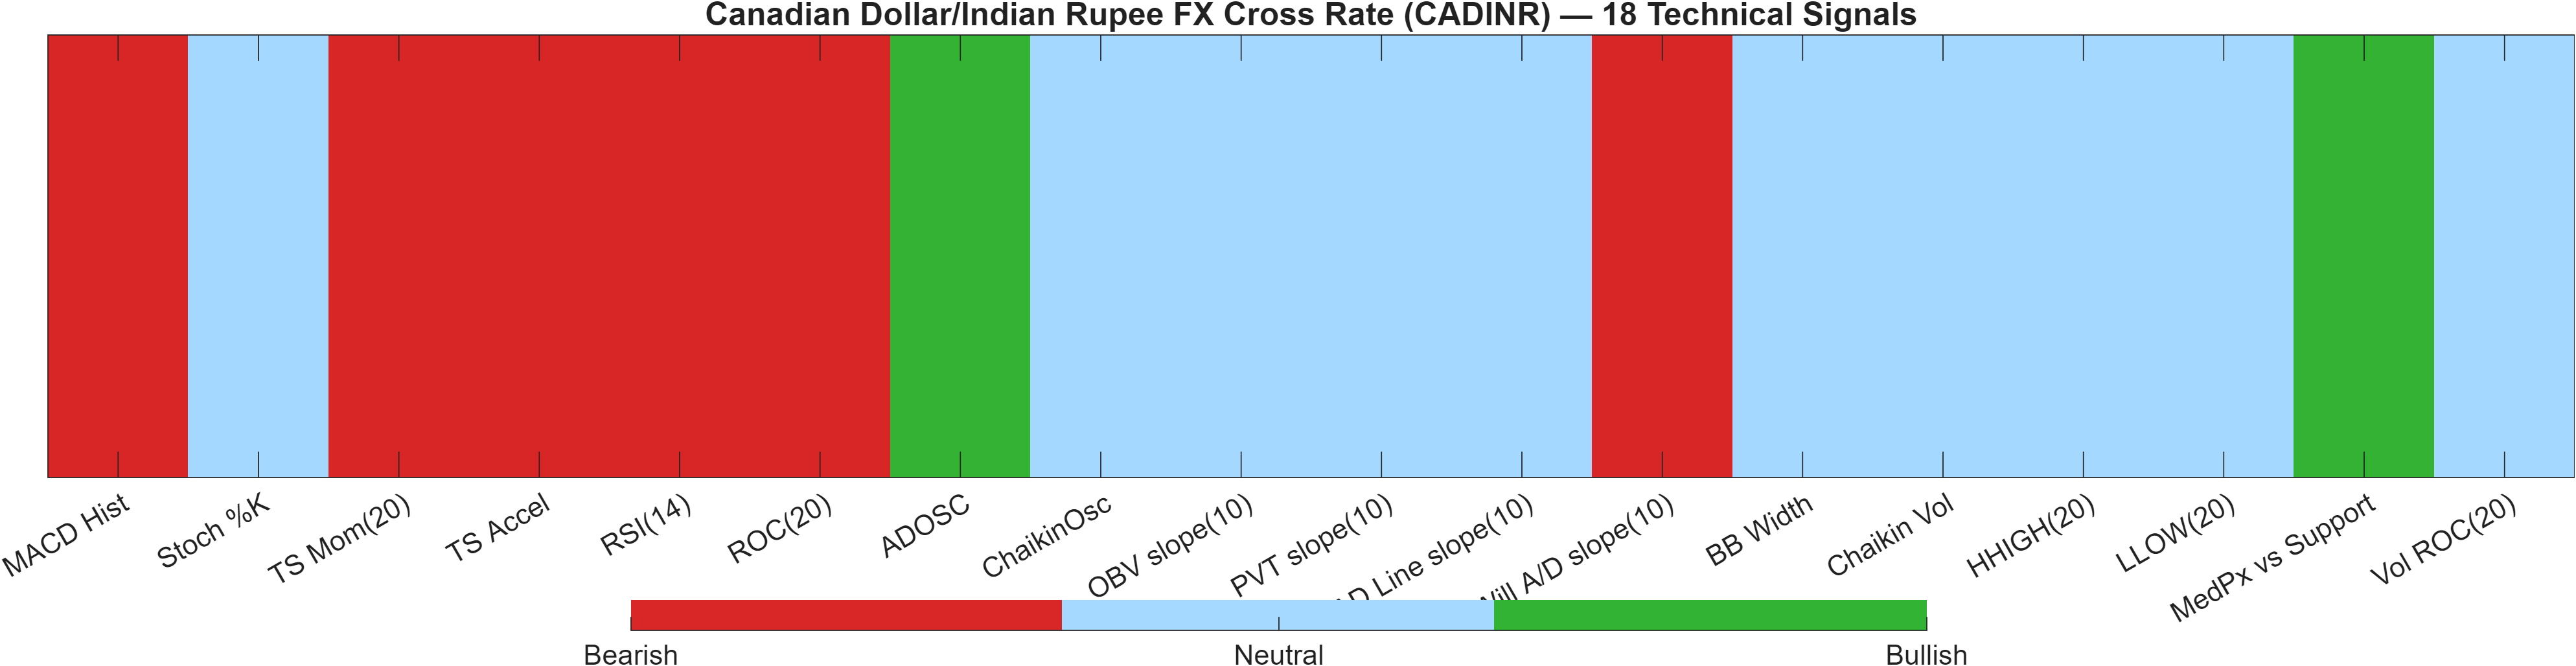
Signal alignment and regime read
The dashboard highlights why CADINR reads “balanced” despite bullish trend structure. The 18-signal confluence score is -0.222 (Neutral), but the overall blended score moves to -0.326 (Bearish) once the DRL technical rank is incorporated (Rank #749 of 956; score -0.567). That blend suggests the system currently weights the broader technical opportunity set as relatively unfavorable versus peers, even if a subset of signals is not decisively bearish.
Internally, the distribution (Bull 2 / Bear 6 / Neutral 10) points to a market with partial downside pressure rather than broad capitulation. The bearish cluster is primarily momentum-led: RSI(14) at 32.26, ROC(20) at -0.4919, TS Mom(20) at -0.358, TS Accel at -1.774, and MACD histogram at -0.05208. Meanwhile, a limited bullish pocket exists (ADOSC 62.22 and MedPx vs Support 1.83), which can be consistent with accumulation attempts or localized support behavior—but not enough, by itself, to flip the blended label.
Signal table (Bull/Bear/Neutral)
| Indicator | Value | Signal |
|---|---|---|
| MACD Hist | -0.05208 | Bearish |
| Stoch %K | 64.01 | Neutral |
| TS Mom(20) | -0.358 | Bearish |
| TS Accel | -1.774 | Bearish |
| RSI(14) | 32.26 | Bearish |
| ROC(20) | -0.4919 | Bearish |
| ADOSC | 62.22 | Bullish |
| ChaikinOsc | 0 | Neutral |
| OBV slope(10) | 0 | Neutral |
| PVT slope(10) | 0 | Neutral |
| AD Line slope(10) | 0 | Neutral |
| Will A/D slope(10) | -0.9886 | Bearish |
| BB Width | 0.03616 | Neutral |
| Chaikin Vol | -4.085 | Neutral |
| HHIGH(20) | 68.08 | Neutral |
| LLOW(20) | 65.49 | Neutral |
| MedPx vs Support | 1.83 | Bullish |
| Vol ROC(20) | — | Neutral |
Interpretation: Indicator-level signals form the base confluence, which is then adjusted using a separate AI-driven technical ranking model. The final technical score summarizes this combined view.
6) News sentiment + extractive gist
Note: Instrument-specific news matches were not found, so the digest includes broader market/sector headlines. Links are provided for verification.
Sentiment score (avg): 0.008 | Positive: 25% | Neutral: 50% | Negative: 25%
KGNAI AI News Sentiment Score (normalized -1 to +1): Not available (as of —) | Label: Not available | Overall news score: 0.01
Positive Developments
Recent coverage across major financial outlets indicates a modestly constructive backdrop centered on positioning shifts rather than CADINR-specific catalysts. Commentary has emphasized renewed market interest in “heavy asset / low obsolescence” business models, reflecting a broader rotation narrative that can shape global risk appetite and cross-asset correlations. In parallel, Canadian consumer spending data referenced in the digest suggested a January dip following a strong December, with severe winter weather cited as a potential driver and some categories framed as normalization rather than abrupt weakness. For FX markets, that kind of macro framing typically matters through its effect on rate expectations and risk sensitivity, not through a single day’s price action. With CADINR volatility still compressed (bandwidth 0.0362) and longer-horizon ranks supportive (Weekly #140; Yearly #148), modestly constructive macro tone can help the market “hold together” while waiting for technical confirmation at 67.2871.
Neutral / Mixed Developments
The news mix also reflects a market processing macro data and policy-path uncertainty. Broad reporting described equity index stabilization after a sharp prior selloff and highlighted cooling inflation prints in some jurisdictions alongside shifting rate-cut expectations. In Europe, trade-balance developments and partner-level flows were discussed as structural themes, while separate macro commentary referenced inflation dynamics guiding central bank caution. For CADINR, these items are better treated as context for general USD strength/weakness, global risk conditions, and cross-currency positioning rather than direct drivers. This aligns with the sentiment read: average score 0.008 with a 50% neutral share, suggesting narrative signals are not strongly one-sided. When sentiment is neutral and technicals are mixed (18-signal confluence -0.222; blended -0.326), price behavior around 64.6671 and 67.2871 tends to provide the cleaner confirmation signal.
Negative / Risk Signals
Risk coverage has been dominated by event-risk sensitivity and trade-policy uncertainty, with attention on inflation releases and broader “risk-off” pockets across assets. Reports also referenced tariff-related themes and cross-market volatility catalysts (including energy supply discussions), which can tighten liquidity and increase correlation spikes—particularly relevant when Bollinger bandwidth is already low (0.0362). In such conditions, FX crosses can experience abrupt repricing once a technical boundary breaks, even if the initial narrative catalyst appears indirect. This risk framing matters for CADINR because momentum indicators remain bearish (RSI(14) 32.26; MACD histogram -0.0521), which can make support tests more fragile. If macro headlines amplify defensive positioning, the framework’s key invalidation marker—sustained closes below 64.6671—becomes more consequential for assessing whether the longer-horizon bullish ranks (6-Monthly #141; Yearly #148) are at risk of downgrading.
- Whether price acceptance develops above 67.2871 while RSI/MACD begin to repair.
- Any sustained weakness below 64.6671 during the low-bandwidth regime (0.0362).
- Changes in risk appetite that shift correlation with broader FX and rates markets.
Sources referenced: Reuters, Bloomberg, Yahoo Finance, MarketWatch, Investing.com
Snapshot: AI Rank (Short–Mid–Long): Mixed (Neutral–Neutral–Bullish) · Technical Confluence: Neutral · Key Levels: Support ~64.67 | Resistance ~67.29 · News Sentiment: Neutral
7) Sources
- Dow Jones Industrial Average recovers as January CPI cools, rate cut bets surge — https://www.fxstreet.com/news/dow-jones-industrial-average-recovers-as-january-cpi-cools-rate-cut-bets-surge-202602131715
- CZK: Core inflation guides cautious CNB – ING — https://www.fxstreet.com/news/czk-core-inflation-guides-cautious-cnb-ing-202602131712
- USD/JPY eases as softer US CPI caps Dollar gains, Yen demand stays firm — https://www.fxstreet.com/news/usd-jpy-eases-as-softer-us-cpi-caps-dollar-gains-yen-demand-stays-firm-202602131705
- USD/CAD remains bid despite weaker US inflation data — https://www.fxstreet.com/news/usd-cad-remains-bid-despite-weaker-us-inflation-data-202602131623
- ECB: Rates seen unchanged through 2026 – Nordea — https://www.fxstreet.com/news/ecb-rates-seen-unchanged-through-2026-nordea-202602131607
- GBP/USD steady as soft US CPI revives June Fed cut bets — https://www.fxstreet.com/news/gbp-usd-steady-as-soft-us-cpi-revives-june-fed-cut-bets-202602131557
- EUR/CHF eases as Swiss inflation remains muted and Eurozone GDP meets forecasts — https://www.fxstreet.com/news/eur-chf-eases-as-swiss-inflation-remains-muted-and-eurozone-gdp-meets-forecasts-202602131522
- Boe’s Pill: Growth in the UK is positive, but it is not very dynamic — https://www.fxstreet.com/news/boes-pill-growth-in-the-uk-is-positive-but-it-is-not-very-dynamic-202602131519
You may also like: How KGNAI AI ranks instruments across global markets
Disclaimer: KGNAI provides AI-generated analytics and educational market commentary only. This is not financial advice. Markets involve risk. Always do your own research.