CHF/RON (CHFRON) — 10-Jun-2026 Alignment Snapshot with Bearish Short/Mid Bias
The objective is to measure alignment, not to issue directional predictions. This CHF/RON (CHFRON) snapshot, as of 10-Jun-2026, frames how ranks, trend structure, momentum, and volatility are currently positioned relative to a 951-instrument FX universe. Near-term ranks sit in the weaker portion of the distribution (daily #845, weekly #735, monthly #922), while the 3-month rank (#68) stands out as a notable counter-signal. Technically, the blended dashboard leans Bearish via an overall technical score of -0.421, even though the 18-signal confluence reads -0.278 (Neutral), implying mixed micro-signals under a heavier bearish ranking overlay. Momentum conditions remain pressured (RSI(14) 35.65; MACD histogram -0.0112), and volatility is modest (Bollinger bandwidth 0.0183). Key decision zones remain Support ~5.5105 and Resistance ~5.7643.
- Rank stance: Short-term Bearish (daily #845) | Mid-term Bearish (monthly #922) | Long-term: Not available
- Technical confluence label: Neutral (18-signal confluence -0.278), but blended technical view Bearish (overall -0.421)
- Key levels: Support ~5.5105 | Resistance ~5.7643
- News sentiment bias: Neutral (avg 0.046; 25% positive / 63% neutral / 12% negative)
- Confirmation / invalidation condition: A sustained move above 5.7643 supports continuation scenarios; a close below 5.5105 increases deterioration risk (per provided scenario framing).
What KGNAI Measures
KGNAI evaluates assets using large cross-sectional datasets built from millions of structured data points. Inputs incorporate fundamental metrics, technical structures, and systematically processed news sentiment. Statistical models, machine learning, and AI frameworks are used to assess relative positioning, signal alignment, and probabilistic behavior across broad universes.
How to Read This Report
- Ranks are comparative across the tracked universe, not absolute price targets.
- Confluence reflects alignment among independent signal groups.
- Support/resistance levels are probabilistic decision zones, not guarantees.
- Sentiment provides contextual bias within the broader analytical framework.
1) KGNAI AI Analysis
Region: FOREX
Total universe size: 951 ranked instruments
- Daily rank: #845 out of 951 — Bearish
- Weekly rank: #735 out of 951 — Neutral
- Monthly rank: #922 out of 951 — Bearish
- 3-Monthly rank: #68 out of 951 — Bullish
- 6-Monthly rank: Not available for this horizon — Not available
- Yearly rank: Not available for this horizon — Not available
Cross-horizon ranks show a clear near-term weakness in CHF/RON positioning versus peers, with the daily reading at #845 and the monthly at #922—both deep in the weaker tail of the 951-instrument universe. The weekly rank at #735 softens the message to Neutral, but still sits well below median strength in a comparative framework.
The analytical tension is the 3-month rank at #68 (Bullish), which implies a materially stronger intermediate window than the daily/monthly horizons. This kind of horizon split often appears when a prior multi-week upswing (or stabilization) has not fully transitioned into durable short-term strength, or when recent price action is undermining a previously constructive regime.
Data coverage is also a constraint for longer horizons: 6-monthly and yearly ranks are Not available in the provided data. That limits the ability to distinguish whether the 3-month strength is part of a broader long-duration trend or a standalone swing within a wider range.
Term view: Short-term Bearish | Mid-term Bearish | Long-term Not available
2) Price & trend overview
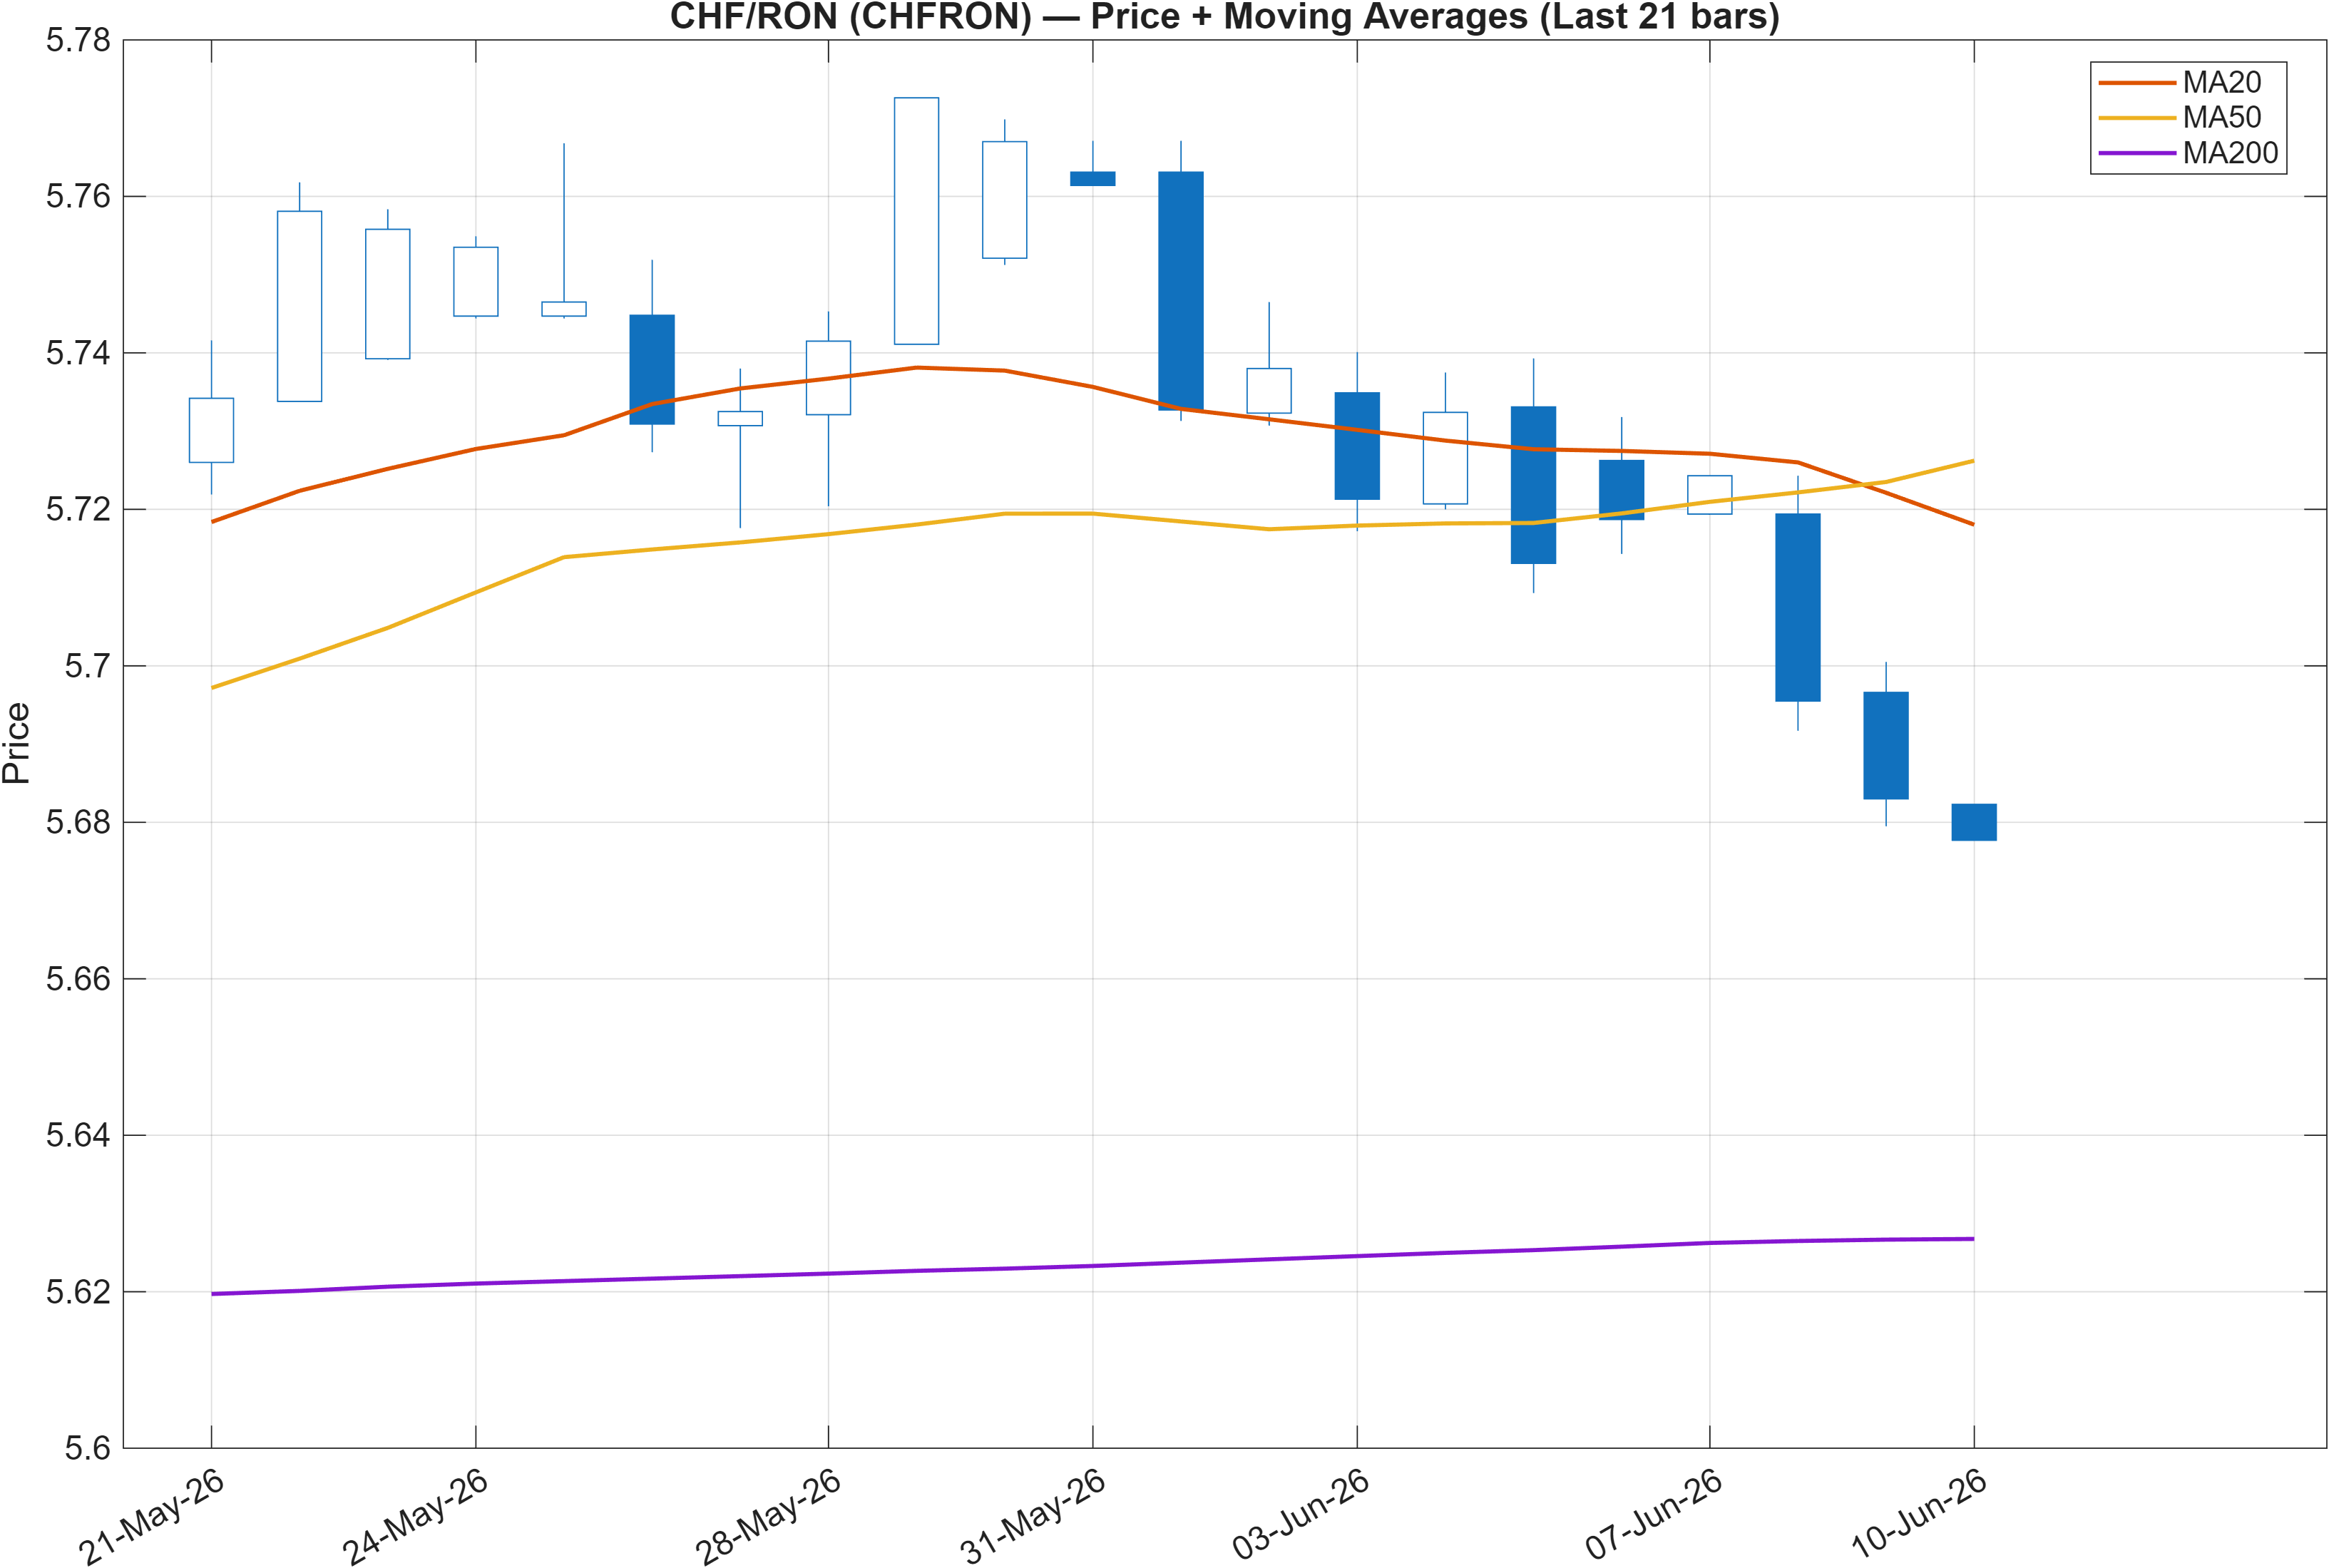
The moving-average read is explicitly mixed: Close vs MA50 = Bearish, while MA50 vs MA200 = Bullish. This configuration is typical of an instrument that is pulling back within a broader up-structure—price is currently below its intermediate trend proxy, yet the intermediate average remains above the long-term average.
The rank profile reinforces the idea of short-term deterioration against a background of previously stronger behavior: daily #845 and monthly #922 contrast sharply with the 3-month #68. In practice, that divergence often maps to a regime where the longer baseline remains constructive, but the most recent sequence of closes is no longer consistent with that prior strength.
From a structure standpoint, attention naturally concentrates around the nearby decision bands provided later: 5.5105 (support) and 5.7643 (resistance). When the close is bearish versus MA50, the market is frequently more sensitive to these levels because marginal rallies can fail quickly, while breaks lower can accelerate if the prior intermediate trend unwinds.
Trend framing is therefore less about a single direction and more about who controls the intermediate mean (MA50) relative to the long baseline (MA200). The current signals indicate that CHFRON is testing that handoff, with near-term ranks arguing that the short window is not yet stabilizing.
3) Momentum & volatility dashboard
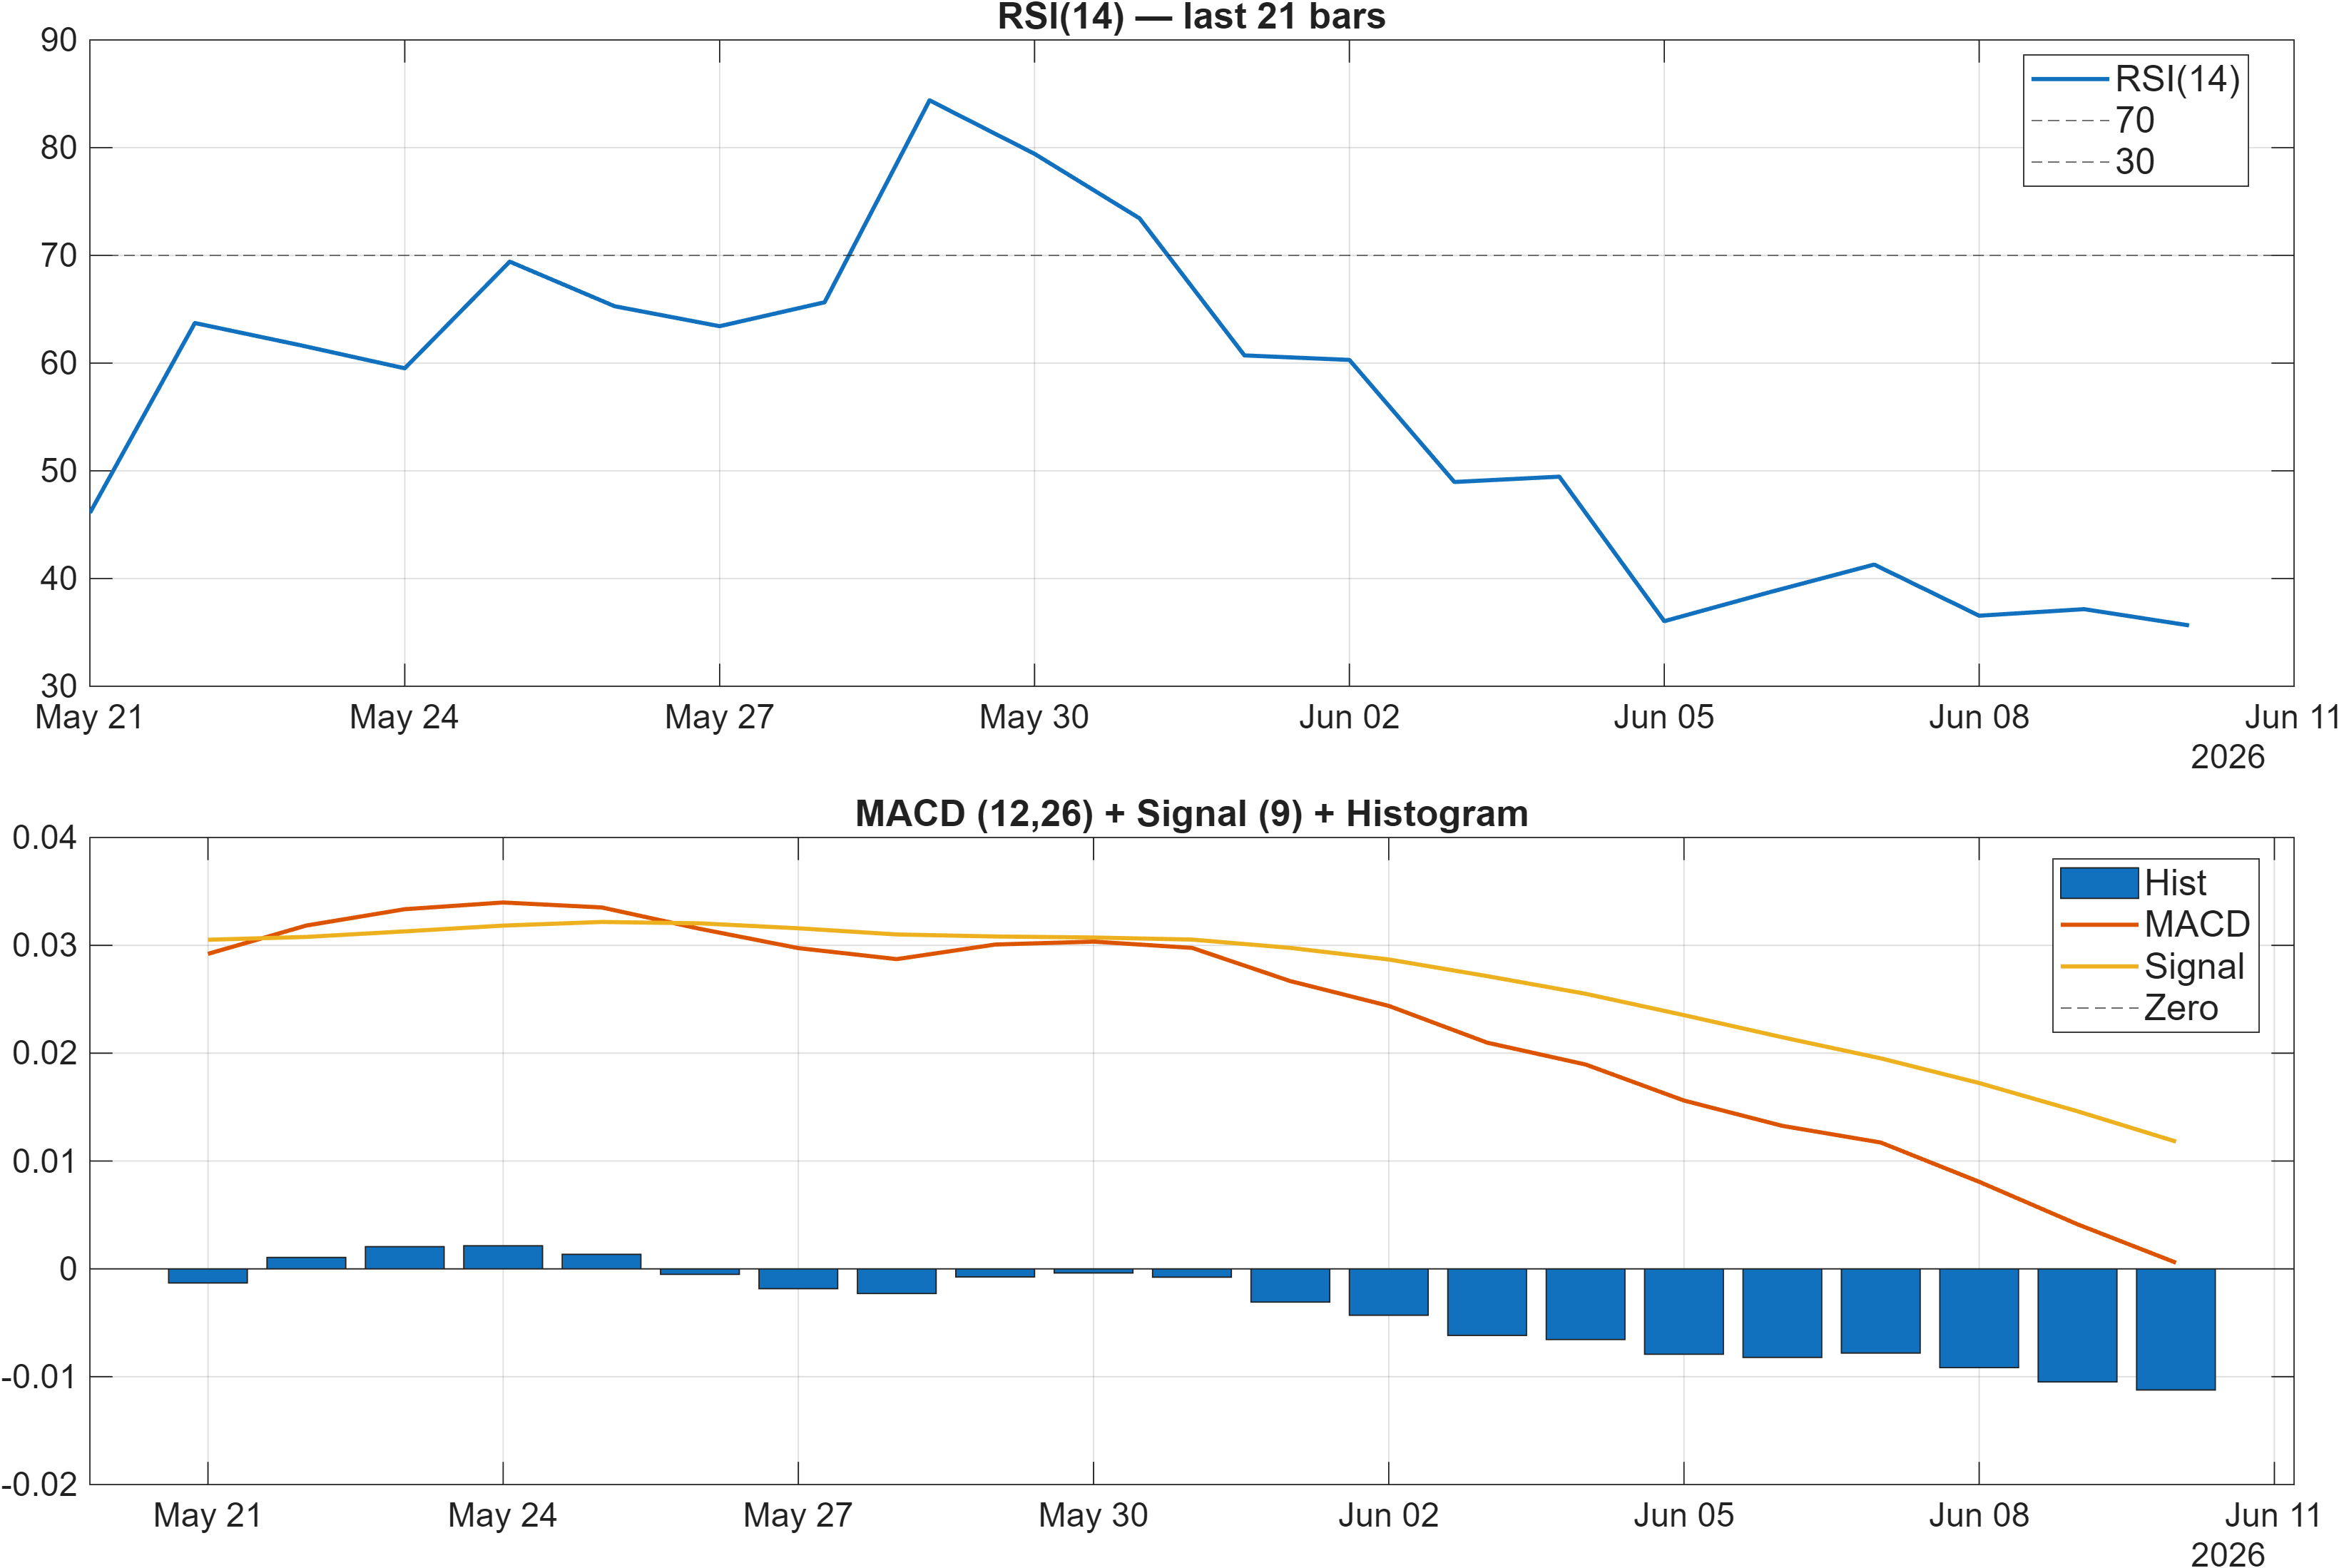
Momentum is biased to the downside in the provided readings. The dashboard flags RSI bias = Bearish, with RSI(14) at 35.65, a level that commonly coincides with weak internal demand and limited upside follow-through unless conditions begin to base. In parallel, the MACD histogram is -0.0112, keeping the short-term momentum impulse negative rather than mean-reverting.
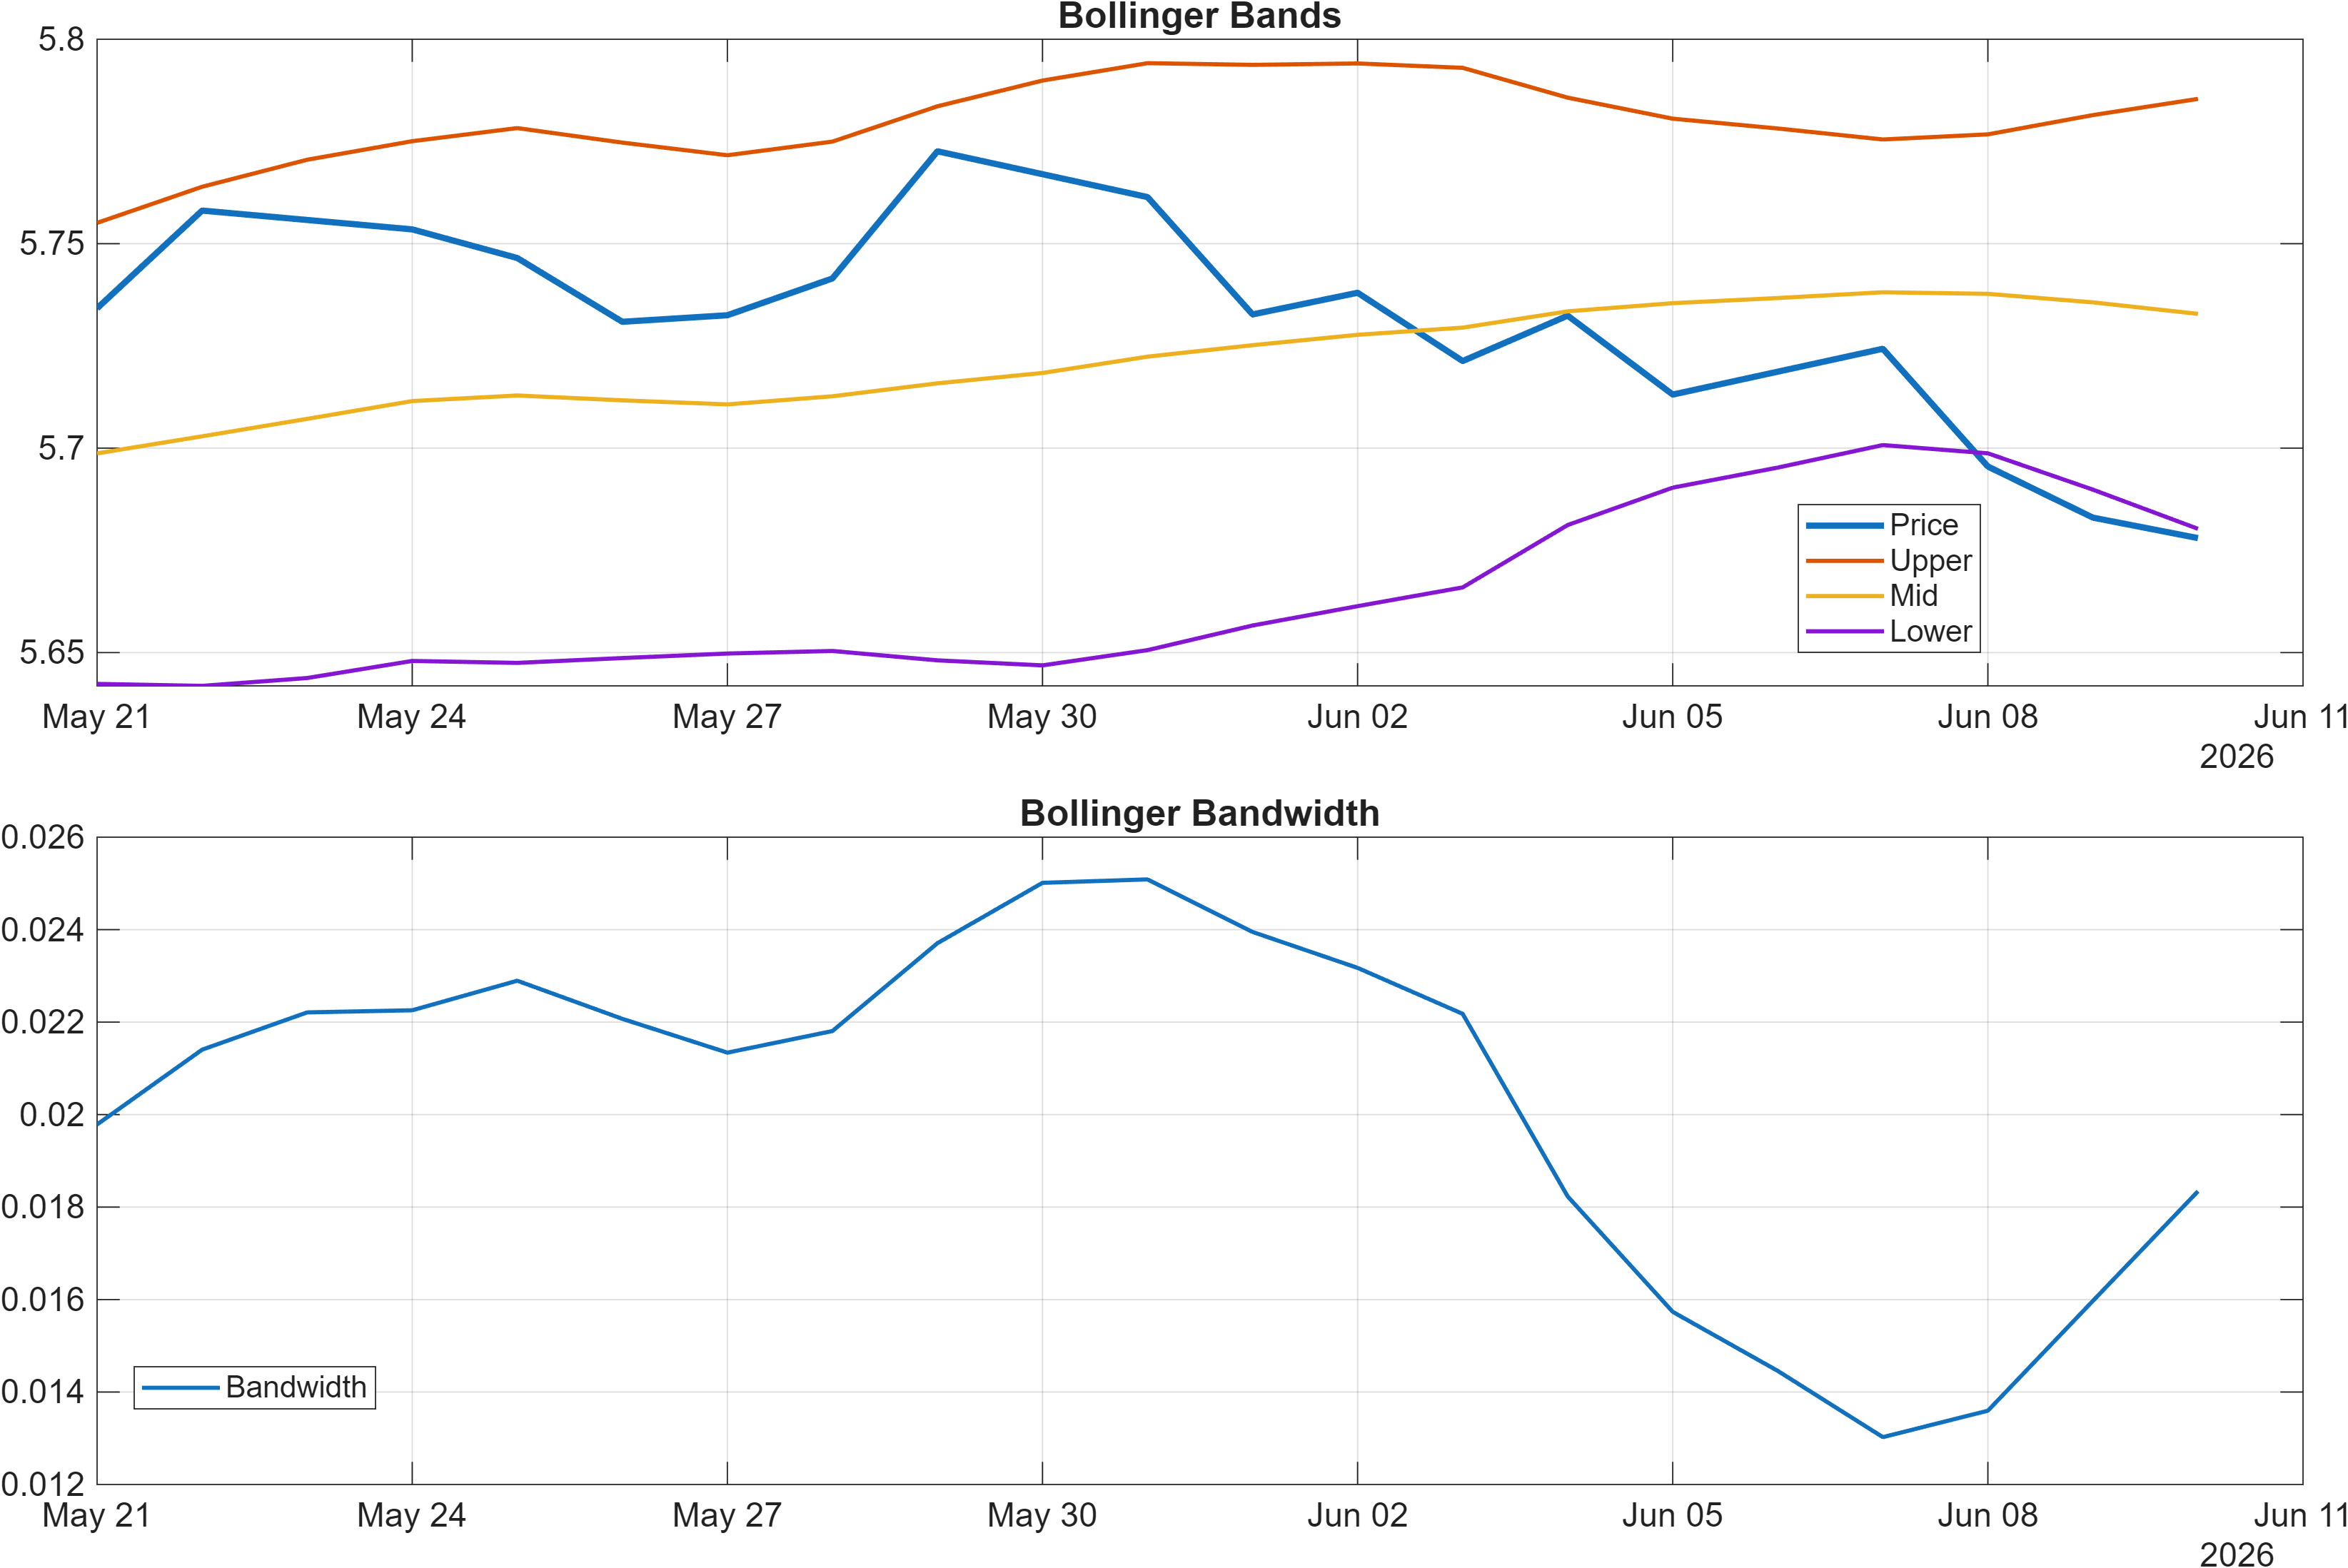
Volatility, however, does not currently suggest a fully expanded risk regime. Bollinger bandwidth is 0.0183, which points to comparatively contained dispersion in recent trading ranges. When volatility is muted while momentum is bearish, the market can enter a compression phase—persistent drift lower without dramatic swings—until a catalyst forces range expansion.
This is where the cross-horizon ranks matter. A strongly positive 3-month rank (#68) coexisting with depressed daily and monthly ranks (#845 and #922) is consistent with momentum that has rolled over after a prior constructive stretch. In that setup, RSI in the mid-30s can either precede stabilization (if selling pressure exhausts) or precede continuation (if compression breaks lower).
Net: the current state reads as bearish momentum under relatively controlled volatility. Monitoring whether bandwidth begins to rise alongside improving (or worsening) RSI/MACD conditions is often more informative than any single point reading.
4) Support / Resistance zones
Support ~ 5.5105 | Resistance ~ 5.7643
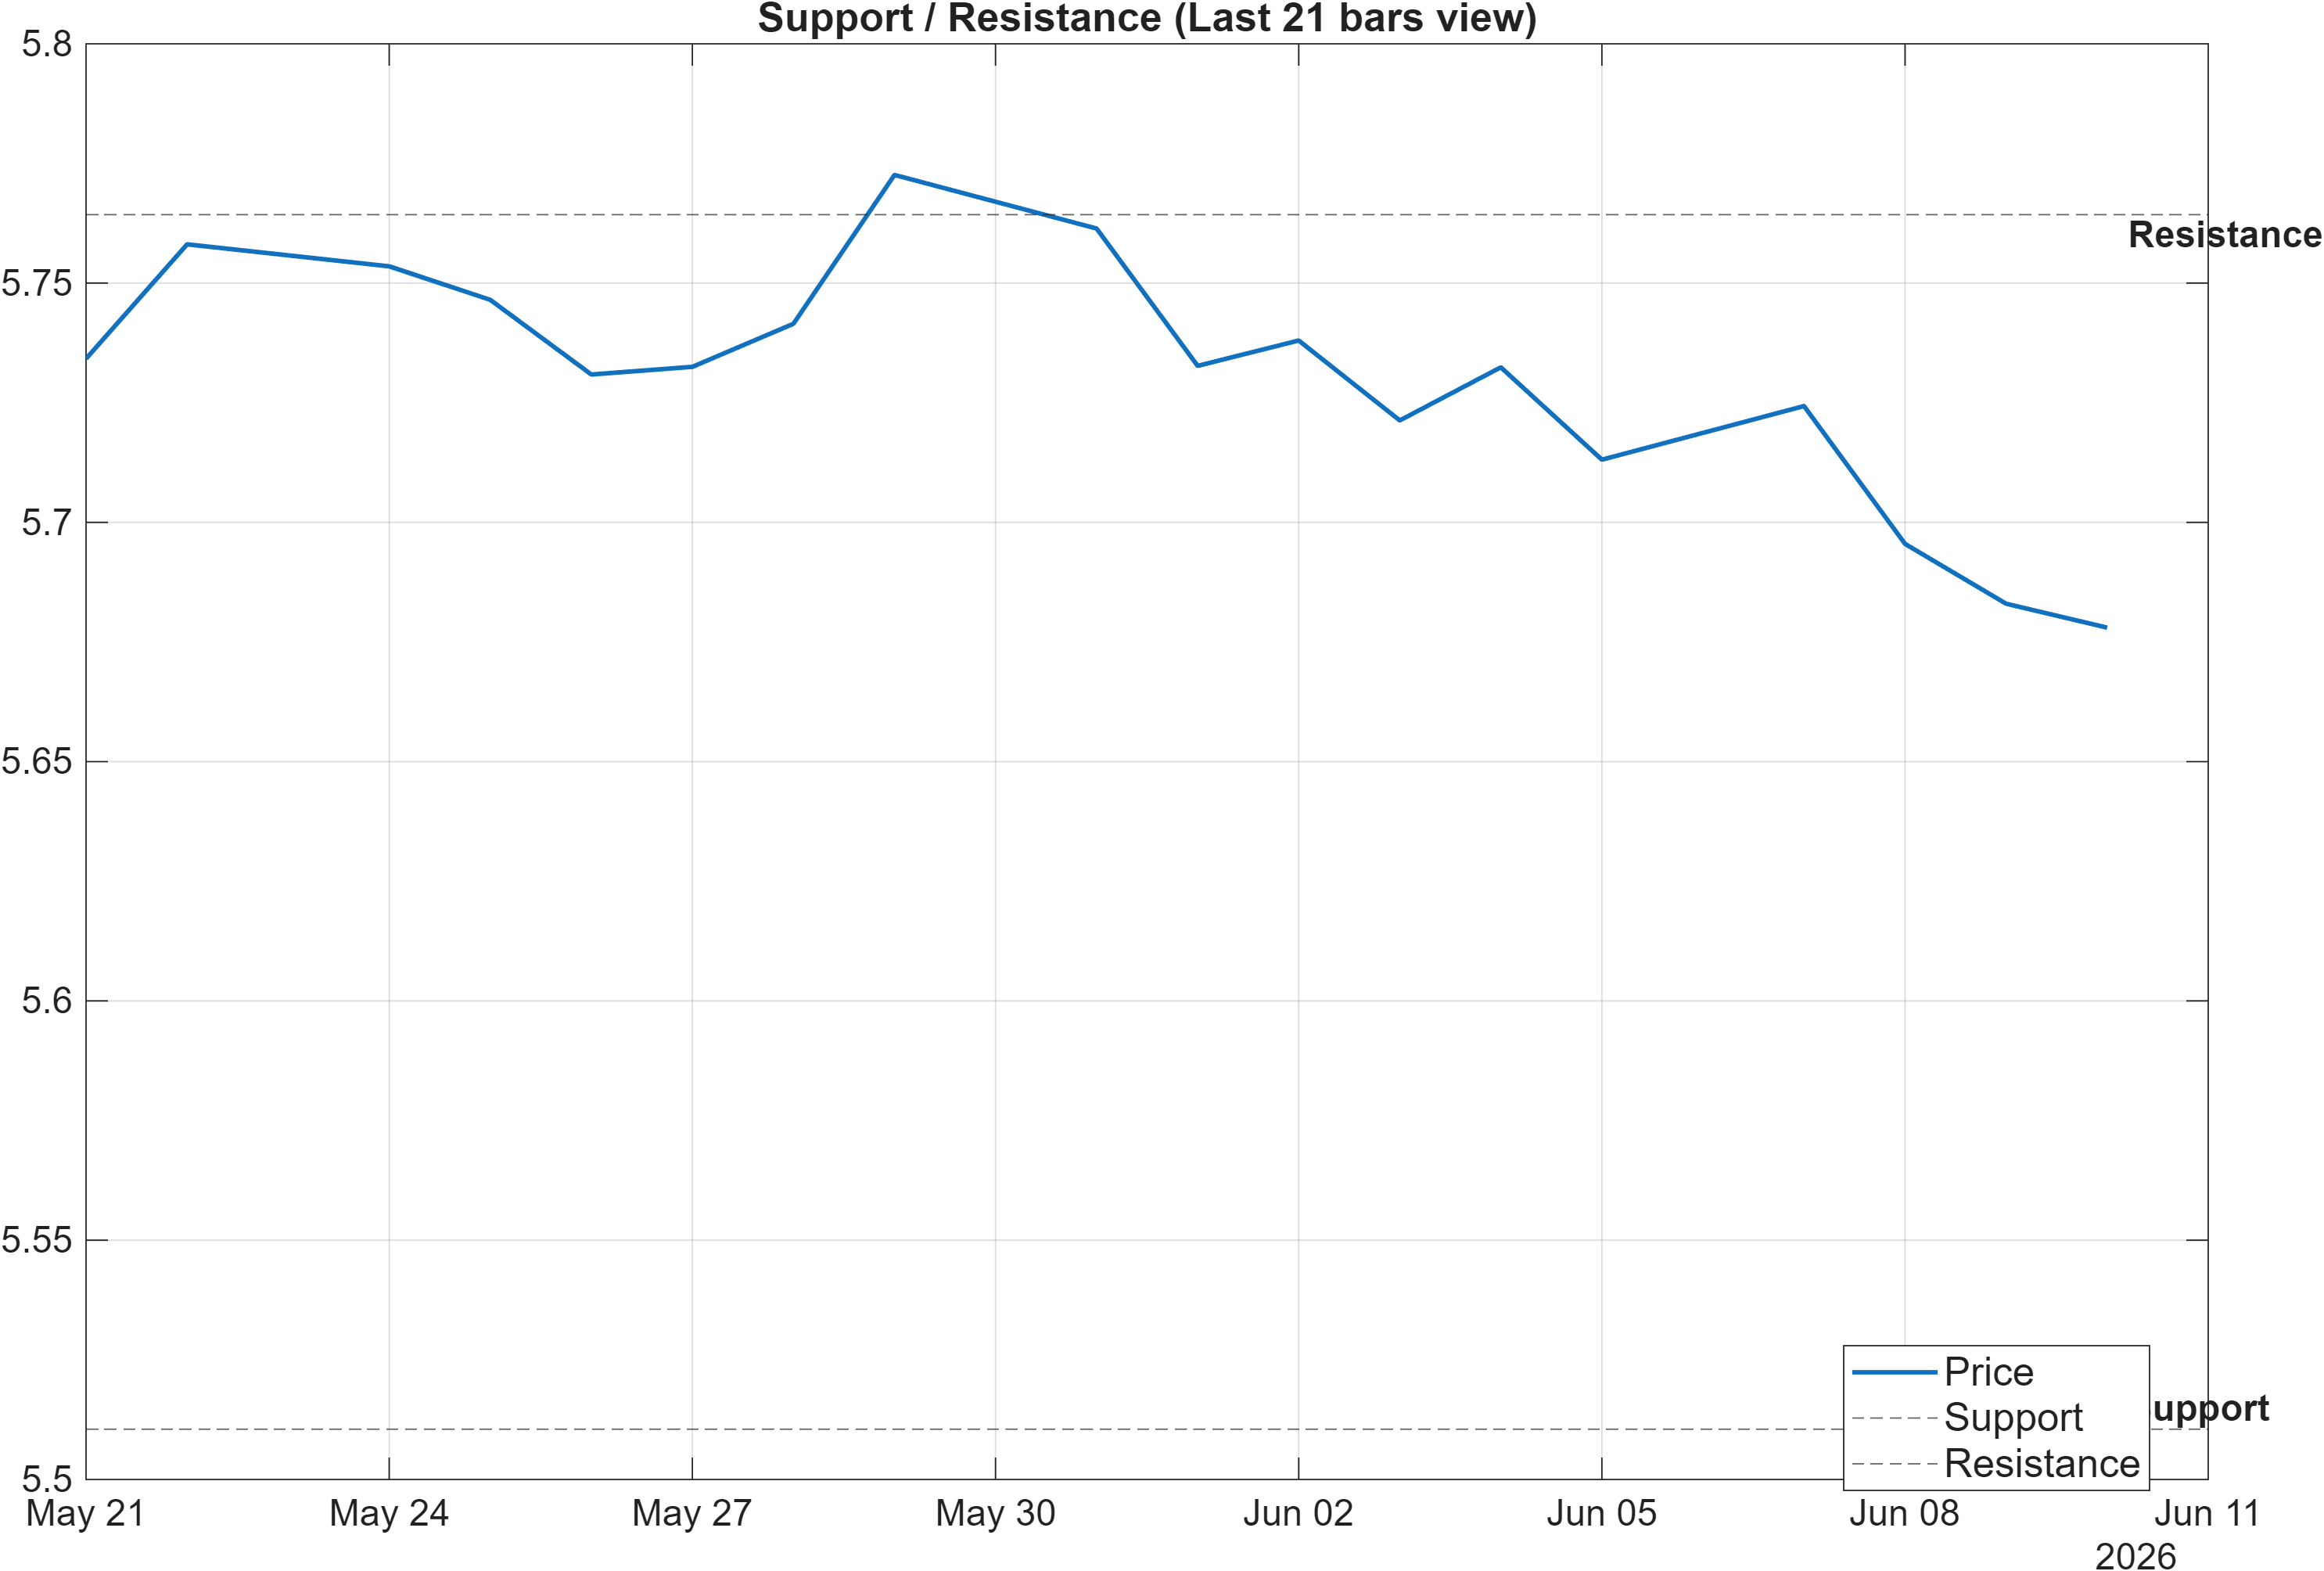
The current levels define a clear operating range. With momentum weak (RSI(14) 35.65; MACD histogram -0.0112) and the short-term ranks sitting in the lower tier of the universe (daily #845; monthly #922), the support band near 5.5105 becomes the primary risk reference: it is the point where bearish pressure would be most visibly validated in price structure.
Conversely, 5.7643 is the nearest area where a recovery attempt would be forced to demonstrate persistence. The provided scenario framing is explicit: break above resistance with volume → continuation, while a close below support → signal deterioration risk. Even without adding volume metrics beyond what is provided, the structural implication is that rallies into resistance are more likely to be treated as tests until they resolve cleanly.
The mixed moving-average read (Close vs MA50 bearish; MA50 vs MA200 bullish) also makes these levels more consequential. In that regime, price can whip between “reversion to the intermediate mean” and “renewed breakdown,” and the levels help separate those narratives without relying on prediction.
Practically, the zone between 5.5105 and 5.7643 is where signal conflict is most likely to persist: near-term momentum argues caution, while the 3-month rank (#68) argues that the broader backdrop has not been uniformly weak.
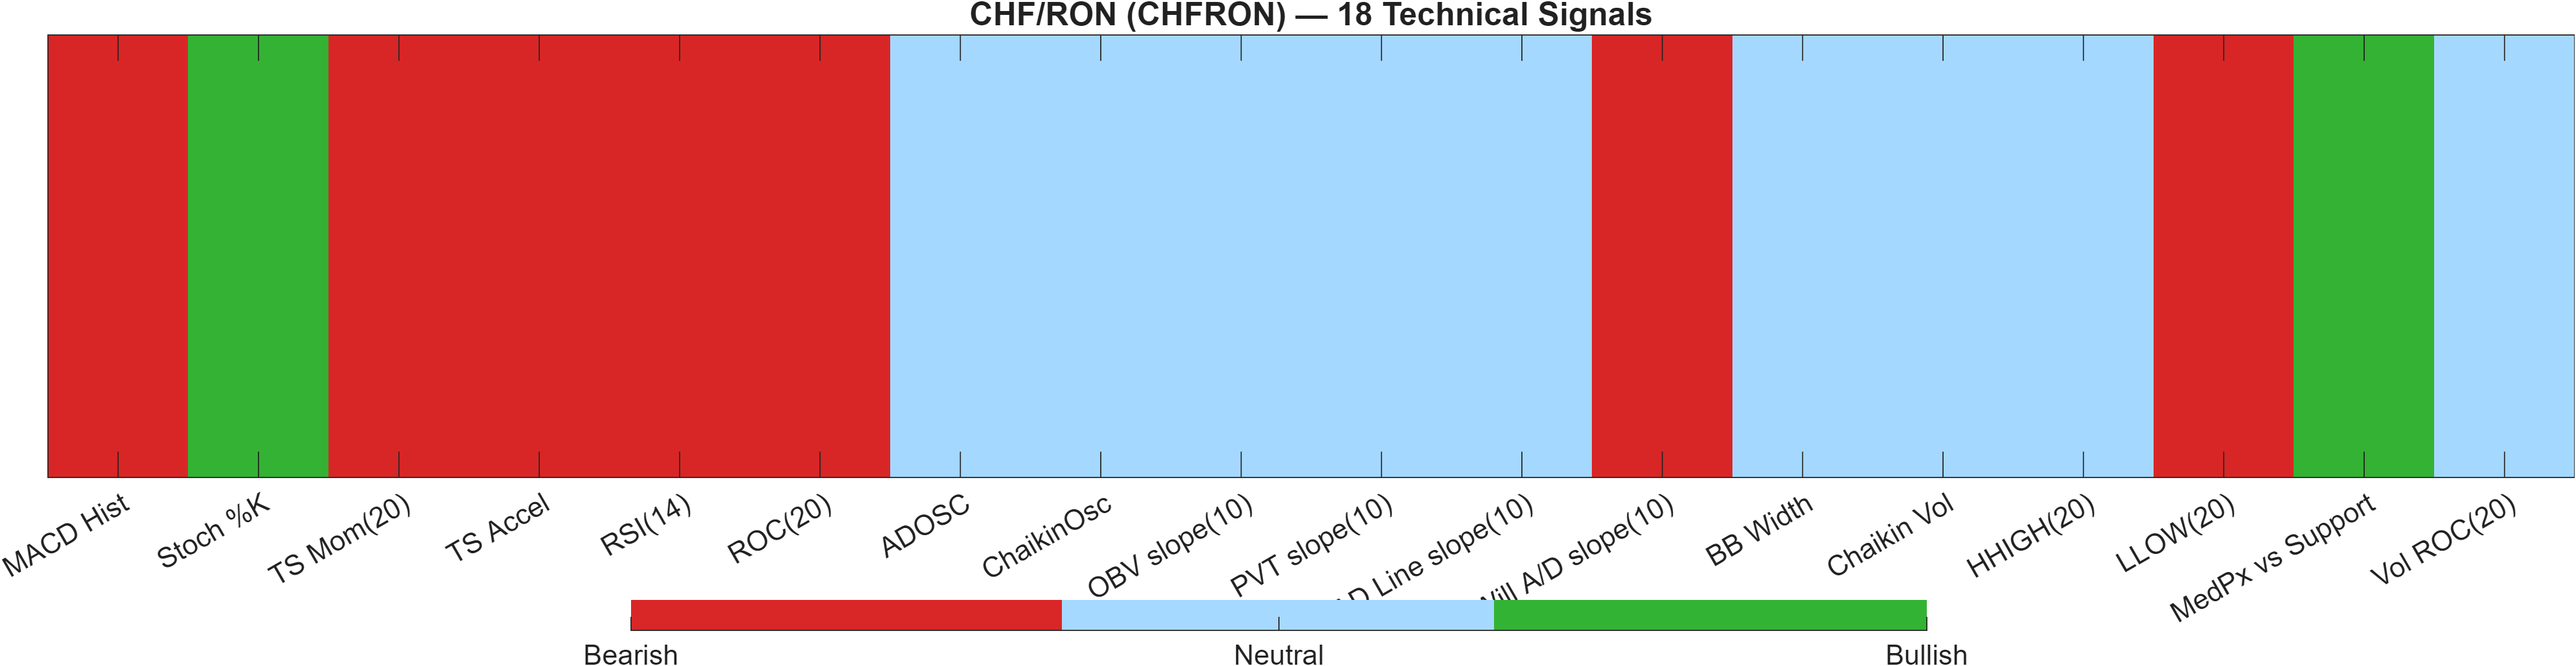
5) Quant Technical Dashboard (18 Signals)
KGNAI AI Technical Analysis Score (Deep Reinforcement Learning): Rank #834 out of 951 (Rank 1 represents the strongest technical positioning and a higher probability of favorable price behavior. As ranks increase toward the maximum, the probability of favorable outcomes weakens and bearish positioning becomes more dominant.) | Label: Bearish | Score: -0.754
18-Signal Technical Confluence Score: -0.278 (Neutral)
Overall Technical Score (18-signal confluence + DRL rank blend): -0.421 (Bearish)
Note: The blended score reflects signal strength weighted against broader AI technical ranking, which may temporarily diverge.
Blended technical score breakdown: -0.421 (Bearish | Bull 2 / Bear 7 / Neutral 9)
The technical stack highlights a key distinction between indicator confluence and cross-sectional technical positioning. The 18-signal confluence score is -0.278 (Neutral), suggesting mixed local readings rather than unanimous downside. Yet the DRL technical rank is #834 out of 951 with a score of -0.754, pulling the blended outcome to an overall technical score of -0.421 (Bearish).
This spread is consistent with a market that may not be flashing extreme single-indicator stress, but is still unfavorable versus peers in pattern/structure terms. The breakdown (Bull 2 / Bear 7 / Neutral 9) supports that read: most signals are either bearish or non-committal, leaving limited bullish confirmation despite a few isolated positives.
Within the indicator set, bearish momentum markers align with Section 3 (e.g., RSI(14) 35.65; MACD histogram -0.01123 in the signal table). At the same time, the presence of many Neutral volume/flow-derived signals (multiple “0” slopes and Neutral readings) implies that the bearish case is driven more by price-based momentum and range behavior than by a strong distribution signature in the provided fields.
Signal table (Bull/Bear/Neutral)
| Indicator | Value | Signal |
|---|---|---|
| MACD Hist | -0.01123 | Bearish |
| Stoch %K | 0 | Bullish |
| TS Mom(20) | -0.0804 | Bearish |
| TS Accel | -0.168 | Bearish |
| RSI(14) | 35.65 | Bearish |
| ROC(20) | -1.391 | Bearish |
| ADOSC | 0 | Neutral |
| ChaikinOsc | 0 | Neutral |
| OBV slope(10) | 0 | Neutral |
| PVT slope(10) | 0 | Neutral |
| AD Line slope(10) | 0 | Neutral |
| Will A/D slope(10) | -0.1001 | Bearish |
| BB Width | 0.01834 | Neutral |
| Chaikin Vol | -21.49 | Neutral |
| HHIGH(20) | 5.773 | Neutral |
| LLOW(20) | 5.678 | Bearish |
| MedPx vs Support | 0.1695 | Bullish |
| Vol ROC(20) | — | Neutral |
The main analytical takeaway is divergence between local signal neutrality and broader technical weakness. In these conditions, level behavior (support/resistance) often becomes the primary arbiter of whether signals re-align toward stabilization or slide toward deeper bearish confirmation.
6) News sentiment + extractive gist
Note: Instrument-specific news matches were not found, so the digest reflects broader macro/market coverage that can influence FX risk appetite. The aggregate sentiment distribution is 0.046 on average with 25% positive, 63% neutral, and 12% negative, which is consistent with a Neutral informational backdrop rather than a single dominant narrative.
Positive Developments
Recent coverage across major financial outlets indicates that risk assets continue to absorb technology and AI-related innovation narratives alongside routine macro scheduling. The constructive tone is less about CHF/RON specifically and more about broader market expectations around productivity-linked themes, with some reporting emphasizing the continued cadence of AI model releases and their perceived relevance for enterprise workflows. In FX context, such narratives can support periods of steadier risk appetite when not overwhelmed by rates or geopolitics. Separately, routine calendar focus across Asia highlights ongoing attention to inflation and producer-price dynamics, which can shape relative-rate expectations and second-order currency flows. Overall, the positive contribution here is incremental: it improves the backdrop for orderly trading but does not, by itself, resolve the bearish technical alignment reflected by the daily #845 and monthly #922 ranks.
Neutral / Mixed Developments
The dominant neutral theme is macro data watch, especially inflation releases and central-bank positioning implications. Coverage suggests markets are preparing for CPI-related outcomes and interpreting price pressures through the lens of energy costs and supply-side constraints. For CHF crosses and regional EM FX, this typically translates into a “wait for confirmation” posture: rates volatility can rise around releases, but directionality is often delayed until follow-through appears in yields and risk premia. This neutrality is consistent with the report’s broader signal mix—technical confluence at -0.278 (Neutral) alongside subdued volatility (bandwidth 0.0183)—where markets may remain range-aware until a decisive catalyst emerges.
Negative / Risk Signals
Risk coverage is dominated by geopolitical escalation and associated energy-market sensitivity. Aggregated reporting emphasizes uncertainty around conflict dynamics, potential spillovers to oil pricing, and the resulting implications for inflation expectations and central-bank reaction functions. For FX, these episodes can tighten liquidity, push correlations higher, and favor defensive positioning—conditions that can reinforce bearish short-term ranks when the price is already under its MA50. While the sentiment split shows only 12% negative items, the impact of geopolitical risk can be nonlinear; even modest negative flow may matter more than its share suggests. In this context, the support at 5.5105 becomes a practical downside reference if risk-off conditions persist.
- Whether price action holds above 5.5105 amid macro/geopolitical headlines.
- Any shift in momentum conditions (RSI(14) 35.65; MACD histogram -0.0112) alongside changes in bandwidth (0.0183).
- Whether the horizon split (3-month #68 vs monthly #922) narrows via stabilization or further weakness.
Sources referenced: Reuters, Bloomberg, Yahoo Finance, MarketWatch, Investing.com
7) Sources
Not available in the provided data.
You may also like: How KGNAI AI ranks instruments across global markets
Disclaimer: KGNAI provides AI-generated analytics and educational market commentary only. This is not financial advice. Markets involve risk. Always do your own research.