NZDDKK (New Zealand Dollar/Danish Krone) — 19-Jun-2026 Technical & Rank View: Neutral with Short-Term Lift, Momentum Still Heavy
NZDDKK shows a mixed, confirmation-dependent setup: a comparatively strong daily rank (#97 of 915) contrasts with more subdued positioning on longer horizons (weekly #310 and monthly #334). Technically, the picture remains broadly Neutral on KGNAI’s blended framework (-0.113), but the internal composition matters: momentum readings skew bearish (RSI(14) 32.81; MACD histogram -0.002692), while volatility is relatively contained (Bollinger bandwidth 0.0280). That combination often produces range behavior around decision levels rather than clean trend extension. The closest probabilistic inflection points remain the defined zones at support ~3.7413 and resistance ~3.8074. With news sentiment broadly steady (avg 0.050, and 81% neutral), the next phase is likely dictated more by price confirmation at these levels than by narrative impulse.
Key Takeaways
- Rank stance (Short / Mid / Long): Neutral / Neutral / Neutral; notable short-term strength via daily rank #97 versus weekly #310 and yearly #315.
- Technical confluence label: Neutral with blended score -0.113 (Bull 3 / Bear 5 / Neutral 10).
- Key levels: Support ~3.7413 and Resistance ~3.8074 as primary decision zones.
- News sentiment bias: Neutral (avg 0.050; 81% neutral; 0% negative).
- Confirmation / invalidation: A break above 3.8074 supports continuation; a close below 3.7413 increases deterioration risk per the scenario framework.
What KGNAI Measures
KGNAI evaluates assets using large cross-sectional datasets built from millions of structured data points. Inputs incorporate fundamental metrics, technical structures, and systematically processed news sentiment. Statistical models, machine learning, and AI frameworks are used to assess relative positioning, signal alignment, and probabilistic behavior across broad universes.
How to Read This Report
- Ranks are comparative across the tracked universe, not absolute price targets.
- Confluence reflects alignment among independent signal groups.
- Support/resistance levels are probabilistic decision zones, not guarantees.
- Sentiment provides contextual bias within the broader analytical framework.
1) KGNAI AI Analysis
Region: FOREX
Total universe size: 915 ranked instruments
- Daily rank: #97 out of 915 — Bullish
- Weekly rank: #310 out of 915 — Neutral
- Monthly rank: #334 out of 915 — Neutral
- 3-Monthly rank: #434 out of 915 — Neutral
- 6-Monthly rank: #319 out of 915 — Neutral
- Yearly rank: #315 out of 915 — Neutral
Cross-horizon alignment: short-term strength vs longer-horizon neutrality
The rank curve is constructive on the shortest horizon but does not yet translate into mid- or long-horizon confirmation. The daily rank (#97 of 915) places NZDDKK in the upper tier of the universe on a near-term basis, while the weekly #310, monthly #334, and yearly #315 sit closer to the middle of the distribution. That split typically characterizes a market attempting stabilization (or a tactical rebound) inside a broader neutral regime rather than a clean, persistent trend.
The intermediate window adds nuance: the 3-month rank (#434) is weaker than the weekly/monthly readings, implying that the recent daily improvement may be emerging from a less favorable prior regime. This matters because the framework is intentionally conservative; rank changes are monitored for persistence, not isolated jumps. In practice, the daily strength is more informative as a “tactical tilt” until the weekly and monthly ranks begin to compress toward the top quartile.
Stated term views remain Neutral across short-, mid-, and long-term, consistent with a signal stack that is not yet uniformly aligned. For positioning discipline, the key is to treat the current cross-horizon spread as a probability shift, not a directional guarantee: the daily signal is improved, but it is not yet corroborated by the broader rank structure.
2) Price & trend overview
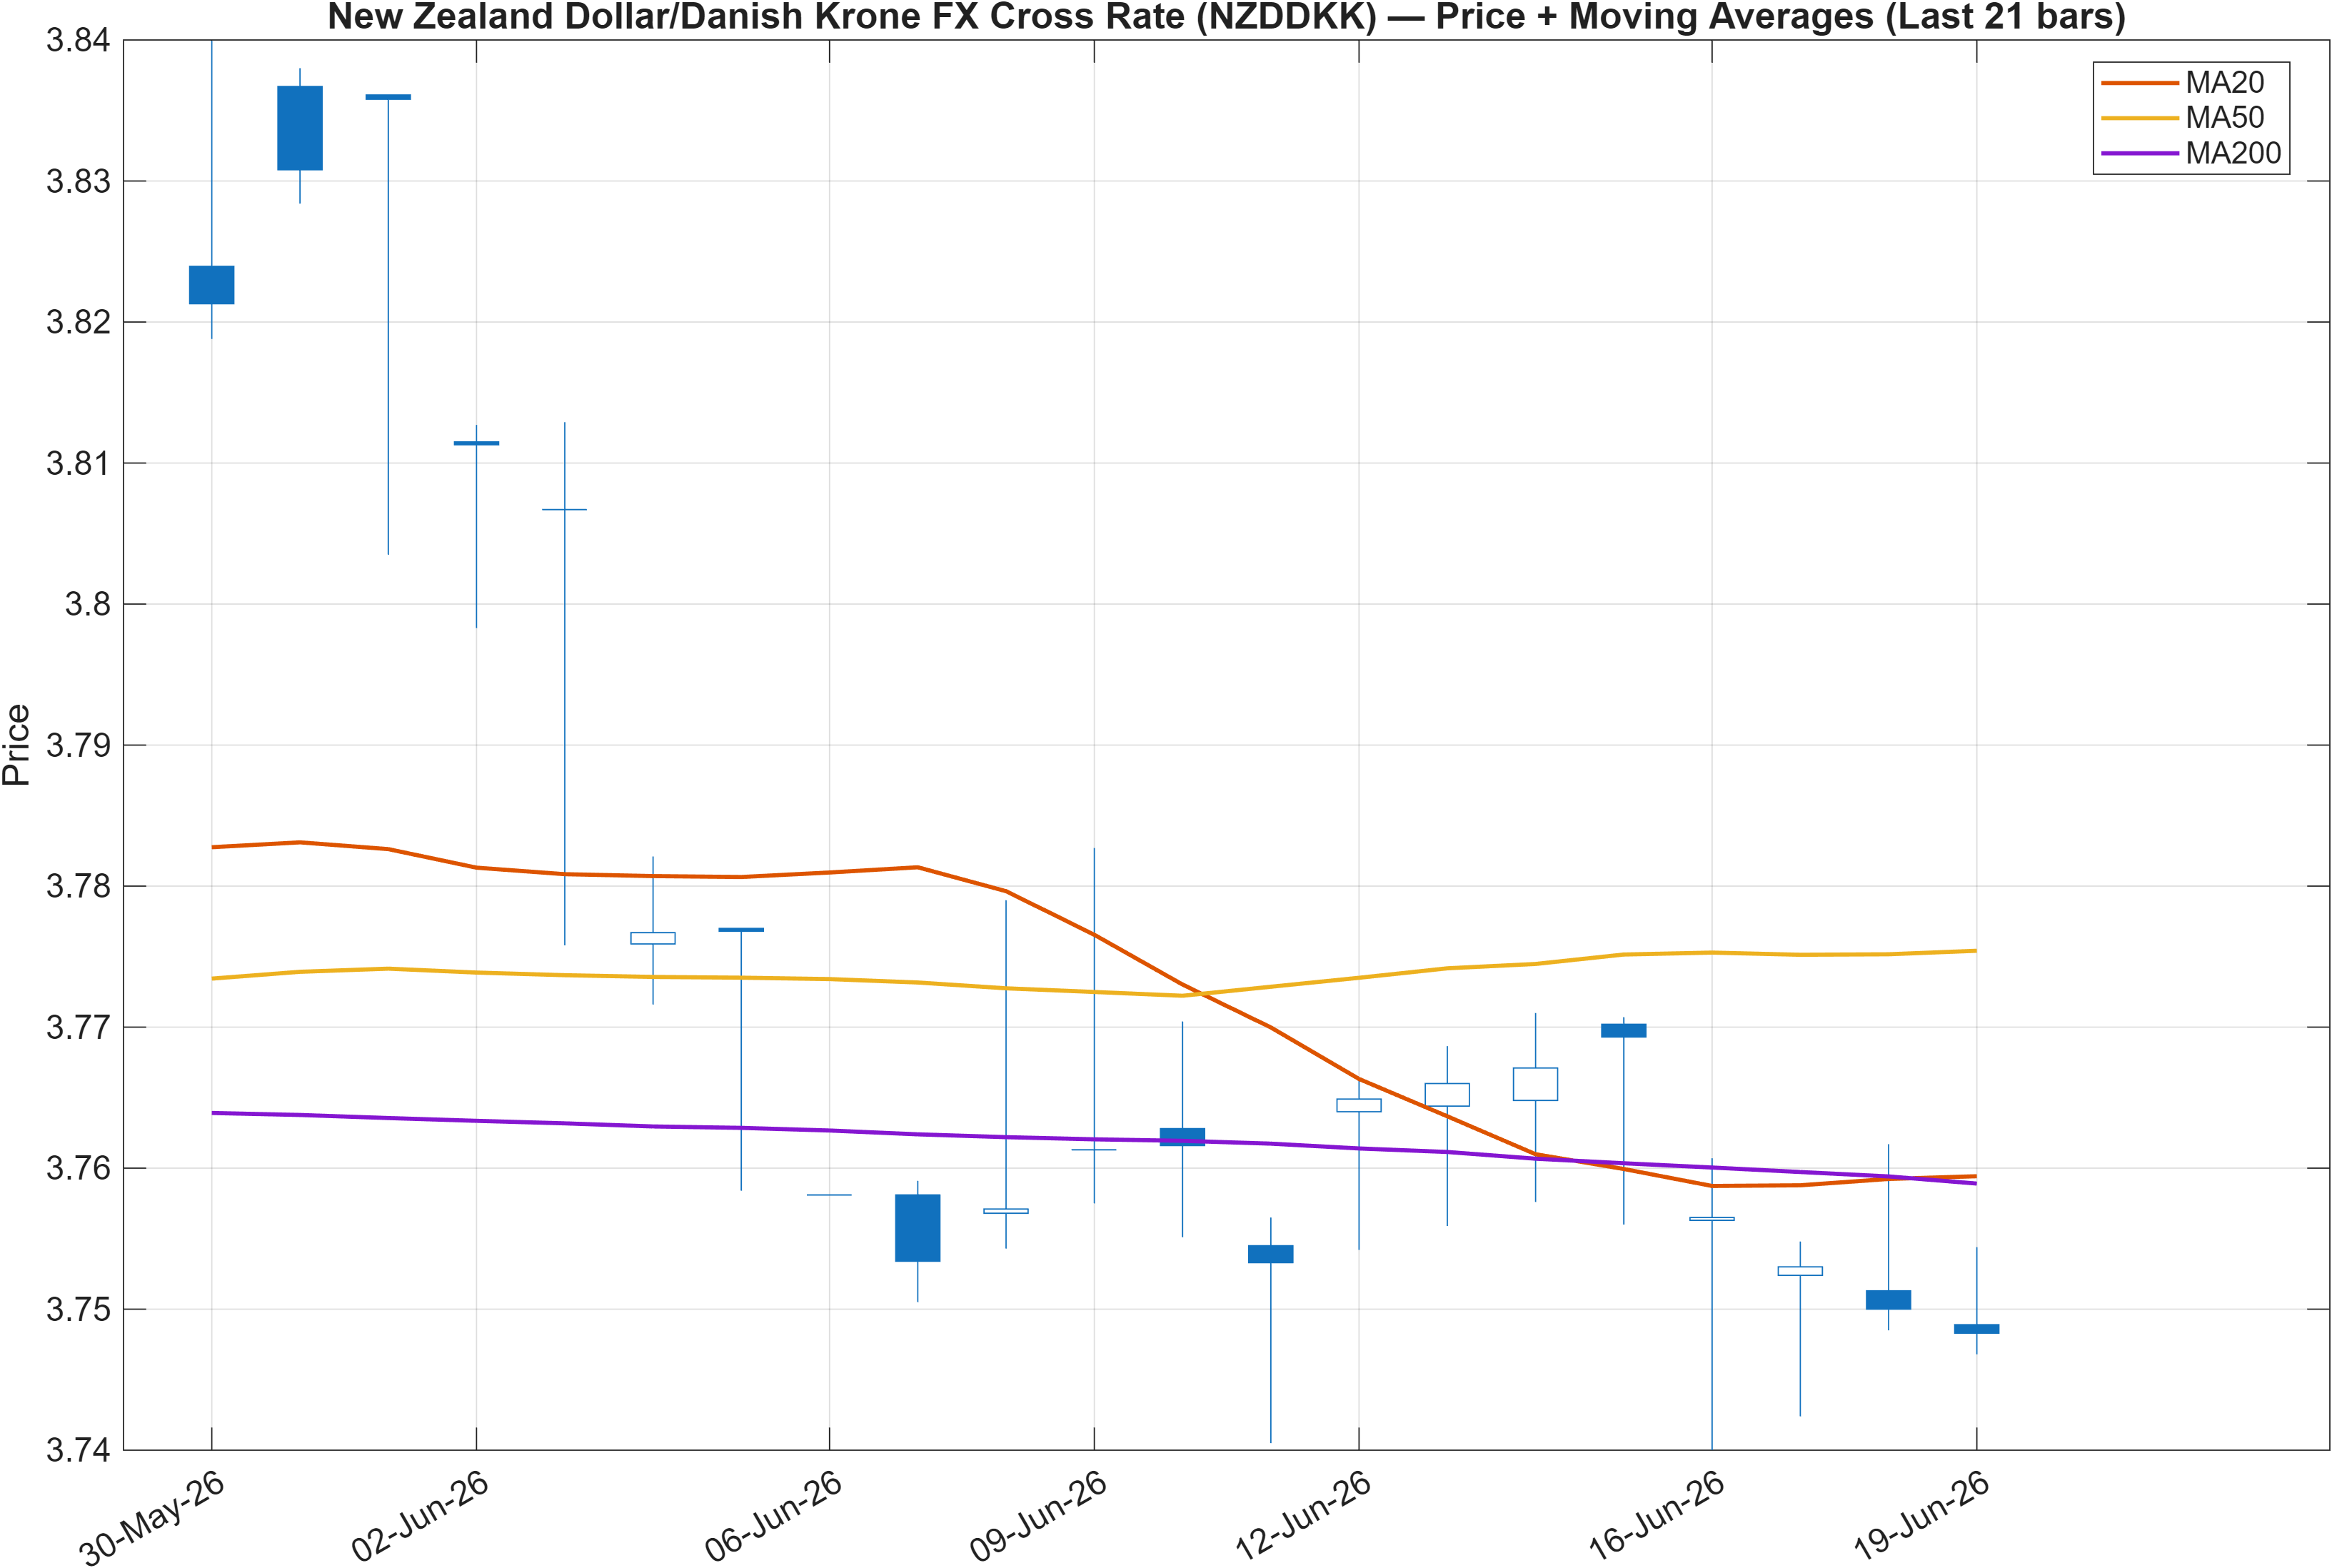
Interpretation: Close vs MA50 = Bearish, MA50 vs MA200 = Bullish.
Regime diagnosis: pullback within a longer-term constructive slope
The moving-average configuration is explicitly split: close vs MA50 is bearish, but MA50 vs MA200 is bullish. This is a classic “two-speed” condition—short-term price is trading below its intermediate trend proxy, while the intermediate trend remains above the longer-term benchmark. In market-structure terms, this often maps to a corrective phase that has not yet invalidated the broader trend scaffold.
This split aligns with the rank profile: strong daily rank (#97) suggests improved short-term behavior relative to peers, yet neutral longer-horizon ranks (weekly #310, yearly #315) imply the market still needs follow-through to rebuild multi-week trend confidence. The price/MA relationship provides the operational framing: until price can regain and hold above the MA50, tactical strength may remain vulnerable to being “sold into” by the prevailing short-term pressure.
A useful way to reconcile this is through confirmation sequencing. If the MA50/MA200 relationship stays bullish while price works back above MA50, the system tends to transition from “correcting” toward “resuming.” If instead the bearish close vs MA50 persists and pulls the MA50 lower, the longer-term bullish structure can become less informative. With volatility currently moderate (bandwidth 0.0280), trend signals can shift without dramatic price expansion, making closes around key levels particularly relevant.
3) Momentum & volatility dashboard
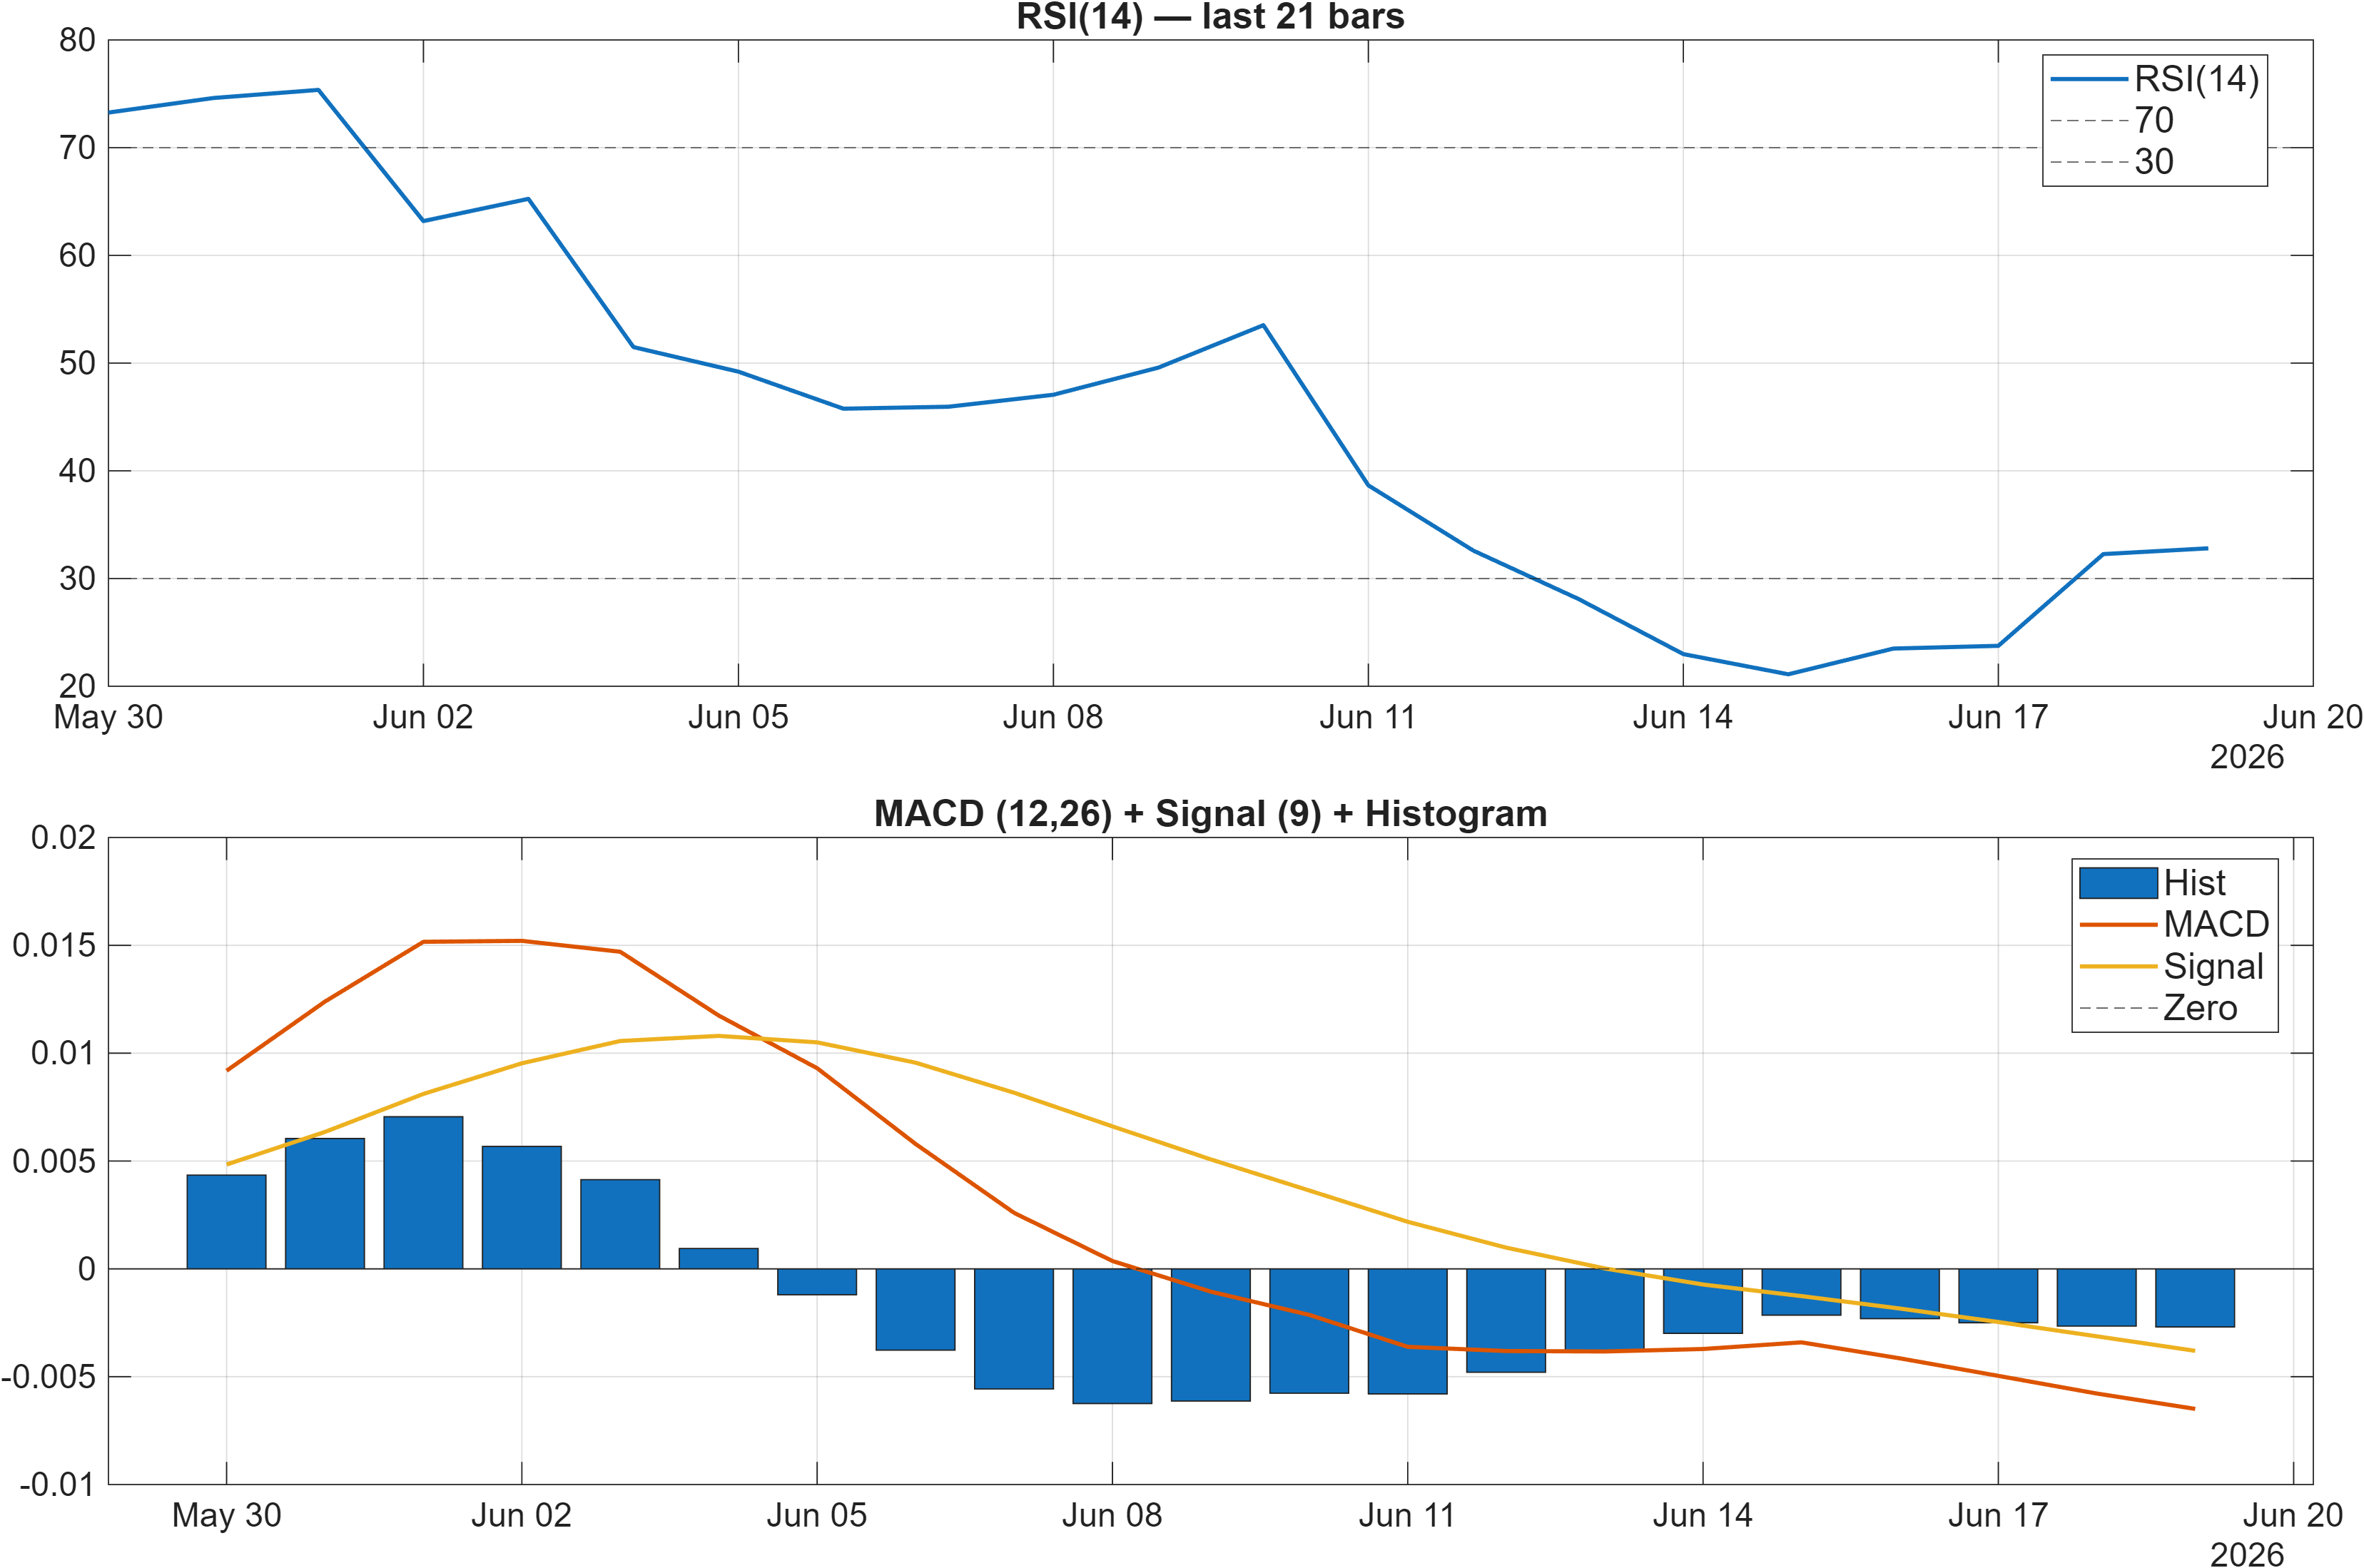
Interpretation: RSI bias = Bearish, MACD hist = -0.0027.
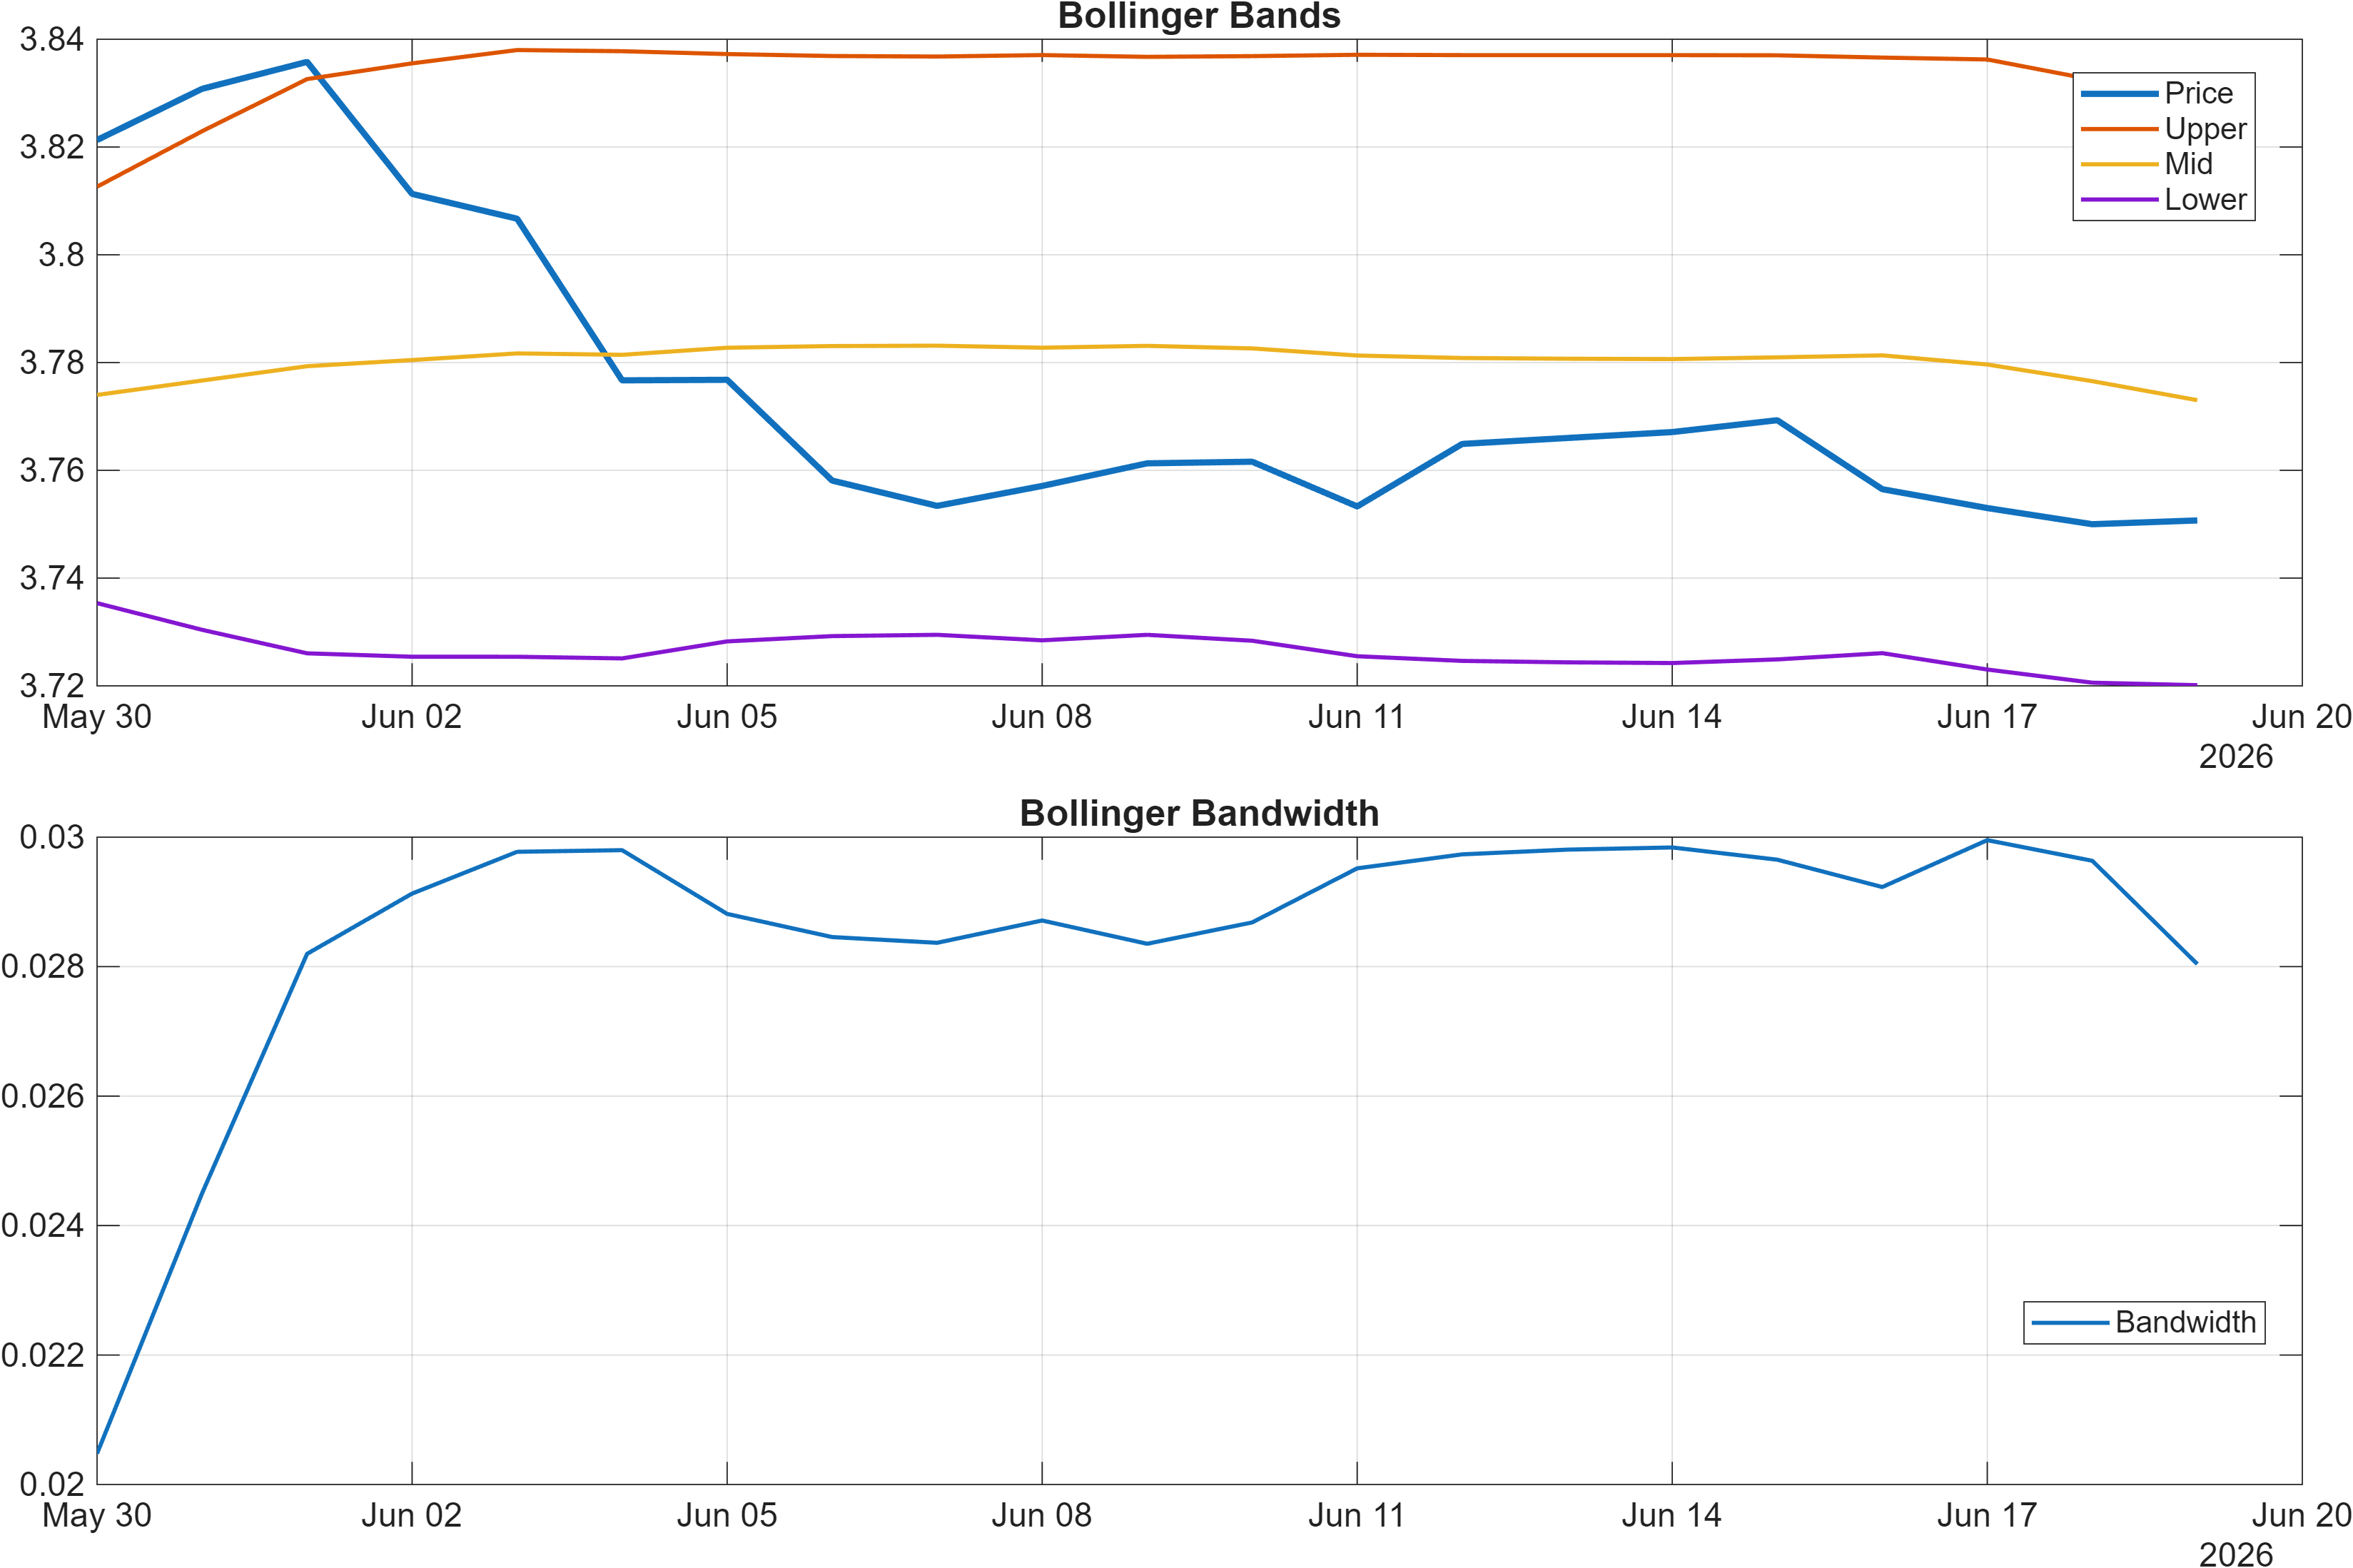
Interpretation: Bandwidth (volatility regime) latest = 0.0280.
Momentum drag without volatility expansion: stabilization risk vs rebound potential
The momentum stack remains the main constraint on bullish follow-through. RSI(14) at 32.81 is flagged bearish, consistent with a market still operating near the lower end of its recent momentum range. At the same time, the MACD histogram is slightly negative (-0.002692), signaling that downside momentum has not fully cleared even if it is not accelerating dramatically.
Volatility conditions add an important qualifier. Bollinger bandwidth at 0.0280 points to a contained regime rather than a stress expansion. When momentum is weak but volatility remains compressed, markets frequently oscillate around nearby reference points (moving averages and horizontal levels) as positioning is digested. This is consistent with the broader “neutral” reading in the blended technical score (-0.113): signals are not uniformly trending, and the system is not seeing broad, high-conviction directional alignment.
The tactical implication is that any rebound attempt will likely require momentum confirmation rather than relying on volatility breakout dynamics. In other words, a turn in RSI away from bearish territory and a stabilization/uptick in MACD histogram would better support the daily rank strength (#97) being something more than a short-lived mean-reversion move. Conversely, if momentum remains bearish while bandwidth stays low, the risk is a grinding drift that repeatedly fails near resistance rather than a decisive directional move.
4) Support / Resistance zones
Support ~ 3.7413 | Resistance ~ 3.8074
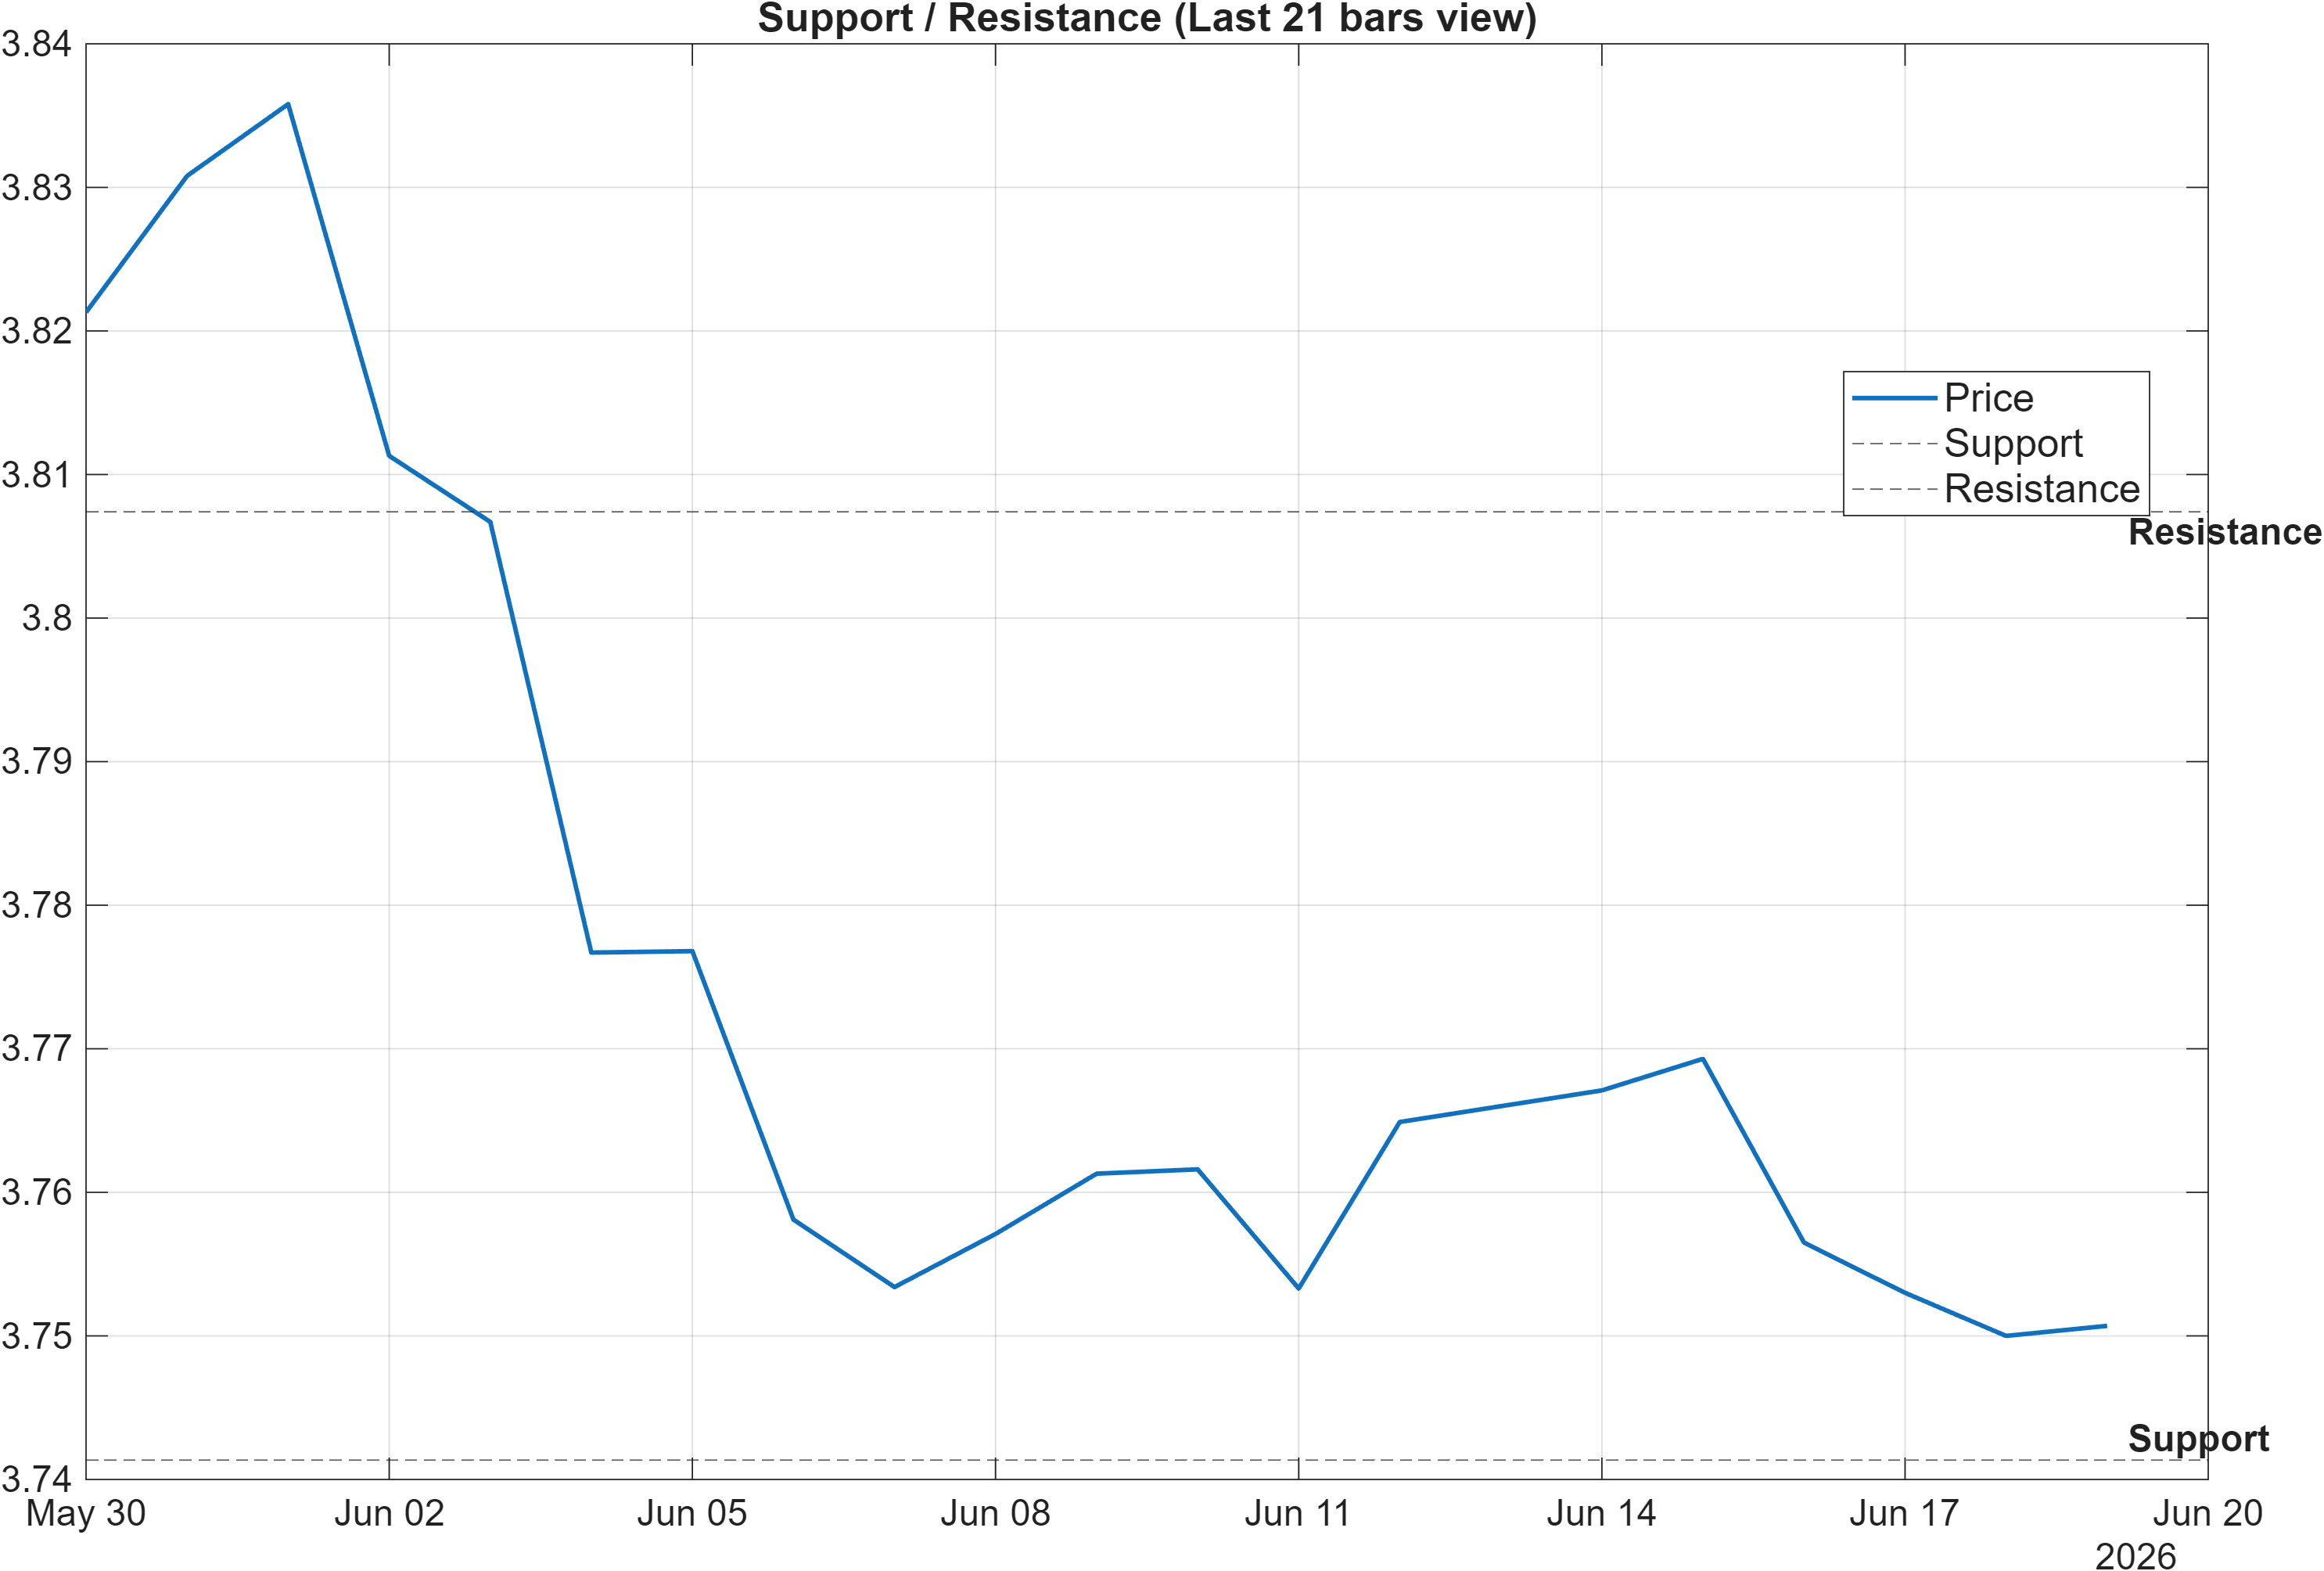
Scenario view: Break above resistance with volume → continuation. Close below support → signal deterioration risk.
Decision-zone framing: levels as confirmation gates, not forecasts
The current map is clean and operational: 3.7413 is the primary support zone, and 3.8074 is the primary resistance zone. With the blended technical posture Neutral (-0.113), levels carry more weight than usual because they serve as the most direct confirmation triggers in an otherwise mixed signal stack.
The short-term rank strength (daily #97) can be interpreted as the market behaving better than most peers recently; however, the momentum dashboard still leans bearish (RSI(14) 32.81; MACD histogram -0.002692). That tension makes 3.8074 a meaningful “proof point”: a sustained break above resistance is consistent with the scenario definition of continuation and would help reconcile the daily improvement with lagging momentum.
On the downside, the framework’s invalidation logic is explicit: a close below 3.7413 elevates deterioration risk. In a low-to-moderate volatility regime (bandwidth 0.0280), breaks can be incremental; therefore, the quality of closes around the level tends to matter more than intraday excursions. In practical portfolio terms, this turns the range into a disciplined decision corridor: above resistance improves continuation odds; below support increases the probability that the neutral regime resolves unfavorably.
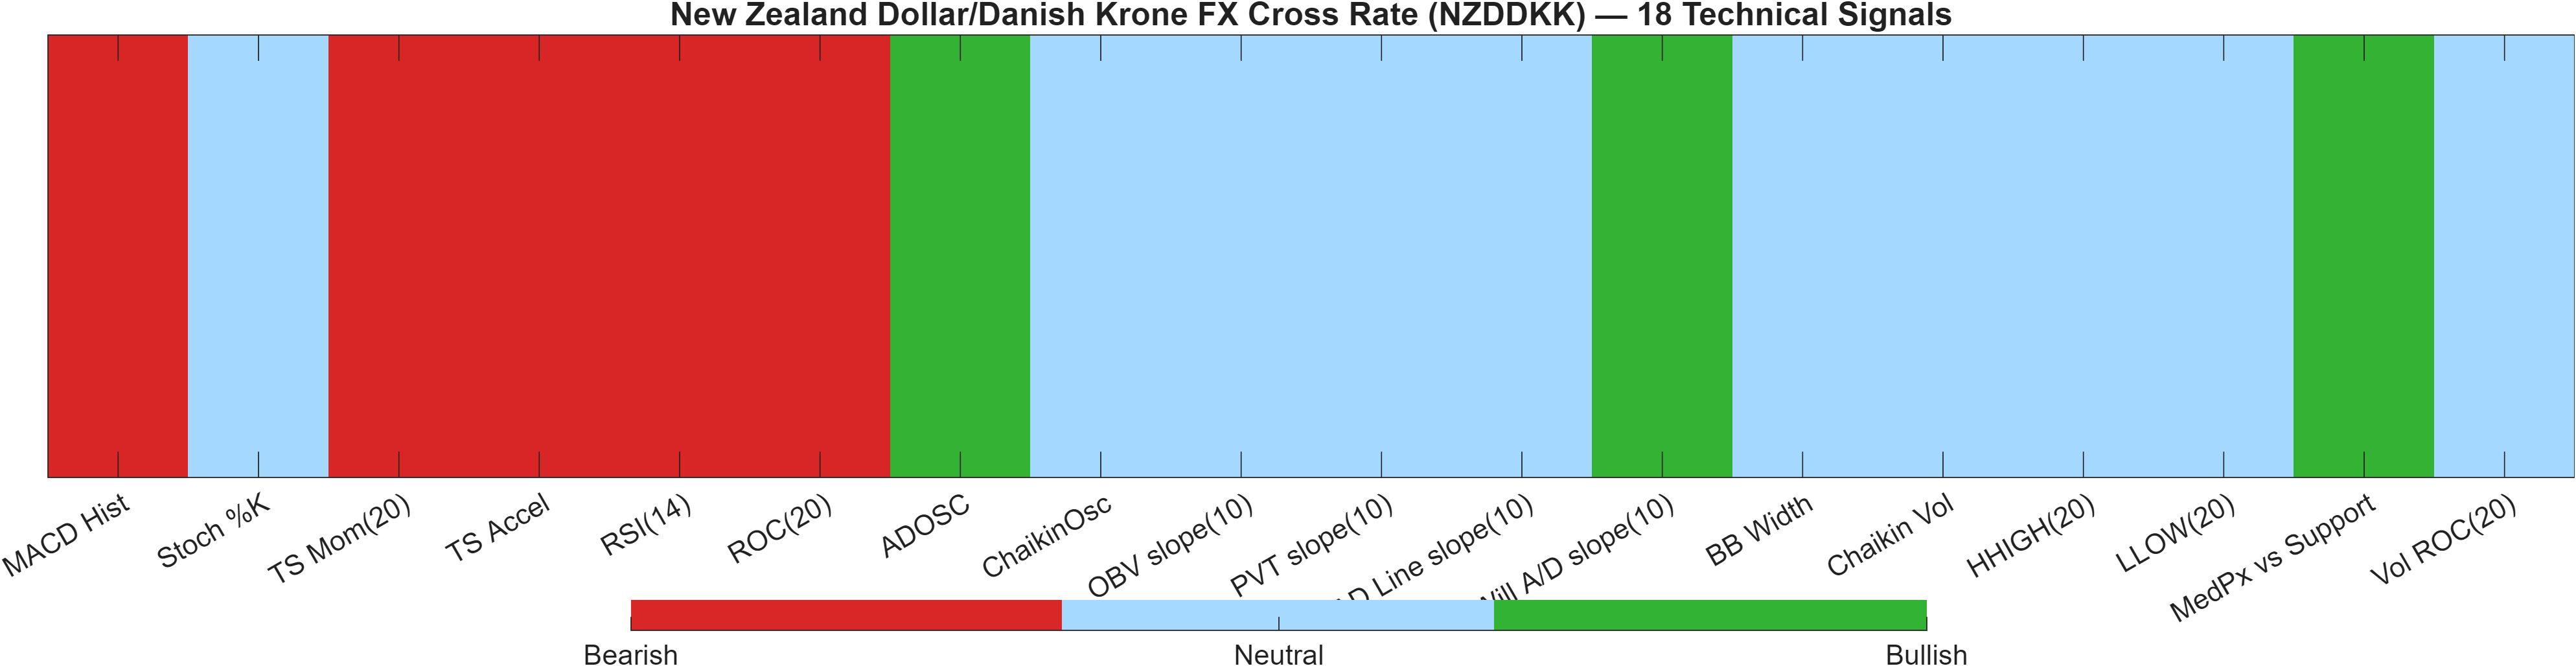
5) Quant Technical Dashboard (18 Signals)
KGNAI AI Technical Analysis Score (Deep Reinforcement Learning): Rank #511 out of 915 (Rank 1 represents the strongest technical positioning and a higher probability of favorable price behavior. As ranks increase toward the maximum, the probability of favorable outcomes weakens and bearish positioning becomes more dominant.) | Label: Neutral | Score: -0.117
18-Signal Technical Confluence Score: -0.111 (Neutral)
Overall Technical Score (18-signal confluence + DRL rank blend): -0.113 (Neutral)
Note: The blended score reflects signal strength weighted against broader AI technical ranking, which may temporarily diverge.
Blended technical score breakdown: -0.113 (Neutral | Bull 3 / Bear 5 / Neutral 10)
Signal balance: bearish momentum cluster vs limited bullish participation
KGNAI’s quant technical layer reinforces the “neutral but fragile” interpretation. The Deep Reinforcement Learning technical rank is #511 out of 915 with a -0.117 score, and the blended output remains Neutral at -0.113. This is not a strongly directional configuration; it indicates moderate, mixed technical quality relative to the broader FX universe.
The composition is the differentiator: the confluence breakdown shows Bear 5 versus Bull 3 with Neutral 10. The bearish cluster is concentrated in momentum and rate-of-change features, consistent with the table signals such as RSI(14) 32.81 (bearish) and MACD histogram -0.002692 (bearish). These tend to be the signals that must stabilize for upside continuation to become durable.
On the constructive side, there are signs of accumulation/flow stabilization: ADOSC is 46.05 (bullish) and Will A/D slope(10) is 0.0086 (bullish). Additionally, “MedPx vs Support” at 0.00925 is bullish, which is consistent with price holding above the nearby support zone rather than decisively breaking down. The neutral-heavy signal count, paired with contained volatility (BB width 0.02804), supports a thesis of conditional stabilization: bullish evidence exists, but it is not yet the dominant factor.
Signal table (Bull/Bear/Neutral)
| Indicator | Value | Signal |
|---|---|---|
| MACD Hist | -0.002692 | Bearish |
| Stoch %K | 26.77 | Neutral |
| TS Mom(20) | -0.0825 | Bearish |
| TS Accel | -0.1307 | Bearish |
| RSI(14) | 32.81 | Bearish |
| ROC(20) | -2.091 | Bearish |
| ADOSC | 46.05 | Bullish |
| ChaikinOsc | 0 | Neutral |
| OBV slope(10) | 0 | Neutral |
| PVT slope(10) | 0 | Neutral |
| AD Line slope(10) | 0 | Neutral |
| Will A/D slope(10) | 0.0086 | Bullish |
| BB Width | 0.02804 | Neutral |
| Chaikin Vol | -23.89 | Neutral |
| HHIGH(20) | 3.838 | Neutral |
| LLOW(20) | 3.74 | Neutral |
| MedPx vs Support | 0.00925 | Bullish |
| Vol ROC(20) | — | Neutral |
Interpretation: Indicator-level signals form the base confluence, which is then adjusted using a separate AI-driven technical ranking model. The final technical score summarizes this combined view.
6) News sentiment + extractive gist
Note: Instrument-specific news matches were not found, so the digest includes broader market/sector headlines. Links are provided for verification.
Sentiment score (avg): 0.050 | Positive: 19% | Neutral: 81% | Negative: 0%
KGNAI AI News Sentiment Score (normalized -1 to +1): Not available (as of —) | Label: Not available | Overall news score: 0.05
Positive Developments
Recent coverage across major financial outlets indicates a modestly constructive tone in pockets of FX and broader risk narratives, but largely without instrument-specific catalysts for NZDDKK. The sentiment mix is skewed neutral overall (81% neutral), yet the presence of positive items (19%) suggests incremental support for risk appetite rather than an overtly defensive posture. Where the news flow leans constructive, it tends to emphasize resilience themes—select rebounds in major pairs and data prints that reduce immediate policy surprise risk. For a cross like NZDDKK, such a backdrop typically matters through second-order effects (broad USD tone, global risk proxies, and G10 rate expectations) more than through direct domestic headlines. In this context, the news tone is consistent with the report’s technical regime: volatility is contained (bandwidth 0.0280), and the market’s next move may be more dependent on level confirmation than on an abrupt narrative shift.
Neutral / Mixed Developments
The dominant characteristic of the digest is informational rather than directional, matching the neutral average sentiment score (0.050). Coverage highlights cross-asset moves and macro uncertainty that can keep FX ranges intact: a market that is “watching and waiting” tends to produce headline churn without durable trend change. This is important for NZDDKK because the technical picture is already mixed—short-term ranks show improvement (daily #97), while longer horizons remain neutral (weekly #310; monthly #334). A neutral-heavy news regime can therefore act as a stabilizer: it may neither validate a sustained breakout above 3.8074 nor force a decisive failure below 3.7413 unless additional catalysts emerge.
Negative / Risk Signals
While the digest shows 0% negative in the sentiment split, risk signals still exist in the form of uncertainty clusters—geopolitical and policy ambiguity, and pockets of technical deterioration in related FX complexes. For NZDDKK, the more relevant risk is that weak momentum conditions persist even if headlines remain broadly “neutral.” The technical dashboard already flags bearish momentum (RSI(14) 32.81; MACD histogram -0.002692), which can make the pair more sensitive to any incremental shift toward a defensive tone. In low-volatility conditions, this can present as repeated failures near resistance rather than a dramatic selloff; however, the framework’s invalidation logic remains clear: a close below 3.7413 would represent meaningful deterioration regardless of whether the news tone looks benign on the surface.
- Whether price can confirm above 3.8074 in a way that improves momentum readings (RSI and MACD).
- Whether 3.7413 holds on a closing basis as volatility remains contained (bandwidth 0.0280).
- Whether longer-horizon ranks (weekly #310, monthly #334) begin to improve toward the daily signal (#97).
Sources referenced: Reuters, Bloomberg, Yahoo Finance, MarketWatch, Investing.com
Snapshot: AI Rank (Short–Mid–Long): Neutral (Neutral–Neutral–Neutral) · Technical Confluence: Neutral · Key Levels: Support ~3.74 | Resistance ~3.81 · News Sentiment: Neutral
7) Sources
- United States Dollar Index (DXY) eases from 101.13 highs but remains near yearly highs — https://www.fxstreet.com/news/united-states-dollar-index-dxy-eases-from-10113-highs-but-remains-near-yearly-highs-202606190946
- Silver price today: Silver falls, according to FXStreet data — https://www.fxstreet.com/news/silver-price-today-silver-falls-according-to-fxstreet-data-202606190932
- USD/CHF Price Forecast: Fails ahead of 0.8100/YTD peak; bullish potential intact — https://www.fxstreet.com/news/usd-chf-price-forecast-fails-ahead-of-08100-ytd-peak-bullish-potential-intact-202606190903
- British Pound: Trendline break points to deeper losses – Societe Generale — https://www.fxstreet.com/news/british-pound-trendline-break-points-to-deeper-losses-societe-generale-202606190849
- Global rates: Converging at slightly restrictive levels – Rabobank — https://www.fxstreet.com/news/global-rates-converging-at-slightly-restrictive-levels-rabobank-202606190847
- US Dollar Index: Breakout fuelled by hawkish Fed repricing – Societe Generale — https://www.fxstreet.com/news/us-dollar-index-breakout-fuelled-by-hawkish-fed-repricing-societe-generale-202606190838
- Oil: Strait of Hormuz risks ease but fees loom – Rabobank — https://www.fxstreet.com/news/oil-strait-of-hormuz-risks-ease-but-fees-loom-rabobank-202606190833
- NZD/USD Price Forecast: Bears eye YTD low at 0.5680 amid US Dollar’s strength — https://www.fxstreet.com/news/nzd-usd-price-forecast-bears-eye-ytd-low-at-05680-amid-us-dollars-strength-202606190832
You may also like: How KGNAI AI ranks instruments across global markets
Disclaimer: KGNAI provides AI-generated analytics and educational market commentary only. This is not financial advice. Markets involve risk. Always do your own research.