CHFBWP (CHF/BWP) — 12-Jun-2026 Quant Signal Review with Mixed Ranks and Bearish Technical Confluence
CHF/BWP (CHFBWP) enters this snapshot with ranking dispersion across time horizons and a bearish technical confluence that contrasts with stronger longer-horizon positioning. In the KGNAI cross-sectional universe of 959 ranked instruments, the pair sits neutral on the Daily (#583) while remaining bullish on the Weekly (#65) and Yearly (#53) horizons—an alignment profile that often accompanies regime transition risk rather than a clean trend. Price/MA structure is currently negative (Close vs MA50 = Bearish; MA50 vs MA200 = Bearish), while momentum and breadth-style readings lean softer (RSI bias bearish; MACD histogram -0.0040). Volatility is relatively contained with Bollinger Bandwidth 0.0254, making the 16.8550 support and 17.1701 resistance levels the practical decision zones for confirmation. News sentiment is mildly positive on average (0.128), but instrument-specific matches were not found in the provided data.
- Short / Mid / Long rank stance: Short-term Neutral (Daily #583), Mid-term Neutral (3-Monthly #579), Long-term Bullish (Yearly #53; Weekly #65; 6-Monthly #82)
- Technical confluence: Bearish (Overall Technical Score -0.450; DRL Rank #826)
- Key levels: Support 16.8550 | Resistance 17.1701
- News sentiment bias: Neutral overall (avg 0.128; 50% positive / 44% neutral / 6% negative)
- Confirmation / invalidation condition: Acceptance above 17.1701 supports continuation framing; sustained closes below 16.8550 increase deterioration risk per the scenario view.
KGNAI evaluates assets using large cross-sectional datasets built from millions of structured data points. Inputs incorporate fundamental metrics, technical structures, and systematically processed news sentiment. Statistical models, machine learning, and AI frameworks are used to assess relative positioning, signal alignment, and probabilistic behavior across broad universes.
- Ranks are comparative across the tracked universe, not absolute price targets.
- Confluence reflects alignment among independent signal groups.
- Support/resistance levels are probabilistic decision zones, not guarantees.
- Sentiment provides contextual bias within the broader analytical framework.
1) KGNAI AI Analysis
Region: FOREX | Total universe size: 959 ranked instruments
- Daily rank: #583 out of 959 — Neutral
- Weekly rank: #65 out of 959 — Bullish
- Monthly rank: #120 out of 959 — Bullish
- 3-Monthly rank: #579 out of 959 — Neutral
- 6-Monthly rank: #82 out of 959 — Bullish
- Yearly rank: #53 out of 959 — Bullish
The rank structure is timeframe-fragmented, with long-horizon strength coexisting with short-horizon hesitation. The Weekly rank (#65) and Yearly rank (#53) place CHFBWP in the upper decile of the 959-instrument universe, a profile typically associated with more constructive longer-run behavior. In contrast, the Daily rank (#583) and 3-Monthly rank (#579) sit in the lower third, implying that recent relative behavior has been less favorable versus peers.
That dispersion matters: when the short and intermediate windows drift away from a bullish long-term baseline, it often signals that the market is re-pricing a prior trend rather than extending it cleanly. The Monthly rank (#120) still sits in the bullish zone, which tempers the bearish interpretation and keeps the state closer to “neutral-to-constructive but under pressure” than outright trend reversal.
KGNAI’s term view explicitly summarizes this balance: Short-term Neutral, Mid-term Neutral, Long-term Bullish. For process, the key is whether subsequent technical confirmation (Sections 2–5) starts to migrate toward the long-horizon ranks—or whether the strong Yearly/Weekly placement begins to erode toward the neutral cohort.
Want the full universe and complete rank tables? Unlock full access on KGNAI: https://www.kgnai.com/pricing
2) Price & trend overview
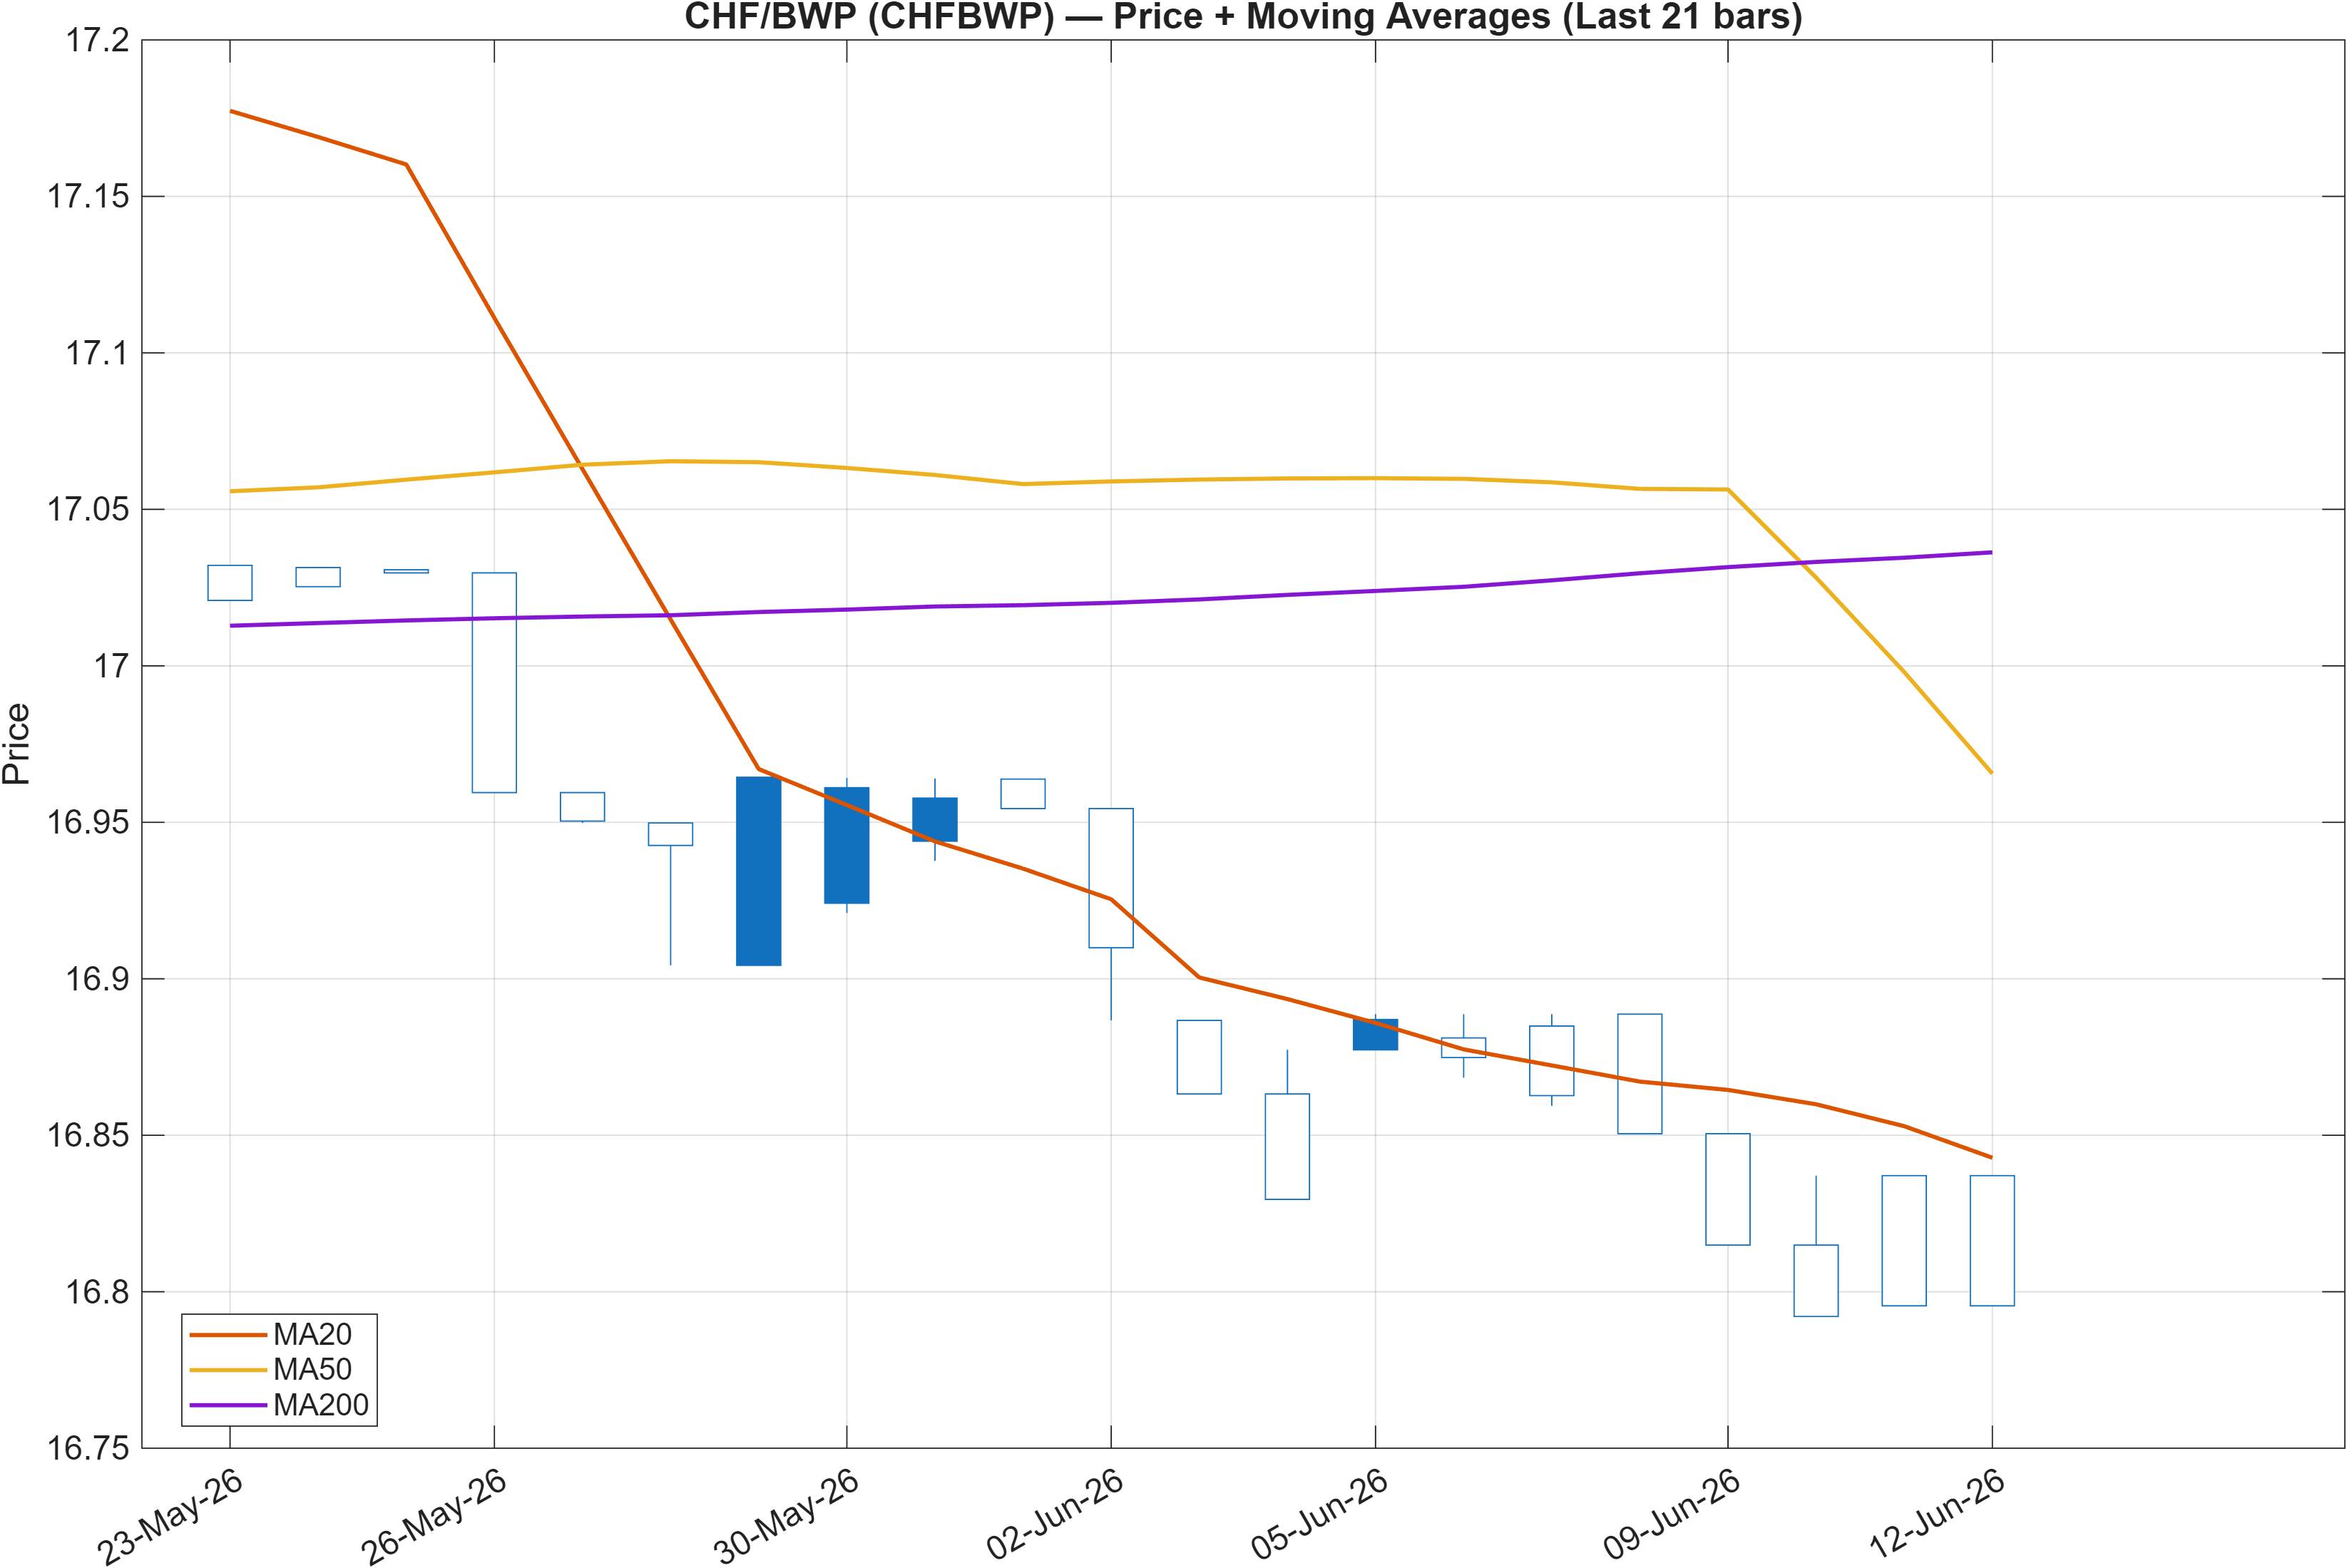
Interpretation: Close vs MA50 = Bearish, MA50 vs MA200 = Bearish.
The moving-average structure flags a downtrend-leaning regime in the observed window: the market is below the MA50, and the MA50 is below the MA200. This is a different message than the longer-horizon ranks (Yearly #53, Weekly #65), and the divergence is analytically important: it suggests the long-horizon relative strength has not translated into a clean near-term trend continuation.
When both Close vs MA50 and MA50 vs MA200 read bearish, rallies commonly function as tests of overhead supply until price can recover the faster average consistently. That said, the rank stack is not uniformly weak—Monthly #120 remains bullish—so the more precise framing is a market that may be oscillating between mean reversion and trend repair rather than trending smoothly.
In this context, the immediate question becomes whether price can stabilize without forcing the technical dashboard deeper into bearish territory. The support/resistance map later in the report (16.8550 / 17.1701) effectively brackets the range where a trend re-assertion (back toward the bullish ranks) versus continuation of the bearish MA structure can be validated.
For institutional-style execution logic, the MA stack is less a standalone signal and more a regime filter. As long as the MA50/MA200 relationship stays bearish, upside breaks generally need stronger confirmation from momentum (RSI/MACD) and from the confluence layer (Section 5) to be treated as more than a counter-trend bounce.
3) Momentum & volatility dashboard
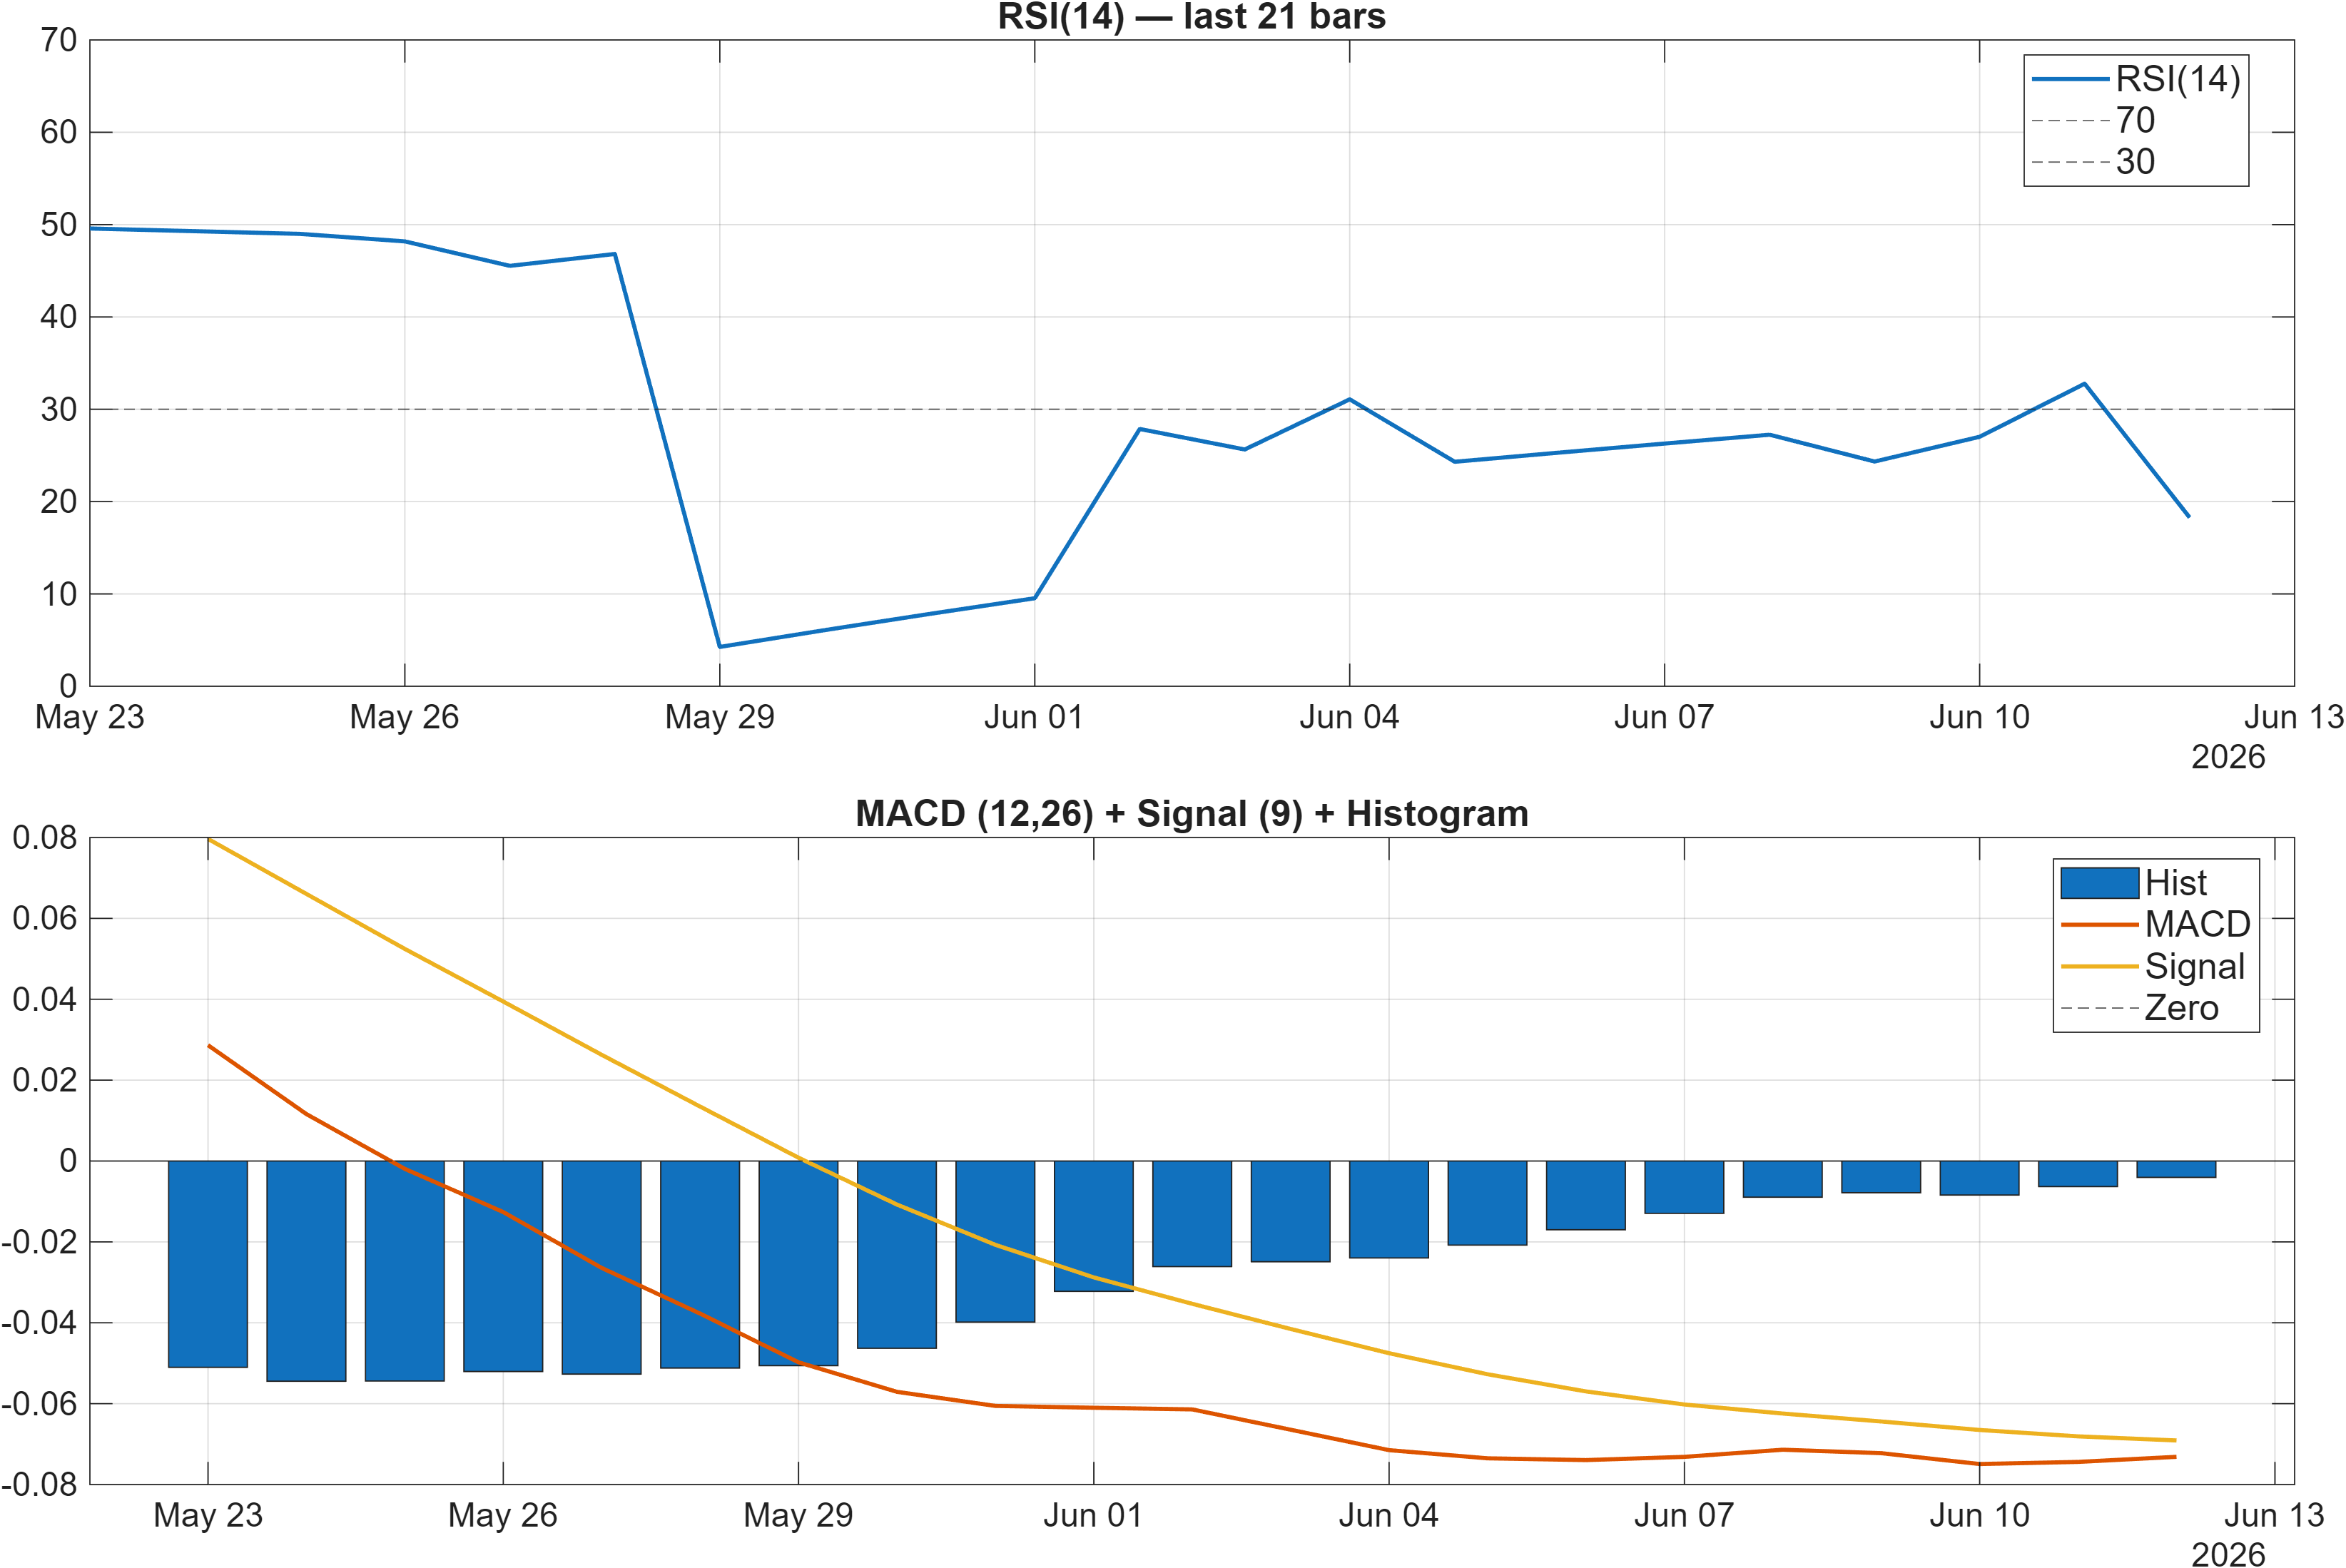
Interpretation: RSI bias = Bearish, MACD hist = -0.0040.
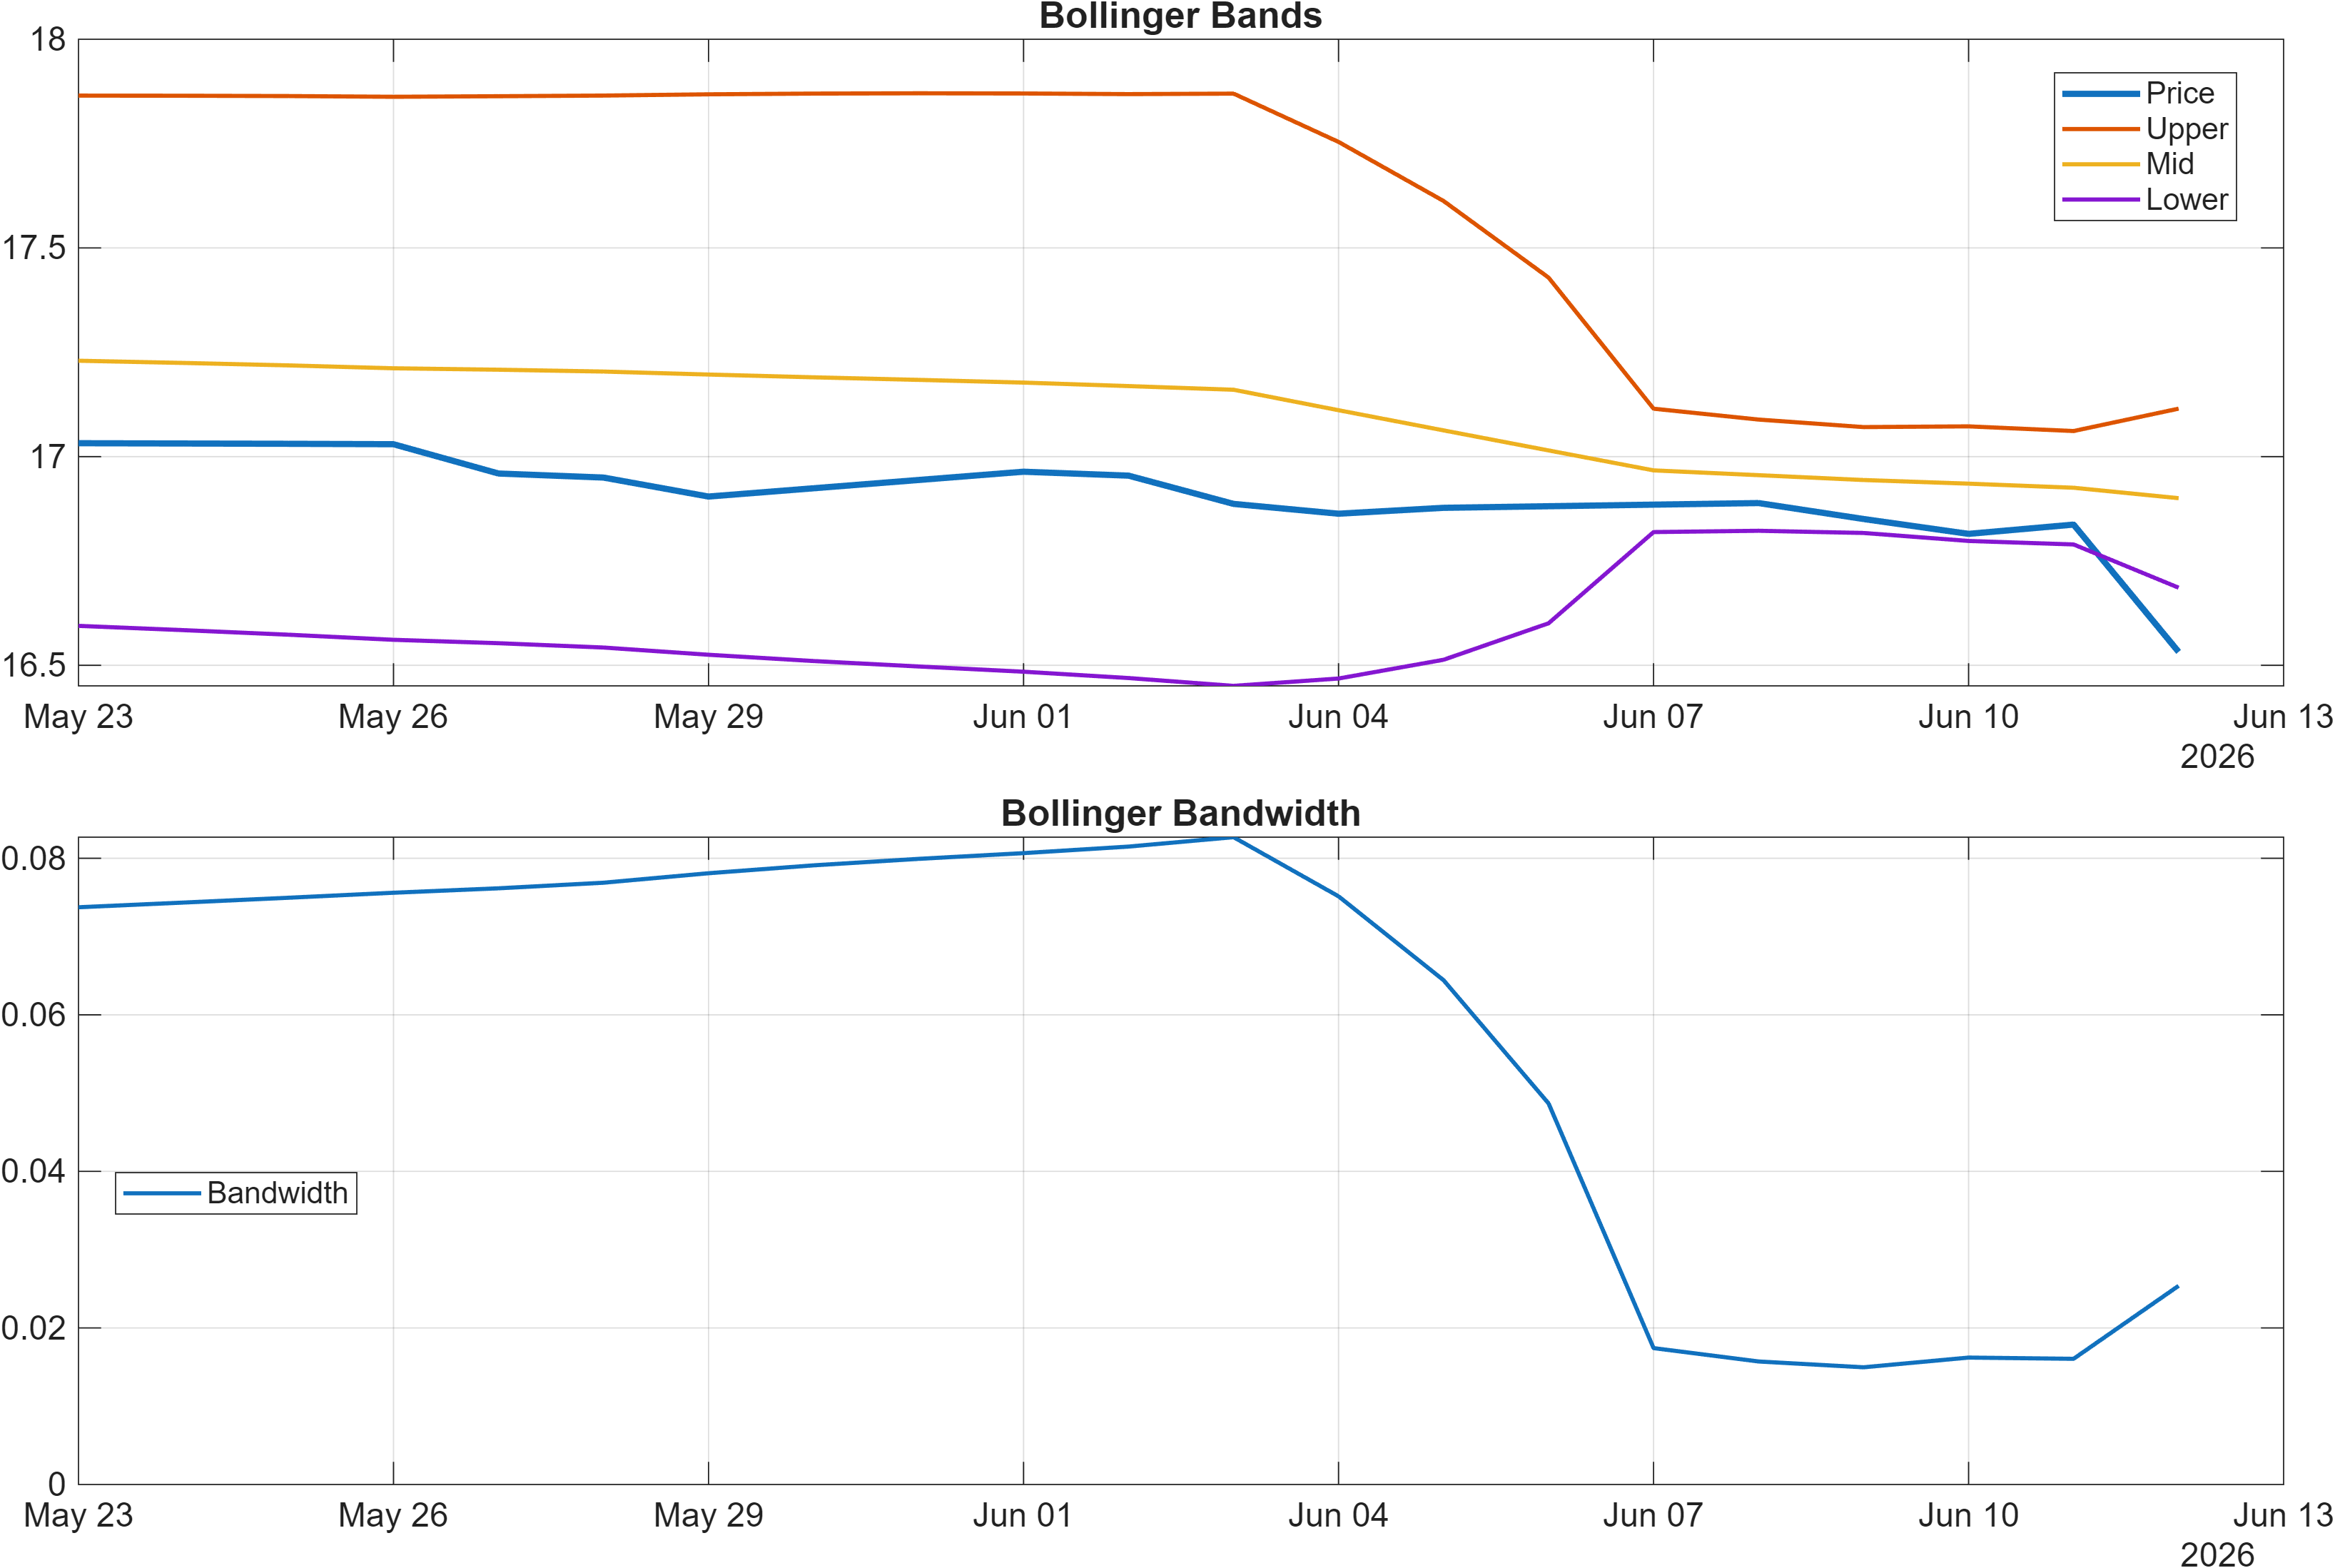
Interpretation: Bandwidth (volatility regime) latest = 0.0254.
Momentum is currently consistent with the bearish trend filter. The MACD histogram at -0.0040 indicates negative momentum persistence rather than a clear bullish inflection, aligning with the bearish MA configuration from Section 2. At the same time, the volatility context is not signaling a disorderly market: Bollinger Bandwidth 0.0254 points to a comparatively contained regime where breakouts can be more sensitive to level-based confirmation.
The combination of bearish RSI bias and a negative MACD histogram tends to imply that upside attempts may struggle without a shift in participation or a catalyst that changes the slope of momentum. Importantly, the 18-signal table later shows RSI(14) at 18.27, which is deeply depressed and can coincide with oversold conditions. Oversold readings, however, do not invalidate bearish trend structure by themselves; they more often create a setup where rallies can occur, but require follow-through to alter the regime.
From a signal-design perspective, compressed volatility (bandwidth 0.0254) can precede expansion, but the direction of that expansion is typically resolved only when momentum and price structure align around key levels. Here, a bullish resolution would generally require momentum measures to improve alongside price reclaiming resistance (Section 4), while a bearish resolution would be consistent with continued negative MACD behavior and failure to hold support.
This dashboard therefore reads as pressure-within-compression: the market is not showing high volatility stress, yet momentum remains negative enough that the burden of proof for trend repair sits with any upside move.
4) Support / Resistance zones
Support ~ 16.8550 | Resistance ~ 17.1701
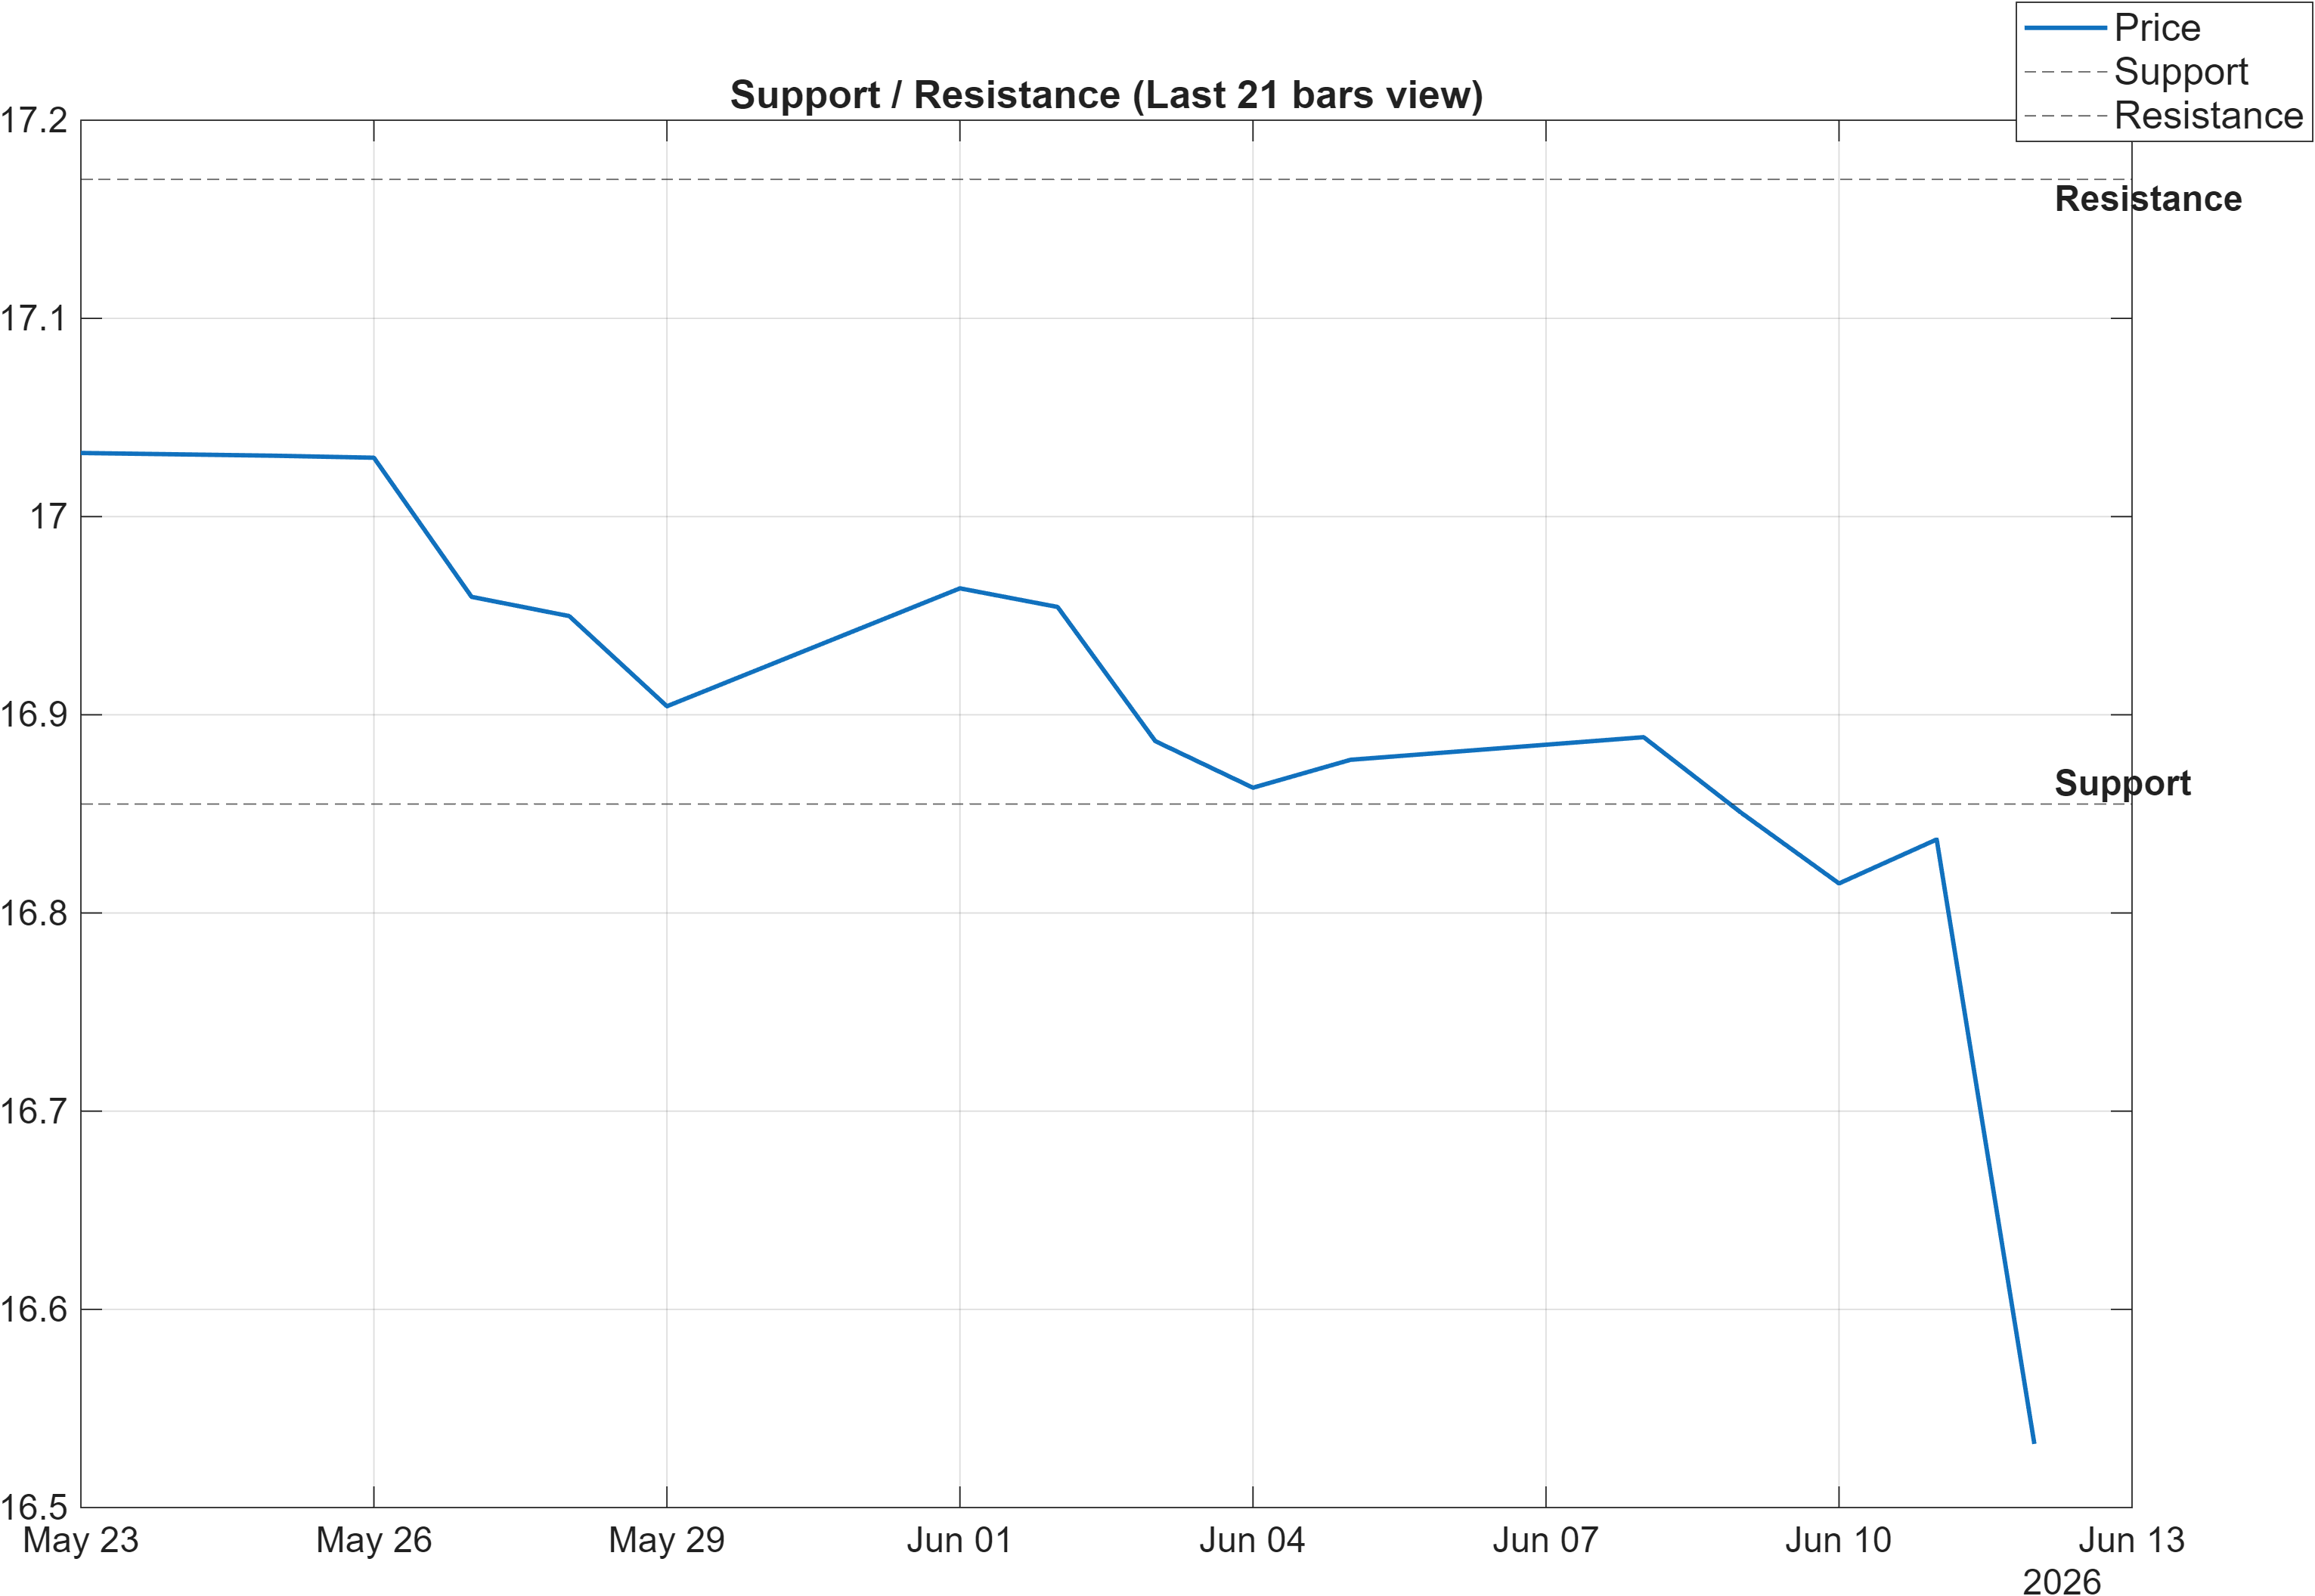
Scenario view: Break above resistance with volume → continuation. Close below support → signal deterioration risk.
The level structure is tight enough to matter in a low-bandwidth environment: 16.8550 defines the near-term support shelf, while 17.1701 caps the upside as the principal resistance reference. With Bollinger Bandwidth at 0.0254, level breaks can act as the primary “state change” events, particularly when momentum is already leaning bearish (MACD histogram -0.0040; RSI bias bearish).
A sustained move above 17.1701 would work as a confirmation test against multiple headwinds: it would be pushing price beyond a defined ceiling while the moving-average stack remains bearish. In that circumstance, the market would be attempting to transition from bearish trend structure to repair—an outcome that would need to be corroborated by improvements in the confluence layer (Section 5), not just a single print beyond resistance.
Conversely, closes below 16.8550 would be consistent with the report’s stated deterioration risk and would fit the existing technical complexion: bearish MA relationships and a negative MACD histogram. Given that the AI technical rank is very weak (#826 out of 959), downside acceptance below support would also align the discretionary chart read with the systematic ranking.
In practice, this is a binary zone map for the current regime: support is the line where bearish structure either stabilizes into consolidation, or transitions into a more persistent breakdown; resistance is the line where the market must prove it can overcome the current momentum deficit.
5) Quant Technical Dashboard (18 Signals)
KGNAI AI Technical Analysis Score (Deep Reinforcement Learning): Rank #826 out of 959 (Rank 1 represents the strongest technical positioning and a higher probability of favorable price behavior. As ranks increase toward the maximum, the probability of favorable outcomes weakens and bearish positioning becomes more dominant.) | Label: Bearish | Score: -0.723
18-Signal Technical Confluence Score: -0.333 (Bearish)
Overall Technical Score (18-signal confluence + DRL rank blend): -0.450 (Bearish)
Note: The blended score reflects signal strength weighted against broader AI technical ranking, which may temporarily diverge.
Blended technical score breakdown: -0.450 (Bearish | Bull 1 / Bear 7 / Neutral 10)
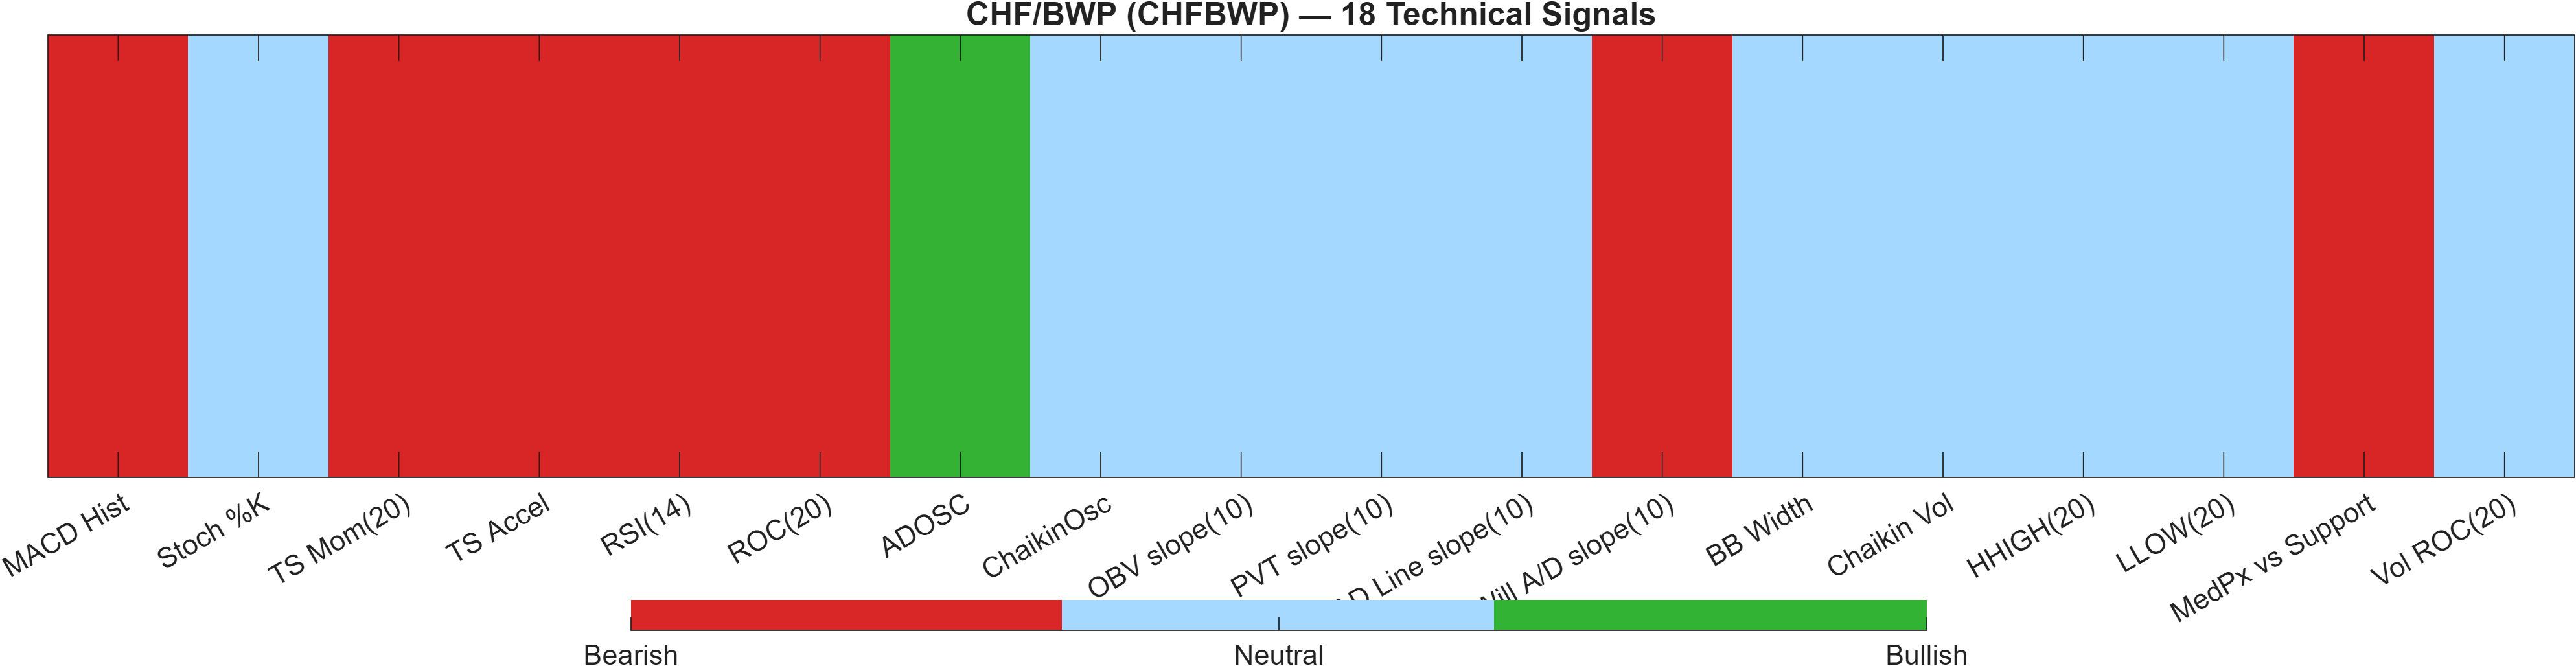
Signal alignment: bearish pressure with a large neutral cluster
| Indicator | Value | Signal |
|---|---|---|
| MACD Hist | -0.004048 | Bearish |
| Stoch %K | 46.58 | Neutral |
| TS Mom(20) | -0.1943 | Bearish |
| TS Accel | -0.0777 | Bearish |
| RSI(14) | 18.27 | Bearish |
| ROC(20) | -2.932 | Bearish |
| ADOSC | 100 | Bullish |
| ChaikinOsc | 0 | Neutral |
| OBV slope(10) | 0 | Neutral |
| PVT slope(10) | 0 | Neutral |
| AD Line slope(10) | 0 | Neutral |
| Will A/D slope(10) | -0.0329 | Bearish |
| BB Width | 0.02538 | Neutral |
| Chaikin Vol | -16.37 | Neutral |
| HHIGH(20) | 17.03 | Neutral |
| LLOW(20) | 16.79 | Neutral |
| MedPx vs Support | -0.03867 | Bearish |
| Vol ROC(20) | — | Neutral |
Interpretation: Indicator-level signals form the base confluence, which is then adjusted using a separate AI-driven technical ranking model. The final technical score summarizes this combined view.
This dashboard is notable less for a single indicator and more for its distribution: 10 Neutral signals sit alongside 7 Bearish and only 1 Bullish. That mix supports a view of bearish pressure inside a broad “non-committal” signal backdrop—a condition that often appears near inflection zones where the market is waiting for a level break to resolve direction.
On the bearish side, multiple momentum components agree: MACD Hist -0.004048, TS Mom(20) -0.1943, and ROC(20) -2.932 are consistent with downside pressure. The RSI(14) at 18.27 reinforces that weakness is acute. However, the lone bullish reading (ADOSC 100) highlights that not all participation proxies are uniformly negative—one reason the confluence score is bearish (-0.333) but not extreme.
The decisive overlay is the AI technical model: DRL rank #826 (score -0.723) pulls the blended result to -0.450 (Bearish). In other words, even with a heavy neutral cluster, the systematic ranking interprets the overall configuration as weak relative to the broader universe—consistent with the bearish MA structure and the negative momentum cluster. Any bullish case would require not just a bounce, but a measurable shift in the bearish group of signals and an improvement in the blended technical state.
6) News sentiment + extractive gist
Note: Instrument-specific news matches were not found, so the digest includes broader market/sector headlines. Links are provided for verification.
Sentiment score (avg): 0.128 | Positive: 50% | Neutral: 44% | Negative: 6%
KGNAI AI News Sentiment Score (normalized -1 to +1): Not available (as of —) | Label: Not available | Overall news score: 0.13
Positive Developments
Recent coverage across major financial outlets indicates a modestly constructive macro tone, driven primarily by periods of easing risk perception and improved cross-asset appetite. This backdrop can matter for FX pricing even when pair-specific headlines are absent, as liquidity conditions and broad risk preferences can influence positioning and volatility. Within this digest, the positive skew is consistent with the reported sentiment distribution (50% positive; average 0.128) and may help explain why volatility remains relatively contained (Bollinger Bandwidth 0.0254) despite bearish technical readings. For CHFBWP specifically, a mildly constructive tone does not override the current bearish confluence (-0.450), but it can reduce the probability of disorderly moves and keep the market operating as a level-driven range until a clearer catalyst emerges.
Neutral / Mixed Developments
A meaningful portion of coverage remains informational rather than directional, consistent with the 44% neutral share in the sentiment mix. In practice, this tends to coincide with “wait-and-see” price behavior—particularly when the technical dashboard itself carries a large neutral cluster (10 Neutral signals). For CHFBWP, that combination is coherent with a market that is more likely to respect nearby decision zones (16.8550 support and 17.1701 resistance) until either momentum improves (MACD histogram moving away from -0.0040) or price/MA structure begins to repair.
Negative / Risk Signals
Risk-sensitive headlines in the broader macro backdrop persist, even if they are not dominating the sentiment totals (6% negative). For FX markets, the relevance is often indirect: pockets of growth uncertainty, supply-chain sensitivity, or geopolitical ambiguity can change demand for liquidity and alter correlations between rates, commodities, and risk assets. For CHFBWP, the risk lens is most actionable through the technical state: a weak AI technical rank (#826) and bearish momentum cluster means the market may be less resilient if downside pressure returns. In that case, the support level at 16.8550 becomes the practical risk pivot that separates stabilization from further deterioration.
- What to monitor next: Whether price can sustain above 17.1701 while MACD histogram improves from -0.0040.
- What to monitor next: Any sustained acceptance below 16.8550, given the bearish blended technical score (-0.450).
- What to monitor next: Volatility expansion from the compressed regime (Bandwidth 0.0254) and whether it occurs with or against the current bearish confluence.
Sources referenced: Reuters, Bloomberg, Yahoo Finance, MarketWatch, Investing.com
Snapshot: AI Rank (Short–Mid–Long): Mixed (Neutral–Neutral–Bullish) · Technical Confluence: Bearish · Key Levels: Support ~16.85 | Resistance ~17.17 · News Sentiment: Neutral
7) Sources
- Asian stocks gain on easing US-Iran tensions, SpaceX debut awaited — https://www.fxstreet.com/news/asian-stocks-gain-on-easing-us-iran-tensions-spacex-debut-awaited-202606120442
- AUD/JPY Price Forecast: Drifts higher above 112.50, upside momentum fades but remains bullish — https://www.fxstreet.com/news/aud-jpy-price-forecast-drifts-higher-above-11250-upside-momentum-fades-but-remains-bullish-202606120437
- India Gold price today: Gold falls, according to FXStreet data — https://www.fxstreet.com/news/india-gold-price-today-gold-falls-according-to-fxstreet-data-202606120437
- RBA to hold cash rate at 4.35% on June 16 - Reuters poll — https://www.fxstreet.com/news/rba-to-hold-cash-rate-at-435-on-june-16-reuters-poll-202606120436
- USD/JPY Price Forecast: Climbs further beyond 160.00 as Mideast tensions undermine JPY — https://www.fxstreet.com/news/usd-jpy-price-forecast-climbs-further-beyond-16000-as-mideast-tensions-undermine-jpy-202606120421
- Indonesian Rupiah declines due to fresh US-Iran military friction — https://www.fxstreet.com/news/indonesian-rupiah-declines-due-to-fresh-us-iran-military-friction-202606120351
- Gold weakens as Iran deal uncertainty and hawkish Fed stance support USD — https://www.fxstreet.com/news/gold-weakens-as-iran-deal-uncertainty-and-hawkish-fed-stance-support-usd-202606120329
- EUR/USD Price Forecast: Needs to break above 20-day for sustained recovery — https://www.fxstreet.com/news/eur-usd-price-forecast-needs-to-break-above-20-day-for-sustained-recovery-202606120320
You may also like: How KGNAI AI ranks instruments across global markets
Disclaimer: KGNAI provides AI-generated analytics and educational market commentary only. This is not financial advice. Markets involve risk. Always do your own research.