
GBPZMW (British Pound / Zambia Kwacha) Technical & Rank View — 15-Feb-2026 | Short-Term Bearish, Longer-Term Bullish
GBP/ZMW (GBPZMW) is currently displaying a notable cross-horizon divergence: the Daily rank is #949 out of 961 (Bearish) while longer windows remain firmly constructive, including a 6-Monthly rank of #1 and Yearly rank of #26. Technically, the evidence cluster is weaker: the blended technical view is Bearish with an Overall Technical Score of -0.536 and an 18-signal confluence of -0.444. Momentum readings lean defensive (e.g., RSI(14) at 26.29 and MACD histogram at -0.0335), while volatility conditions remain measurable but not extreme, with Bollinger Bandwidth at 0.1297. Key decision zones are defined by support near 25.2300 and resistance near 30.4540. News sentiment in the provided digest is close to flat (-0.007), acting more as context than a directional driver.
- Rank stance: Short-term Bearish (Daily #949) | Mid-term Bullish (Monthly #78) | Long-term Bullish (6-Monthly #1)
- Technical confluence: Bearish (Overall Technical Score -0.536; 18-signal -0.444)
- Key levels: Support ~ 25.2300 | Resistance ~ 30.4540
- News sentiment bias: Neutral (avg -0.007; 25% positive / 38% neutral / 37% negative)
- Confirmation / invalidation: A break above 30.4540 supports continuation; a close below 25.2300 increases deterioration risk per the scenario framework.
What KGNAI Measures
KGNAI ranks instruments by relative positioning across large universes (here, 961 ranked instruments), emphasizing how an instrument’s observed behavior compares to peers rather than relying on a single indicator. The workflow blends signal alignment, regime context, and model-based ranking to capture probabilistic performance tendencies across multiple horizons. This approach is designed to remain interpretable when conditions shift between trend, mean reversion, and volatility expansion.
How to Read This Report
- Ranks are comparative across the universe, not absolute forecasts.
- Confluence summarizes agreement across 18 indicators plus an AI technical rank blend.
- Support/resistance are decision zones where follow-through (or failure) matters.
- Sentiment provides contextual bias; it may not align with price/technicals.
1) KGNAI AI Analysis
Region: FOREX
Total universe size: 961 ranked instruments
- Daily rank: #949 out of 961 — Bearish
- Weekly rank: #317 out of 961 — Neutral
- Monthly rank: #78 out of 961 — Bullish
- 3-Monthly rank: #15 out of 961 — Bullish
- 6-Monthly rank: #1 out of 961 — Bullish
- Yearly rank: #26 out of 961 — Bullish
The rank stack for GBPZMW is best read as time-horizon segmentation rather than a single directional verdict. The Daily rank of #949 places the pair in the weakest cohort of the 961-instrument universe, consistent with near-term downside pressure and/or unfavorable short-run behavior. By contrast, the 3-Monthly rank (#15) and especially the 6-Monthly rank (#1) sit at the very top of the distribution, indicating that—over longer windows—the pair has exhibited comparatively stronger behavior versus peers.
This spread (Daily bearish vs. multi-month bullish) often aligns with a regime where short-term drawdown, pullback, or momentum fatigue occurs inside a broader longer-term trend structure. The Weekly rank (#317, Neutral) reinforces that the transition between short-term weakness and longer-term strength is still being negotiated rather than resolved cleanly.
From a process standpoint, this is where confirmation becomes central: if technical evidence (momentum, trend structure, and level interaction) begins to converge with the longer-term ranks, the longer-horizon strength may reassert. If not, the short-term weakness can persist long enough to materially degrade the intermediate picture. The current term summary remains: Short-term Bearish, Mid-term Bullish, Long-term Bullish.
Want the full universe and complete rank tables? Unlock full access on KGNAI: https://www.kgnai.com/pricing
2) Price & trend overview
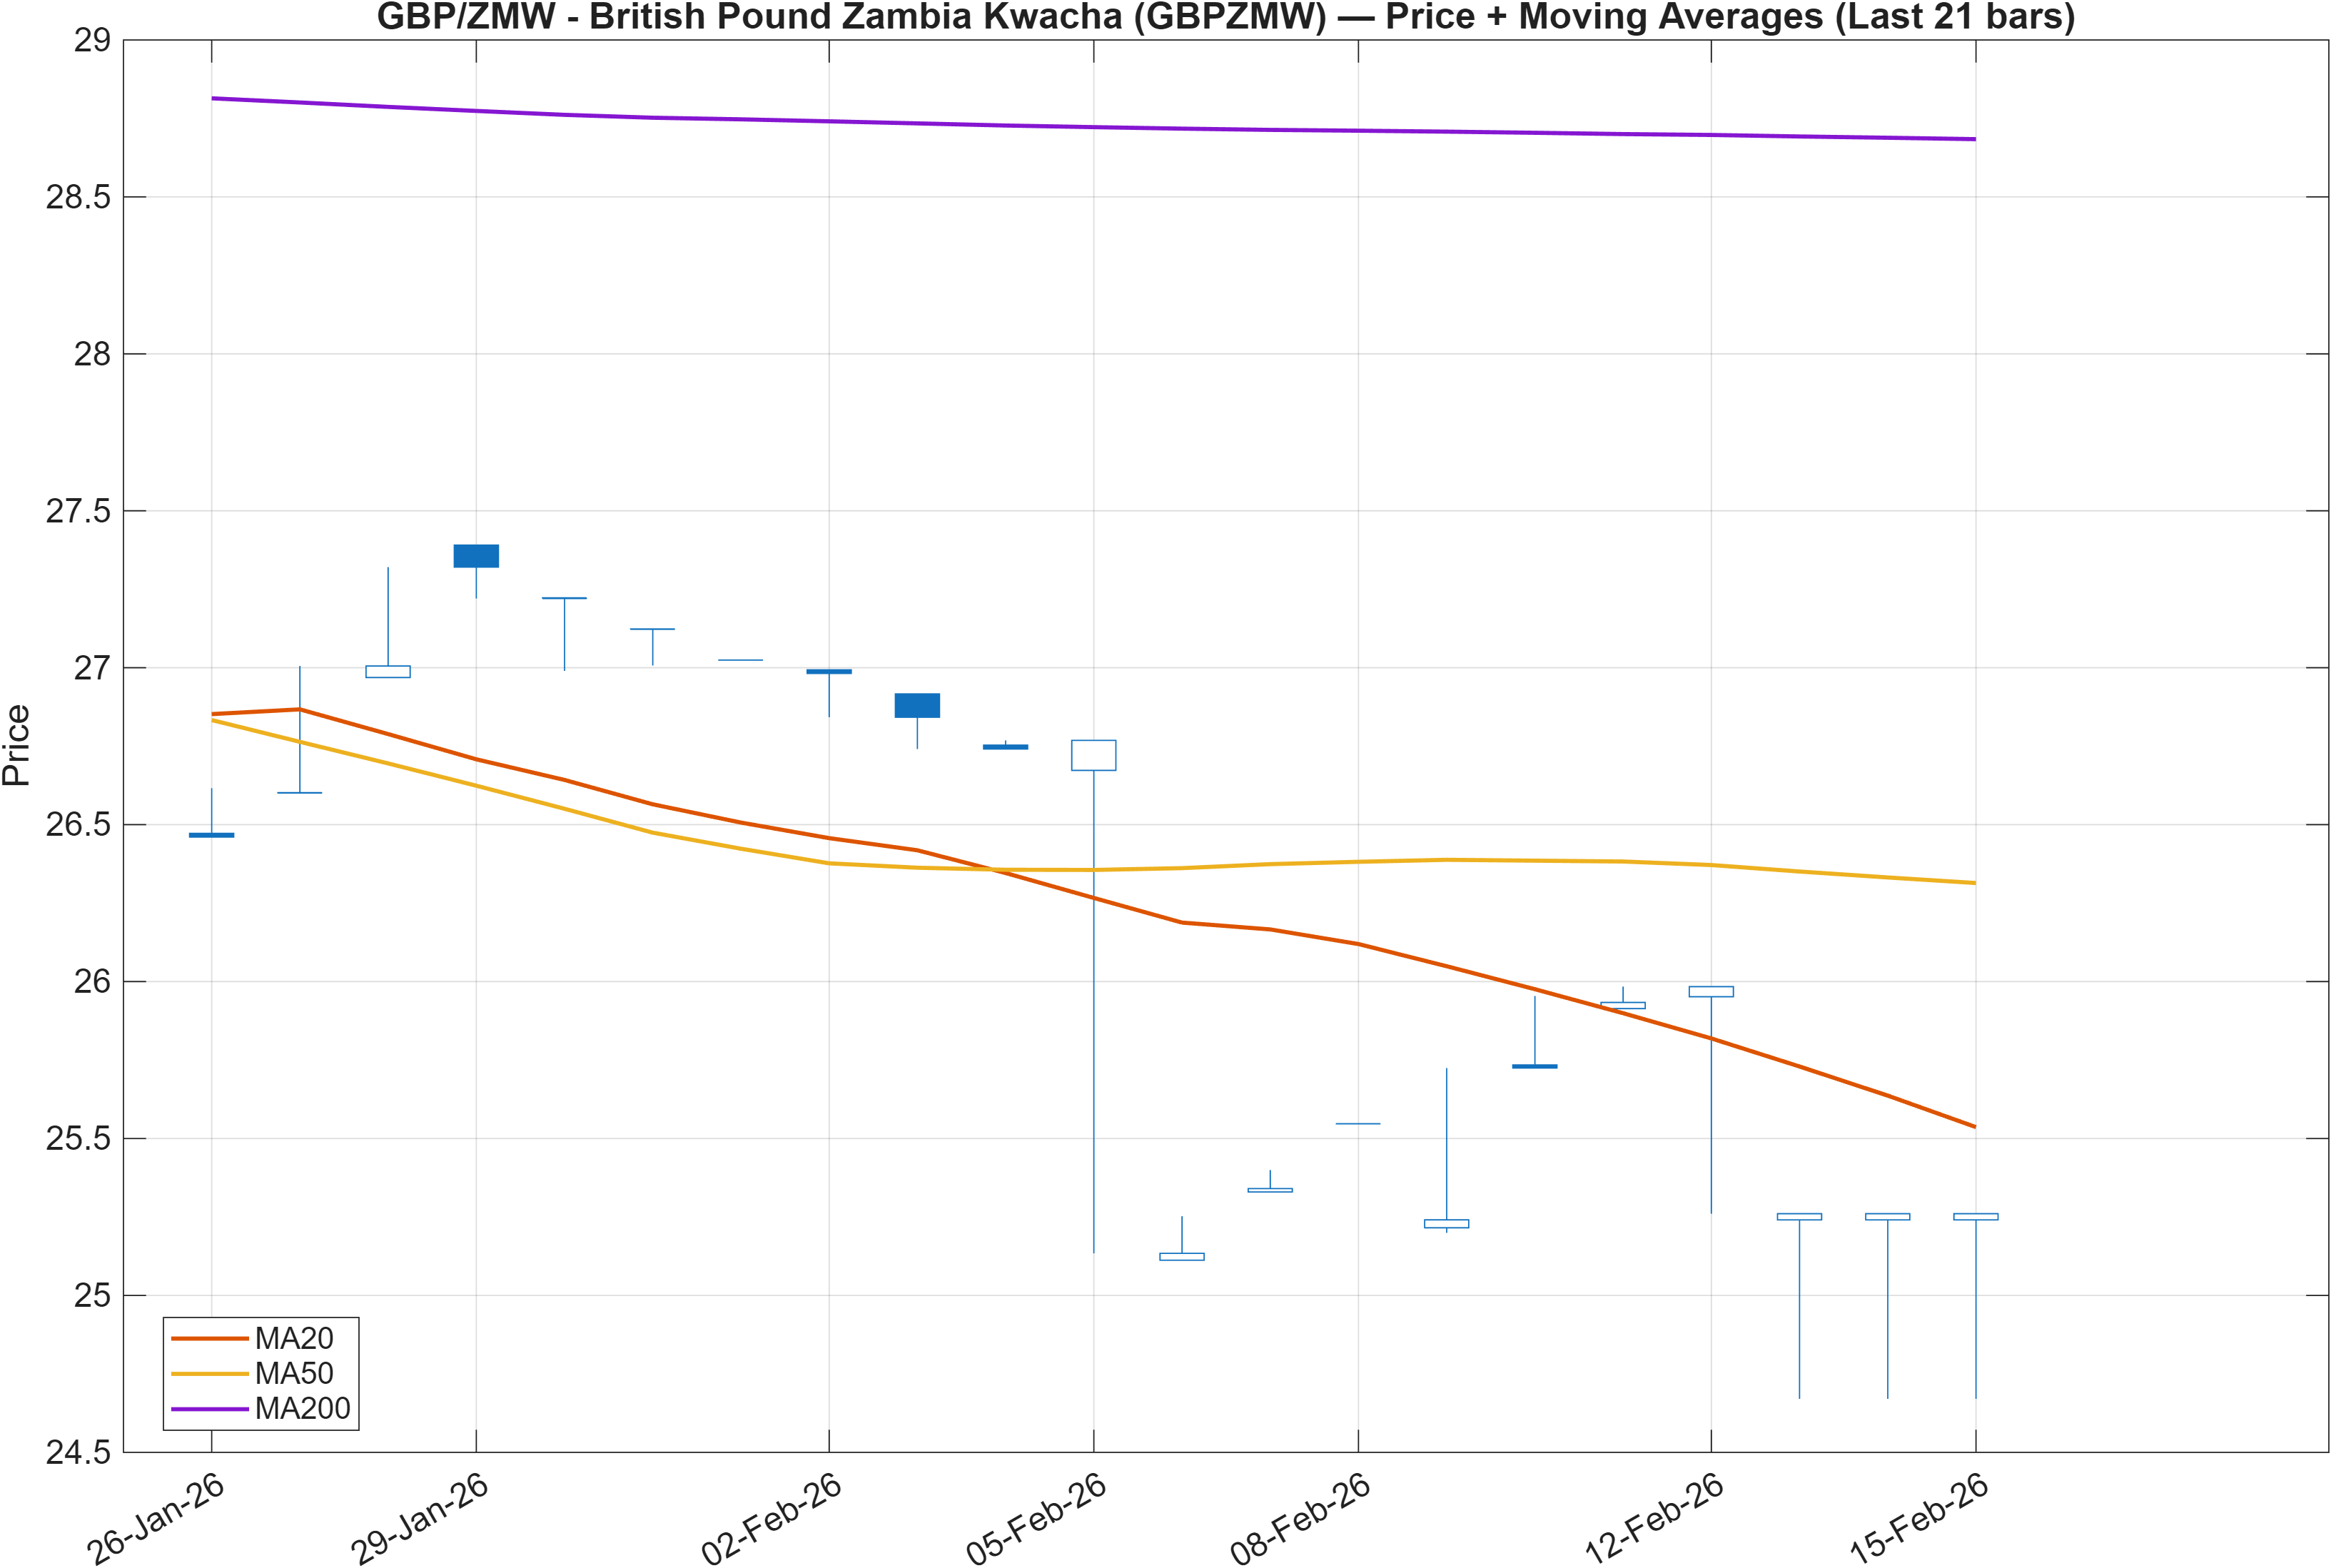
Interpretation: Close vs MA50 = Bearish, MA50 vs MA200 = Bearish.
The moving-average structure argues that the current trend state is defensively aligned. A bearish relationship of Close vs MA50 suggests that the most recent pricing is occurring below the intermediate trend proxy, while MA50 vs MA200 bearish indicates broader downside structure in the medium-to-long trend stack. When both conditions are bearish simultaneously, mean-reversion rallies tend to face a higher bar for persistence, because price is working against two layers of trend framing.
This trend picture also helps reconcile the rank divergence: a very weak Daily rank (#949) can coexist with longer-horizon strength if the longer windows are reflecting earlier trend behavior, while the current tape is in a downswing or a corrective phase. In those environments, support and resistance levels tend to carry more weight as the market tests whether the move is a temporary pullback or a more structural transition.
For GBPZMW, the distance to the defined levels (support ~25.2300, resistance ~30.4540) matters because trend confirmation frequently arrives via level interaction, not only via average crossovers. With the average stack bearish, the burden of proof for a constructive shift typically requires stabilization followed by reclaiming key zones—while failure to hold nearby support regions can keep the short-term bias dominant.
3) Momentum & volatility dashboard
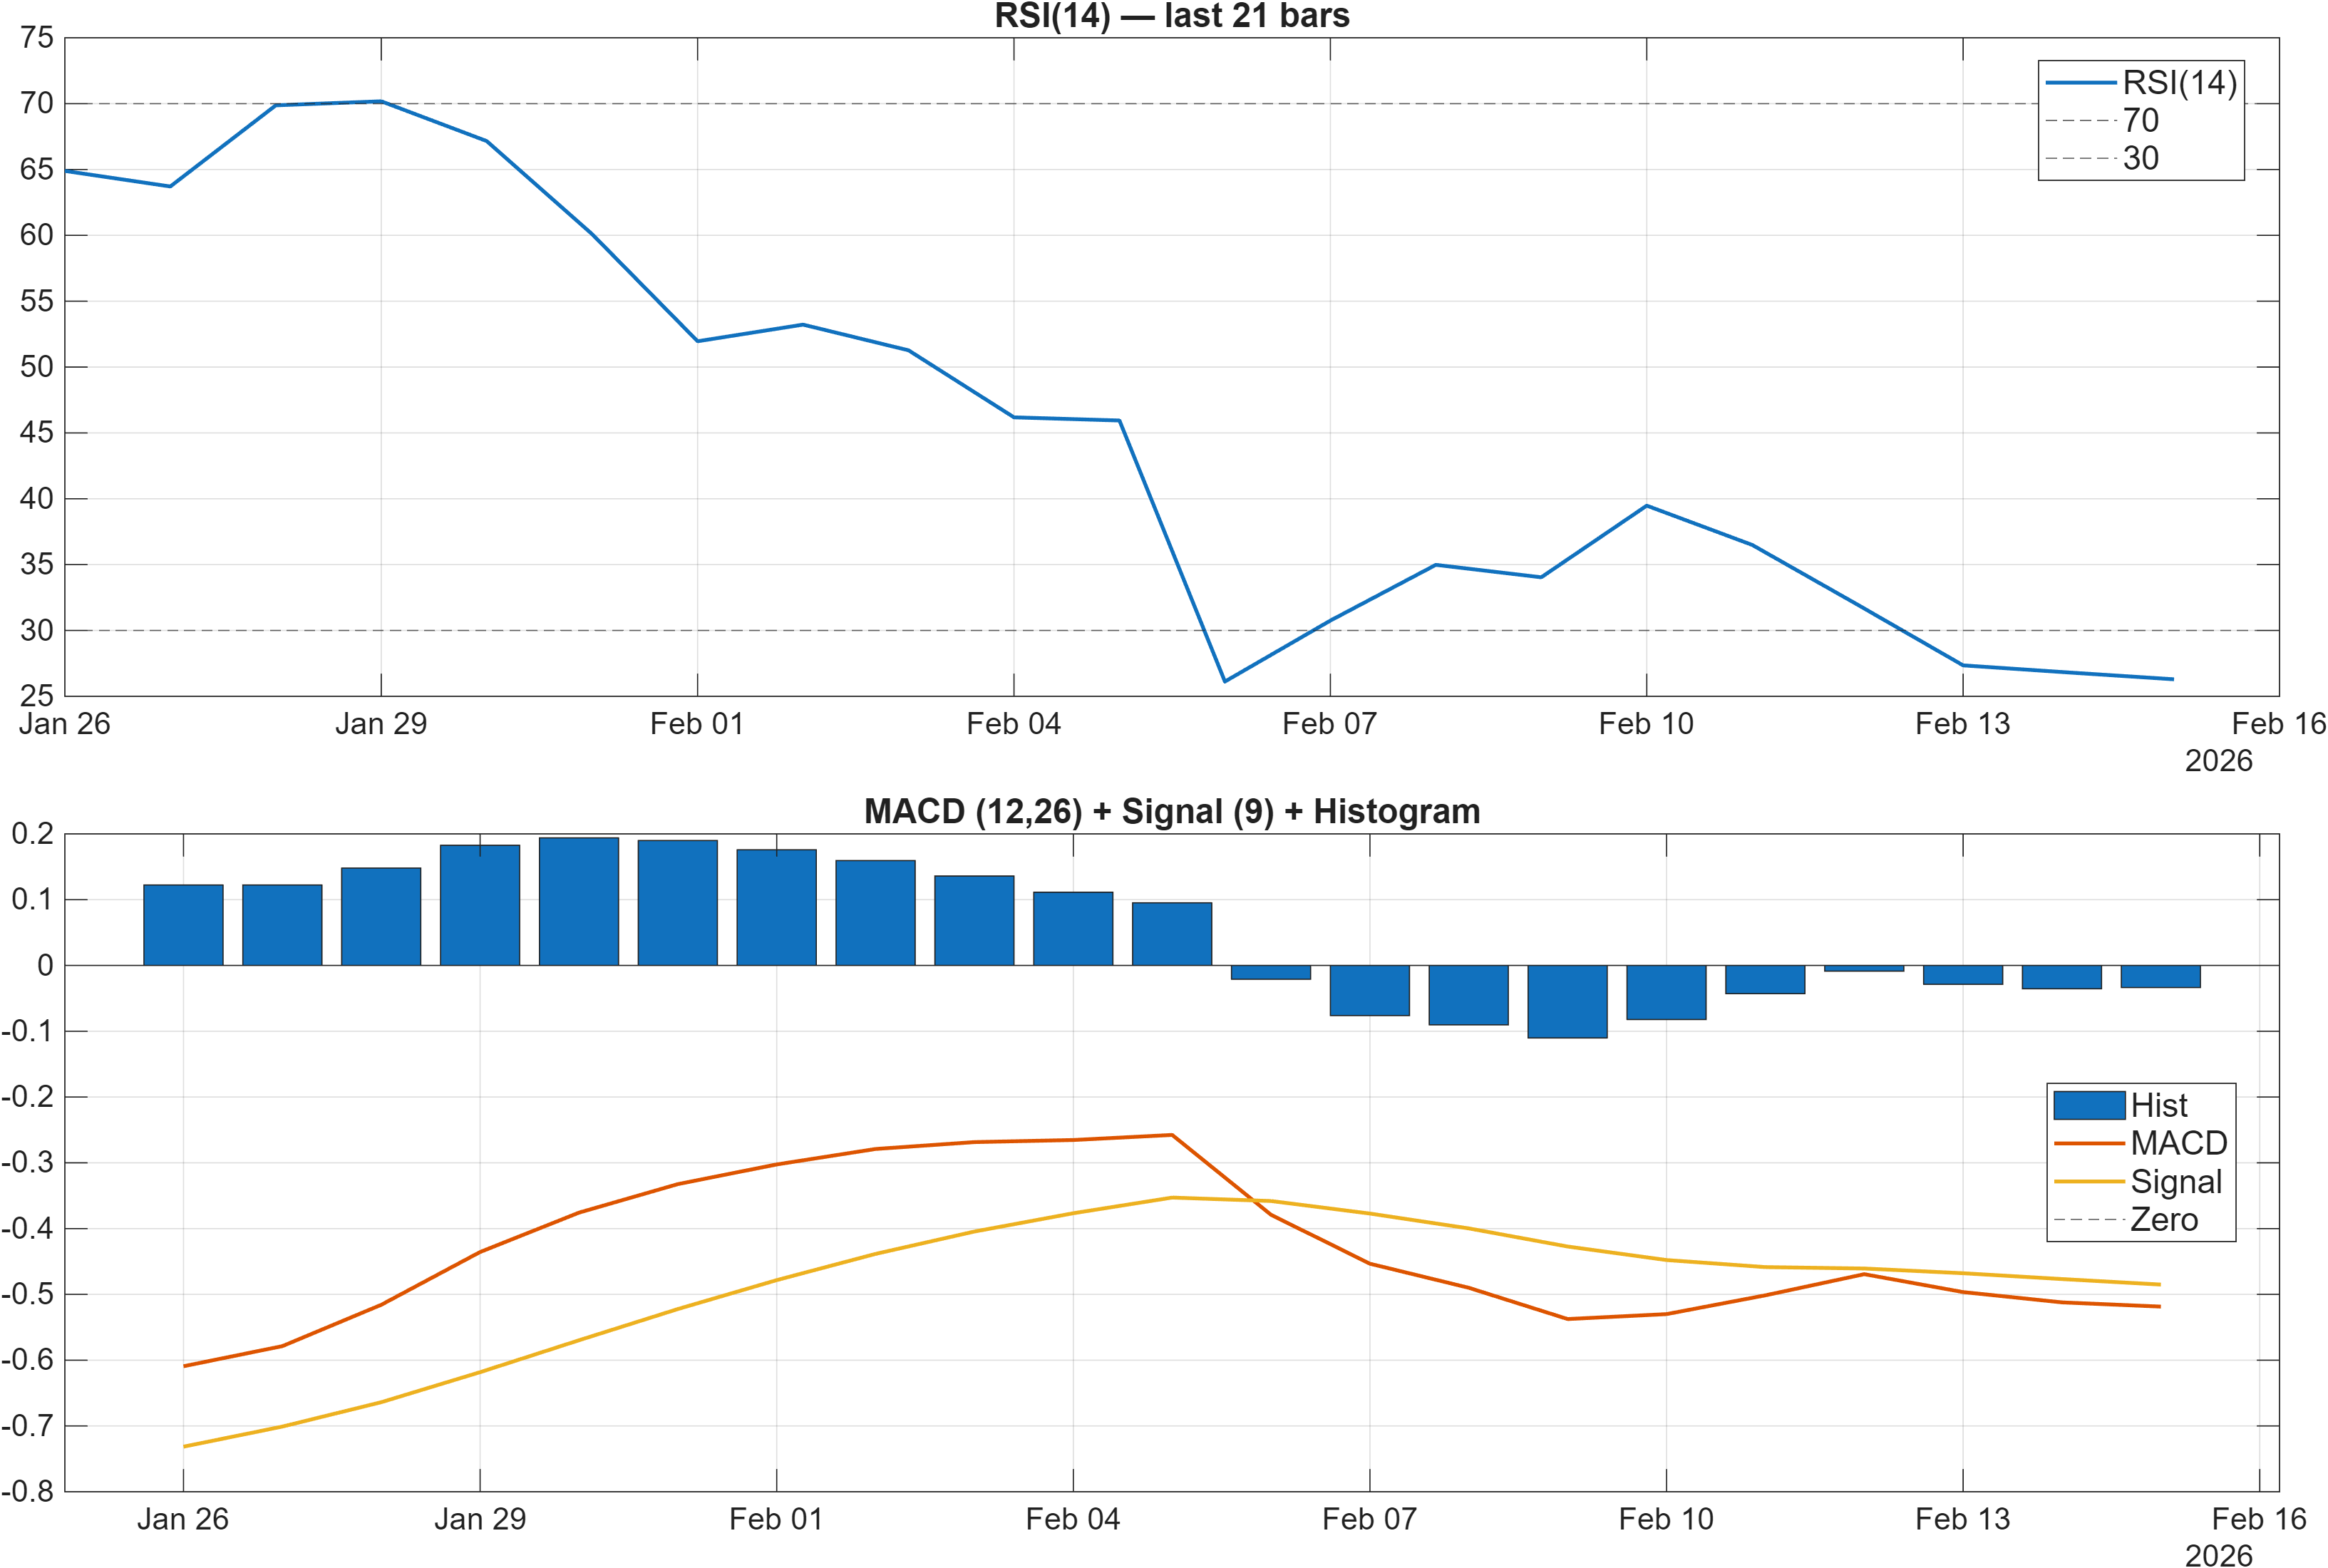
Interpretation: RSI bias = Bearish, MACD hist = -0.0335.
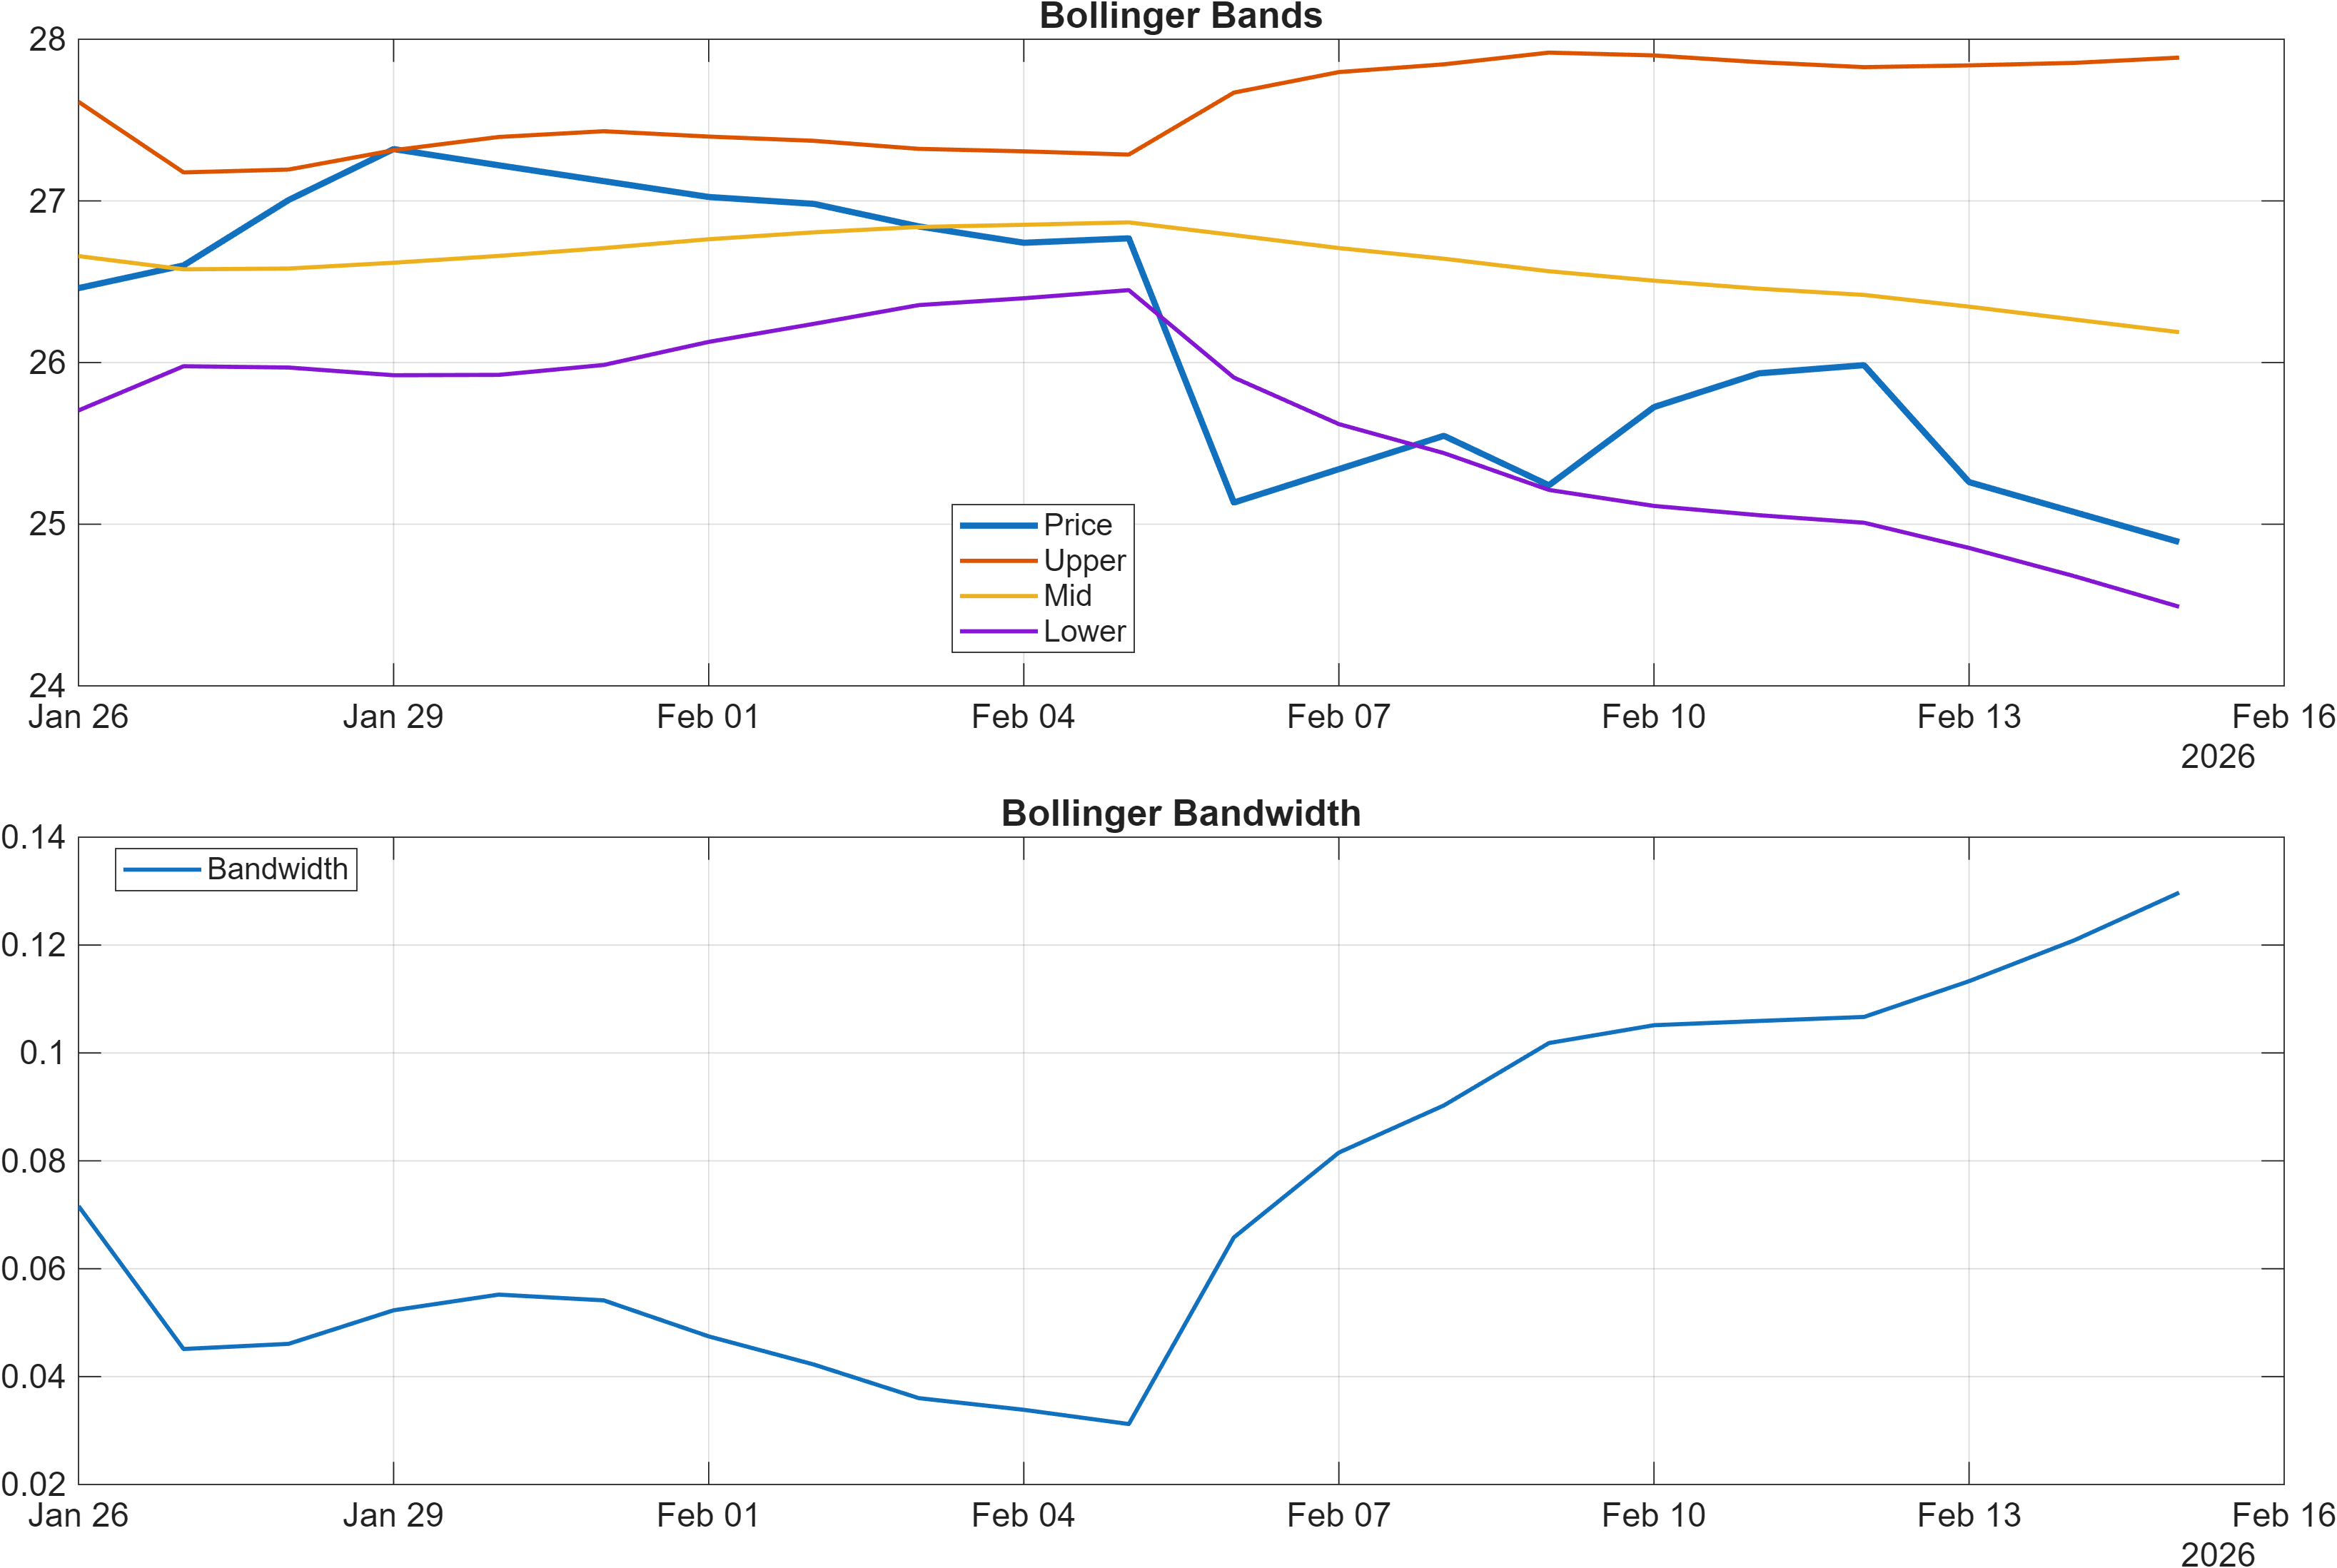
Interpretation: Bandwidth (volatility regime) latest = 0.1297.
Momentum inputs are tilted to the downside. The dashboard flags RSI(14) at 26.29 as bearish, which places the oscillator in a deeply weak zone and consistent with risk of continued negative impulse or at least delayed recovery attempts. At the same time, the MACD histogram at -0.0335 shows negative momentum persistence rather than a confirmed positive turn. Together, these readings support the weak near-term rank positioning (Daily #949) and the bearish moving-average interpretation.
Volatility context is less extreme than the momentum posture implies. Bollinger Bandwidth at 0.1297 indicates an identifiable volatility regime but does not, on its own, confirm an imminent expansion or contraction direction. In practice, this can leave the market prone to sharp, level-driven swings if volatility expands into a trend continuation, while also allowing for abrupt snapbacks if momentum begins to mean-revert from stretched conditions.
The more nuanced read is that momentum weakness is already established, while volatility is not signaling a clear exhaustion endpoint. In such cases, confirmation often comes from whether RSI can improve sustainably while MACD histogram stops deteriorating. Absent that, bearish momentum can remain “sticky,” and rallies may struggle to convert into trend repair, especially while the average stack remains bearish.
4) Support / Resistance zones
Support ~ 25.2300 | Resistance ~ 30.4540
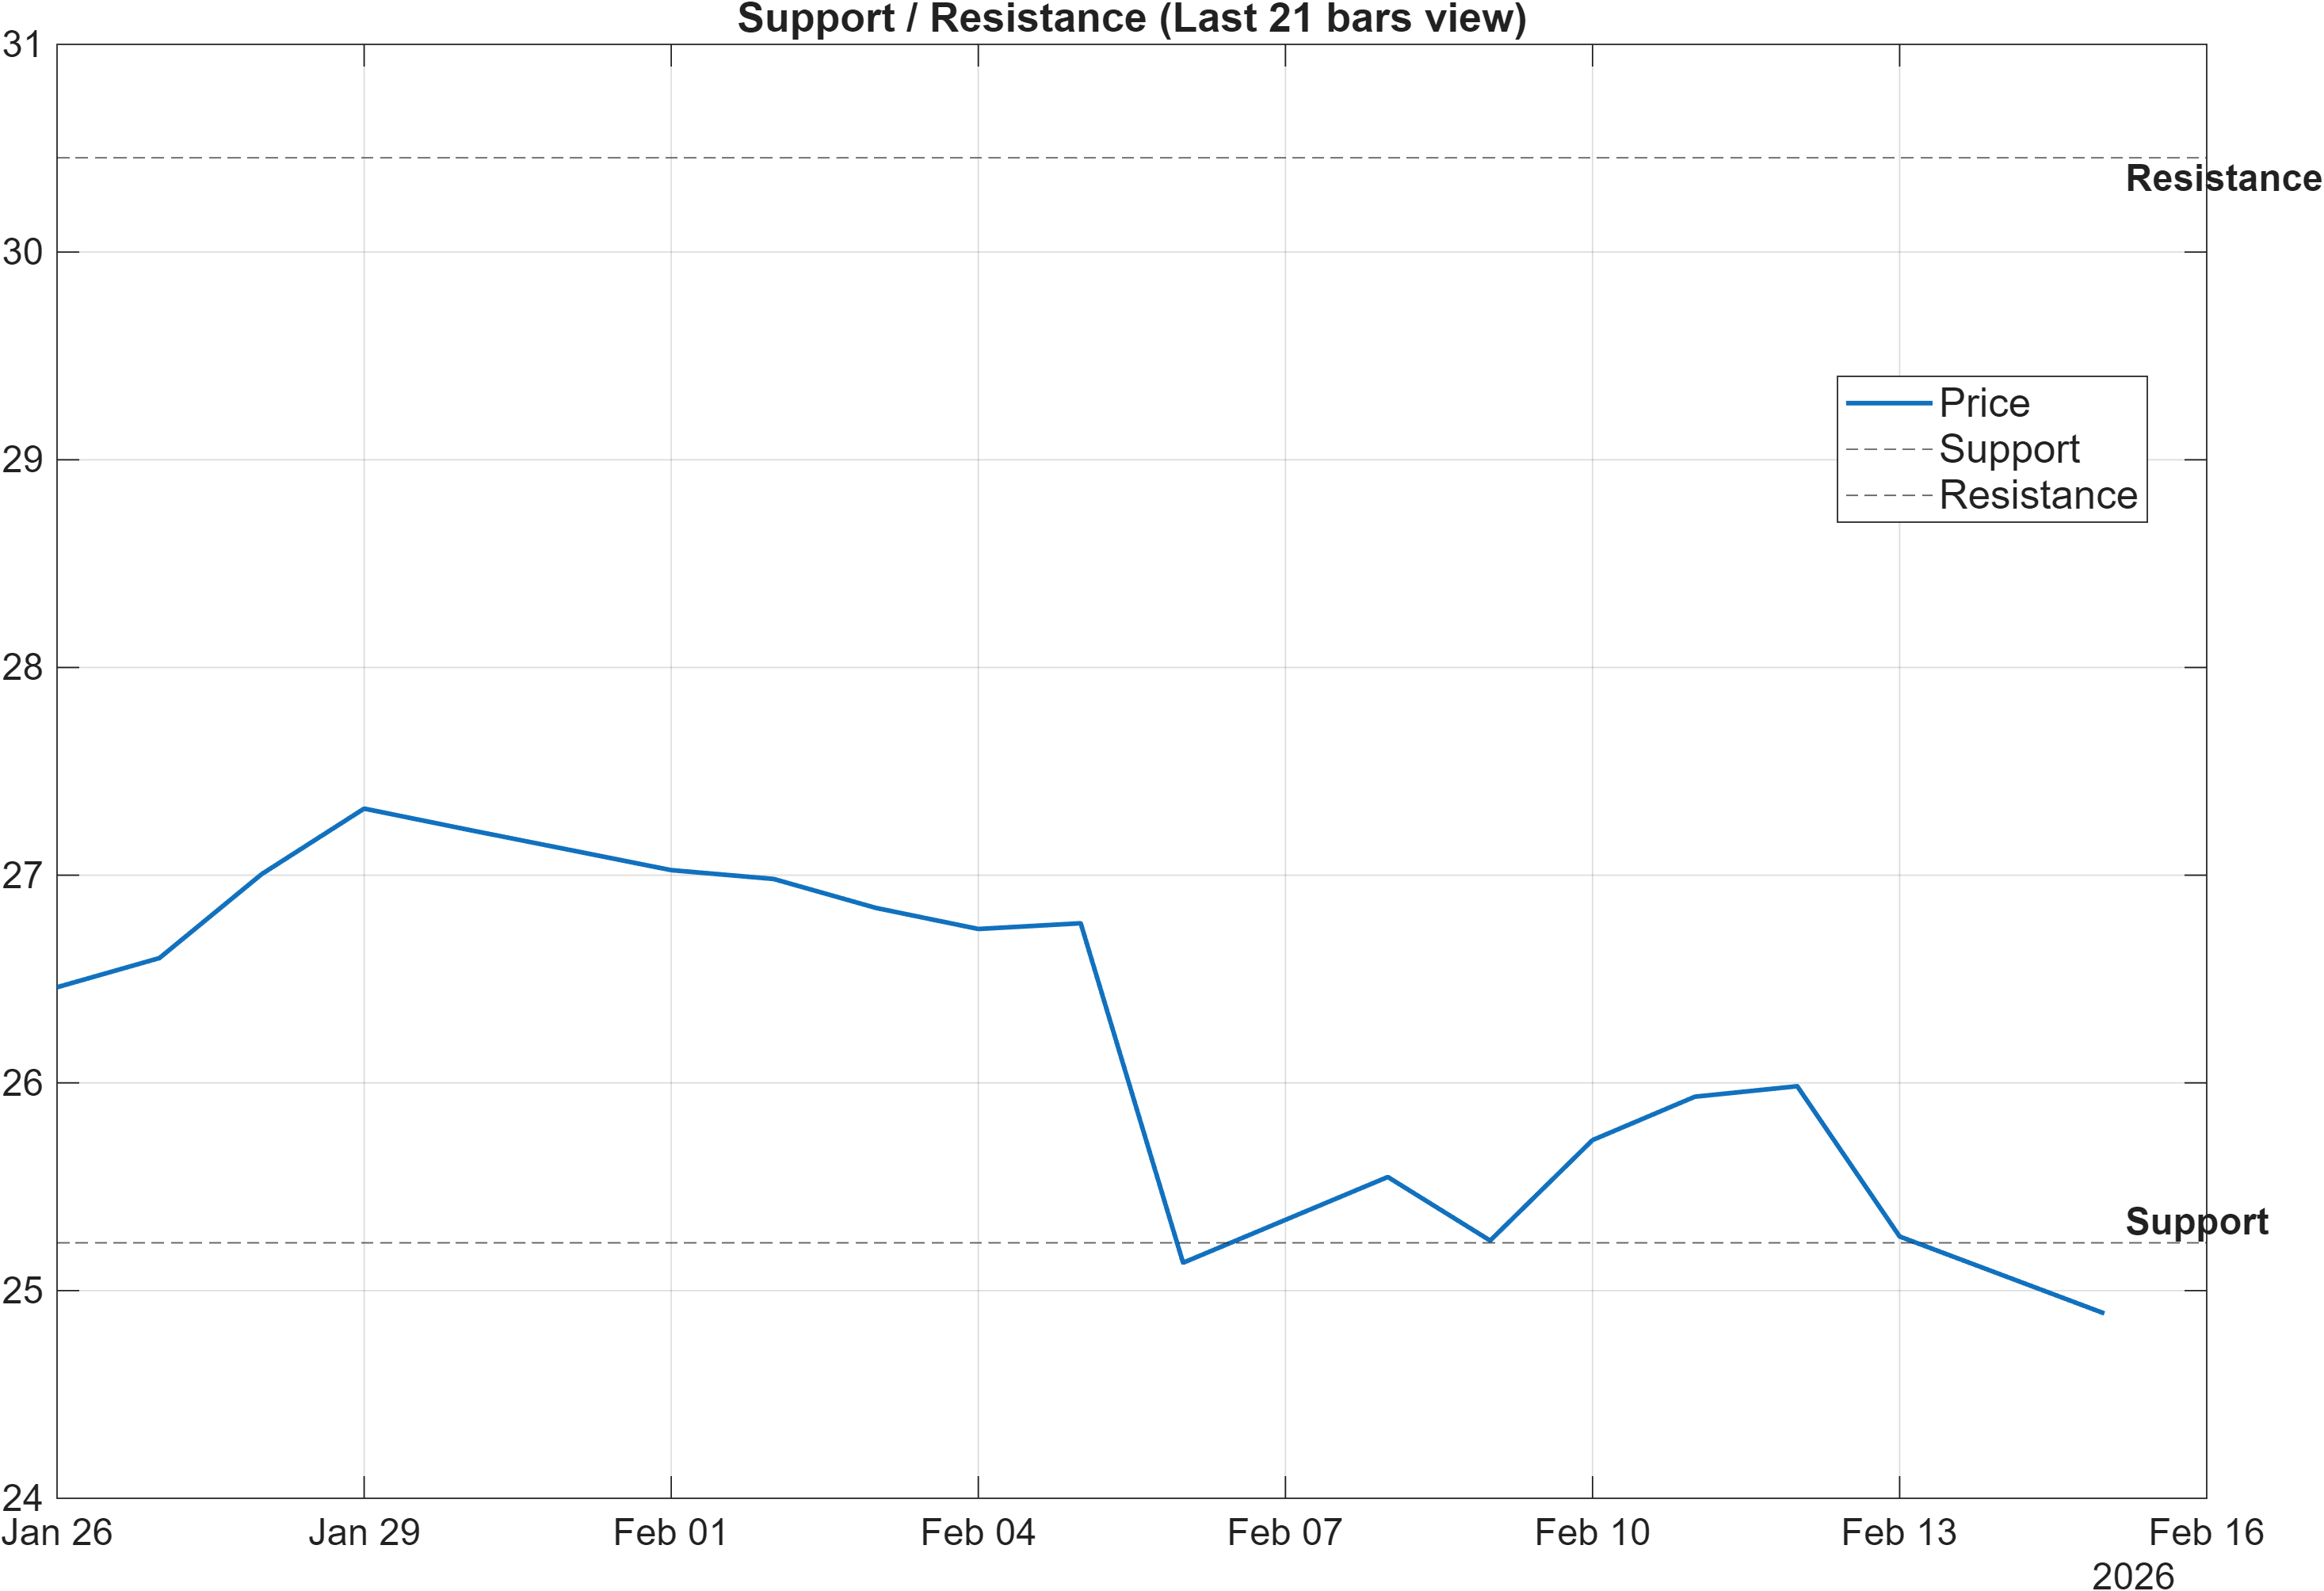
Scenario view: Break above resistance with volume → continuation. Close below support → signal deterioration risk.
With trend structure and momentum leaning bearish, the 25.2300 support acts as a key “decision zone” for whether the current downswing remains a contained pullback or evolves into broader deterioration. A close below 25.2300, as framed in the scenario view, increases the risk that bearish signals broaden beyond the already weak short-term posture and begin to pressure the otherwise constructive mid-to-long horizon ranks.
On the upside, 30.4540 resistance is the threshold where the market would need to demonstrate enough demand to overcome both the immediate momentum headwinds (e.g., MACD histogram -0.0335) and the bearish moving-average context (Close vs MA50 bearish; MA50 vs MA200 bearish). A break above resistance “with volume,” per the scenario framing, is best interpreted as a confirmation filter rather than a directional guarantee—particularly given that the blended technical score is still negative (-0.536).
In the current regime, these levels also provide structure for reconciling mixed ranks: longer-horizon strength (6-Monthly #1, 3-Monthly #15) is more credible if the market can defend support and begin to reclaim overhead zones. Conversely, repeated failures at resistance or a decisive break of support would be consistent with the daily weakness (#949) remaining dominant for longer than a short-term fluctuation.
5) Quant Technical Dashboard (18 Signals)
KGNAI AI Technical Analysis Score (Deep Reinforcement Learning): Rank #841 out of 961 (Rank 1 represents the strongest technical positioning and a higher probability of favorable price behavior. As ranks increase toward the maximum, the probability of favorable outcomes weakens and bearish positioning becomes more dominant.) | Label: Bearish | Score: -0.750
18-Signal Technical Confluence Score: -0.444 (Bearish)
Overall Technical Score (18-signal confluence + DRL rank blend): -0.536 (Bearish)
Note: The blended score reflects signal strength weighted against broader AI technical ranking, which may temporarily diverge.
Blended technical score breakdown: -0.536 (Bearish | Bull 1 / Bear 9 / Neutral 8)
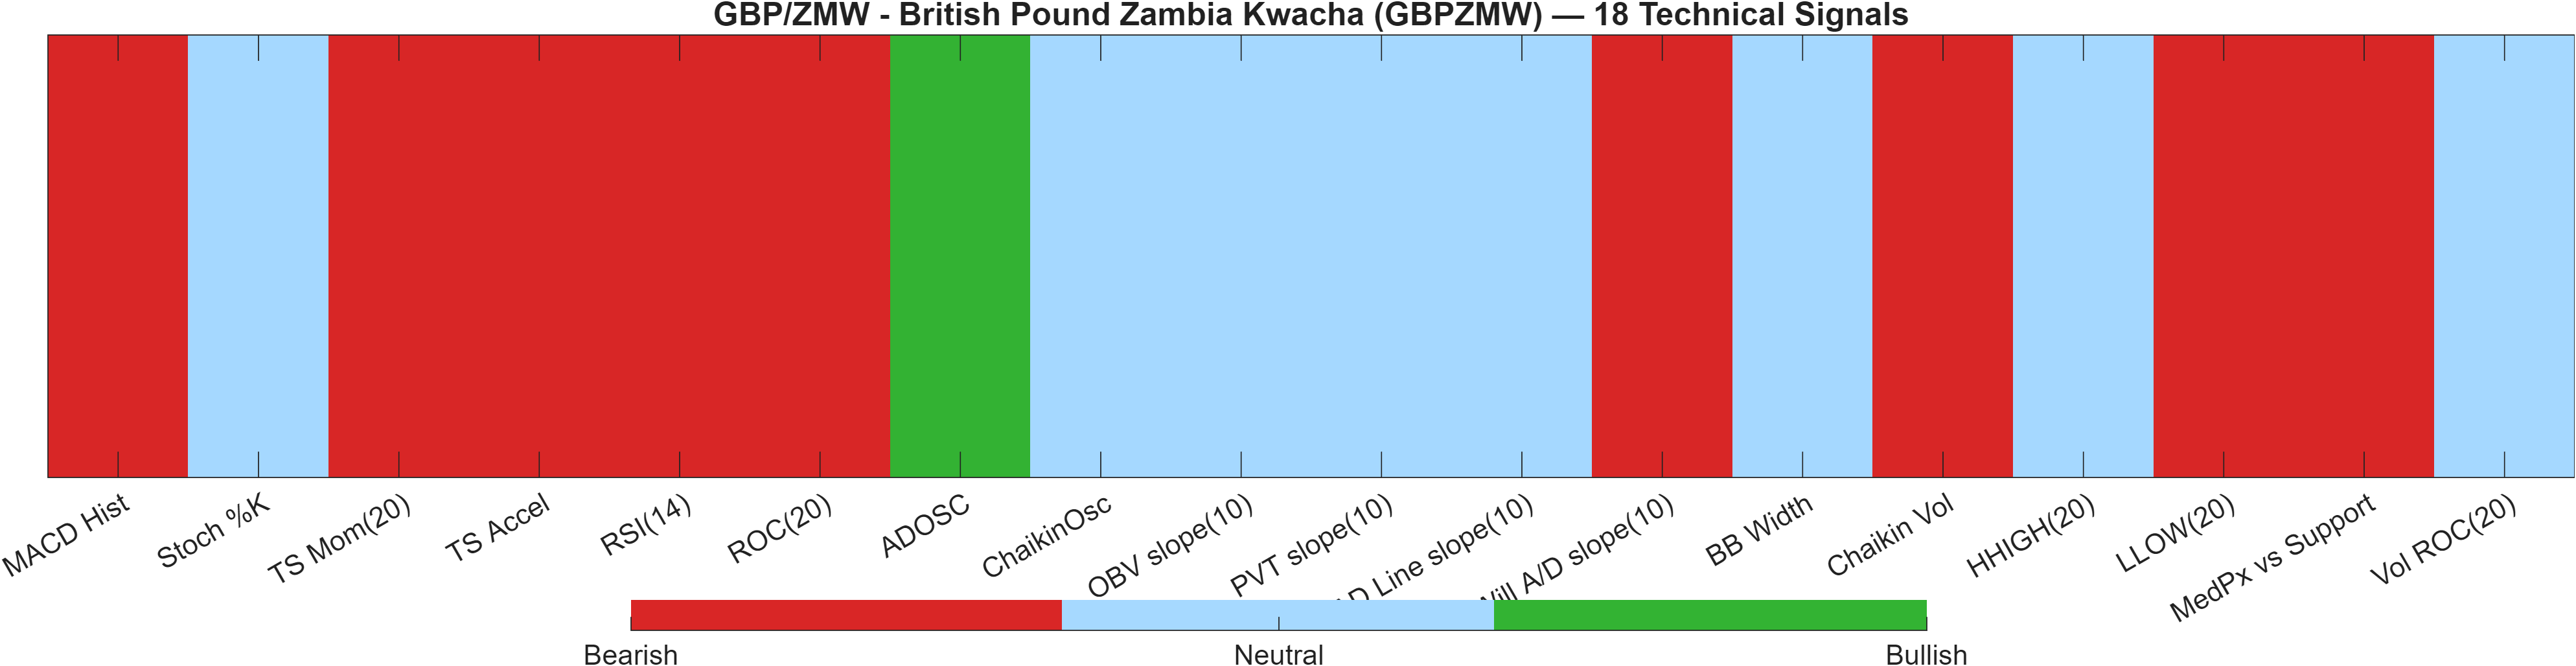
Signal table (Bull/Bear/Neutral)
| Indicator | Value | Signal |
|---|---|---|
| MACD Hist | -0.0335 | Bearish |
| Stoch %K | 44.91 | Neutral |
| TS Mom(20) | -1.34 | Bearish |
| TS Accel | -1.033 | Bearish |
| RSI(14) | 26.29 | Bearish |
| ROC(20) | -6.431 | Bearish |
| ADOSC | 51.67 | Bullish |
| ChaikinOsc | 0 | Neutral |
| OBV slope(10) | 0 | Neutral |
| PVT slope(10) | 0 | Neutral |
| AD Line slope(10) | 0 | Neutral |
| Will A/D slope(10) | -1.013 | Bearish |
| BB Width | 0.1297 | Neutral |
| Chaikin Vol | 24.15 | Bearish |
| HHIGH(20) | 27.39 | Neutral |
| LLOW(20) | 24.67 | Bearish |
| MedPx vs Support | -0.2645 | Bearish |
| Vol ROC(20) | — | Neutral |
Interpretation: Indicator-level signals form the base confluence, which is then adjusted using a separate AI-driven technical ranking model. The final technical score summarizes this combined view.
The technical dashboard is internally consistent with the near-term bearish rank: the DRL technical model places GBPZMW at Rank #841 out of 961 with a score of -0.750, while the blended framework keeps the composite view Bearish (Overall Technical Score -0.536). Importantly, the blend shows Bear 9 / Neutral 8 / Bull 1, which is a “broad but not unanimous” bearish profile—often associated with markets that can still produce short-lived countertrend moves even while the base case remains defensive.
Several momentum and rate-of-change inputs lean negative (e.g., RSI(14) 26.29, ROC(20) -6.431, and TS Mom(20) -1.34), reinforcing the idea that weakness is not isolated to a single measure. At the same time, selected flow/accumulation components are not uniformly bearish: ADOSC is 51.67 (Bullish) while multiple slope measures are neutral at 0. That mix can be read as pressure in price momentum with a less decisive message from certain participation proxies within the standardized set.
From a decision-quality perspective, the key is whether the neutral cluster begins to resolve toward bullish repair while the bearish momentum set stabilizes. Until that occurs, the blended score and DRL rank suggest that rallies may face higher failure probability within the current regime, particularly if price continues to respect resistance and/or fails to defend the 25.2300 support zone.
6) News sentiment + extractive gist
Note: Instrument-specific news matches were not found, so the digest includes broader market/sector headlines. Links are provided for verification.
Sentiment score (avg): -0.007 | Positive: 25% | Neutral: 38% | Negative: 37%
KGNAI AI News Sentiment Score (normalized -1 to +1): Not available (as of —) | Label: Not available | Overall news score: -0.01
Positive Developments
Recent coverage across major financial outlets indicates selective pockets of constructive macro tone, particularly around parts of Asia where growth expectations and policy messaging are being framed as supportive into 2026. Within the provided digest, there is an emphasis on improved activity signals and steadier consumer or financial-sector momentum in certain regions, which can—at the margin—reduce tail-risk pricing in broader risk assets and FX. While these items are not instrument-specific for GBPZMW, they can influence cross-asset volatility and USD dynamics that often spill into EM and frontier currency pairs. In the current GBPZMW setup, this constructive backdrop is best treated as a contextual offset rather than a direct catalyst, given that the technical posture remains Bearish (Overall Technical Score -0.536) and short-term ranking is weak (Daily #949). If broader risk sentiment firms, the cleaner validation would still come from price behavior around 30.4540 rather than narrative flow alone.
Neutral / Mixed Developments
The neutral items in the digest lean toward policy and market-structure discussion—factors that can shape medium-term expectations without immediately changing near-term price action. Coverage suggests a focus on budget support themes, capital-market development, and macro data interpretation, which typically feeds into rates and FX via expectations rather than instantaneous repricing. For GBPZMW, that aligns with the report’s overall sentiment read: the average sentiment score is close to flat at -0.007 with a near-balanced distribution (25% positive, 38% neutral, 37% negative). In other words, the news signal is not strong enough to override the technical evidence (e.g., RSI(14) 26.29 and MACD histogram -0.0335). Mixed macro narratives typically elevate the importance of support/resistance adherence and volatility regime confirmation (Bandwidth 0.1297) as the primary decision inputs.
Negative / Risk Signals
Recent coverage across major financial outlets also highlights event-risk sensitivity and cross-asset fragility—especially around inflation releases, shifting rate expectations, and risk-asset positioning. Such conditions can generate sharp, short-lived volatility bursts that disproportionately impact higher-beta FX and less liquid crosses. In the provided digest, the negative set clusters around uncertain risk mood and policy-path debate, which often translates into a stronger demand for liquidity and a higher hurdle for sustained countertrend rallies. For GBPZMW, this matters because the market is already in a bearish technical configuration (DRL technical rank #841, score -0.750), and the short-term rank is in the weakest tail (Daily #949). Under risk-off pulses, the key fragility point becomes the 25.2300 support: a close below support is explicitly flagged as deterioration risk in the scenario view, while recovery attempts typically need stronger confirmation to overcome the bearish MA structure.
- Whether price holds or closes below 25.2300 as momentum remains weak (RSI 26.29).
- Any confirmed reclaim and acceptance above 30.4540 alongside improving momentum (MACD histogram moving away from -0.0335).
- Signs of volatility expansion from Bandwidth 0.1297 and whether expansion aligns with breakout direction.
Sources referenced: Reuters, Bloomberg, Yahoo Finance, MarketWatch, Investing.com
Snapshot: AI Rank (Short–Mid–Long): Mixed (Bullish tilt) (Bearish–Bullish–Bullish) · Technical Confluence: Bearish · Key Levels: Support ~25.23 | Resistance ~30.45 · News Sentiment: Neutral
7) Sources
- USD/INR: Interim trade deal caps near-term INR gains – MUFG — https://www.fxstreet.com/news/usd-inr-interim-trade-deal-caps-near-term-inr-gains-mufg-202602132342
- SGD: Budget support and equity-market push – Commerzbank — https://www.fxstreet.com/news/sgd-budget-support-and-equity-market-push-commerzbank-202602132258
- USD/CNY: Gradual reflation and policy easing guide CNY path – MUFG — https://www.fxstreet.com/news/usd-cny-gradual-reflation-and-policy-easing-guide-cny-path-mufg-202602132217
- Hong Kong: Solid growth outlook into 2026 – Standard Chartered — https://www.fxstreet.com/news/hong-kong-solid-growth-outlook-into-2026-standard-chartered-202602132141
- Malaysia: Growth seen moderating in 2026 – UOB — https://www.fxstreet.com/news/malaysia-growth-seen-moderating-in-2026-uob-202602132106
- Silver Price Forecast: Gains 2% on US CPI, struggles below $80.00 — https://www.fxstreet.com/news/silver-price-forecast-gains-2-on-us-cpi-struggles-below-8000-202602132038
- INR: New CPI series and RBI stance – Commerzbank — https://www.fxstreet.com/news/inr-new-cpi-series-and-rbi-stance-commerzbank-202602132028
- Fed's Goolsbee: Rates can come down, but need to see services inflation progress — https://www.fxstreet.com/news/feds-goolsbee-rates-can-come-down-but-need-to-see-services-inflation-progress-202602132026
You may also like: How KGNAI AI ranks instruments across global markets
Disclaimer: KGNAI provides AI-generated analytics and educational market commentary only. This is not financial advice. Markets involve risk. Always do your own research.