USDKRW — US Dollar/Korean Won FX Spot Rate | 07-Jun-2026 | Bullish short-/mid-term, neutral long-term
USDKRW enters 07-Jun-2026 with a constructive technical backdrop that is strongest in the short-to-mid horizon, while longer-horizon ranks remain more balanced. Cross-sectional positioning is notably strong on the weekly rank (#11/963) and still supportive on the monthly rank (#29/963), consistent with a trend structure where price holds above the MA50 and the MA50 remains above the MA200. Momentum readings lean positive—RSI(14) at 70.33 and a MACD histogram of 4.7206—but the mix also hints at late-stage momentum risk via a Stoch %K at 96.5. Volatility is not showing a breakout regime, with Bollinger Bandwidth at 0.0521, which often shifts attention to key decision zones. Nearby, the market frames around support ~1460.7975 and resistance ~1520.9600, while news sentiment remains neutral with a slight positive tilt (avg 0.130).
- Rank stance: Short-term Bullish | Mid-term Bullish | Long-term Neutral
- Technical confluence: Overall Technical Score 0.350 Bullish (Bull 9 / Bear 2 / Neutral 7)
- Key levels: Support 1460.7975 | Resistance 1520.9600
- News sentiment bias: Neutral (avg 0.130; Positive 44% / Neutral 44% / Negative 12%)
- Confirmation / invalidation: A sustained push above 1520.9600 supports continuation; a close below 1460.7975 increases deterioration risk.
KGNAI evaluates assets using large cross-sectional datasets built from millions of structured data points. Inputs incorporate fundamental metrics, technical structures, and systematically processed news sentiment. Statistical models, machine learning, and AI frameworks are used to assess relative positioning, signal alignment, and probabilistic behavior across broad universes.
- Ranks are comparative across the tracked universe, not absolute price targets.
- Confluence reflects alignment among independent signal groups.
- Support/resistance levels are probabilistic decision zones, not guarantees.
- Sentiment provides contextual bias within the broader analytical framework.
1) KGNAI AI Analysis
Region: FOREX
Total universe size: 963 ranked instruments
- Daily rank: #123 out of 963 — Bullish
- Weekly rank: #11 out of 963 — Bullish
- Monthly rank: #29 out of 963 — Bullish
- 3-Monthly rank: #122 out of 963 — Bullish
- 6-Monthly rank: #443 out of 963 — Neutral
- Yearly rank: #312 out of 963 — Neutral
Cross-sectional ranks point to a front-end strength profile: the weekly reading sits in the top decile of the 963-instrument universe (#11), and the monthly rank remains in the upper quartile (#29). Daily and 3-month ranks (#123 and #122) reinforce a constructive bias without indicating an extreme “one-way” condition.
The longer lookbacks are notably different: the 6-month rank (#443) and yearly rank (#312) both sit in Neutral territory. That split matters: it suggests USDKRW has recently improved in relative behavior versus peers, but the broader historical regime has not fully transitioned into a persistent, high-confidence leadership state.
From a positioning lens, this pattern is often consistent with a market that is trending in the near term while still carrying enough longer-horizon mean-reversion risk to warrant disciplined level management. In practice, the strongest “information content” here is the rank clustering in the weekly (#11) and monthly (#29) windows, while the more middling yearly (#312) keeps the long-term stance restrained.
Term view: Short-term: Bullish. Mid-term: Bullish. Long-term: Neutral.
Want the full universe and complete rank tables? Unlock full access on KGNAI: https://www.kgnai.com/pricing
2) Price & trend overview
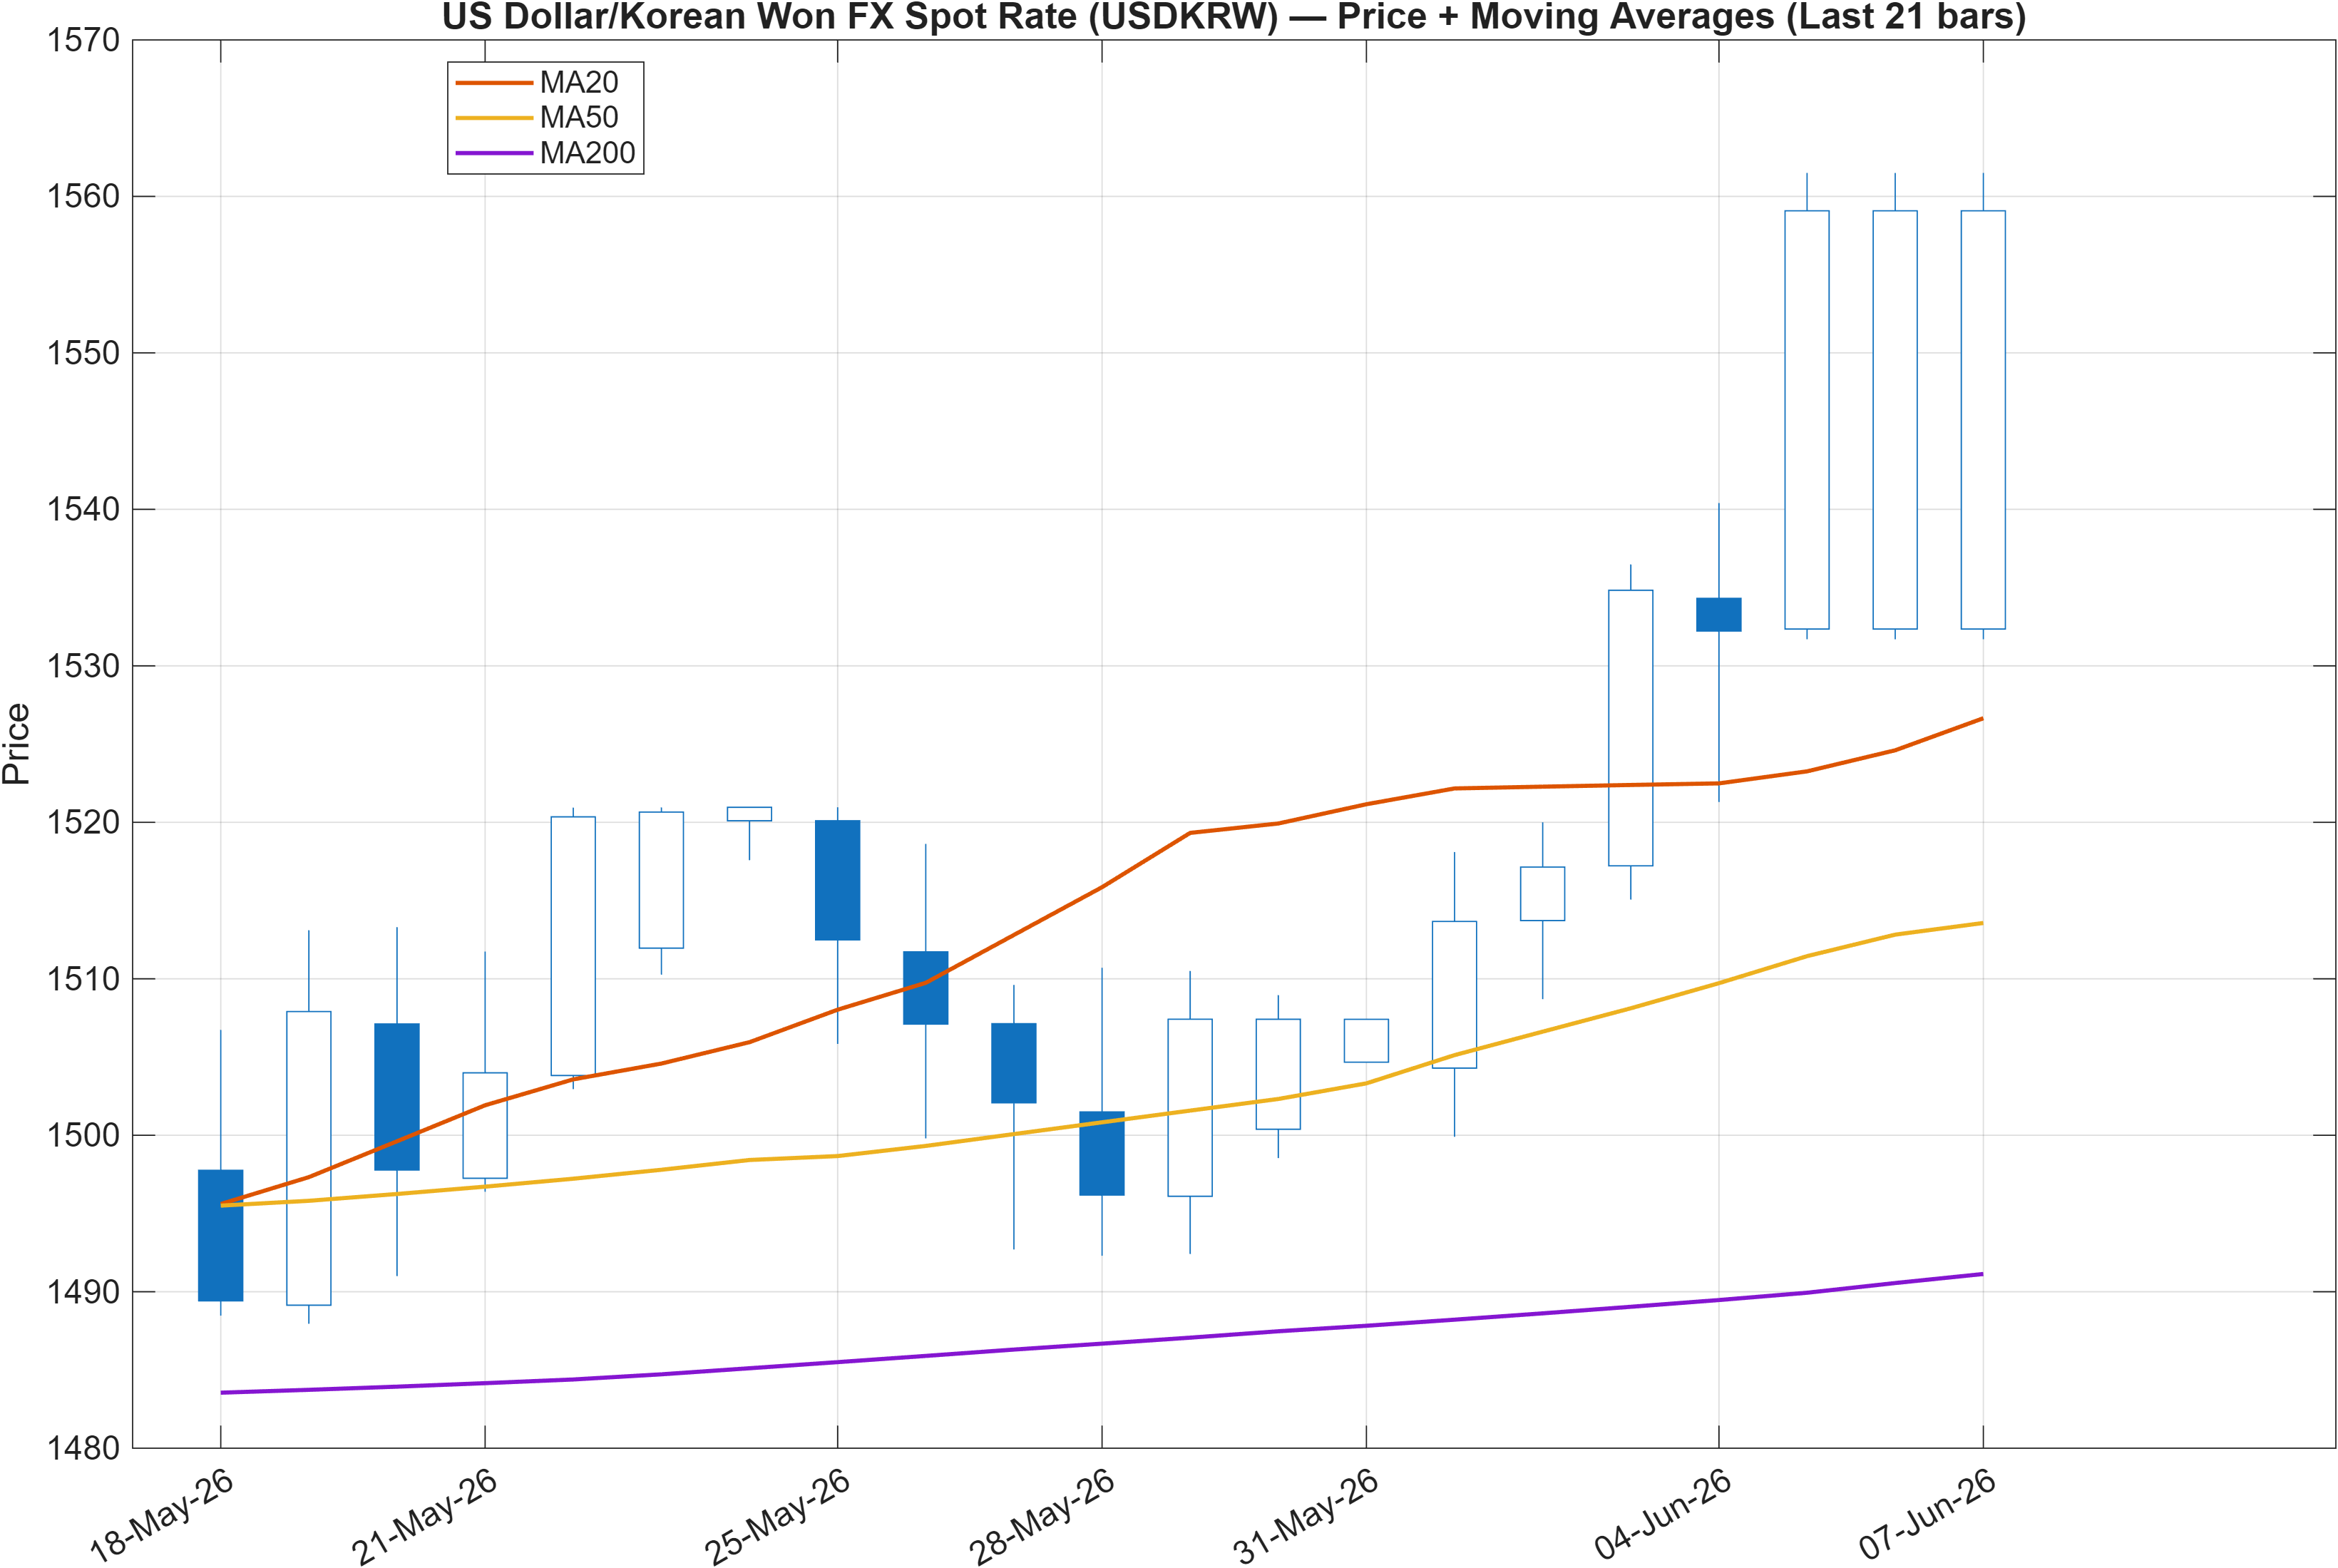
Trend structure is currently defined by a classic moving-average “stack” in which the close remains above the MA50 and the MA50 sits above the MA200—both flagged as Bullish. This configuration generally reflects trend persistence rather than a choppy mean-reversion environment, aligning well with the strong weekly rank (#11) and supportive monthly rank (#29).
The key nuance is time-horizon consistency. When a strong short-/mid-term rank set (daily #123, 3-month #122, weekly #11) coexists with neutral longer ranks (6-month #443, yearly #312), it often implies the market is in a late-transition phase: the trend is established enough to keep technical structure constructive, but not established enough to remove the risk of a broader-range relapse.
That places emphasis on how price behaves around well-defined zones rather than on extrapolating the moving-average signal alone. In this setup, trend health is best monitored through whether the market can hold above support at 1460.7975 during pullbacks and whether it can sustain trade above resistance at 1520.9600 on expansions.
With volatility not signaling a breakout regime (BandWidth 0.0521, discussed later), trend continuation can occur via incremental grinding rather than a single impulse. That tends to reward confirmation-based approaches—waiting for acceptance above resistance or using support as a regime check—more than aggressive chase behavior after extended runs.
Interpretation: Close vs MA50 = Bullish, MA50 vs MA200 = Bullish.
3) Momentum & volatility dashboard
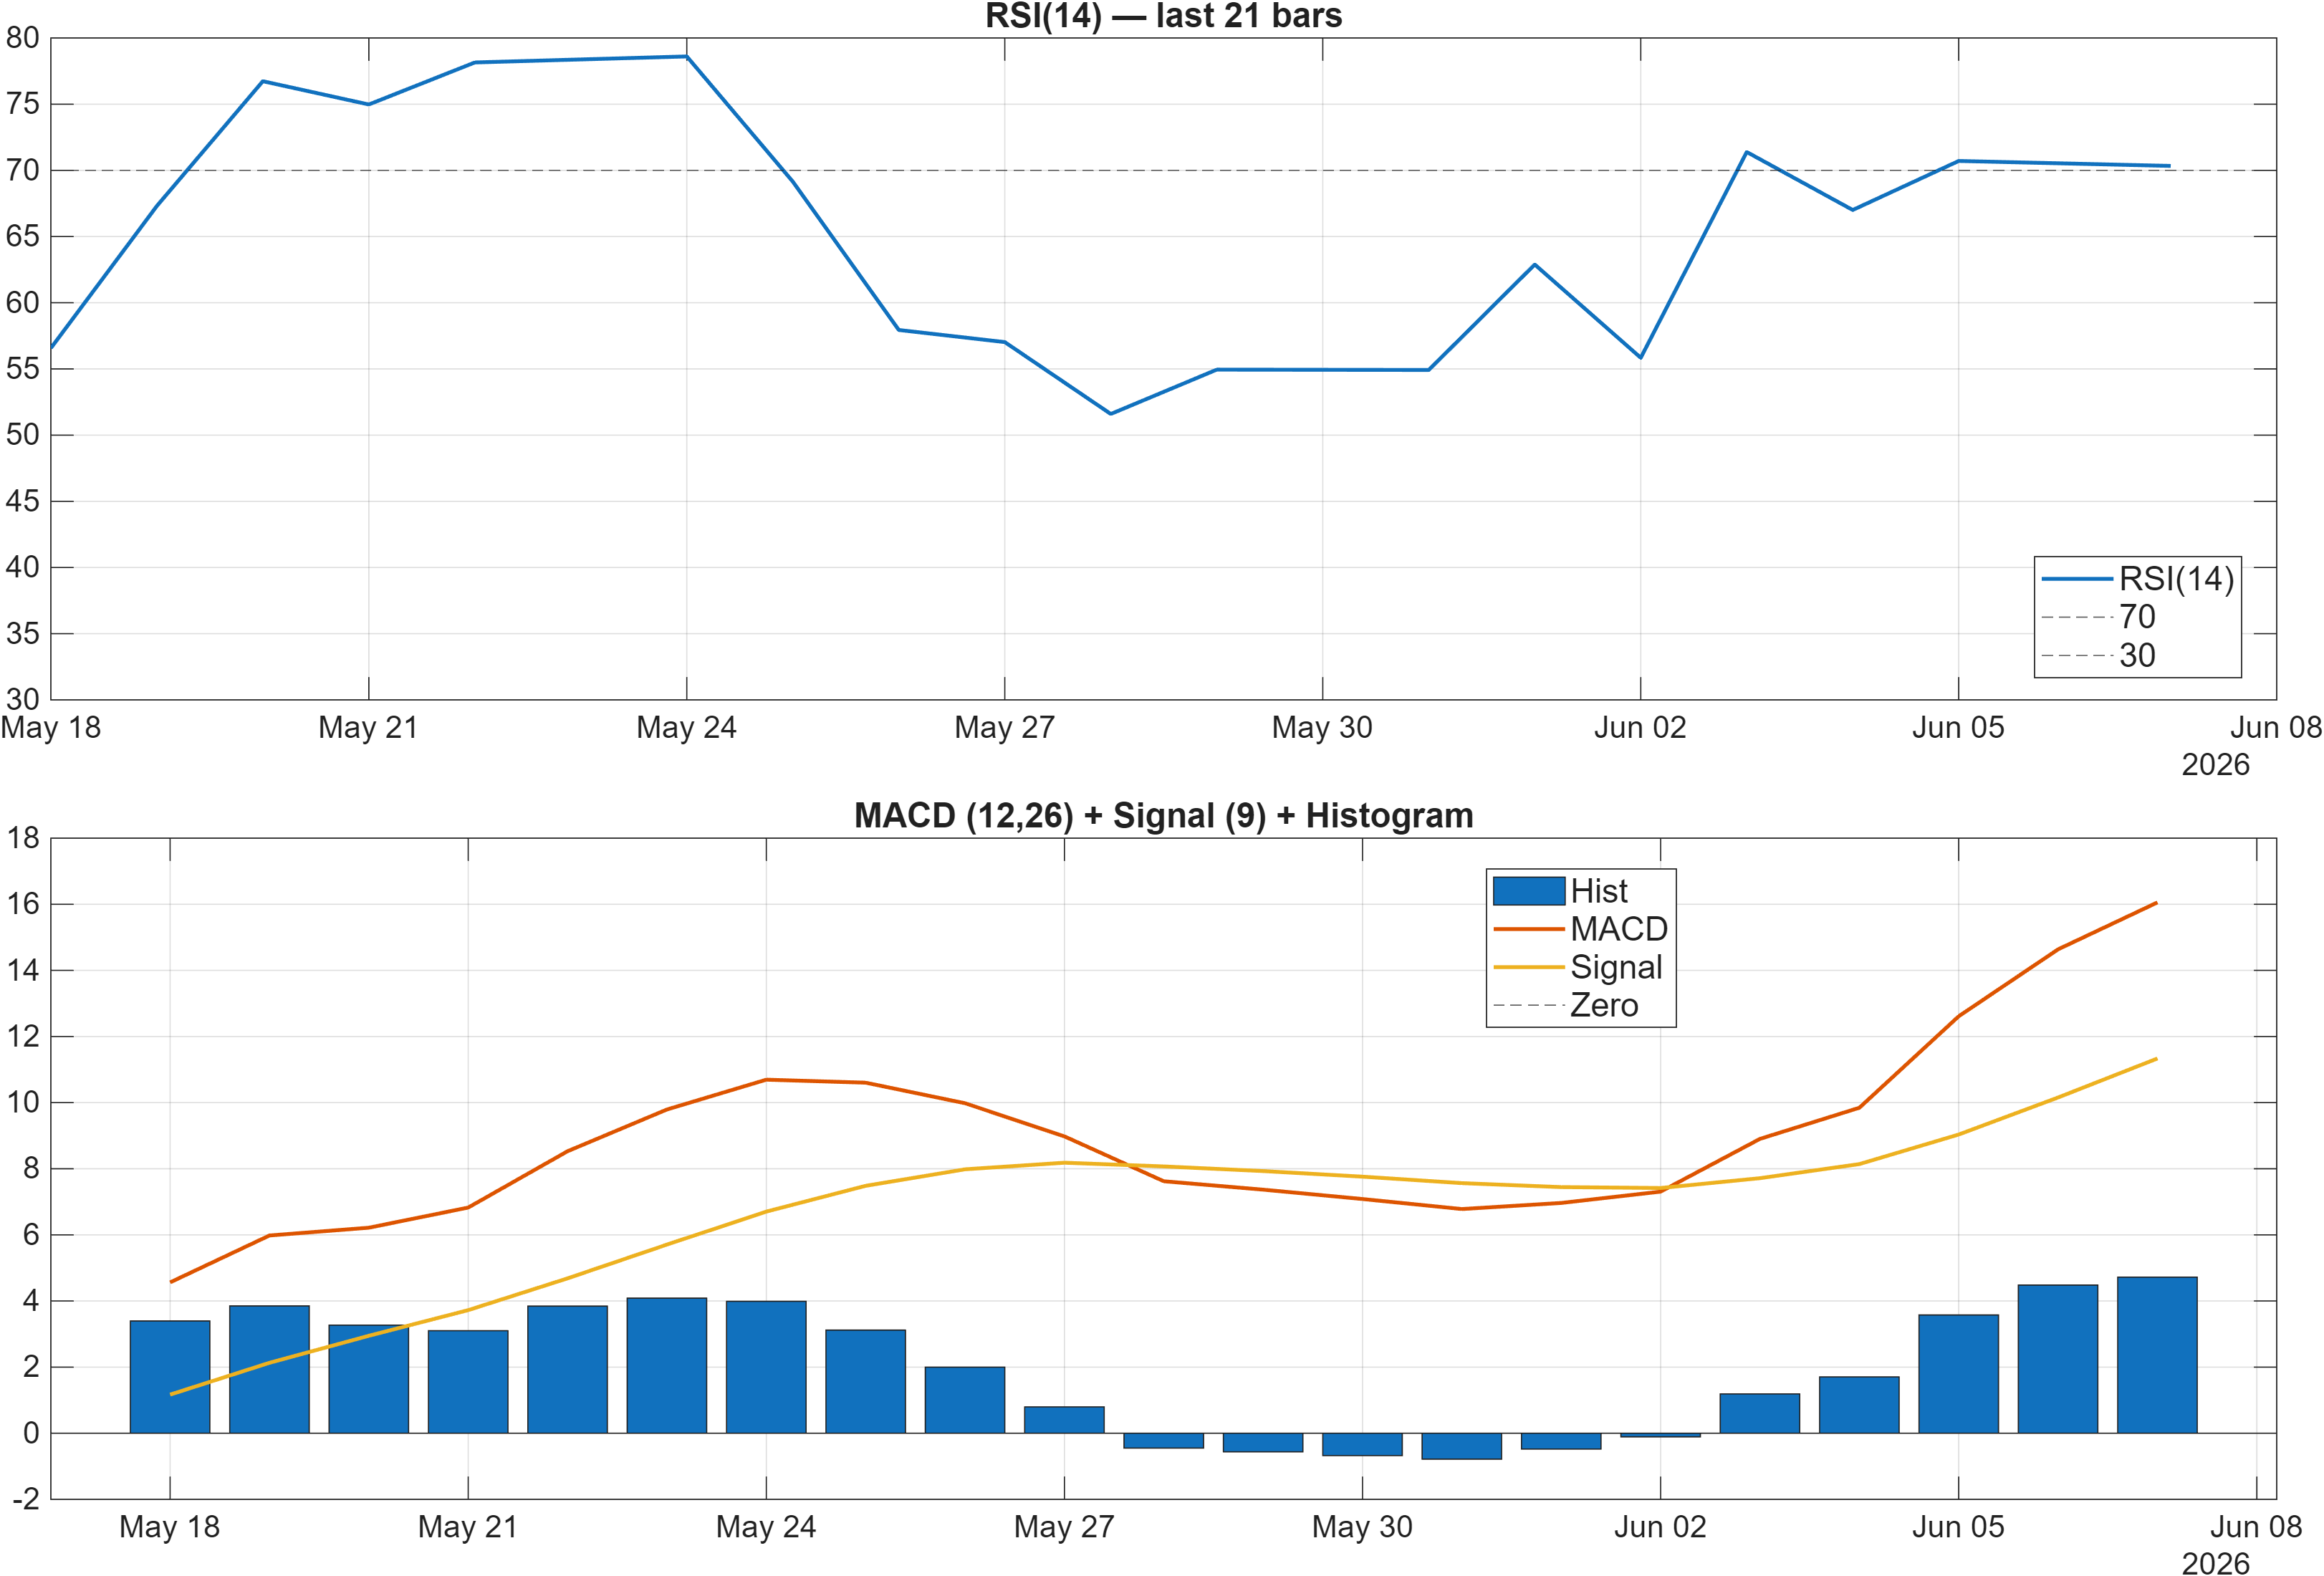
Momentum remains supportive but is starting to show maturity characteristics. RSI(14) at 70.33 is flagged as bullish and is consistent with a market maintaining upside pressure. At the same time, RSI hovering around the 70 threshold can also coincide with reduced marginal upside unless new participation arrives, making confirmation via price acceptance above resistance more informative than the oscillator alone.
MACD conditions are constructive: the MACD histogram is 4.7206 (and the signal table prints 4.721 as bullish), which typically reflects positive trend momentum and helps validate the moving-average alignment. This pairing—bullish MA regime plus positive MACD histogram—usually argues against prematurely fading the move unless key levels break.
The counterweight comes from faster oscillators. Stoch %K at 96.5 is explicitly bearish in the 18-signal dashboard, indicating a potentially stretched short-term state. When Stoch is extreme while MACD remains positive, it can point to trend-within-stretch: the trend can persist, but pullback risk rises and entries become more sensitive to timing and level structure.
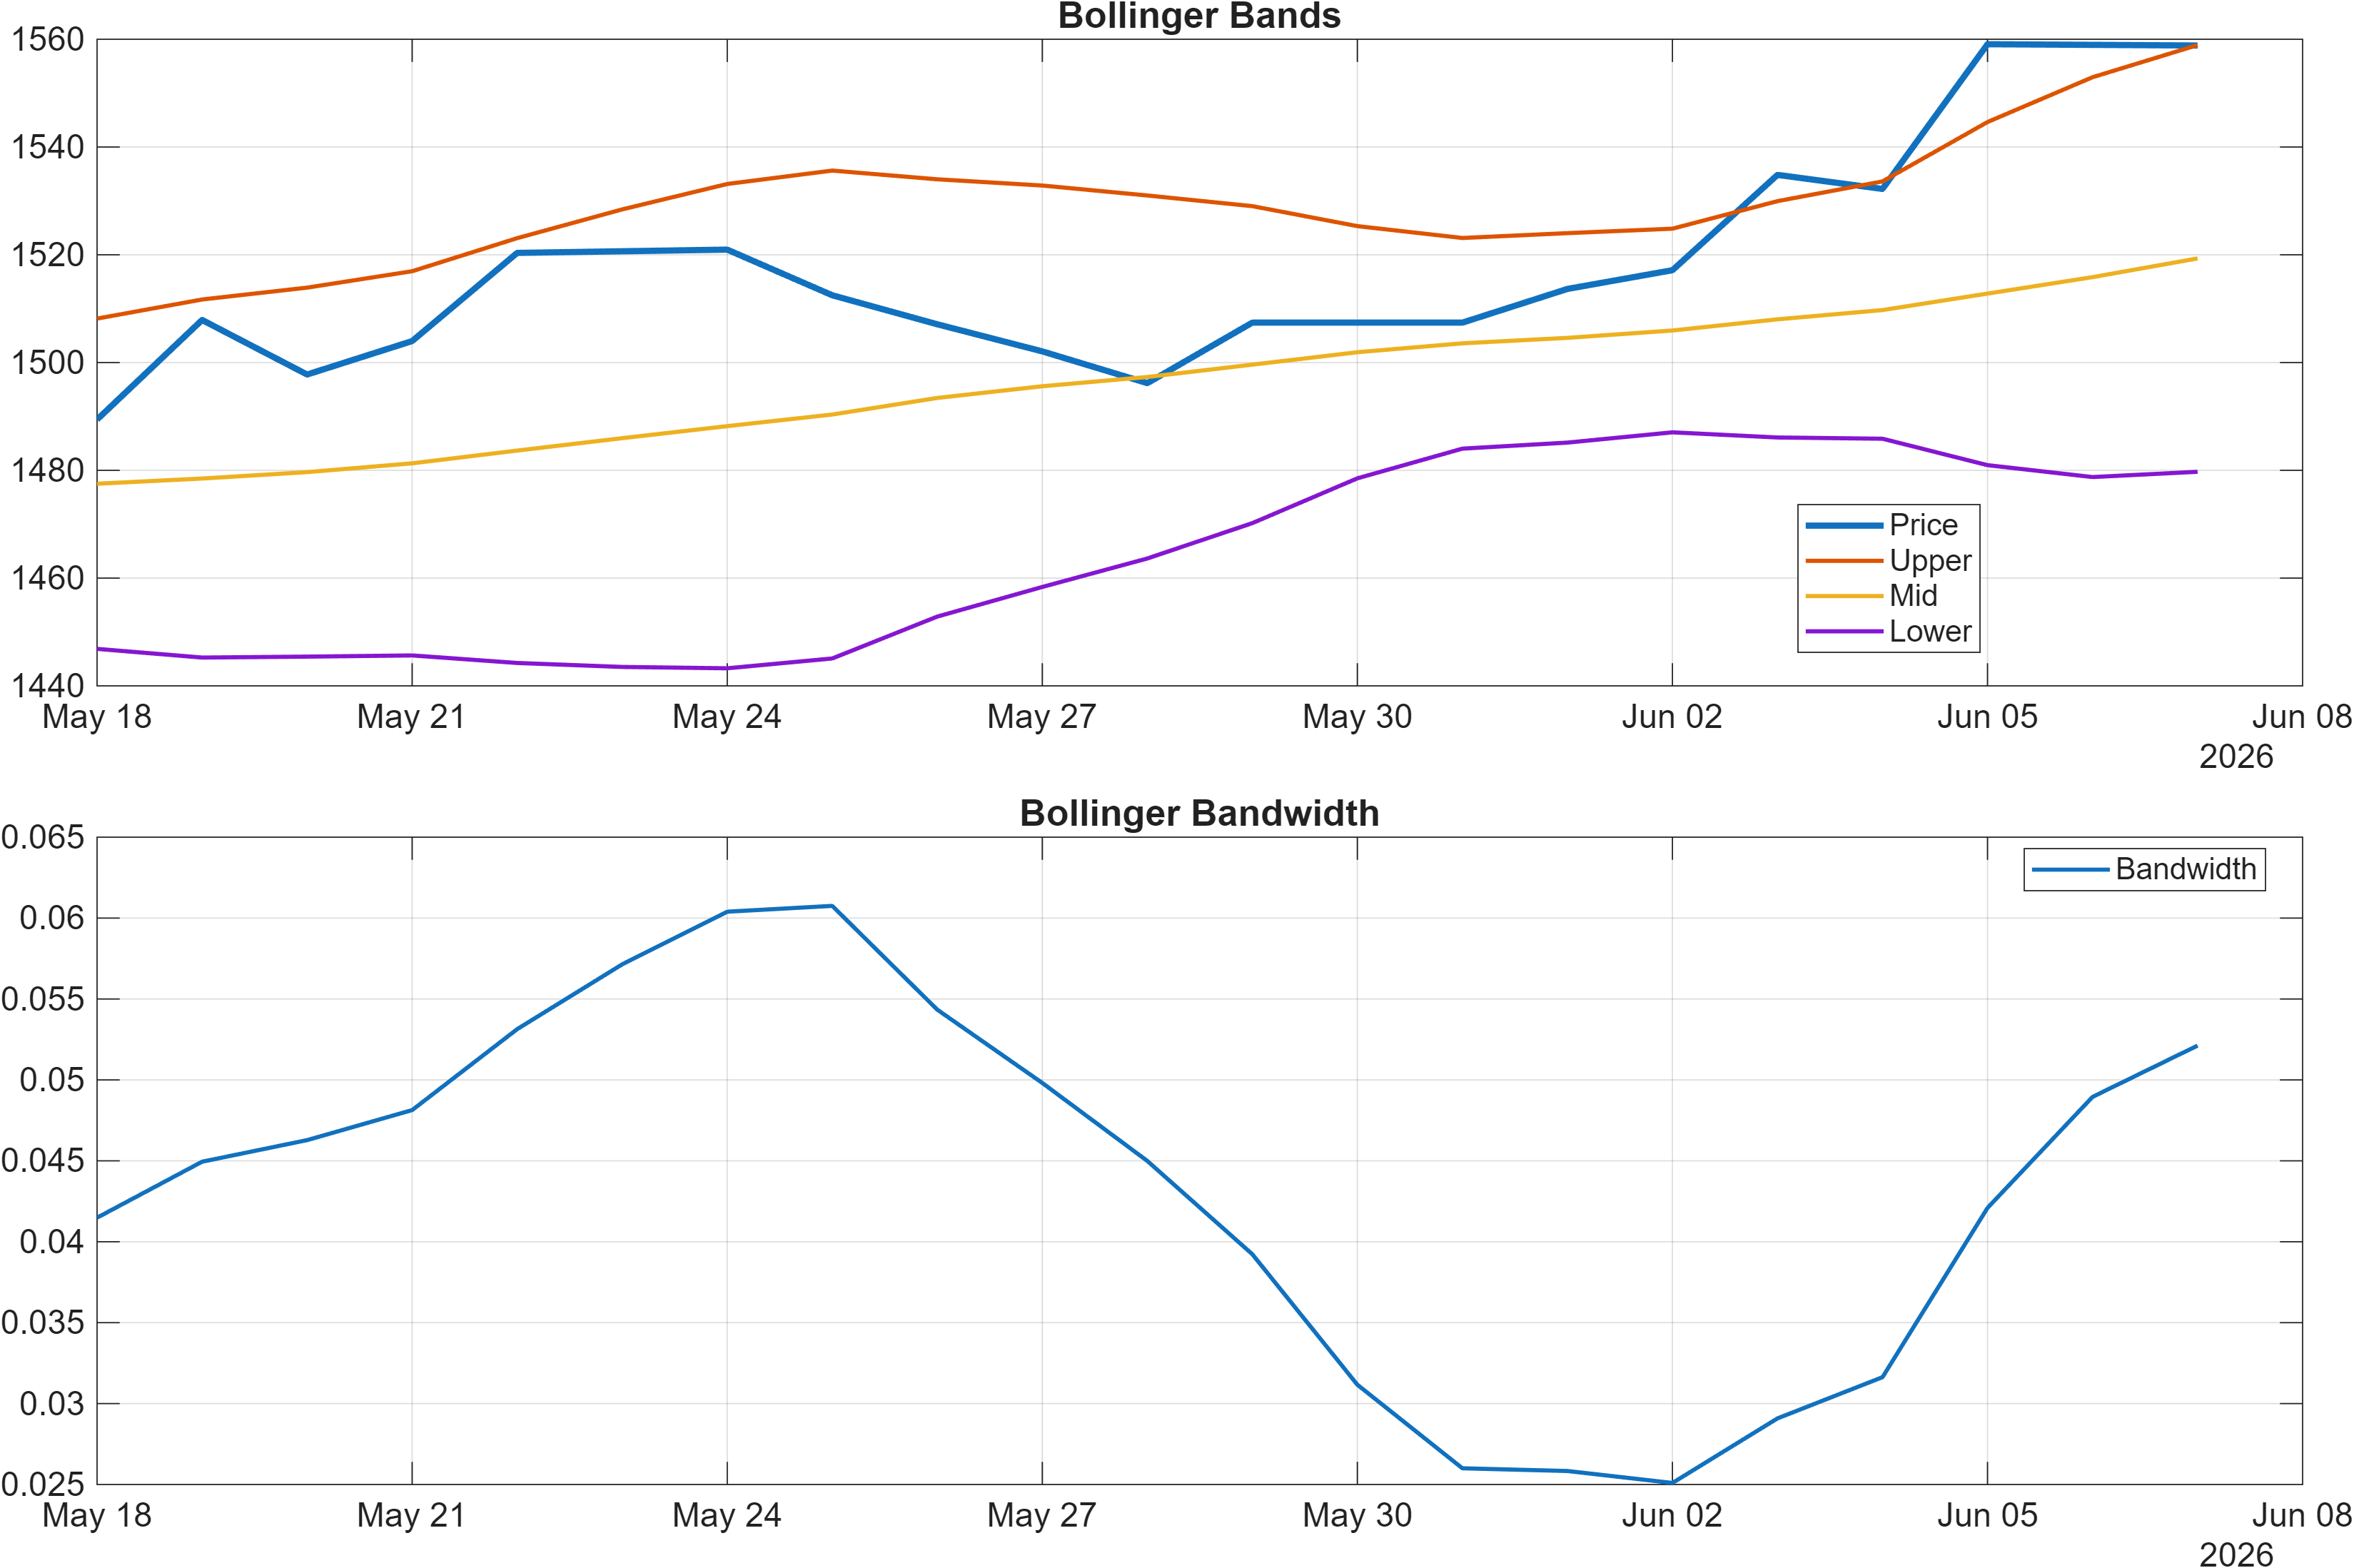
Volatility appears contained relative to typical breakout conditions, with Bollinger Bandwidth at 0.0521 (and BB Width 0.05212 shown as neutral). This tends to shift focus toward whether the market can convert directional momentum into expansion. Without that expansion, price may oscillate around resistance and support zones, producing whipsaw risks for overly tight risk frameworks.
Interpretation: RSI bias = Bullish, MACD hist = 4.7206.
Interpretation: Bandwidth (volatility regime) latest = 0.0521.
4) Support / Resistance zones
Support and resistance are cleanly defined, giving USDKRW a practical decision framework. The primary reference points are support ~1460.7975 and resistance ~1520.9600. In a bullish trend regime (close > MA50; MA50 > MA200), these zones tend to function less as “targets” and more as regime tests.
The nearer-term bullish ranks (weekly #11; monthly #29) suggest the market has been rewarded for maintaining constructive structure, but the neutral longer ranks (6-month #443; yearly #312) argue for respecting the possibility of a broader range reasserting itself. That makes 1460.7975 particularly important: acceptance below support would not just be a pullback—it would represent a shift toward the long-horizon neutrality already present in the rank profile.
On the upside, 1520.9600 is the level that must transition from “ceiling” to “accepted above” for continuation to look structurally clean. Momentum readings support that attempt (MACD histogram 4.7206; RSI 70.33), but the stretched Stoch %K at 96.5 suggests the market may need consolidation or controlled pullbacks to sustain an eventual breakout.
Volatility being neutral (Bandwidth 0.0521) also matters at these zones: breakouts without volatility expansion can fail back into range. As a result, resistance is best interpreted as an area where follow-through quality matters more than a single intraday probe.
Support ~ 1460.7975 | Resistance ~ 1520.9600
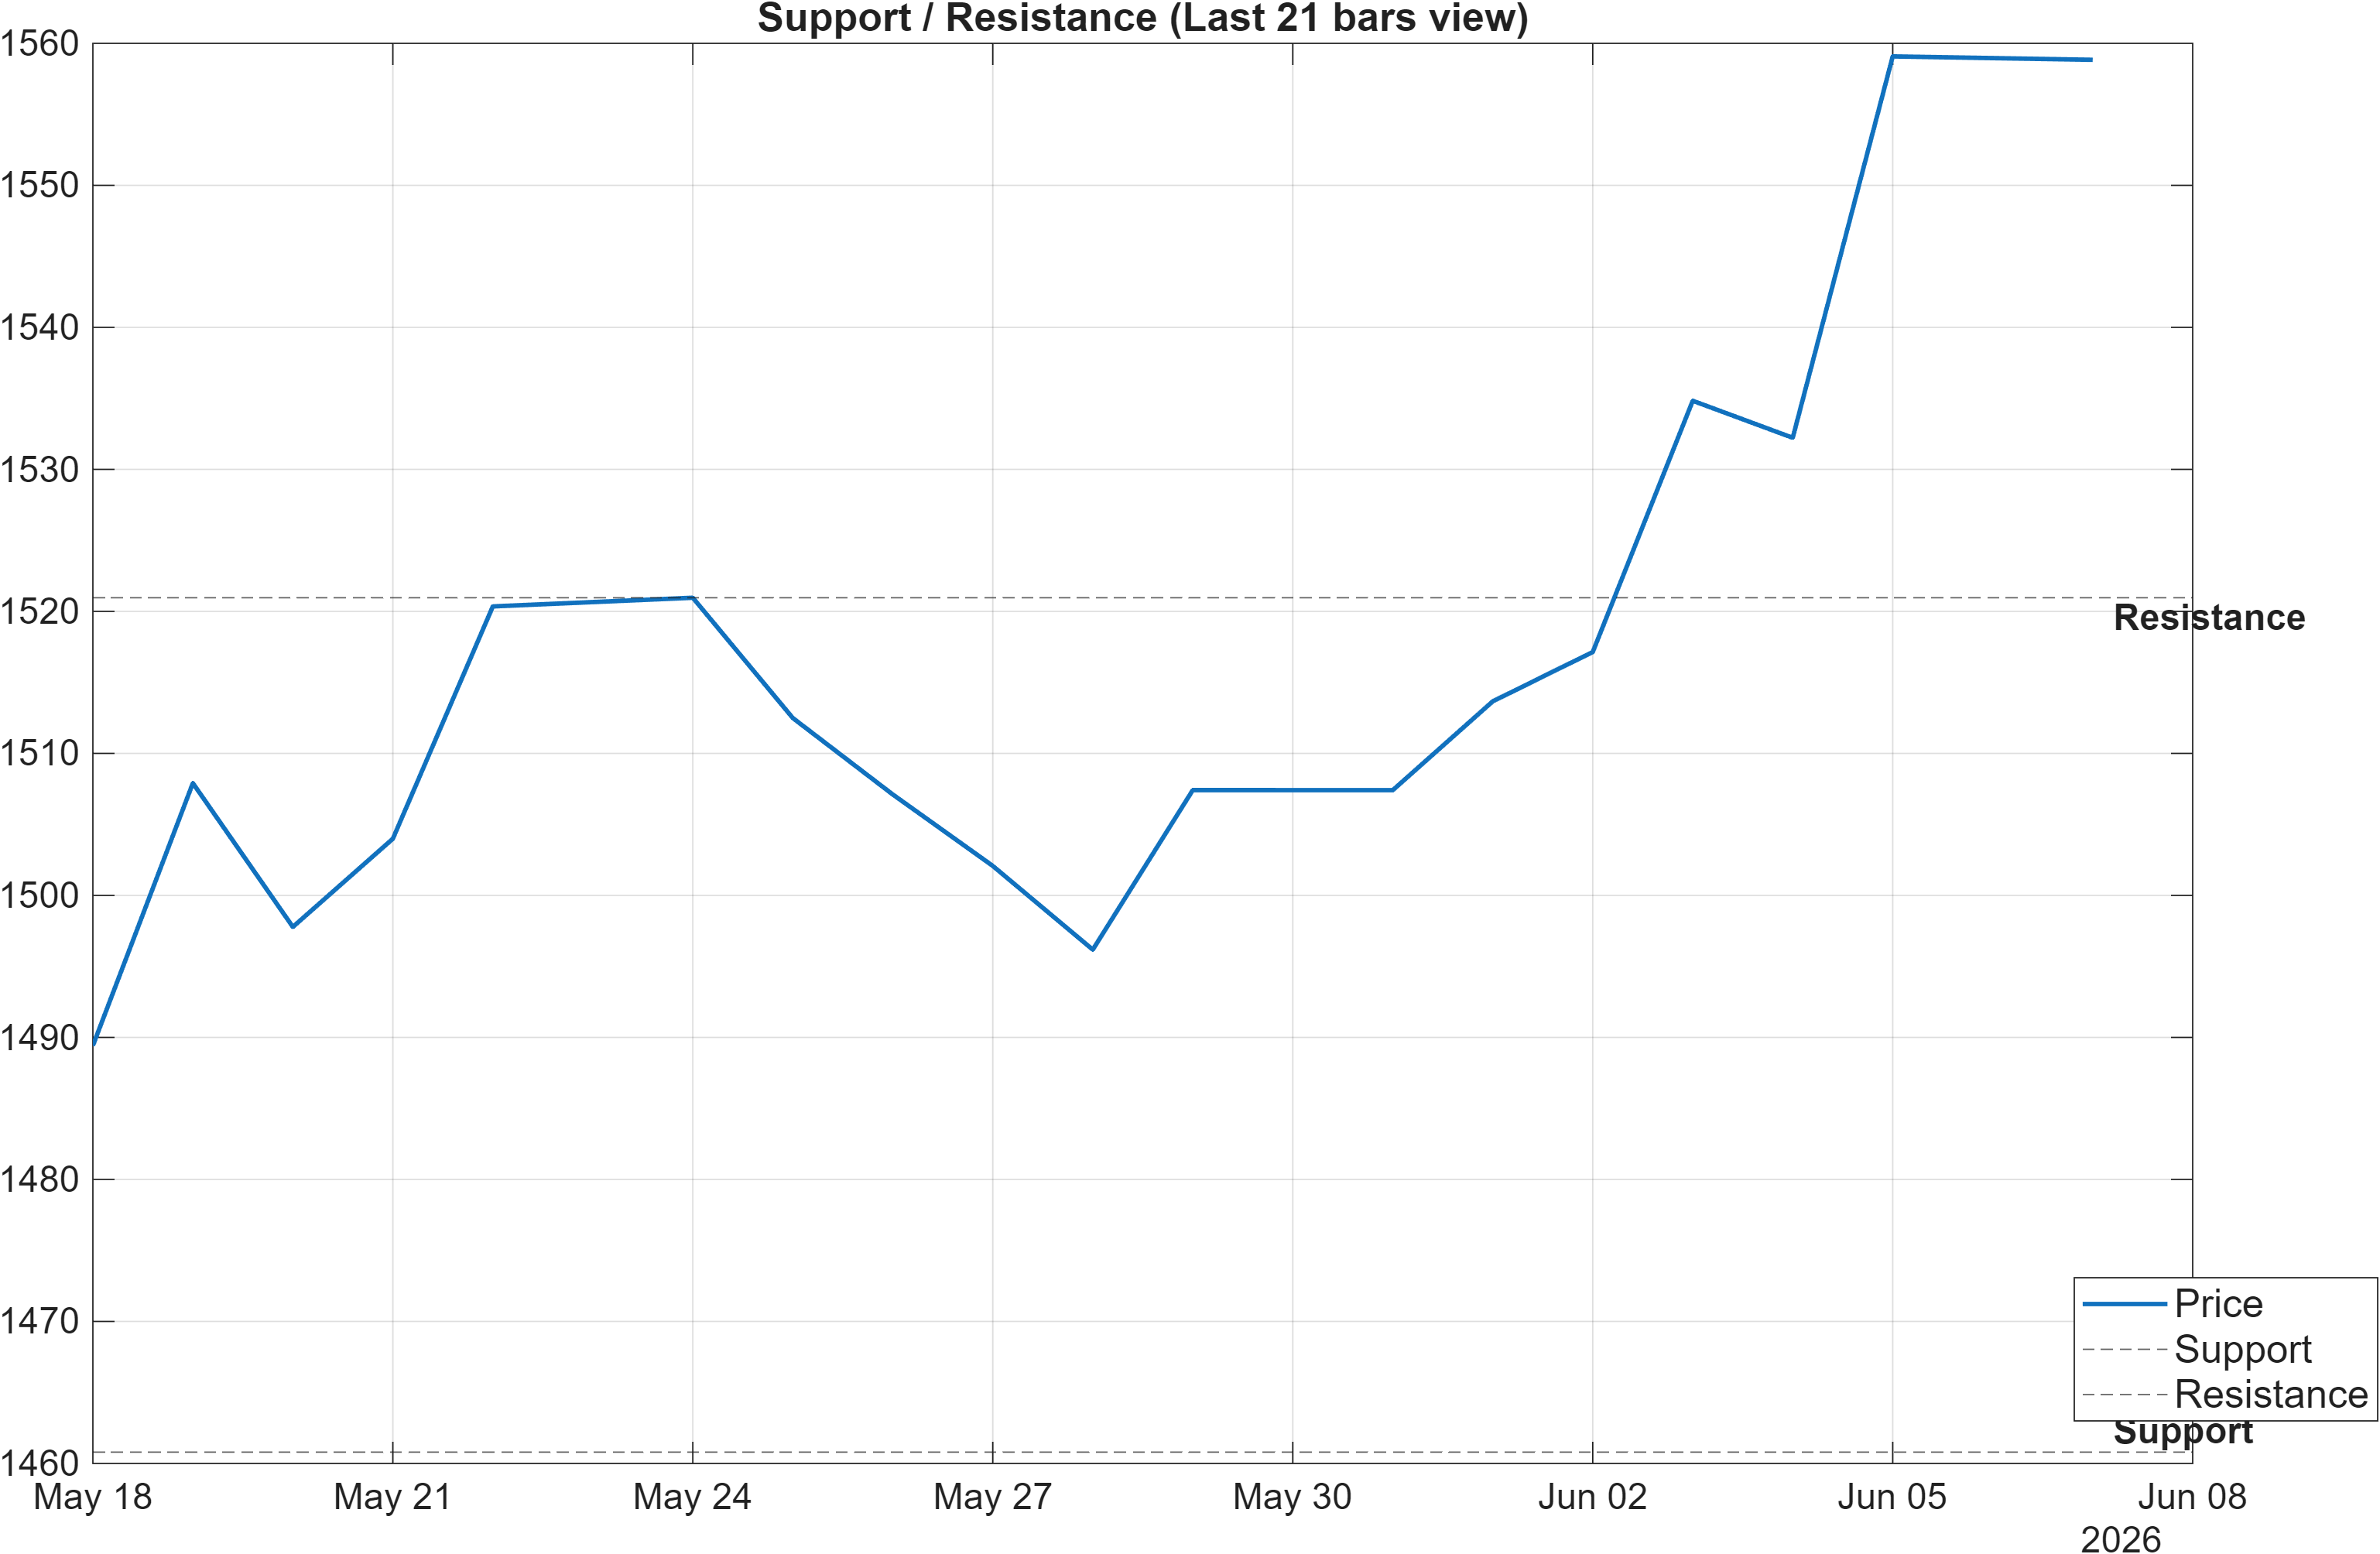
Scenario view: Break above resistance with volume → continuation. Close below support → signal deterioration risk.
5) Quant Technical Dashboard (18 Signals)
KGNAI AI Technical Analysis Score (Deep Reinforcement Learning): Rank #357 out of 963 (Rank 1 represents the strongest technical positioning and a higher probability of favorable price behavior. As ranks increase toward the maximum, the probability of favorable outcomes weakens and bearish positioning becomes more dominant.) | Label: Neutral | Score: 0.259
18-Signal Technical Confluence Score: 0.389 (Bullish)
Overall Technical Score (18-signal confluence + DRL rank blend): 0.350 (Bullish)
Note: The blended score reflects signal strength weighted against broader AI technical ranking, which may temporarily diverge.
Blended technical score breakdown: 0.350 (Bullish | Bull 9 / Bear 2 / Neutral 7)
The technical stack shows a constructive surface layer with a more cautious model-based overlay. The 18-signal confluence score of 0.389 (Bullish) and the overall blended technical score of 0.350 (Bullish) indicate that most independent indicators are aligned in a supportive direction (Bull 9 vs Bear 2). At the same time, the DRL technical rank is #357/963 with a Neutral label (score 0.259), which restrains the conclusion from being interpreted as uniformly strong across all model families.
This divergence is analytically important. When confluence is bullish while the DRL rank is neutral, it can imply that observable indicator alignment (momentum/trend signals) is positive, but the broader pattern library used by the reinforcement model sees outcomes as less consistently favorable at similar states. That often happens during late-stage momentum or when the market is approaching a level where path-dependence matters (e.g., the 1520.9600 resistance).
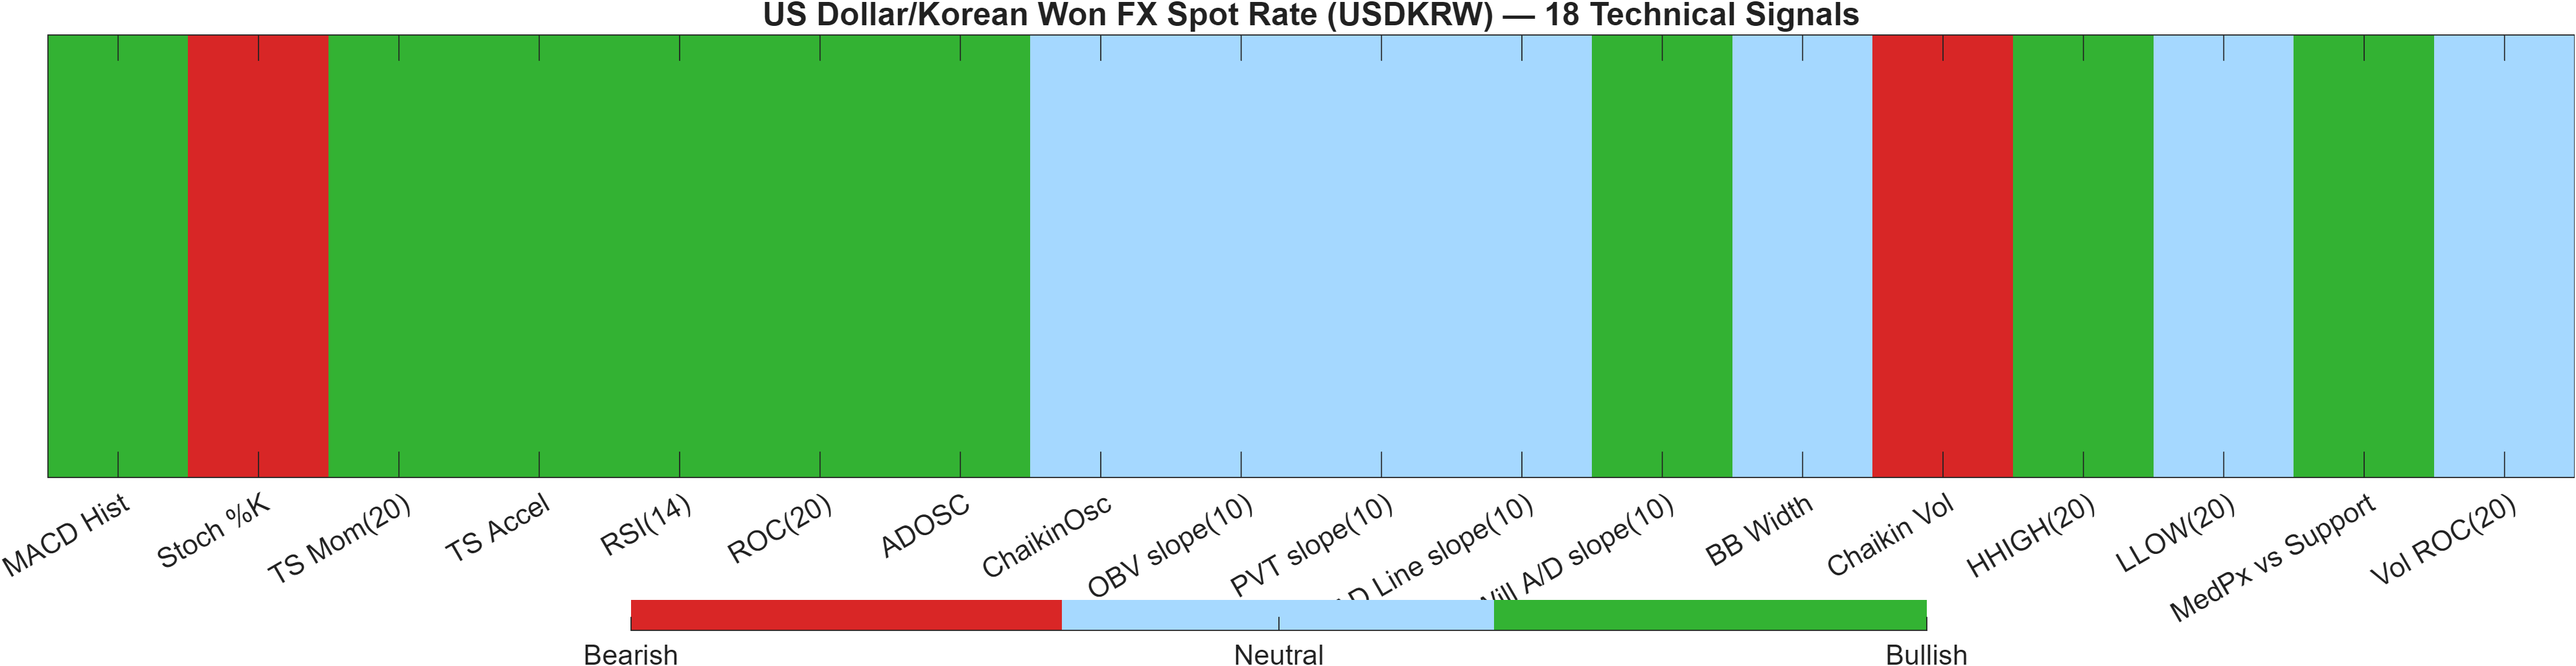
Signal table (Bull/Bear/Neutral)
| Indicator | Value | Signal |
|---|---|---|
| MACD Hist | 4.721 | Bullish |
| Stoch %K | 96.5 | Bearish |
| TS Mom(20) | 51.17 | Bullish |
| TS Accel | 17.32 | Bullish |
| RSI(14) | 70.33 | Bullish |
| ROC(20) | 3.378 | Bullish |
| ADOSC | 94.85 | Bullish |
| ChaikinOsc | 0 | Neutral |
| OBV slope(10) | 0 | Neutral |
| PVT slope(10) | 0 | Neutral |
| AD Line slope(10) | 0 | Neutral |
| Will A/D slope(10) | 74.64 | Bullish |
| BB Width | 0.05212 | Neutral |
| Chaikin Vol | 37.83 | Bearish |
| HHIGH(20) | 1562 | Bullish |
| LLOW(20) | 1488 | Neutral |
| MedPx vs Support | 85.8 | Bullish |
| Vol ROC(20) | — | Neutral |
Within the signal set, the bullish case is carried by trend/momentum confirmation (RSI 70.33; MACD Hist 4.721; ROC(20) 3.378) and by structure-adjacent measures such as HHIGH(20) at 1562 and MedPx vs Support at 85.8. The primary internal cautions are Stoch %K 96.5 and Chaikin Vol 37.83, which together suggest the market may be vulnerable to sharper pullbacks even if the broader trend remains intact.
Interpretation: Indicator-level signals form the base confluence, which is then adjusted using a separate AI-driven technical ranking model. The final technical score summarizes this combined view.
6) News sentiment + extractive gist
Note: Instrument-specific news matches were not found, so the digest includes broader market/sector headlines. Links are provided for verification.
Sentiment score (avg): 0.130 | Positive: 44% | Neutral: 44% | Negative: 12%
KGNAI AI News Sentiment Score (normalized -1 to +1): 0.15 (as of 2025-08-27) | Label: Neutral | Overall news score: 0.09
Positive Developments
Recent coverage across major financial outlets indicates a modestly constructive tone in the macro backdrop that typically feeds into USD-leaning flows and rate-sensitive FX dynamics. The sentiment mix shows 44% positive versus 12% negative, consistent with a neutral-to-slightly-positive bias rather than a strongly directional narrative. Market commentary has highlighted pockets of resilience in employment-related data and related cross-asset repricing, which can support USD demand when yields reprice higher. From a USDKRW perspective, this backdrop can be consistent with the report’s technical posture—short-/mid-term ranks are bullish (weekly #11, monthly #29) and momentum indicators remain supportive (MACD histogram 4.7206). The key analytical point is not causality, but compatibility: a mildly constructive macro tone does not conflict with the current trend structure.
Neutral / Mixed Developments
The news set remains largely informational and cross-market, reflecting the note that instrument-specific matches were not available in the provided data. That typically reduces the probability of a single idiosyncratic catalyst driving USDKRW and increases the relevance of technical levels such as 1460.7975 and 1520.9600. With the KGNAI news label at Neutral (normalized score 0.15; overall news score 0.09), the more practical read-through is that price is likely to be guided by rate expectations, broad USD positioning, and risk appetite—variables that can shift quickly without producing sustained sentiment extremes in the dataset.
Negative / Risk Signals
Risk signals in the coverage revolve around the potential for abrupt shifts in rate expectations, cross-asset volatility, and “risk-off” episodes—factors that can tighten liquidity and increase gap risk in FX. Even with a neutral aggregate label, the presence of negative items (the 12% negative share) is relevant because USDKRW currently shows some late-stage momentum traits: RSI(14) at 70.33 and Stoch %K at 96.5 (bearish) can be consistent with conditions where bad news has more price impact than good news. In addition, volatility is not yet in expansion mode (Bandwidth 0.0521), which can raise the odds of failed break attempts near resistance. For risk management, the most direct “stress test” remains a loss of 1460.7975, which would align with the longer-horizon neutrality in ranks (6-month #443, yearly #312).
- Whether price can accept above 1520.9600 while volatility expands beyond the current 0.0521 bandwidth regime.
- Any momentum cooling signal where RSI(14) 70.33 rolls over while the market remains capped under resistance.
- Downside regime check: reaction if price closes below 1460.7975.
Sources referenced: Reuters, Bloomberg, Yahoo Finance, MarketWatch, Investing.com
Snapshot: AI Rank (Short–Mid–Long): Mixed (Bullish tilt) (Bullish–Bullish–Neutral) · Technical Confluence: Bullish · Key Levels: Support ~1460.80 | Resistance ~1520.96 · News Sentiment: Neutral
7) Sources
- Philippine Peso: BSP tightening path supports PHP – UOB — https://www.fxstreet.com/news/philippine-peso-bsp-tightening-path-supports-php-uob-202606052122
- New Zealand Dollar plunges to two-month lows after upbeat US NFP report — https://www.fxstreet.com/news/new-zealand-dollar-plunges-to-two-month-lows-after-upbeat-us-nfp-report-202606052044
- South Korean Won: Semiconductor pullback weighs on KRW – DBS — https://www.fxstreet.com/news/south-korean-won-semiconductor-pullback-weighs-on-krw-dbs-202606052041
- Silver Price Forecast: XAG crashes toward 200-day SMA, eyes $61.00 — https://www.fxstreet.com/news/silver-price-forecast-xag-crashes-towards-200-day-sma-eyes-on-6100-202606052008
- Philippines: BSP seen staying hawkish on inflation – Standard Chartered — https://www.fxstreet.com/news/philippines-bsp-seen-staying-hawkish-on-inflation-standard-chartered-202606052002
- Indonesia: Policy focus on stability as BI mandate widens – DBS — https://www.fxstreet.com/news/indonesia-policy-focus-on-stability-as-bi-mandate-widens-dbs-202606051924
- Forecasting the upcoming week: US Dollar ends week higher after strong NFP — https://www.fxstreet.com/news/forecasting-the-upcoming-week-us-dollar-ends-week-higher-after-strong-nfp-202606051921
- Thai Baht: BoT seen holding rates as inflation stays supply-led – UOB — https://www.fxstreet.com/news/thai-baht-bot-seen-holding-rates-as-inflation-stays-supply-led-uob-202606051843
You may also like: How KGNAI AI ranks instruments across global markets
Disclaimer: KGNAI provides AI-generated analytics and educational market commentary only. This is not financial advice. Markets involve risk. Always do your own research.