RON/GBP (RONGBP) — Consolidation Phase Continues | 05-Jun-2026 Neutral Technical Stance
RON/GBP (RONGBP) is currently characterized by neutral cross-sectional ranks alongside a mixed technical profile that leans slightly defensive on trend and momentum. Across a 949-instrument FOREX universe, the short-, mid-, and long-horizon ranks cluster near the middle of the distribution, implying neither persistent leadership nor clear relative weakness. On the chart, price vs MA50 is bearish and MA50 vs MA200 is bearish, which frames the consolidation as occurring under a softer trend backdrop rather than a clean uptrend. Momentum gauges also show friction: RSI(14) at 36.84 aligns with a bearish bias, while the MACD histogram near 0.0000 suggests fading directional impulse rather than acceleration. Volatility remains contained with Bollinger Bandwidth at 0.0228, making nearby structural levels more relevant: support ~0.1642 and resistance ~0.1711. News sentiment is broadly neutral, offering limited directional catalyst in the provided dataset.
- Rank stance (Short / Mid / Long): Neutral / Neutral / Neutral within a 949-instrument universe.
- Technical confluence label: Neutral (18-signal score -0.056; blended technical score -0.140).
- Key levels: Support ~0.1642 | Resistance ~0.1711.
- News sentiment bias: Neutral (avg 0.018; 19% positive / 69% neutral / 12% negative).
- Confirmation / invalidation condition: A sustained move above 0.1711 supports upside continuation behavior; a close below 0.1642 increases deterioration risk per the scenario framework.
KGNAI evaluates assets using large cross-sectional datasets built from millions of structured data points. Inputs incorporate fundamental metrics, technical structures, and systematically processed news sentiment. Statistical models, machine learning, and AI frameworks are used to assess relative positioning, signal alignment, and probabilistic behavior across broad universes.
- Ranks are comparative across the tracked universe, not absolute price targets.
- Confluence reflects alignment among independent signal groups.
- Support/resistance levels are probabilistic decision zones, not guarantees.
- Sentiment provides contextual bias within the broader analytical framework.
1) KGNAI AI Analysis
Region: FOREX
Total universe size: 949 ranked instruments
- Daily rank: #553 out of 949 — Neutral
- Weekly rank: #587 out of 949 — Neutral
- Monthly rank: #620 out of 949 — Neutral
- 3-Monthly rank: #481 out of 949 — Neutral
- 6-Monthly rank: #547 out of 949 — Neutral
- Yearly rank: #522 out of 949 — Neutral
The rank profile for RONGBP is centered in the distribution across horizons, with daily (#553), weekly (#587), and monthly (#620) readings all residing in the mid-pack of the 949-instrument set. This clustering typically aligns with range-like behavior or a market state where signals are not dominating on a relative basis. Notably, the 3-month rank (#481) is somewhat stronger than the monthly reading, a mild sign that medium-horizon behavior has not deteriorated in lockstep with shorter windows; however, the yearly rank (#522) remains consistent with a neutral long-horizon profile rather than a sustained relative trend.
The most actionable implication of a neutral rank stack is selectivity: when ranks do not sit in the upper quartile or top decile, directional conviction usually depends more on technical structure (trend + momentum + volatility regime) and less on cross-sectional “tailwind.” In that context, the technical sections become the primary lens for assessing whether the current consolidation is forming a base, drifting lower, or simply compressing ahead of a volatility re-pricing.
Term view remains Neutral (Short-term: Neutral; Mid-term: Neutral; Long-term: Neutral), consistent with the rank dispersion being modest rather than extreme.
Want the full universe and complete rank tables? Unlock full access on KGNAI: https://www.kgnai.com/pricing
2) Price & trend overview
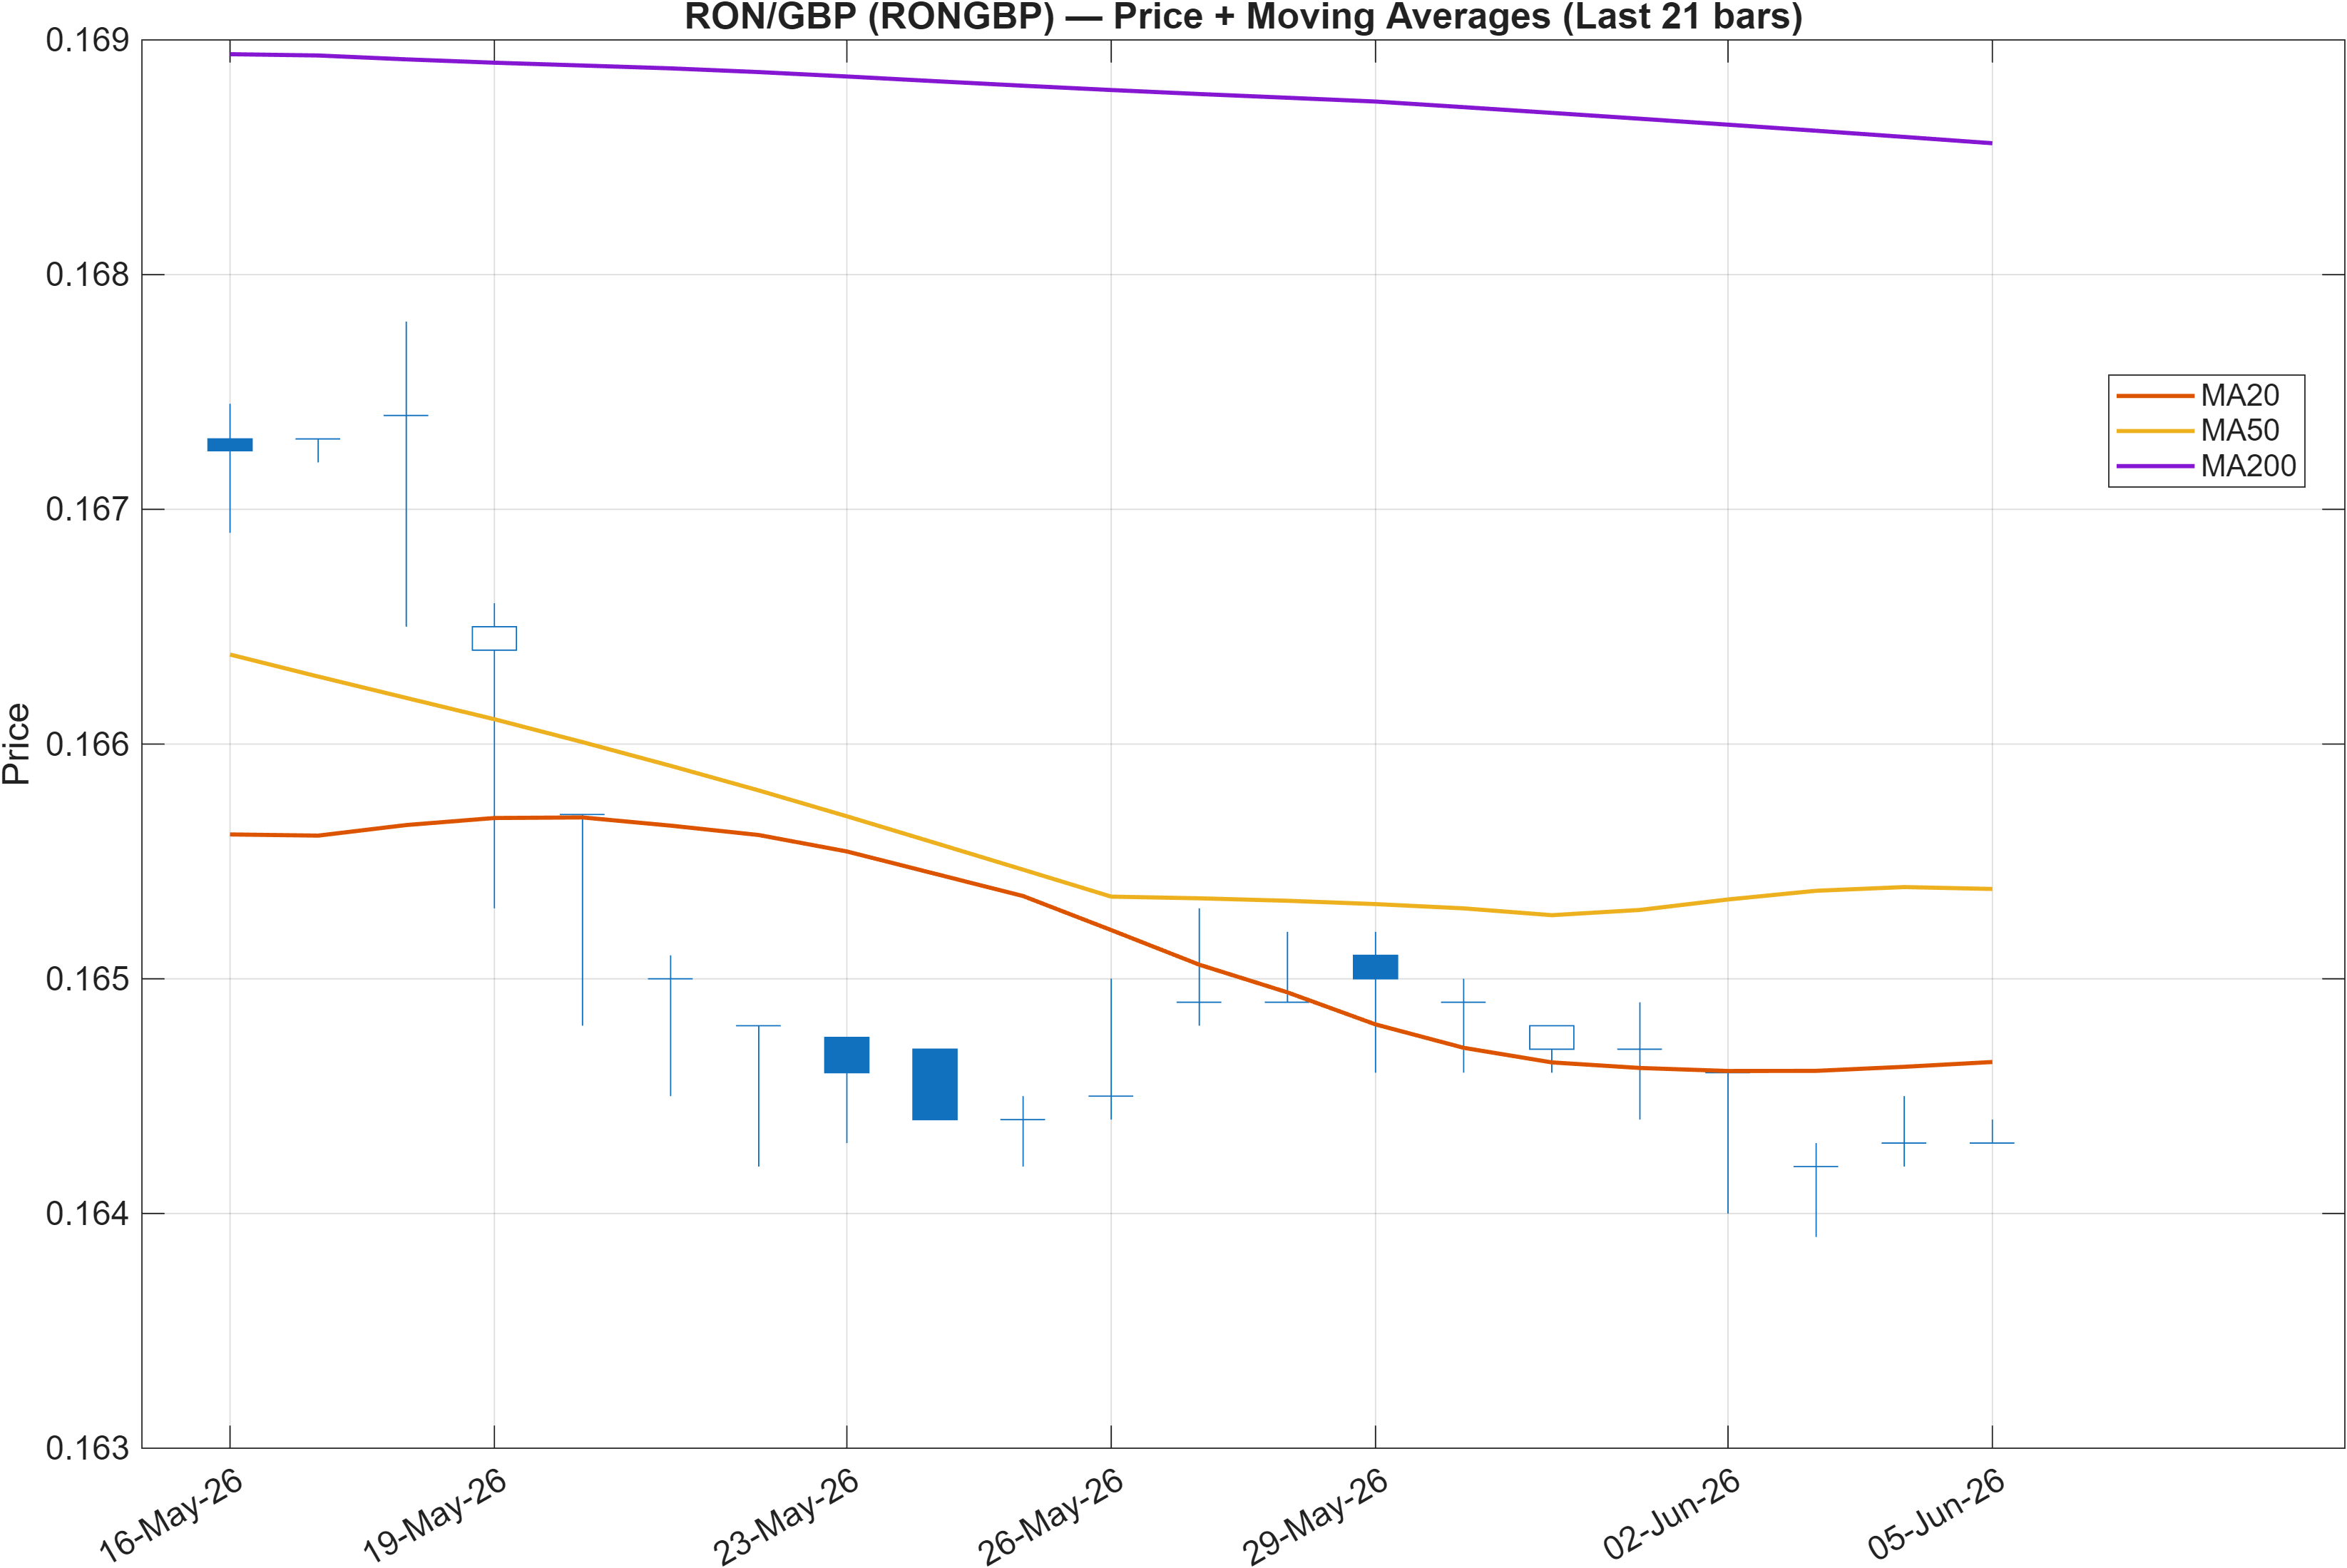
Trend diagnostics place RON/GBP in a defensive consolidation rather than a confirmed recovery. The interpretation flags Close vs MA50 as Bearish and MA50 vs MA200 as Bearish. When both relationships lean bearish, rallies often behave more like mean-reversion toward moving averages than sustained trend expansion—unless momentum rotates materially.
This matters because the surrounding framework is not reinforced by strong cross-sectional ranks: the daily rank (#553) and weekly rank (#587) are neutral, so there is limited evidence (in the provided data) of persistent relative strength pushing price away from its consolidation boundaries. In practical trading terms, the trend layer is currently better used to define risk boundaries than to justify trend-following exposure.
The nearby structural levels (support ~0.1642, resistance ~0.1711) provide a clean map for validating whether consolidation resolves into continuation or deterioration. Under a bearish MA stack, a move into resistance can meet supply faster, while breaks of support can become self-reinforcing if momentum fails to stabilize. The next sections (RSI/MACD and volatility) help determine whether the market is building the conditions to challenge resistance or remain capped by the prevailing trend structure.
Interpretation: Close vs MA50 = Bearish, MA50 vs MA200 = Bearish.
3) Momentum & volatility dashboard
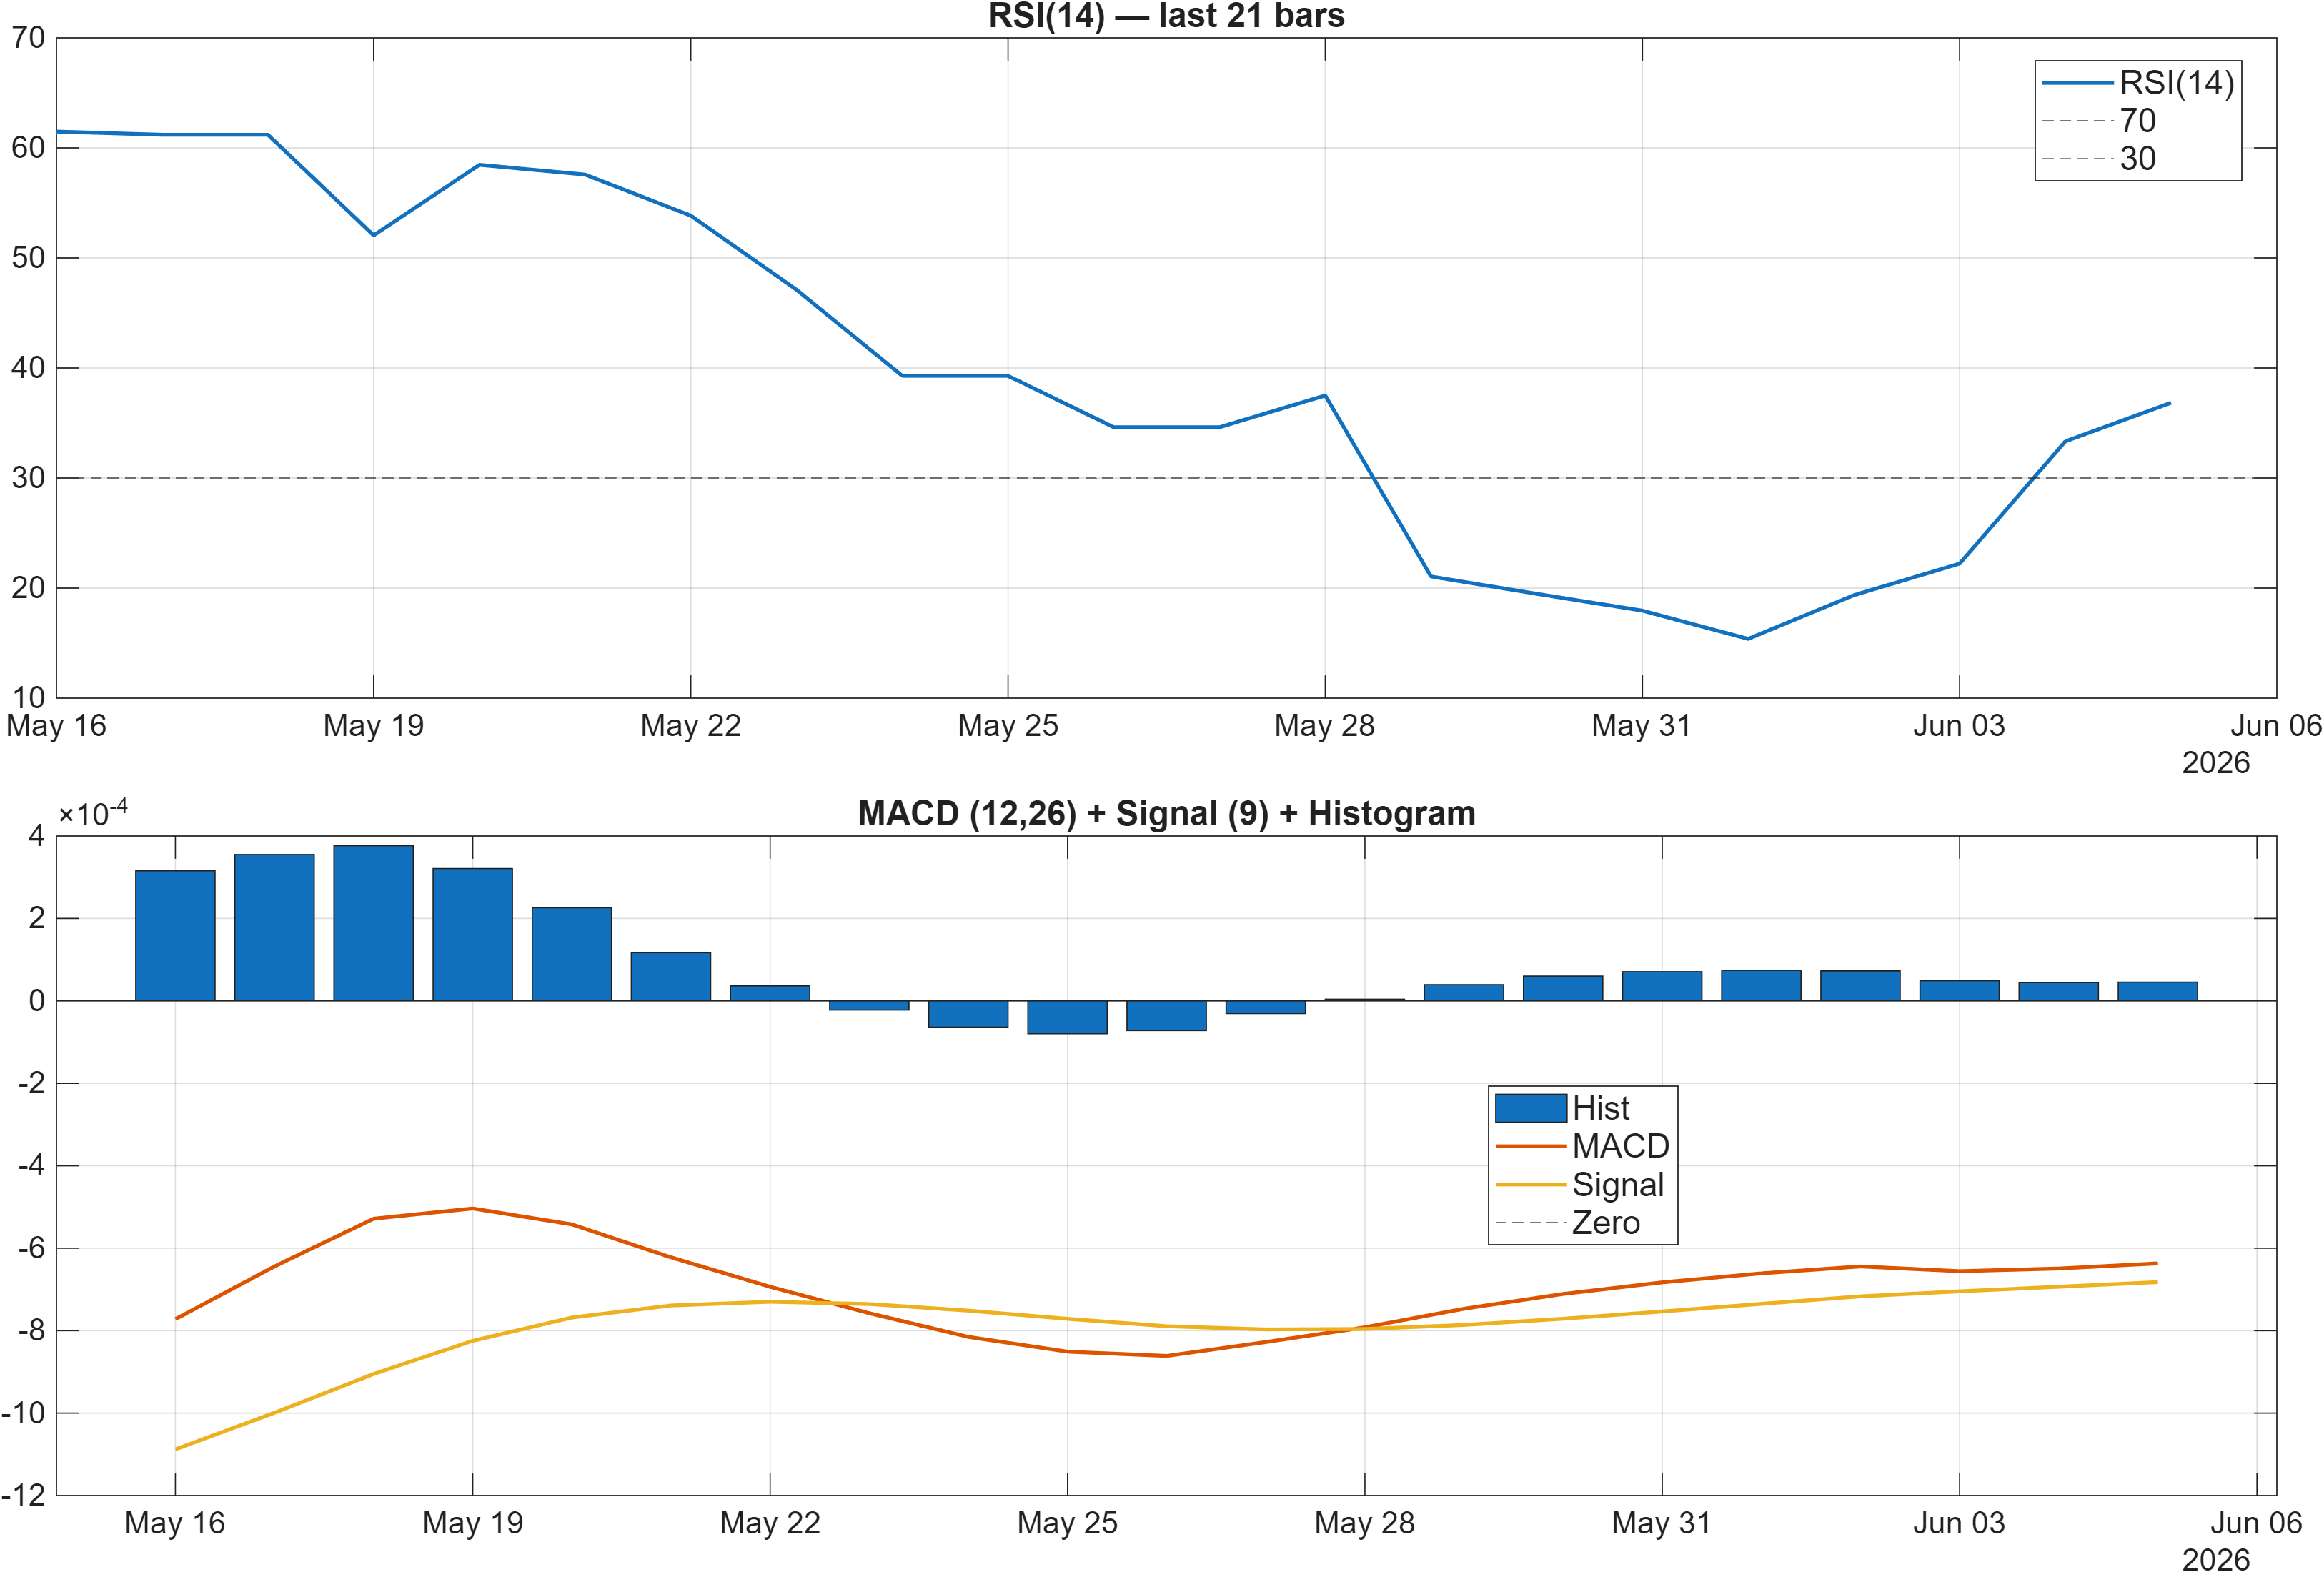
Momentum indicators suggest downside bias without strong acceleration. The interpretation assigns RSI bias = Bearish, consistent with RSI(14) at 36.84 in the signal dashboard. That level is not an extreme washout by itself, but it does sit in the lower zone that often coincides with softer price behavior unless a reversal pattern develops.
At the same time, the MACD histogram is 0.0000 in the interpretation panel (and 4.538e-05 in the signal table, labeled Bullish). Taken together, that combination can be read as compression: downside momentum (RSI) persists, but incremental impulse (MACD histogram) is hovering near flat, implying the market may be transitioning from directional push to range stabilization. This is a typical signature during consolidations that form beneath declining moving averages.
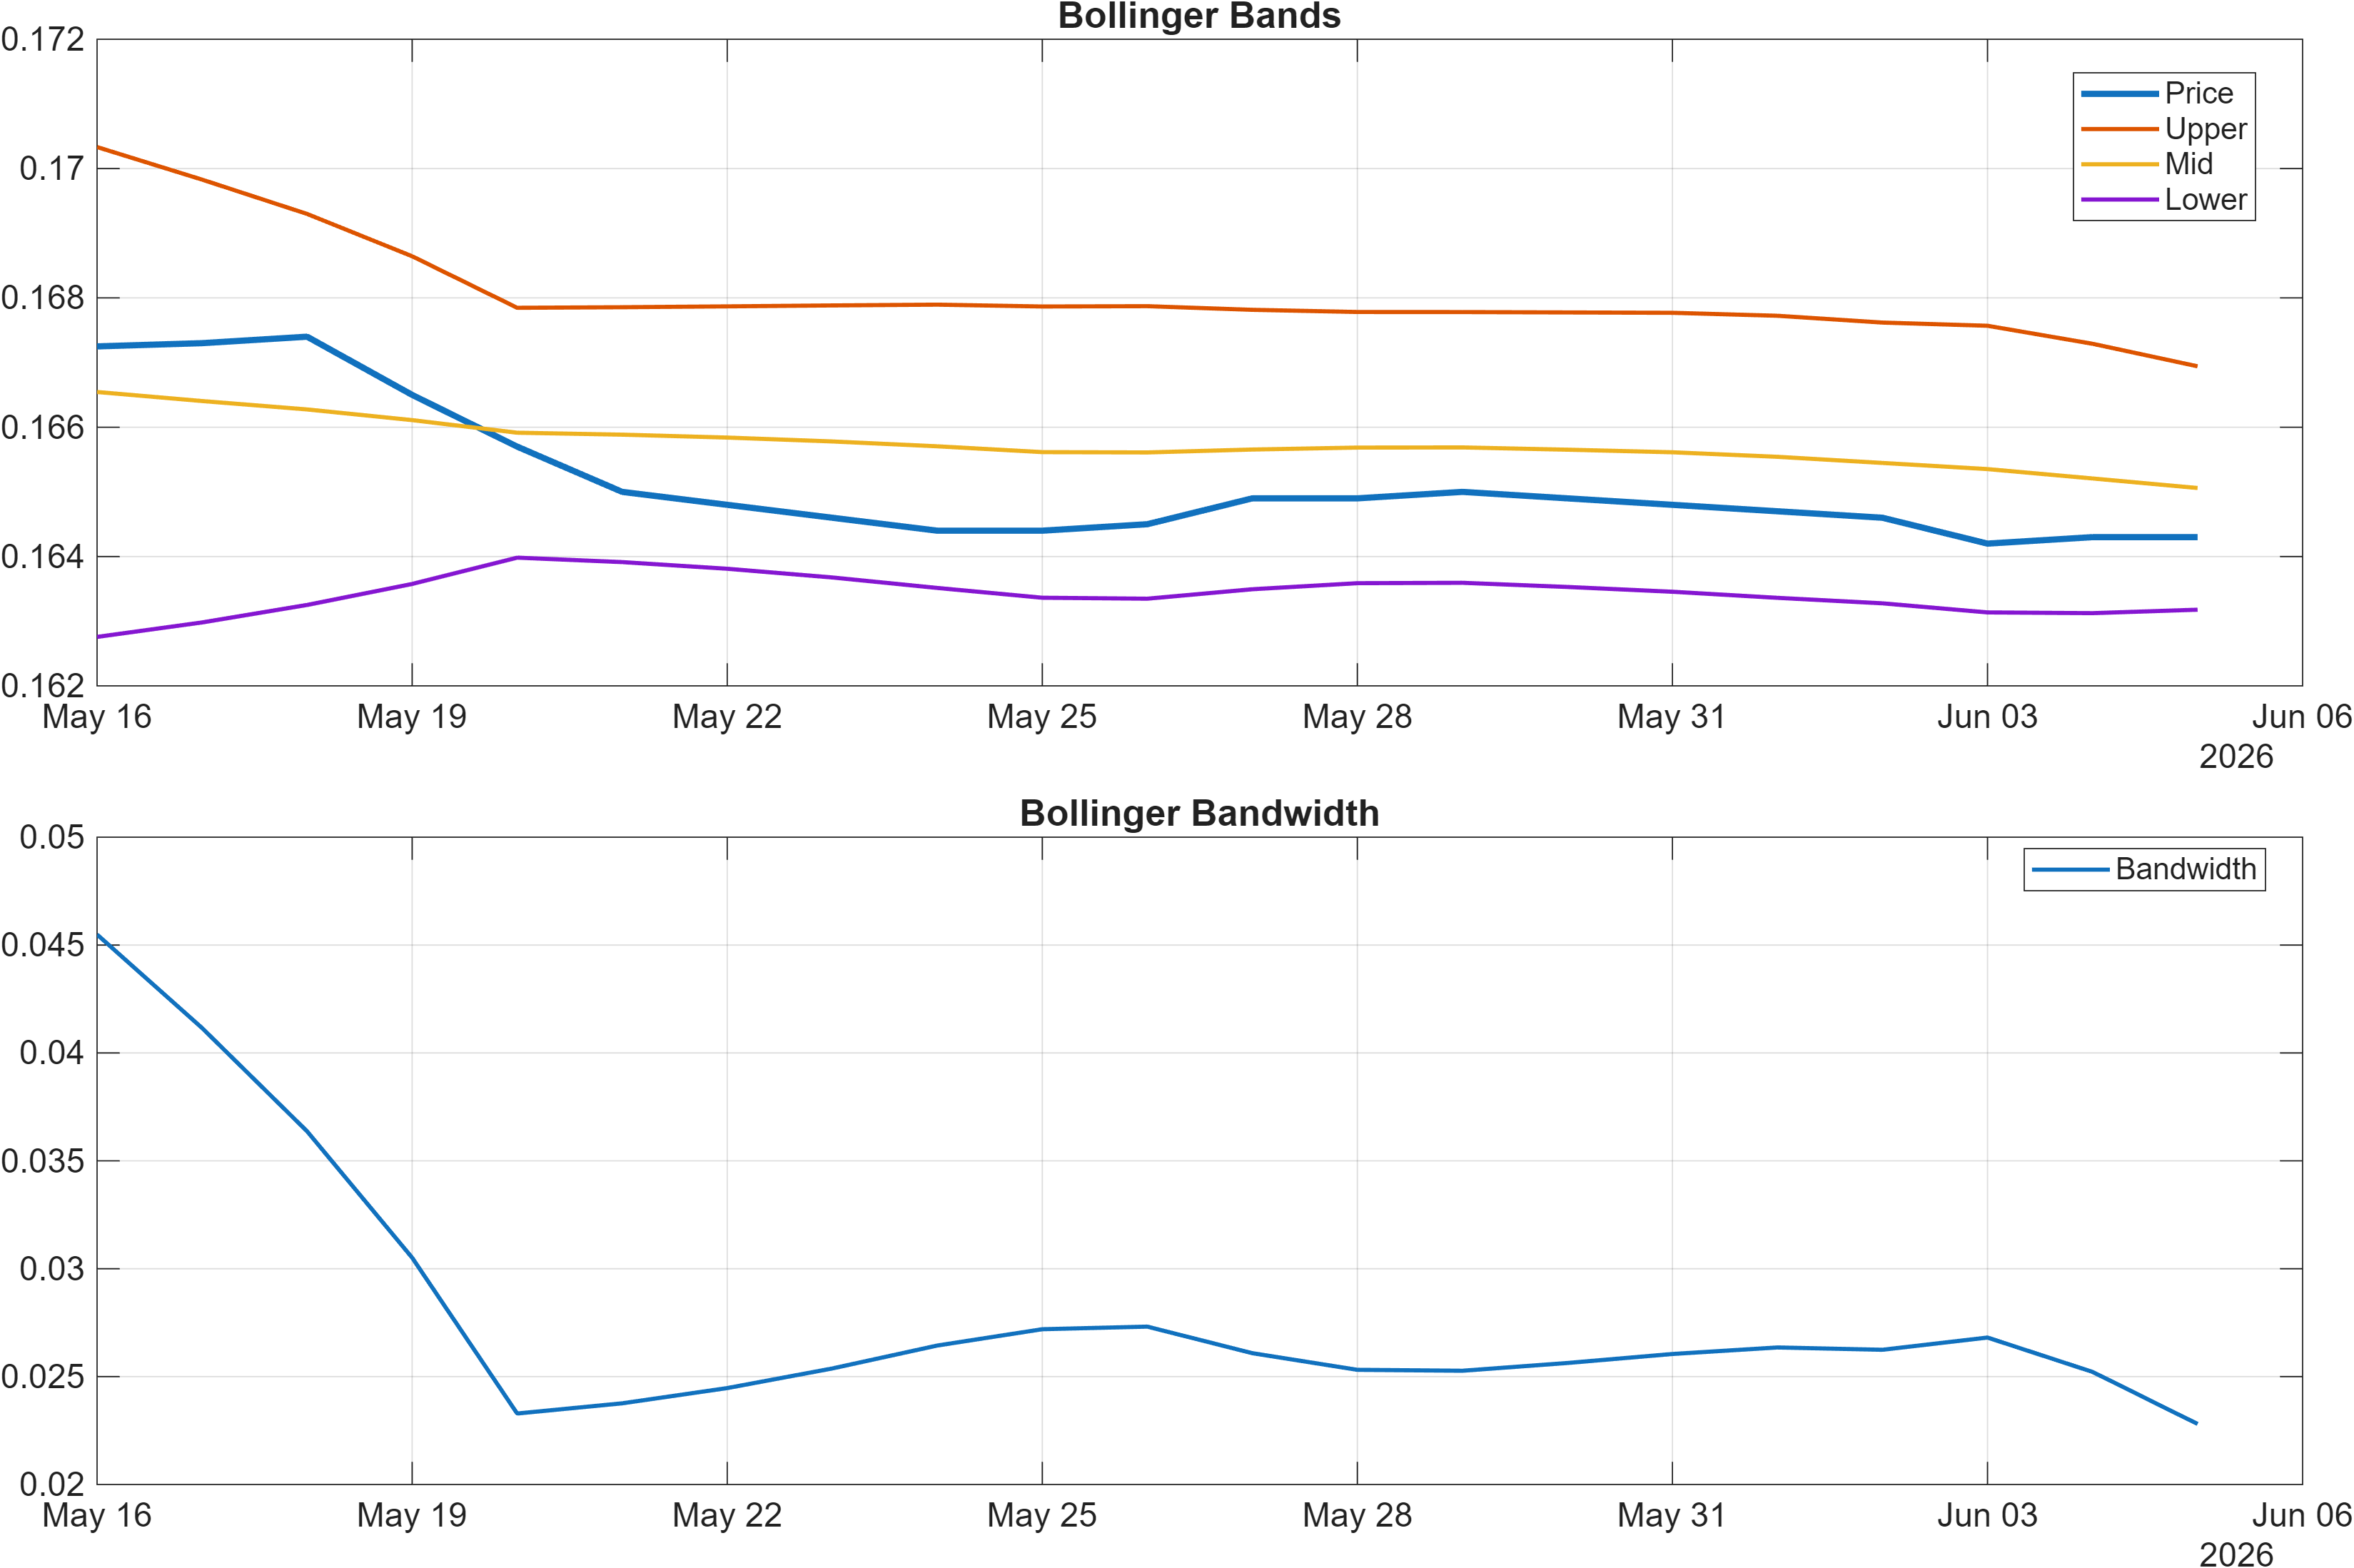
Volatility conditions reinforce the consolidation thesis. Bollinger Bandwidth at 0.0228 (0.02281 in the signal table) points to a relatively contained regime, where breakouts—if they occur—tend to be more sensitive to level validation. With volatility not expanding, false breaks are a meaningful risk, and confirmation tends to come from follow-through behavior rather than a single candle event.
Interpretation: RSI bias = Bearish, MACD hist = 0.0000.
Interpretation: Bandwidth (volatility regime) latest = 0.0228.
4) Support / Resistance zones
Support ~ 0.1642 | Resistance ~ 0.1711
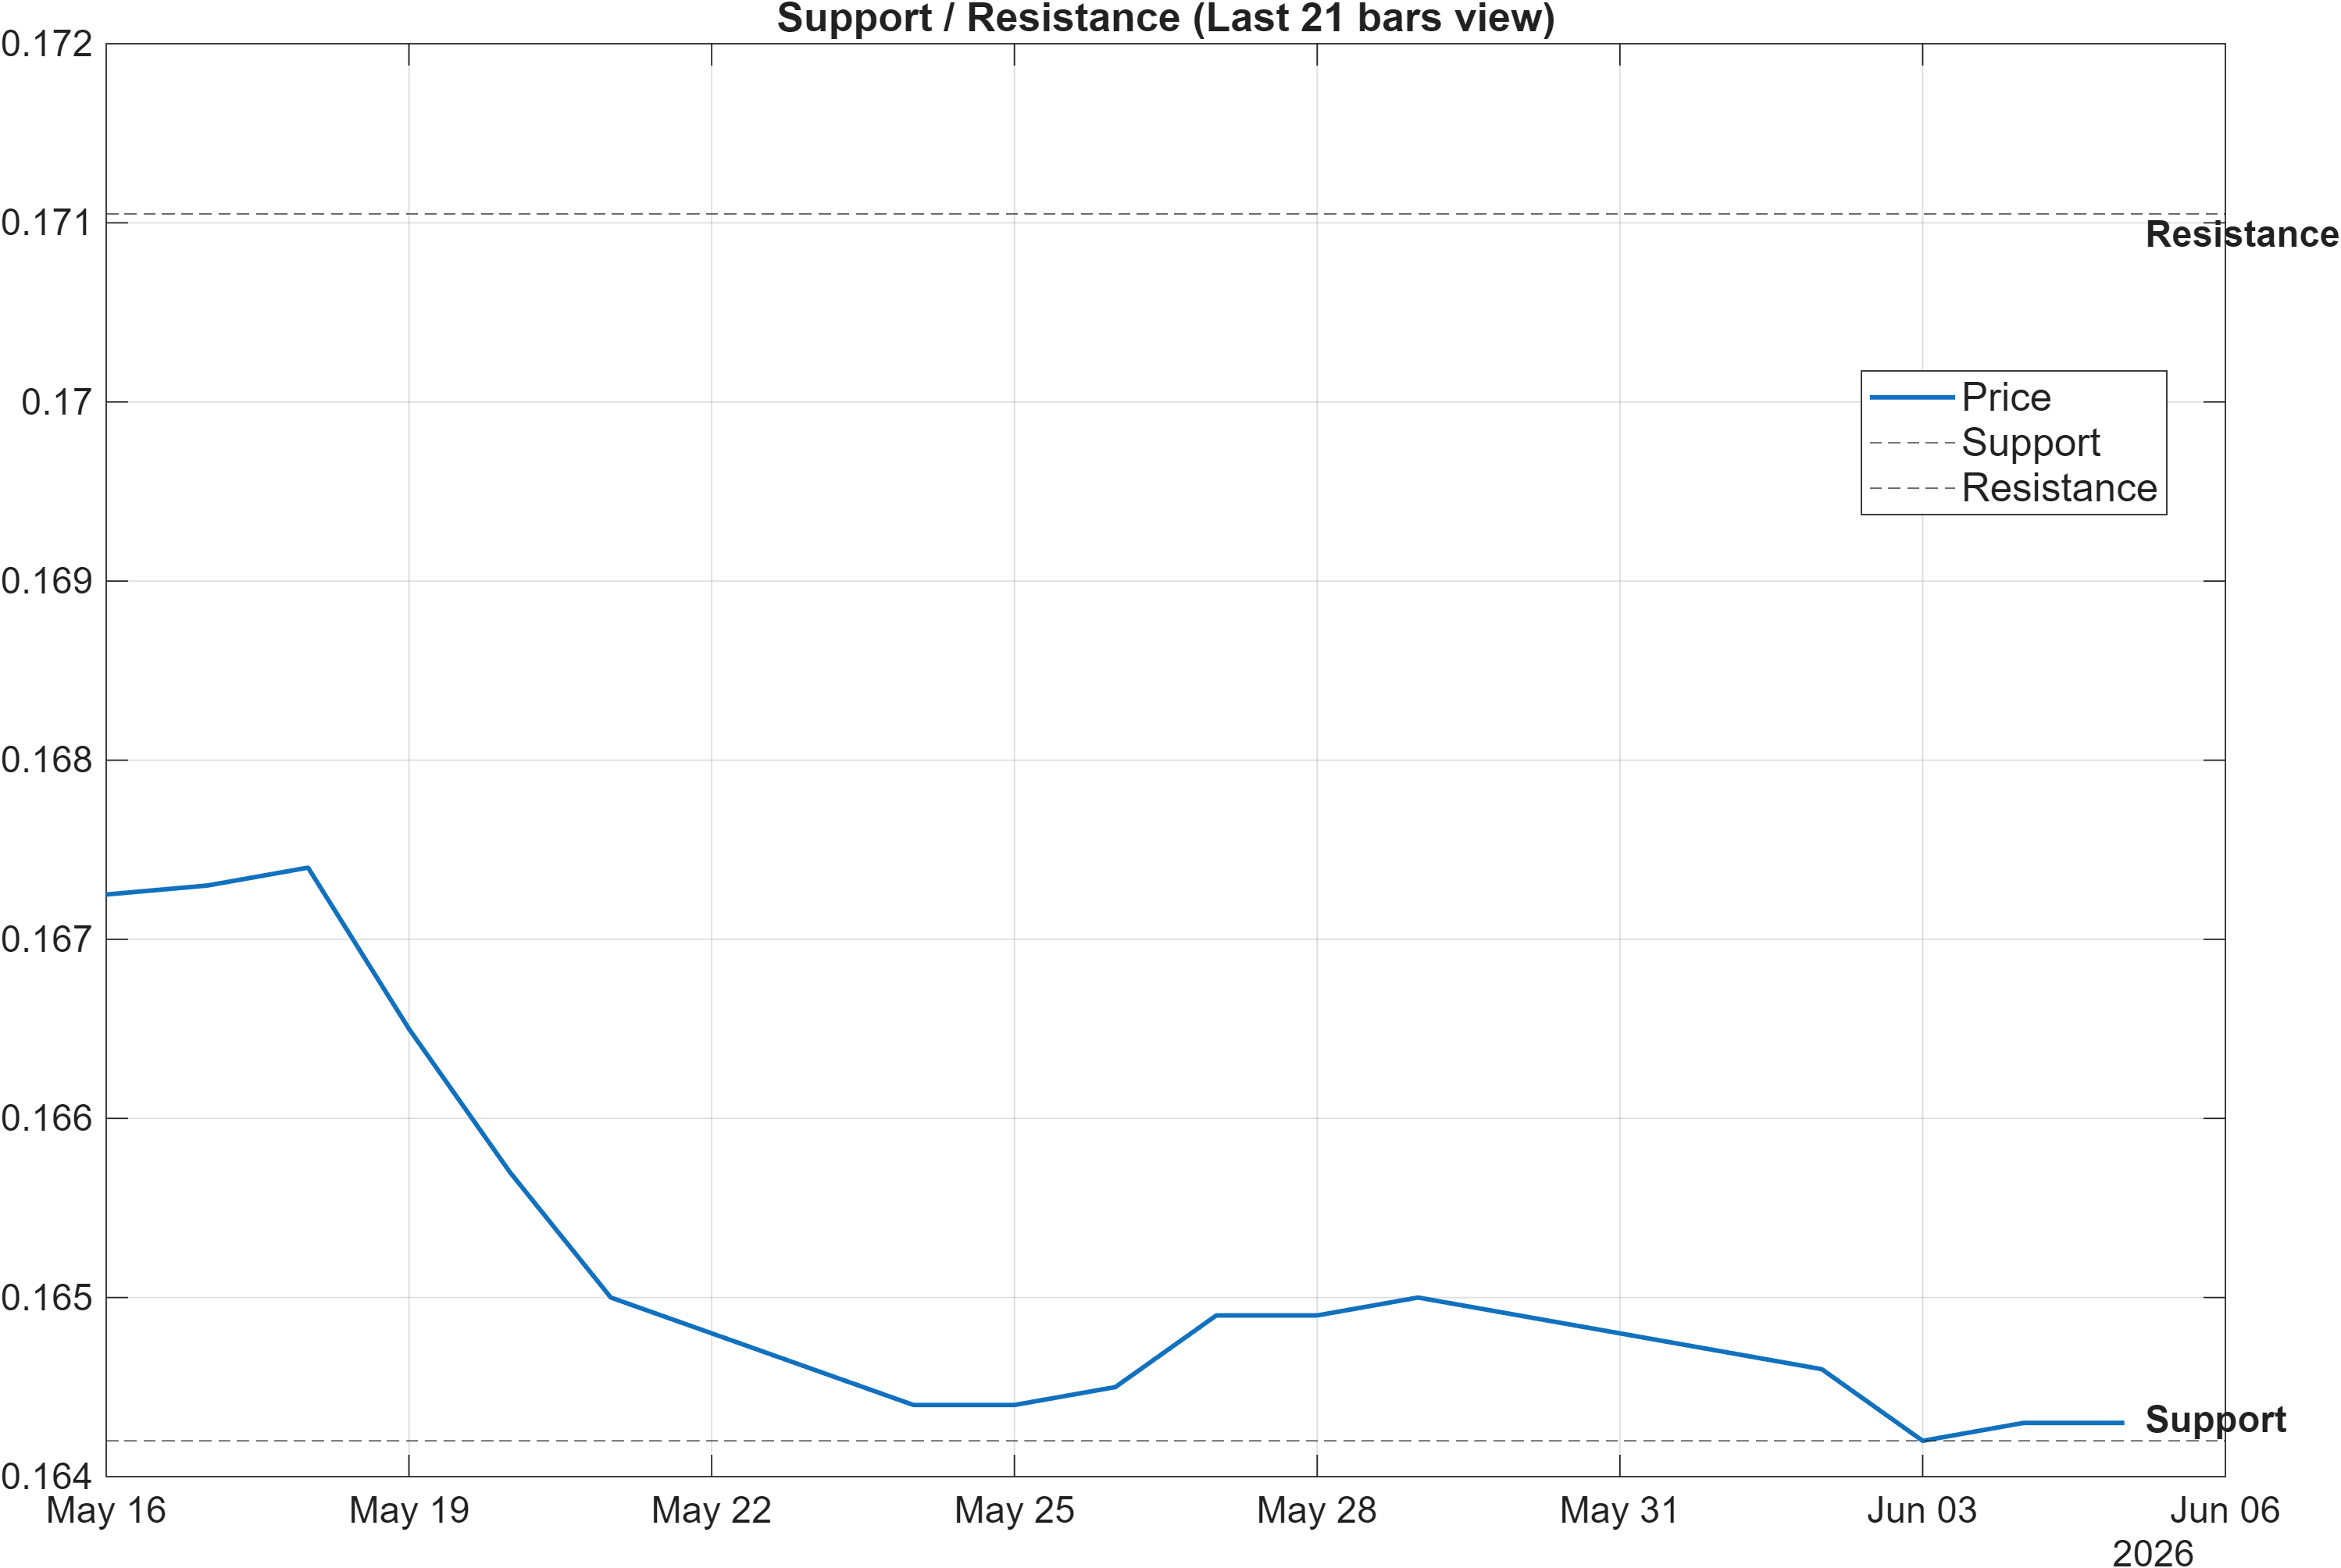
With ranks neutral and volatility contained (bandwidth 0.0228), the 0.1642–0.1711 band becomes the central decision structure. In consolidations, support and resistance are less about “targets” and more about regime identification: holding above support implies ongoing range stability; losing support shifts the market into a deterioration state where mean-reversion attempts can fail quickly.
The signal table adds useful context to why this zone matters. The 20-period low marker LLOW(20) at 0.1639 sits very close to the stated support (~0.1642), increasing the probability that this area is being referenced by multiple participants and systematic rules. On the upper side, HHIGH(20) at 0.1678 sits below the stated resistance (~0.1711), suggesting the market may need a volatility pickup to reach and meaningfully test the higher boundary rather than repeatedly stalling at nearer swing highs.
The scenario framing provided is appropriately conditional: break above resistance supports continuation behavior, while a close below support raises deterioration risk. In a bearish moving-average configuration, the burden of proof for upside continuation is typically higher—often requiring momentum to rotate away from the current RSI bearish bias (36.84) while price holds above the prior range ceiling rather than falling back inside it.
Scenario view: Break above resistance with volume → continuation. Close below support → signal deterioration risk.
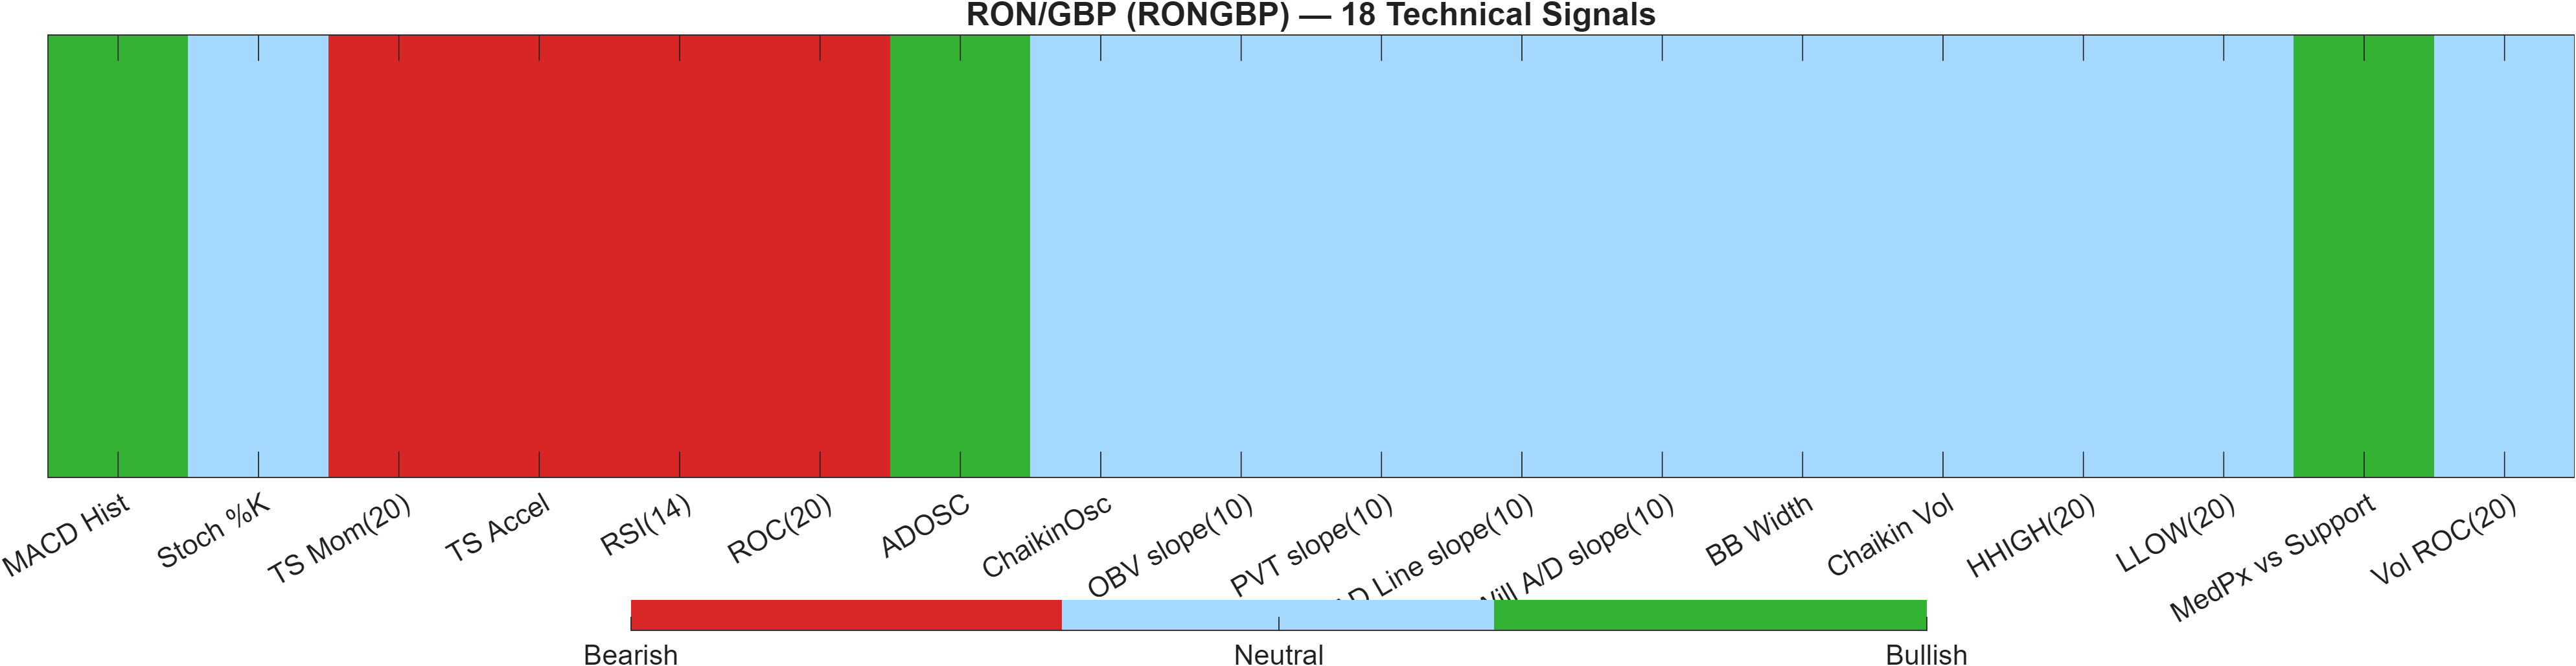
5) Quant Technical Dashboard (18 Signals)
KGNAI AI Technical Analysis Score (Deep Reinforcement Learning): Rank #634 out of 949 (Rank 1 represents the strongest technical positioning and a higher probability of favorable price behavior. As ranks increase toward the maximum, the probability of favorable outcomes weakens and bearish positioning becomes more dominant.) | Label: Neutral | Score: -0.336
18-Signal Technical Confluence Score: -0.056 (Neutral)
Overall Technical Score (18-signal confluence + DRL rank blend): -0.140 (Neutral)
Note: The blended score reflects signal strength weighted against broader AI technical ranking, which may temporarily diverge.
Blended technical score breakdown: -0.140 (Neutral | Bull 3 / Bear 4 / Neutral 11)
Signal-level alignment vs divergence
The technical dashboard is best read as a neutral blend with localized bearish pressure. The 18-signal confluence is -0.056 (Neutral), while the blended overall score is -0.140 (Neutral). The deep reinforcement learning technical rank at #634 out of 949 (score -0.336) sits in the weaker half of the universe, indicating that the broader technical pattern is not being scored as particularly constructive even if select indicators are improving.
Internally, the mix (Bull 3 / Bear 4 / Neutral 11) indicates a market where most indicators are non-committal, consistent with the low-volatility consolidation regime flagged by BB Width 0.02281. The bearish cluster is concentrated in momentum/velocity measures—RSI(14) 36.84, ROC(20) -1.793, and TS Mom(20) -0.003—which aligns with the bearish moving-average interpretation in the trend section. Conversely, the dashboard still records some constructive elements (e.g., MACD Hist 4.538e-05 and ADOSC 50 as Bullish), consistent with the idea that downside momentum may be stalling rather than accelerating.
This is a classic divergence setup: trend and momentum remain soft, while a subset of impulse/flow indicators stops worsening. In such conditions, confirmation usually requires the market to reclaim higher structure (approaching 0.1711) while RSI exits its current bearish bias zone; absent that, the neutral majority can quickly tilt bearish if support near 0.1642 is lost.
Signal table (Bull/Bear/Neutral)
| Indicator | Value | Signal |
|---|---|---|
| MACD Hist | 4.538e-05 | Bullish |
| Stoch %K | 28.57 | Neutral |
| TS Mom(20) | -0.003 | Bearish |
| TS Accel | -0.0003 | Bearish |
| RSI(14) | 36.84 | Bearish |
| ROC(20) | -1.793 | Bearish |
| ADOSC | 50 | Bullish |
| ChaikinOsc | 0 | Neutral |
| OBV slope(10) | 0 | Neutral |
| PVT slope(10) | 0 | Neutral |
| AD Line slope(10) | 0 | Neutral |
| Will A/D slope(10) | 0 | Neutral |
| BB Width | 0.02281 | Neutral |
| Chaikin Vol | -34.32 | Neutral |
| HHIGH(20) | 0.1678 | Neutral |
| LLOW(20) | 0.1639 | Neutral |
| MedPx vs Support | 0.00015 | Bullish |
| Vol ROC(20) | — | Neutral |
Interpretation: Indicator-level signals form the base confluence, which is then adjusted using a separate AI-driven technical ranking model. The final technical score summarizes this combined view.
6) News sentiment + extractive gist
Note: Instrument-specific news matches were not found, so the digest includes broader market/sector headlines. Links are provided for verification.
Sentiment score (avg): 0.018 | Positive: 19% | Neutral: 69% | Negative: 12%
KGNAI AI News Sentiment Score (normalized -1 to +1): Not available (as of —) | Label: Not available | Overall news score: 0.02
Positive Developments
Recent coverage across major financial outlets indicates a mildly constructive macro backdrop for risk appetite at times, with market narratives periodically leaning toward de-escalation expectations in geopolitics and stabilization in broader asset pricing. For FX markets, the most relevant supportive element is the suggestion that some risk-sensitive assets have remained resilient despite episodic stress, which can reduce immediate demand for defensive positioning. In addition, references to central-bank signaling in major economies—while not instrument-specific—can influence cross-currency volatility and short-term flows, particularly when rate expectations appear to firm. Within the KGNAI context, this constructive tone aligns with the news distribution being dominated by neutral content (69%) and only a modest negative share (12%), limiting the probability that sentiment alone forces a directional break. However, because RON/GBP’s technical structure remains neutral-to-soft (RSI bias bearish; MA relationships bearish), any “positive” backdrop is best treated as a potential facilitator of range stability rather than a standalone driver.
Neutral / Mixed Developments
The bulk of the news set is informational, consistent with the neutral average sentiment of 0.018 and a high neutral share (69%). Coverage frequently emphasizes scheduled macro events and near-term positioning dynamics (for example, labor-market releases and broader USD tone), which can create intraday volatility without changing the medium-term state. This type of flow typically interacts with the existing volatility regime rather than redefining it; notably, RON/GBP’s Bollinger Bandwidth at 0.0228 is consistent with a market that absorbs information without immediately repricing into an expansion phase. For this pair, neutral news conditions generally mean the chart will remain the primary arbiter: a push toward 0.1711 or a drift back to 0.1642 is more likely to be validated by technical follow-through than by headline impulse alone.
Negative / Risk Signals
Risk signals in the broader news flow are largely associated with geopolitical uncertainty and episodic risk-off rotations. Even when these developments do not directly reference RON/GBP, they can affect FX correlation structure, liquidity conditions, and volatility expectations—especially when markets reprice energy risk or perceive policy uncertainty. In this report, the key point is contextual: a negative tone can become more consequential when the instrument’s technicals are already fragile. Here, the technical layer shows softness (RSI(14) 36.84 bearish; trend interpretation bearish vs MA50 and MA50 vs MA200), so an external risk shock could increase the likelihood of a downside resolution through 0.1642. That said, the sentiment mix still shows only 12% negative, suggesting that—within the provided dataset—risk is present but not dominant. The highest near-term risk is a volatility regime change from compression to expansion, which can reduce the reliability of range boundaries.
- Whether price action can sustain acceptance above 0.1711 rather than reverting back into the range.
- Whether repeated tests of 0.1642 occur alongside further RSI weakness from 36.84.
- Any transition in volatility from the current compressed state (bandwidth 0.0228) toward expansion.
Sources referenced: Reuters, Bloomberg, Yahoo Finance, MarketWatch, Investing.com
Snapshot: AI Rank (Short–Mid–Long): Neutral (Neutral–Neutral–Neutral) · Technical Confluence: Neutral · Key Levels: Support ~0.16 | Resistance ~0.17 · News Sentiment: Neutral
7) Sources
- EUR/JPY Price Forecast: Remains close to 186.00 near descending channel top — https://www.fxstreet.com/news/eur-jpy-price-forecast-remains-close-to-18600-near-descending-channel-top-202606050404
- Nonfarm Payrolls set to show broadly stable US job market as Fed rate hike odds mount — https://www.fxstreet.com/news/nonfarm-payrolls-set-to-show-broadly-stable-us-job-market-as-fed-rate-hike-odds-mount-202606050400
- United States Dollar Index wobbles around 99.40 in countdown to US NFP data — https://www.fxstreet.com/news/united-states-dollar-index-wobbles-around-9940-in-countdown-to-us-nfp-data-202606050355
- Gold falls on stalled US-Iran ceasefire talks, US NFP data looms — https://www.fxstreet.com/news/gold-declines-below-4-500-on-stalled-us-iran-ceasefire-talks-us-nfp-data-looms-202606042307
- 17-year lows: South Korean Won in a downward spiral — https://www.fxstreet.com/news/south-korean-won-reaches-17-month-lows-202606050341
- Oman’s Mina al Fahal terminal halts Oil loading after alleged drone attack – Reuters — https://www.fxstreet.com/news/omans-mina-al-fahal-terminal-halts-oil-loading-after-alleged-drone-attack-reuters-202606050320
- Canadian Dollar draws support from higher oil prices — https://www.fxstreet.com/news/canadian-dollar-draws-support-from-higher-oil-prices-202606050319
- Silver Price Forecast: XAG/USD plummets below $72.50 ahead of US NFP data — https://www.fxstreet.com/news/silver-price-forecast-xag-usd-plummets-below-7250-ahead-of-us-nfp-data-202606050318
You may also like: How KGNAI AI ranks instruments across global markets
Disclaimer: KGNAI provides AI-generated analytics and educational market commentary only. This is not financial advice. Markets involve risk. Always do your own research.