
TRYPLN (Turkish Lira/Polish Zloty) — 03-Jun-2026 Technical & Rank Review with Elevated Risk Signals
TRYPLN sits in a persistently weak cross-sectional position within KGNAI’s ranked FX universe, while technical evidence remains mixed-to-defensive rather than decisively bearish. The instrument’s daily, weekly, and monthly ranks are clustered near the bottom of a 950-instrument universe, a configuration that often coincides with fragile trend quality and poor relative behavior. At the same time, the blended 18-signal technical framework flags a Neutral regime, implying that selling pressure may be present but not uniformly confirmed across independent indicator groups. Key price decision zones are tight—support near 0.0767 and resistance near 0.0792—so incremental moves can quickly shift the market from stabilization to renewed deterioration. News sentiment readings lean mildly positive on average (0.143), but the digest is not instrument-specific, limiting its direct signal value for TRYPLN.
Key Takeaways
- Rank stance (Short / Mid / Long): Bearish / Bearish / Bearish (ranks concentrated near the bottom of a 950-instrument universe).
- Technical confluence label: Neutral (18-signal confluence -0.278; blended overall technical -0.253).
- Key levels: Support near 0.0767 and resistance near 0.0792 define the near-term decision band.
- News sentiment bias: Neutral-to-slightly positive on average (0.143), but coverage is broader market/sector rather than instrument-specific.
- Confirmation / invalidation condition: A sustained hold above 0.0792 would improve the stabilization case; a close below 0.0767 raises deterioration risk.
What KGNAI Measures
KGNAI evaluates assets using large cross-sectional datasets built from millions of structured data points. Inputs incorporate fundamental metrics, technical structures, and systematically processed news sentiment. Statistical models, machine learning, and AI frameworks are used to assess relative positioning, signal alignment, and probabilistic behavior across broad universes.
How to Read This Report
- Ranks are comparative across the tracked universe, not absolute price targets.
- Confluence reflects alignment among independent signal groups.
- Support/resistance levels are probabilistic decision zones, not guarantees.
- Sentiment provides contextual bias within the broader analytical framework.
KGNAI Signal + Technical Snapshot + News Sentiment Digest
As of: 03-Jun-2026
Ticker: TRYPLN
1) KGNAI AI Analysis
Region: FOREX
Total universe size: 950 ranked instruments
- Daily rank: #856 out of 950 — Bearish
- Weekly rank: #916 out of 950 — Bearish
- Monthly rank: #897 out of 950 — Bearish
- 3-Monthly rank: #882 out of 950 — Bearish
- 6-Monthly rank: #875 out of 950 — Bearish
- Yearly rank: #871 out of 950 — Bearish
Cross-horizon ranks are uniformly Bearish, with the weekly reading at #916 and the monthly at #897—both in the extreme lower tail of the 950-instrument distribution. When multiple horizons cluster near the bottom simultaneously, the model framework generally treats the instrument as structurally weak rather than temporarily out of favor. That matters because rank dispersion is a proxy for regime stability: broad-based weakness suggests the market has not yet produced enough countervailing evidence to lift TRYPLN out of the lower-risk bucket.
The daily rank at #856 is slightly less weak than the weekly, which can be read as a modest near-term improvement in relative behavior. However, the 3-month and 6-month ranks (#882 and #875) remain anchored in the same adverse zone, reinforcing that any near-term stabilization is not yet translating into sustained relative strength. In other words, the cross-sectional signal structure remains consistent with a market that is struggling to establish durable upside follow-through.
Term view: Short-term: Bearish. Mid-term: Bearish. Long-term: Bearish. Within KGNAI’s design, this combination is less about calling a directional move and more about classifying the current state as one where downside asymmetry and fragile trend quality tend to be elevated.
KGNAI ranks each instrument across large universes using multiple proprietary AI tests and statistical models (millions of data points). Lower ranks generally indicate stronger probability of favorable performance behavior, while higher ranks indicate weaker probability and more bearish positioning.
Want the full universe and complete rank tables? Unlock full access on KGNAI: https://www.kgnai.com/pricing
2) Price & trend overview
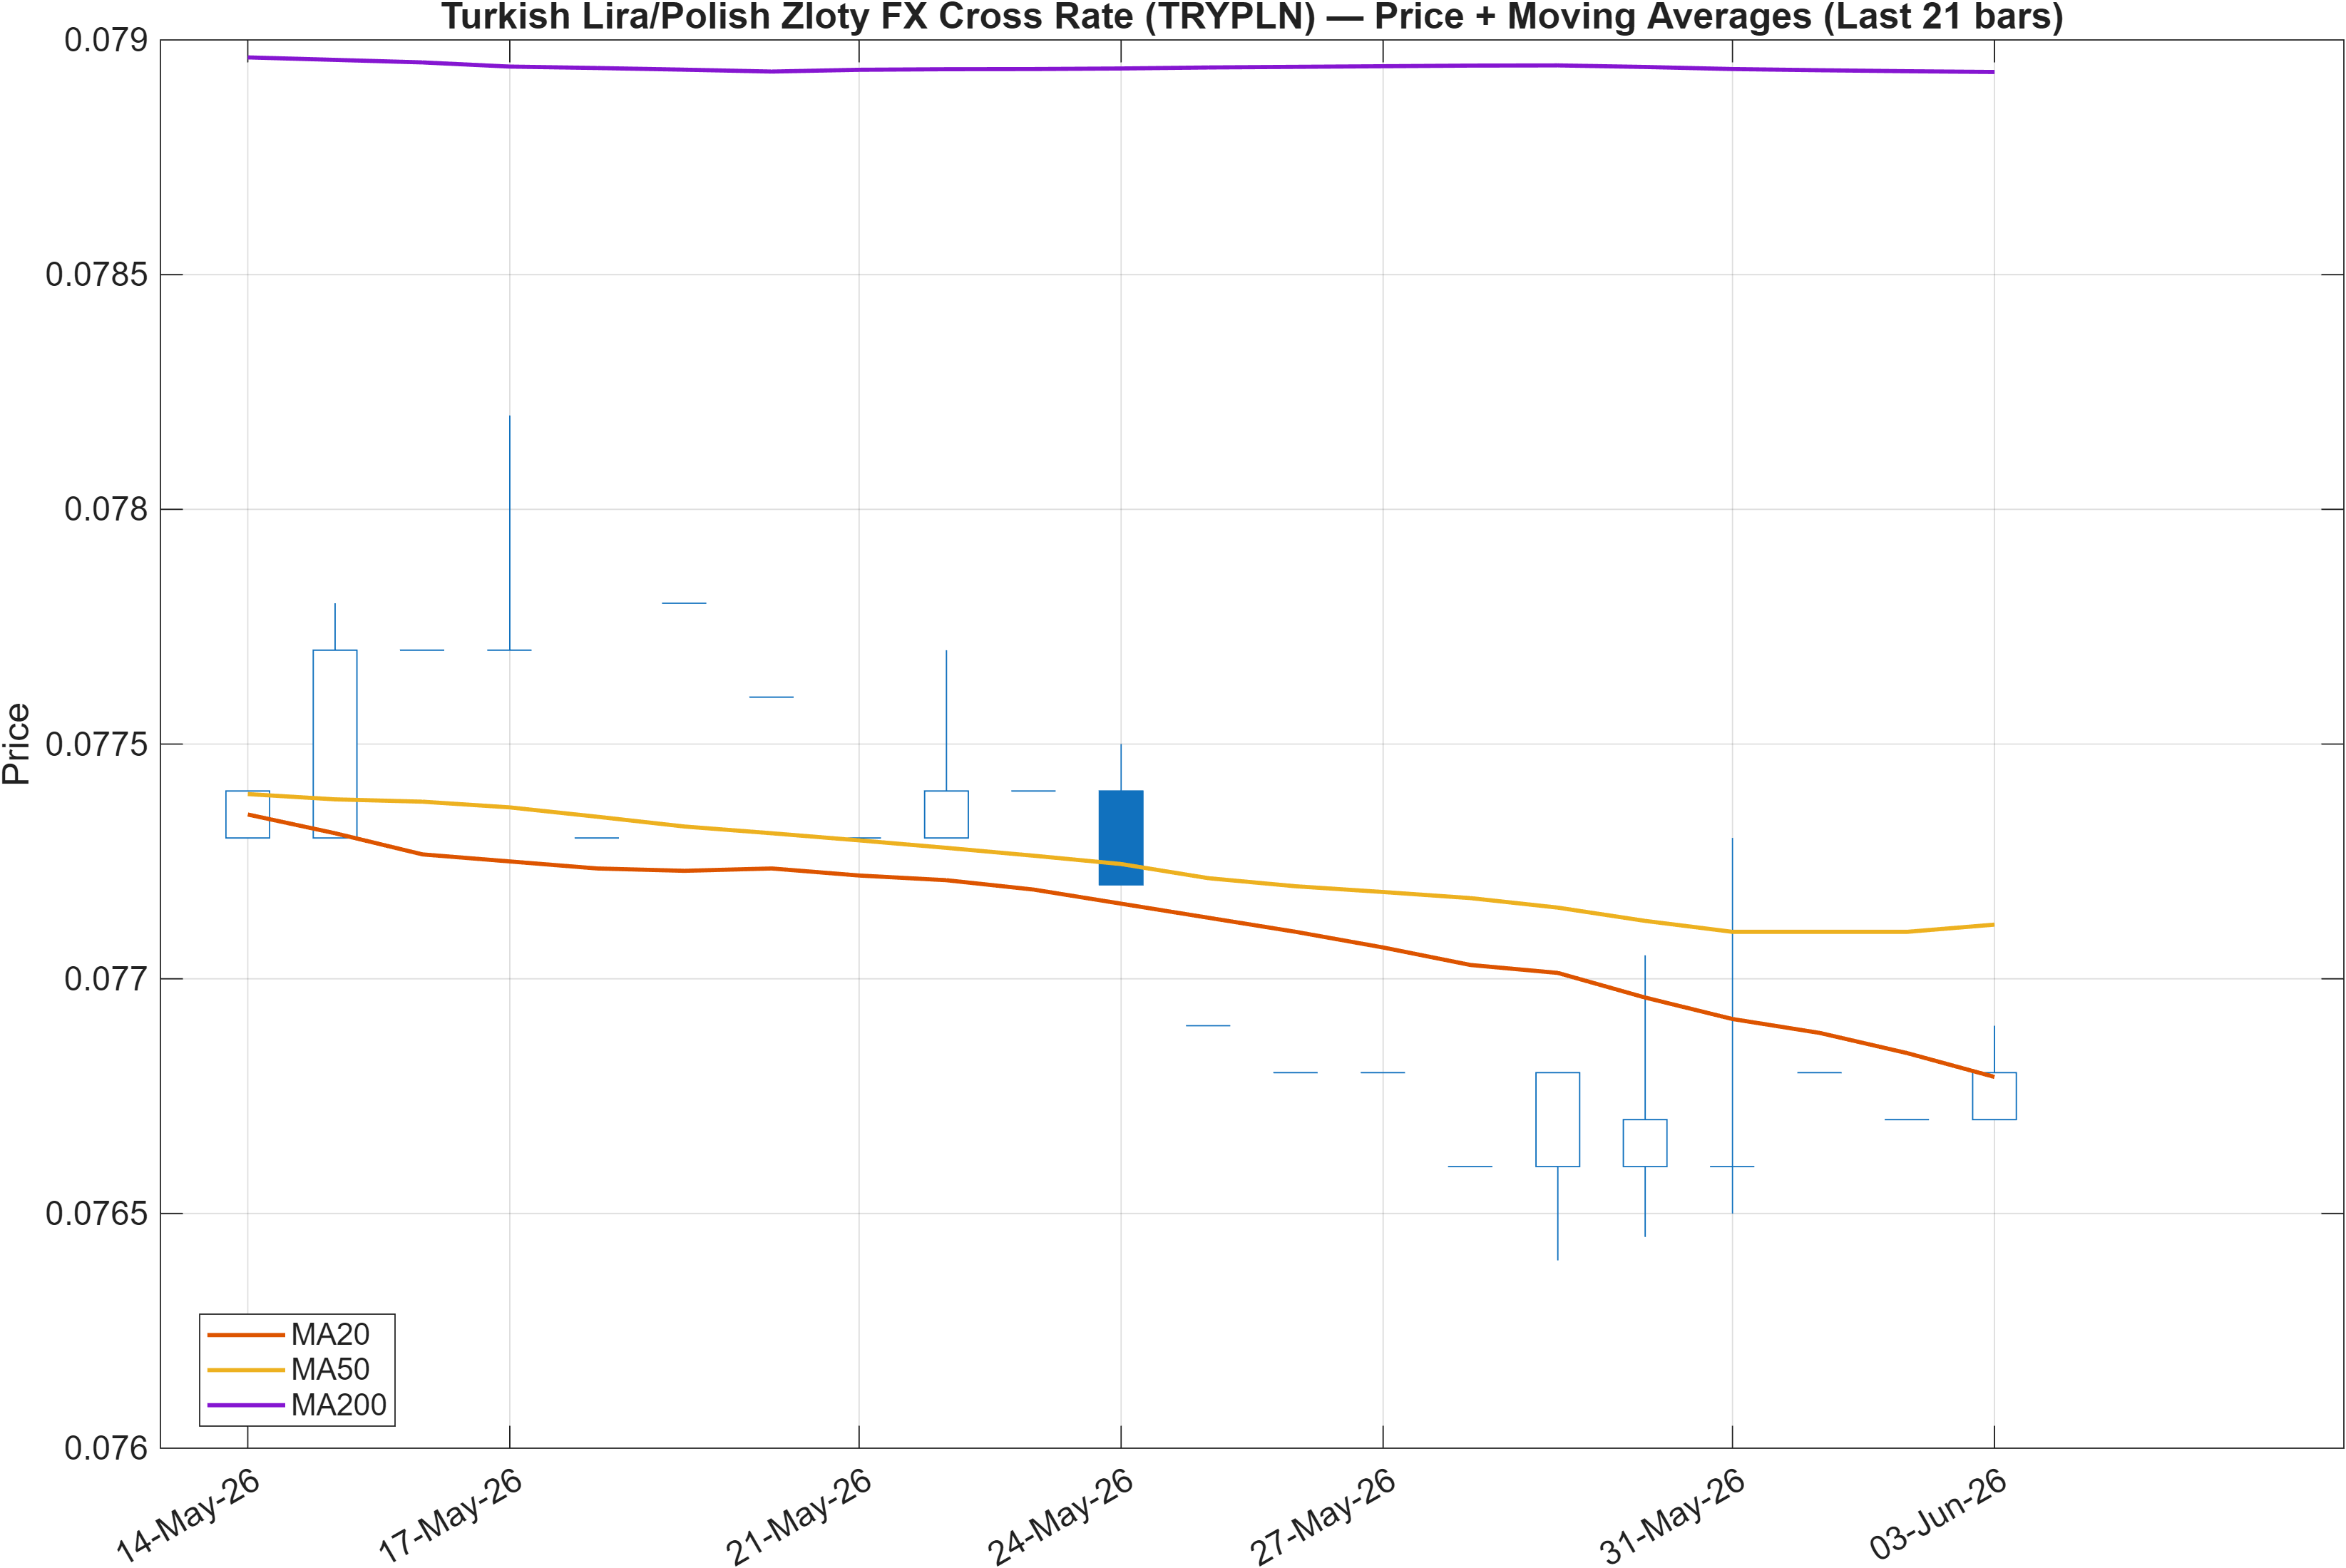
Interpretation: Close vs MA50 = Bearish, MA50 vs MA200 = Bearish.
The moving-average stack is aligned bearishly: price is below the MA50, and the MA50 is below the MA200. This configuration is typically associated with a downtrend that remains intact from both a shorter and longer trend perspective. Importantly, this is a structure signal rather than a timing signal—meaning the primary question becomes whether the market can interrupt the bearish hierarchy (through sustained closes above the MA50) or whether rebounds continue to fail within that framework.
The rank picture reinforces the trend interpretation. With the daily rank at #856 and the weekly at #916, TRYPLN remains positioned in the weaker segment of the FX universe even as it trades within a relatively tight support/resistance band (0.0767 to 0.0792). When a market is structurally bearish yet range-bound at key levels, it often reflects compression under pressure: stabilization attempts can occur, but they must overcome unfavorable trend scaffolding.
Practically, trend assessment here is about whether price can begin to repair the moving-average relationships. Until the close/MA50 signal improves, the chart-level burden of proof remains on the upside. This does not preclude countertrend bounces; rather, it frames them as requiring confirmation from other groups (momentum and volatility) before the model would treat them as more than reactionary.
3) Momentum & volatility dashboard
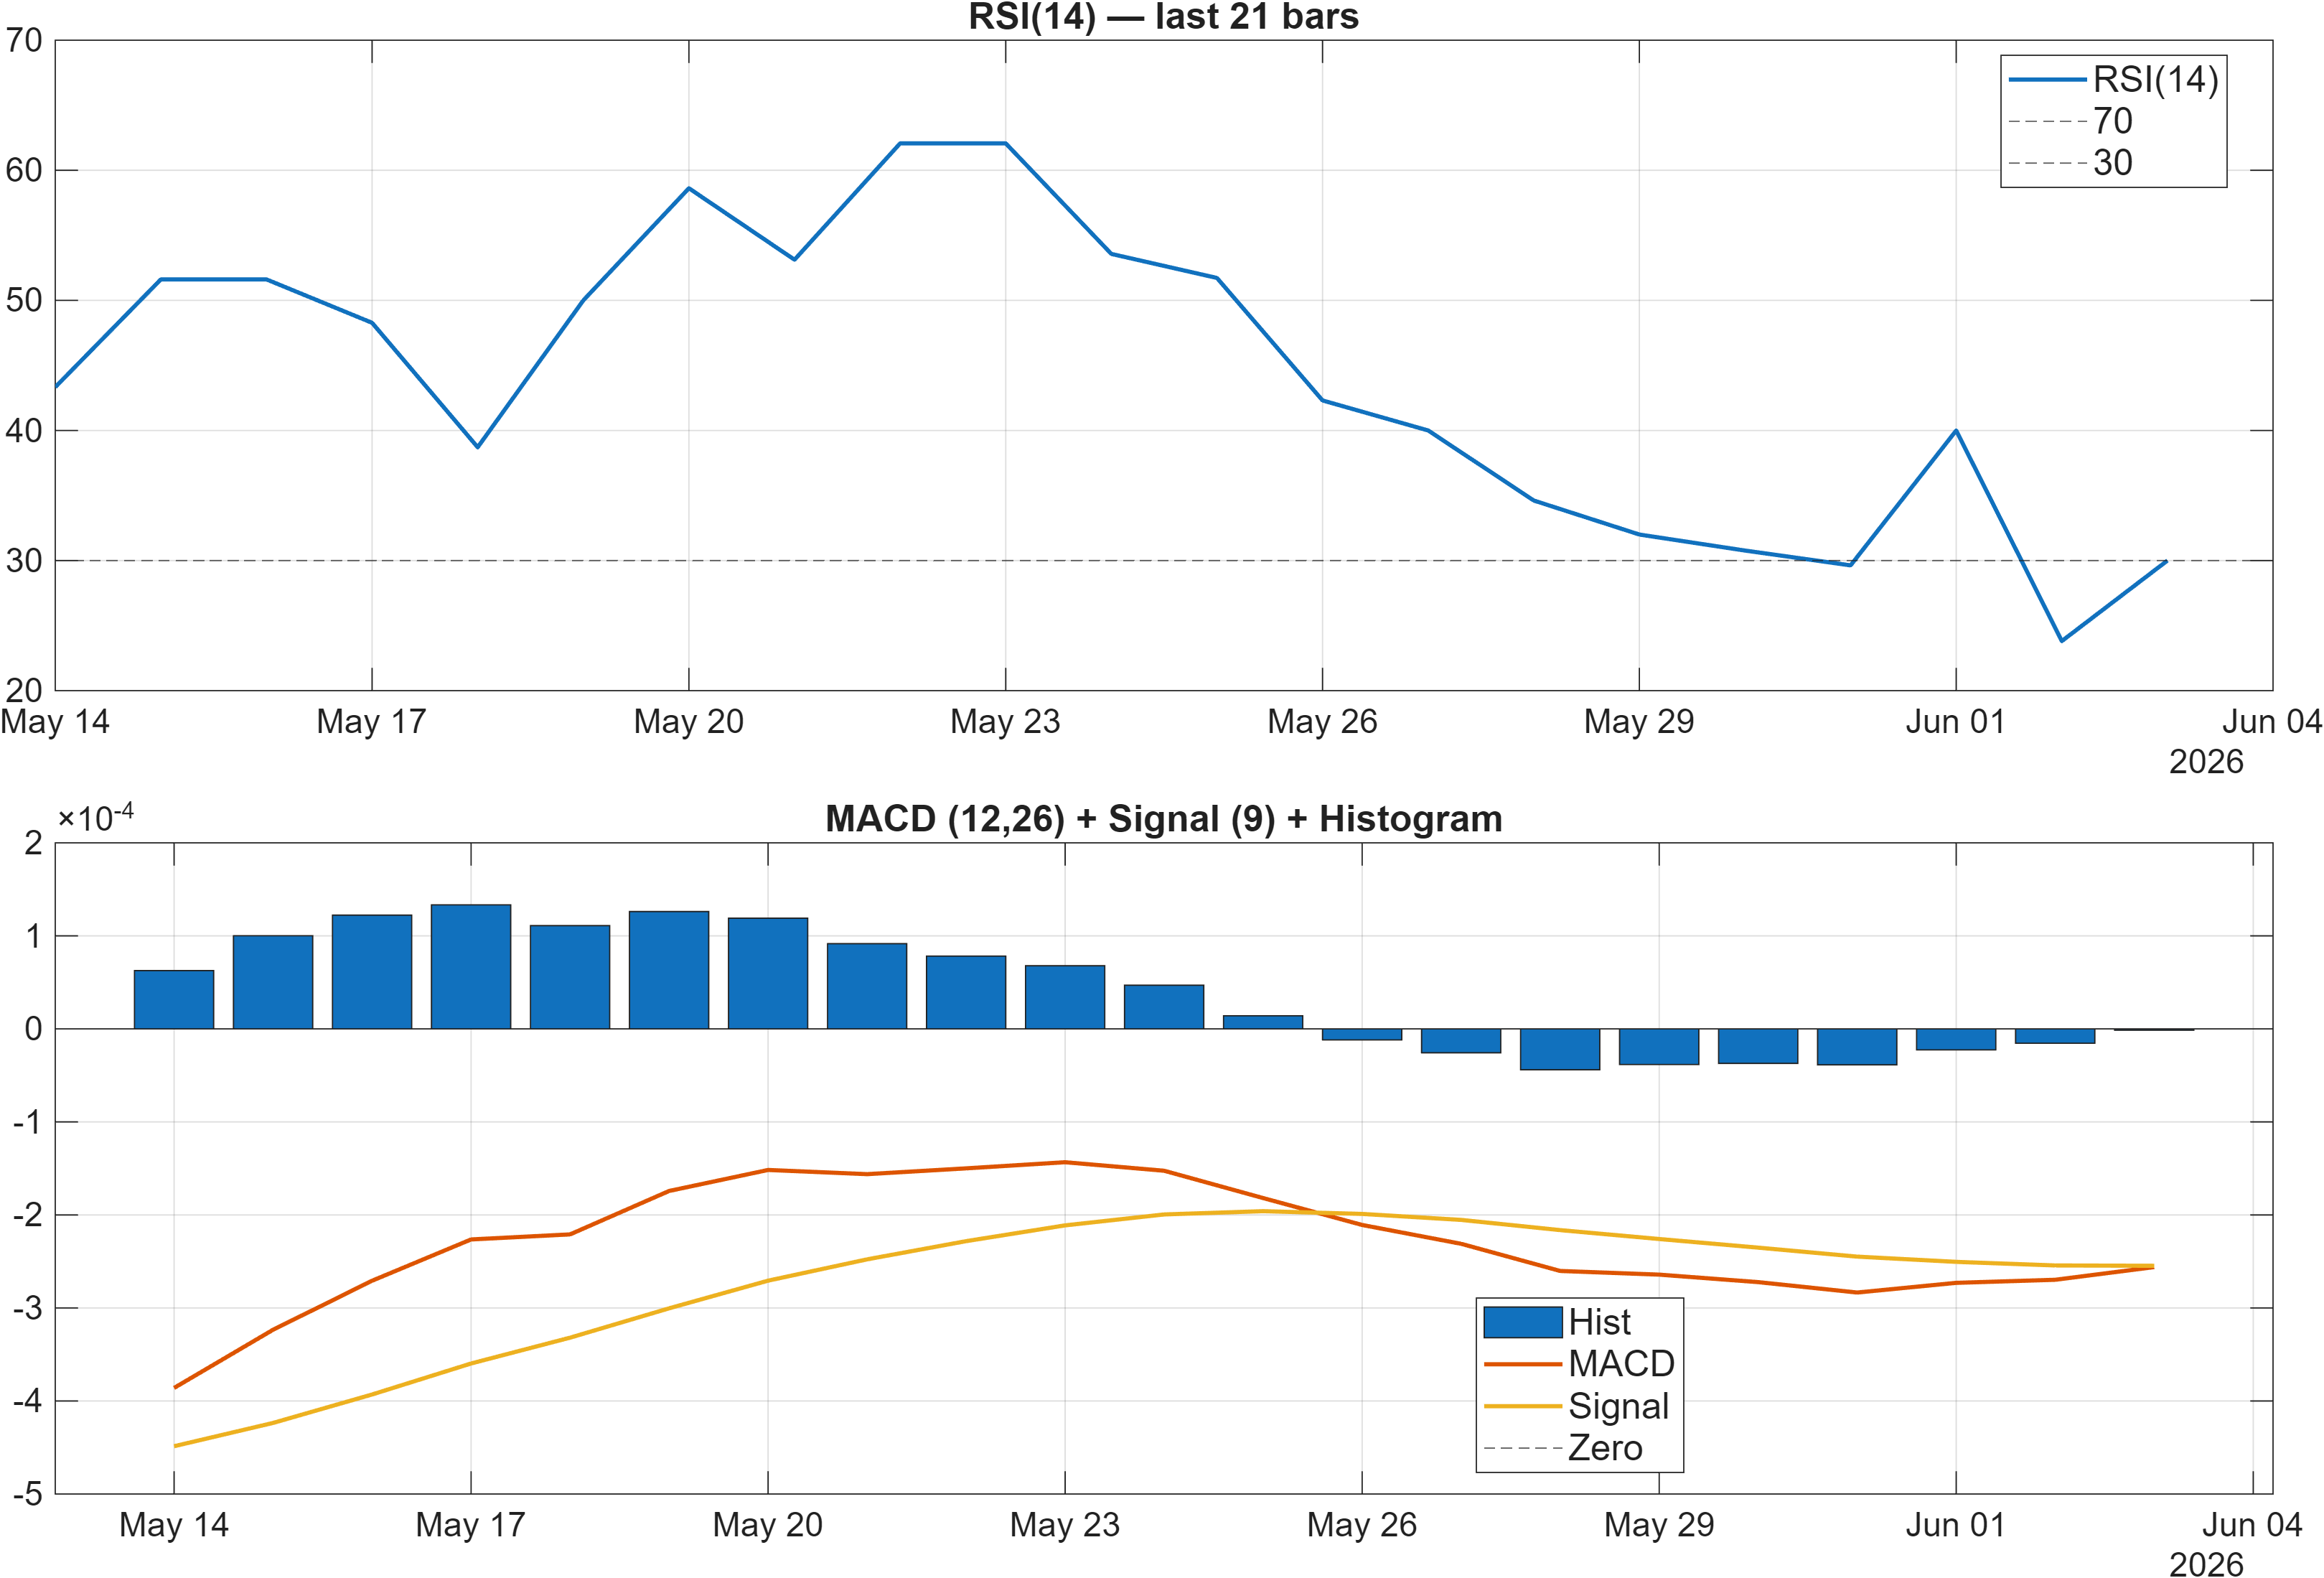
Interpretation: RSI bias = Bearish, MACD hist = -0.0000.
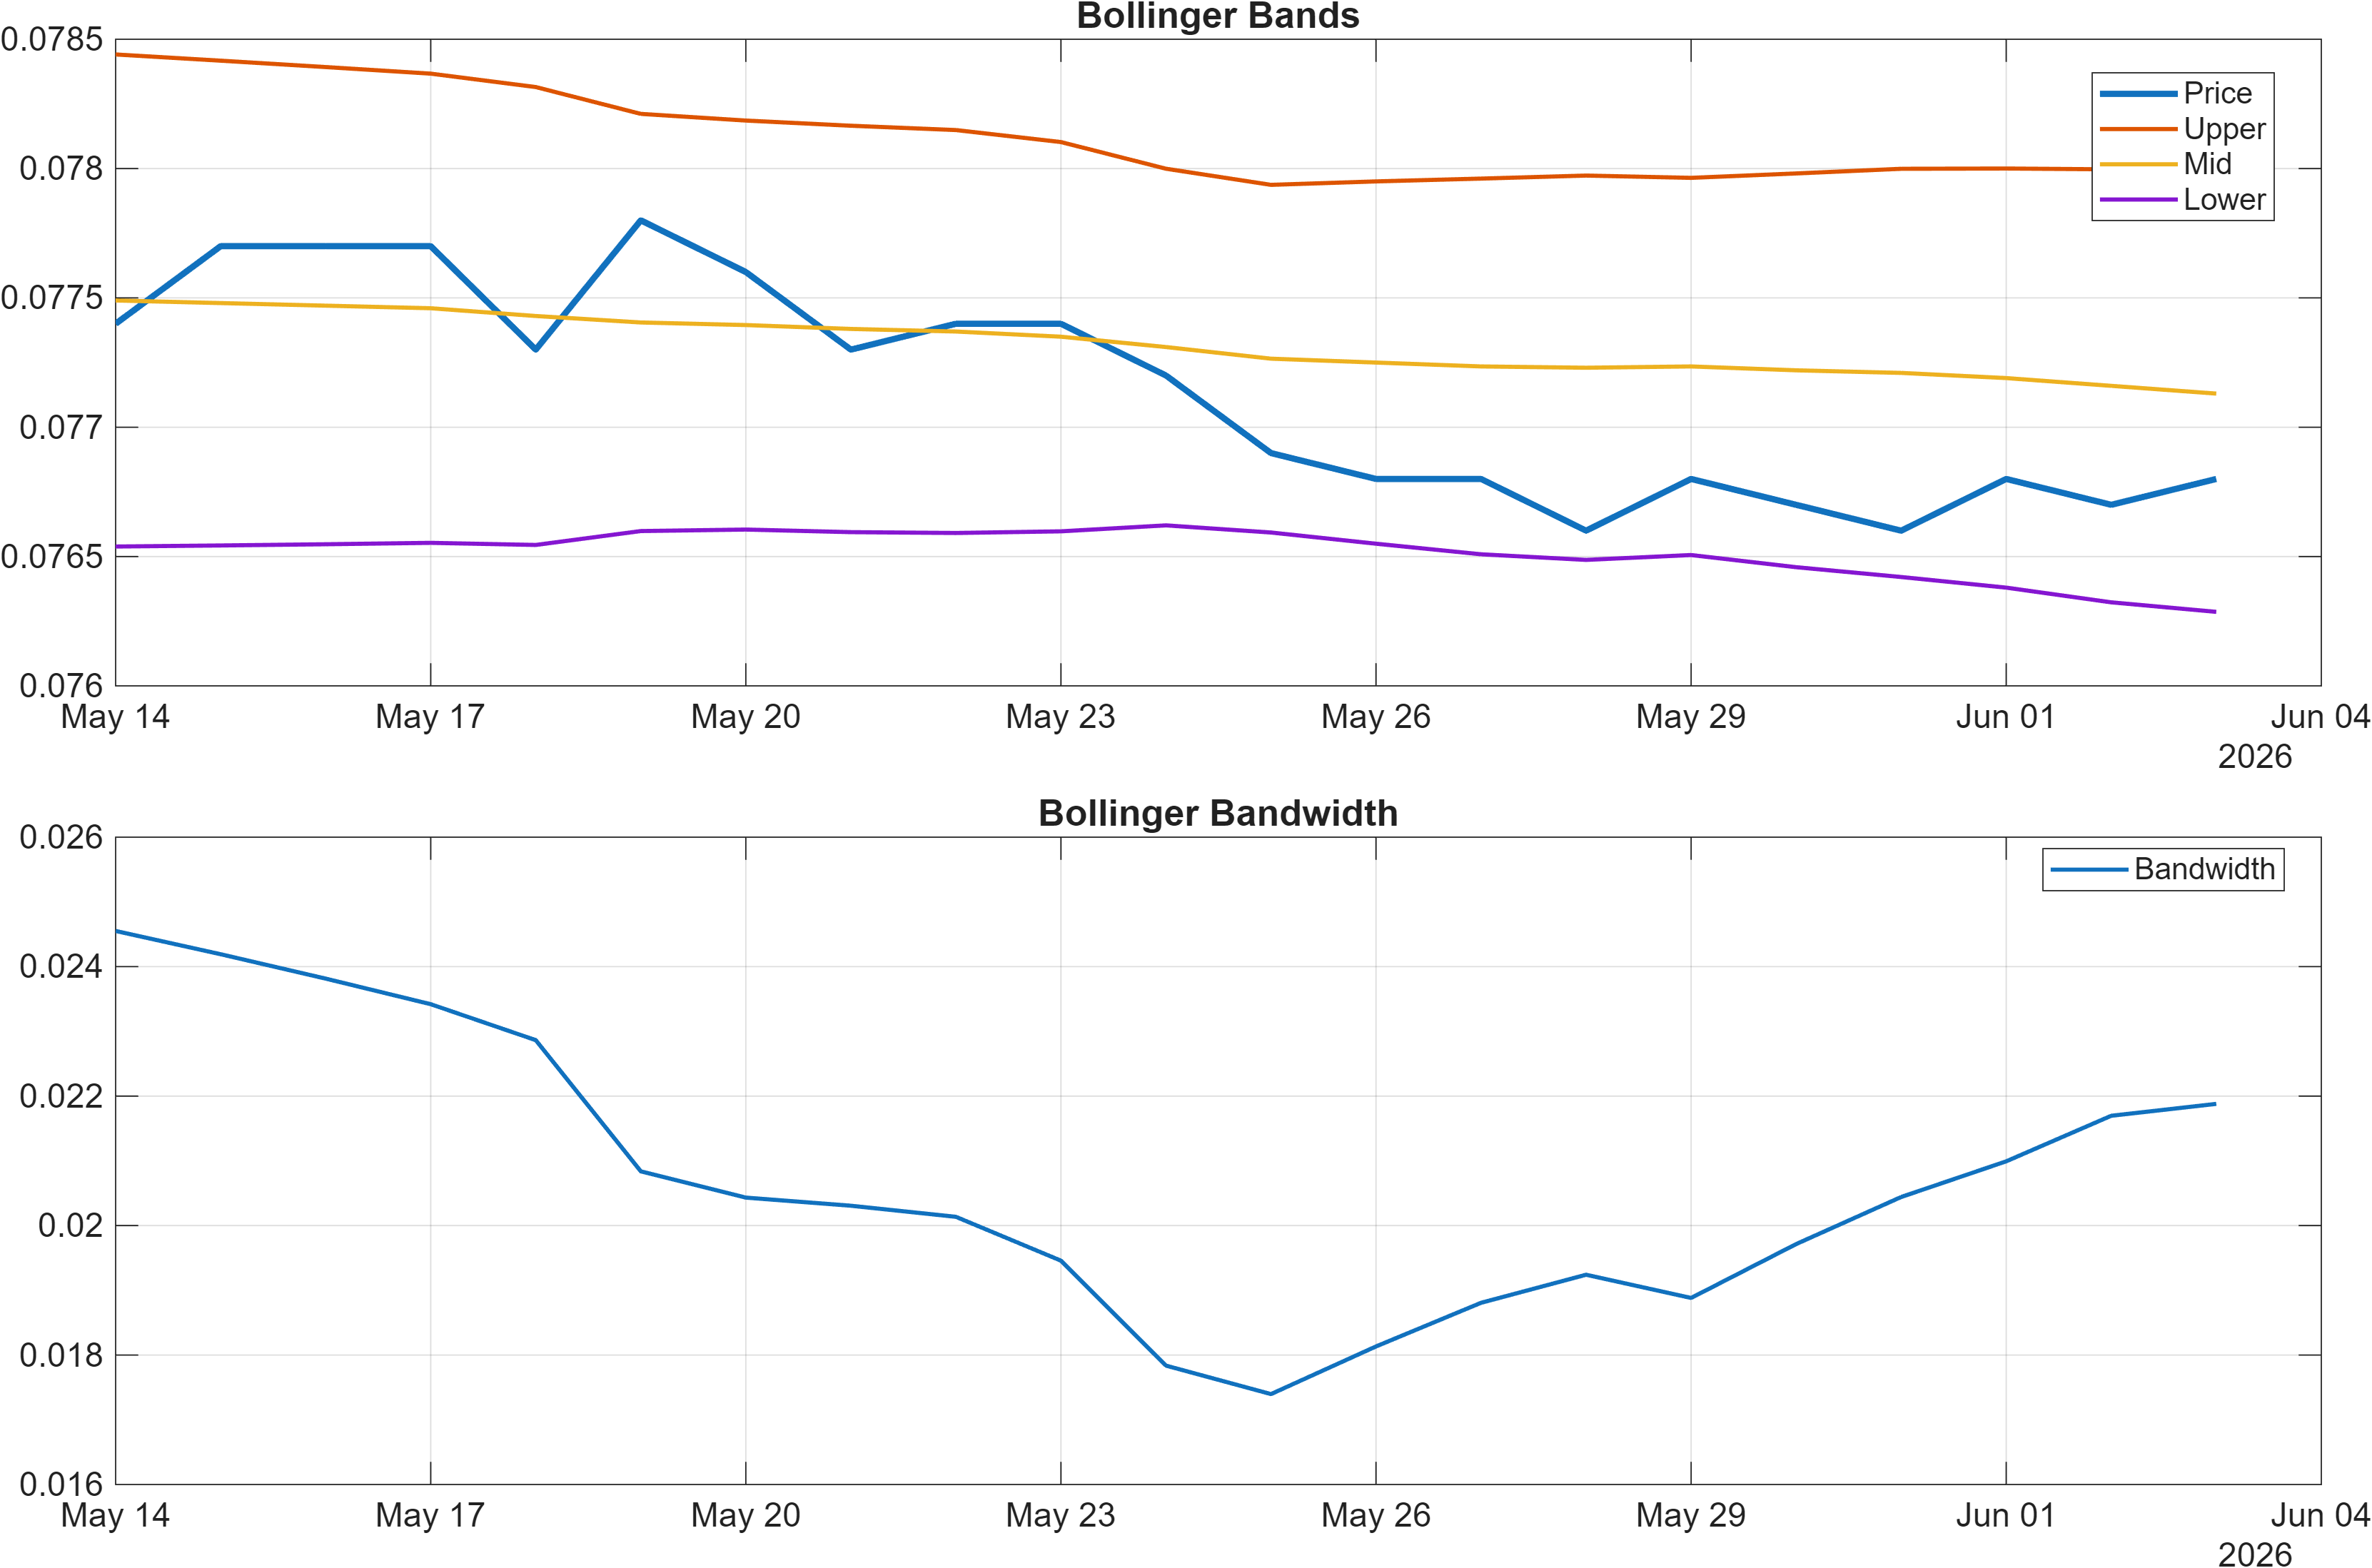
Interpretation: Bandwidth (volatility regime) latest = 0.0219.
Momentum and volatility are not fully synchronized, which is often where false starts occur. RSI bias is flagged as Bearish, and the signal table later corroborates that RSI(14) sits at 30—a level frequently associated with downside persistence or late-stage selling pressure. However, MACD histogram is effectively flat at -0.0000, indicating that the incremental rate of change may be stabilizing even if the broader momentum state remains weak.
The volatility regime adds nuance. Bollinger Bandwidth at 0.0219 (also reflected as BB Width 0.02188 in the signal set) points to relatively contained dispersion. In many FX crosses, compressed bandwidth can act as a precondition for expansion, but the direction of that expansion is not determined by compression alone. In a bearish trend scaffold (price below MA50 and MA50 below MA200), volatility expansion that begins while momentum remains bearish often resolves downward unless momentum repairs first.
Taken together, the configuration reads as bearish momentum with tentative deceleration. That is distinct from a clear reversal state. A more constructive momentum transition would typically require RSI to improve materially from 30 and MACD histogram to shift away from slightly negative/flat into sustained positive territory, ideally while volatility expands in the direction of the move rather than simply widening around a choppy base.
4) Support / Resistance zones
Support ~ 0.0767 | Resistance ~ 0.0792
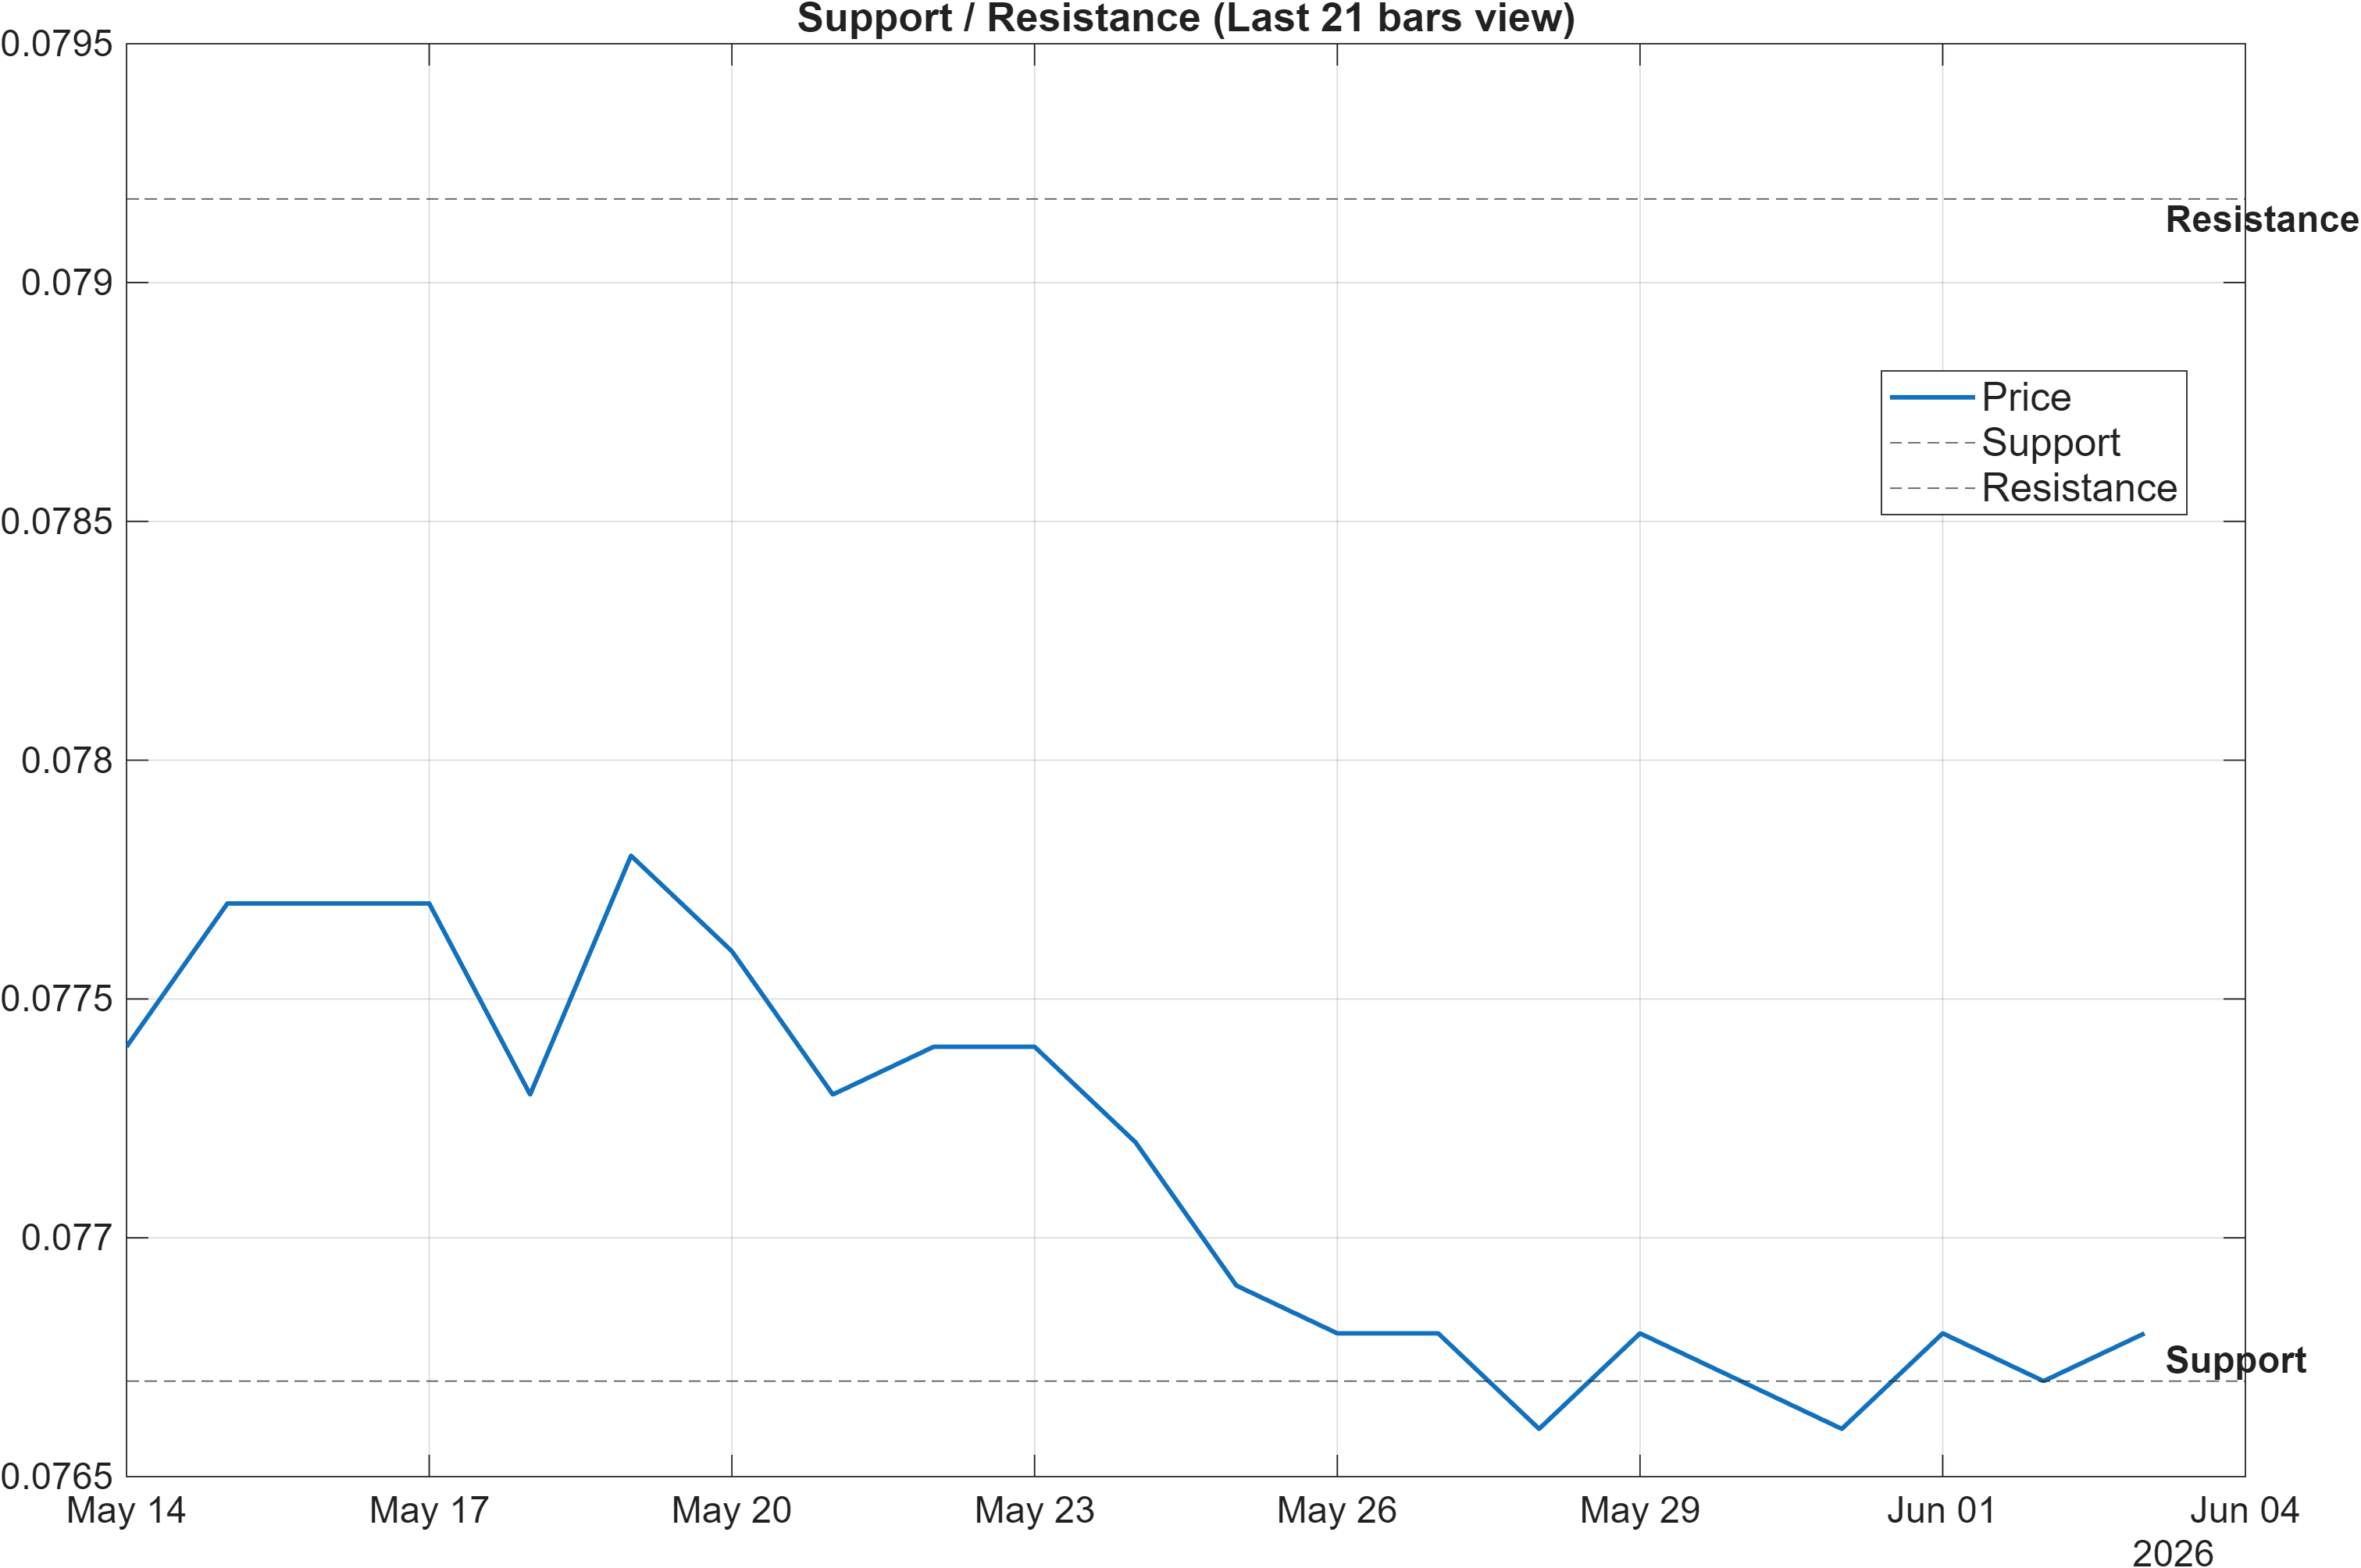
Scenario view: Break above resistance with volume → continuation. Close below support → signal deterioration risk.
The current map is defined by a narrow but consequential band: support near 0.0767 and resistance near 0.0792. In a market with bearish moving-average structure, the first analytical task is to determine whether this band is a base (accumulation) or simply a pause before trend continuation. Tight zones like this tend to increase the importance of closing behavior relative to intraday excursions.
The indicator set offers mixed context around these levels. The signal table later shows HHIGH(20) at 0.0782 and LLOW(20) at 0.0764, which brackets the support estimate closely and suggests the market’s recent extremes are operating near the same decision region. That alignment typically means the next break is more likely to be meaningful, because it would represent a move beyond a frequently tested boundary rather than a random fluctuation in open space.
There is also a small constructive micro-signal: “MedPx vs Support” is slightly positive at 0.0001 and marked bullish in the signal set, implying price is not materially undercutting the support anchor at the measurement point. Still, with the broader ranks in the lower tail (e.g., weekly #916) and momentum readings such as ROC(20) at -1.158 (bearish), the support zone should be treated as a decision point rather than a confirmed floor.
5) Quant Technical Dashboard (18 Signals)
KGNAI AI Technical Analysis Score (Deep Reinforcement Learning): Rank #567 out of 950 (Rank 1 represents the strongest technical positioning and a higher probability of favorable price behavior. As ranks increase toward the maximum, the probability of favorable outcomes weakens and bearish positioning becomes more dominant.) | Label: Neutral | Score: -0.194
18-Signal Technical Confluence Score: -0.278 (Neutral)
Overall Technical Score (18-signal confluence + DRL rank blend): -0.253 (Neutral)
Note: The blended score reflects signal strength weighted against broader AI technical ranking, which may temporarily diverge.
Blended technical score breakdown: -0.253 (Neutral | Bull 2 / Bear 7 / Neutral 9)
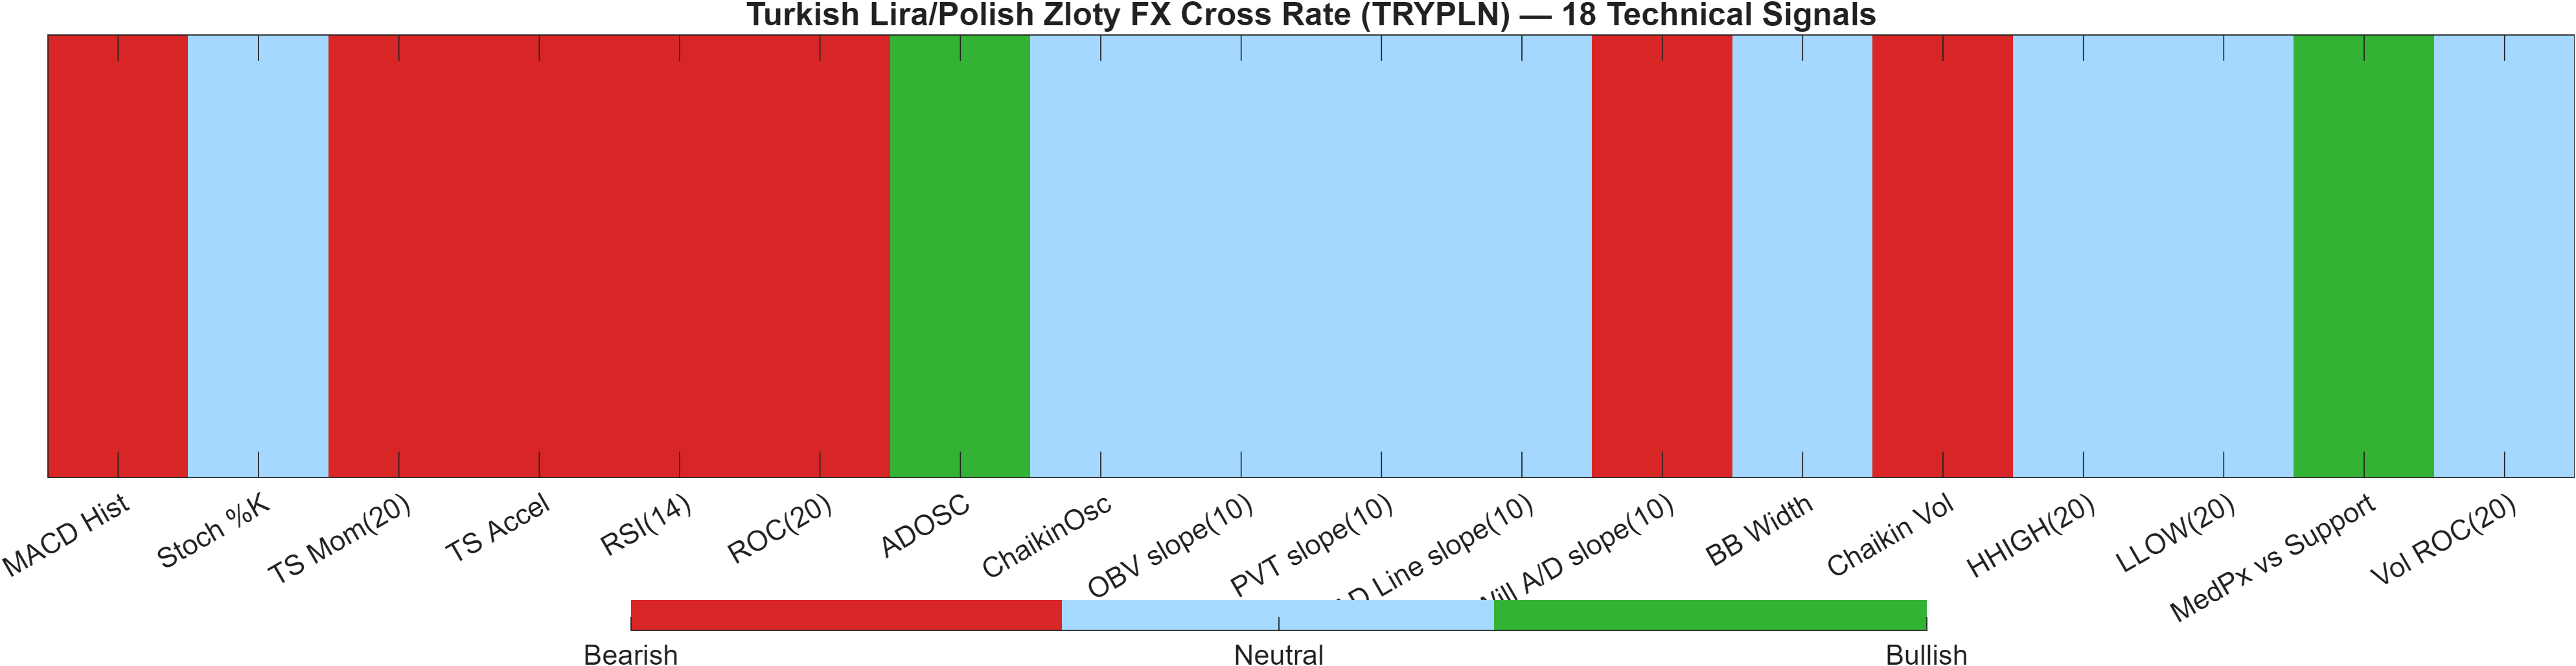
Signal table (Bull/Bear/Neutral)
| Indicator | Value | Signal |
|---|---|---|
| MACD Hist | -1.42e-06 | Bearish |
| Stoch %K | 44.44 | Neutral |
| TS Mom(20) | -0.0009 | Bearish |
| TS Accel | -0.0007 | Bearish |
| RSI(14) | 30 | Bearish |
| ROC(20) | -1.158 | Bearish |
| ADOSC | 75 | Bullish |
| ChaikinOsc | 0 | Neutral |
| OBV slope(10) | 0 | Neutral |
| PVT slope(10) | 0 | Neutral |
| AD Line slope(10) | 0 | Neutral |
| Will A/D slope(10) | -0.00105 | Bearish |
| BB Width | 0.02188 | Neutral |
| Chaikin Vol | 63.19 | Bearish |
| HHIGH(20) | 0.0782 | Neutral |
| LLOW(20) | 0.0764 | Neutral |
| MedPx vs Support | 0.0001 | Bullish |
| Vol ROC(20) | — | Neutral |
Interpretation: Indicator-level signals form the base confluence, which is then adjusted using a separate AI-driven technical ranking model. The final technical score summarizes this combined view.
The technical dashboard is best read as a divergence between breadth and severity. Breadth is not overwhelmingly bearish: the blended breakdown shows Bull 2 / Bear 7 / Neutral 9, which is consistent with a market that is under pressure but not in full technical capitulation. That mixed breadth is a primary reason the confluence score remains Neutral despite multiple bearish momentum flags.
Severity within the bearish subset is notable. Momentum and rate-of-change measures (e.g., ROC(20) -1.158 and TS Mom(20) -0.0009) align with weakness, and RSI(14) at 30 supports a defensive bias. At the same time, the accumulation/distribution proxy ADOSC registers 75 and is marked bullish, a configuration that can appear when selling pressure becomes less effective even before trend structure turns.
The model blend adds another layer: the DRL technical rank is #567 with a Neutral label and score -0.194, while the overall blended technical score is -0.253 (Neutral). This “neutral-but-negative” profile is consistent with an environment where bearish evidence exists but lacks the unified confirmation that would typically push the system into a more decisive bearish technical regime. For TRYPLN, that leaves the support/resistance band (0.0767/0.0792) as the practical arbiter of whether neutral resolves into recovery or renewed trend continuation.
6) News sentiment + extractive gist
Note: Instrument-specific news matches were not found, so the digest includes broader market/sector headlines. Links are provided for verification.
Sentiment score (avg): 0.143 | Positive: 37% | Neutral: 44% | Negative: 19%
KGNAI AI News Sentiment Score (normalized -1 to +1): Not available (as of —) | Label: Not available | Overall news score: 0.14
Positive Developments
Recent coverage across major financial outlets indicates a modestly constructive tone in parts of the global macro backdrop, with some data prints and policy commentary suggesting the potential for stabilization in select regions even amid elevated uncertainty. In the aggregated digest, the sentiment mix leans slightly positive (average 0.143) with positives comprising 37% of items—enough to reduce the likelihood that the news environment is uniformly risk-off at this snapshot. For TRYPLN, the key limitation is that the news set is not instrument-specific; it functions more as a contextual overlay than a direct driver. Still, when sentiment is not strongly negative, technically important levels—support around 0.0767 and resistance near 0.0792—tend to matter more because price can respond to positioning and liquidity rather than being dominated by one-way headline shocks. A less hostile macro-news tone can also support periods of volatility compression, consistent with the current Bollinger bandwidth reading of 0.0219.
Neutral / Mixed Developments
The broader set reads as mixed and informational rather than decisively directional. Neutral items represent 44% of the sample, which generally aligns with a market that is digesting cross-currents instead of repricing a single dominant theme. For TRYPLN, that backdrop fits the current technical posture: a Neutral confluence score (-0.278) alongside a bearish trend structure can persist for extended periods when catalysts are diffuse. In such regimes, indicator disagreements—such as RSI sitting at 30 while the MACD histogram is essentially flat (-0.0000)—tend to translate into choppy, level-driven trade rather than a clean directional impulse. With the normalized KGNAI AI News Sentiment Score marked as Not available, readers should treat the news digest as context only, not as a calibrated signal comparable to the rank and technical models.
Negative / Risk Signals
Risk framing in the digest remains present even if not dominant, with negative items at 19%. Aggregated coverage emphasizes themes that can raise cross-asset volatility and widen FX dispersion, which matters for a cross already showing weak relative ranks (weekly #916, monthly #897). When macro risk signals increase, markets with bearish moving-average structure (close below MA50; MA50 below MA200) can be more vulnerable to downside continuation because rebounds may face faster selling into overhead supply. The technical dashboard also shows multiple bearish momentum components (e.g., ROC(20) -1.158) that can reassert if volatility expands out of the current compression (0.0219). In that setting, the key risk is a decisive close below 0.0767, which would be consistent with the report’s own deterioration scenario framing.
- What to monitor next: Whether TRYPLN can register sustained closes above 0.0792 while the moving-average structure remains bearish.
- What to monitor next: Any shift in momentum repair—RSI moving materially off 30 alongside a firmer MACD histogram than -0.0000.
- What to monitor next: Volatility regime change—bandwidth moving up from 0.0219 and whether the breakout aligns with price holding above support 0.0767.
Sources referenced: Reuters, Bloomberg, Yahoo Finance, MarketWatch, Investing.com
Snapshot: AI Rank (Short–Mid–Long): Bearish (Bearish–Bearish–Bearish) · Technical Confluence: Neutral · Key Levels: Support ~0.08 | Resistance ~0.08 · News Sentiment: Neutral
7) Sources
- India Gold price today: Gold falls, according to FXStreet data — https://www.fxstreet.com/news/india-gold-price-today-gold-falls-according-to-fxstreet-data-202606030435
- ECB’s Wunsch: US-Iran deal confirmation before June meeting won’t derail interest rate hike hopes — https://www.fxstreet.com/news/ecbs-wunsch-us-iran-deal-confirmation-before-june-meeting-wont-derail-interest-rate-hike-hopes-202606030434
- US targets extra 12.5% tariffs on India, 59 other countries for not enforcing forced labour ban — https://www.fxstreet.com/news/us-targets-extra-125-tariffs-on-india-59-other-countries-for-not-enforcing-forced-labour-ban-202606030434
- Euro declines as traders adopt caution on risk-off mood — https://www.fxstreet.com/news/euro-declines-as-traders-adopt-caution-on-risk-off-mood-202606030427
- EUR/JPY Price Forecast: Declines below 186.00 amid intervention fears, but bullish vibe prevails — https://www.fxstreet.com/news/eur-jpy-price-forecast-declines-below-18600-amid-intervention-fears-but-bullish-vibe-prevails-202606030410
- Gold struggles below $4,500 as Oil-driven inflation fears reaffirm Fed hike bets — https://www.fxstreet.com/news/gold-struggles-below-4-500-as-oil-driven-inflation-fears-reaffirm-fed-hike-bets-202606030352
- Canadian Dollar weakens despite higher oil prices — https://www.fxstreet.com/news/canadian-dollar-weakens-despite-higher-oil-prices-202606030344
- United States Dollar Index trades calm while US-Iran deal uncertainty escalates — https://www.fxstreet.com/news/united-states-dollar-index-trades-calm-while-us-iran-deal-uncertainty-escalates-202606030308
You may also like: How KGNAI AI ranks instruments across global markets
Disclaimer: KGNAI provides AI-generated analytics and educational market commentary only. This is not financial advice. Markets involve risk. Always do your own research.