
AUDCAD (Australian Dollar/Canadian Dollar) — Neutral, evidence-led technical and sentiment read (29-May-2026)
KGNAI Signal + Technical Snapshot + News Sentiment Digest
As of: 29-May-2026
Ticker: AUDCAD
AUDCAD currently screens as Neutral across KGNAI’s short-, mid-, and long-horizon ranks, with technical evidence showing a constructive moving-average backdrop but muted momentum confirmation. The price/MA structure flags bullish state conditions (close above MA50 and MA50 above MA200), yet the momentum layer is less decisive: RSI(14) at 45.52 sits in neutral territory and the MACD histogram reads effectively flat (listed as -0.0000 / -3.172e-05), implying limited directional pressure. Volatility is also contained, with Bollinger Bandwidth at 0.0171, a regime that often favors mean-reversion unless a catalyst expands range. From a market-structure standpoint, the most actionable reference points remain the probabilistic zones around 0.9603 (support) and 0.9911 (resistance), where confirmation/invalidation becomes clearer. News sentiment is slightly positive-leaning but broadly neutral (0.072 average; 56% neutral), suggesting context rather than a standalone driver.
- Rank stance (Short / Mid / Long): Neutral / Neutral / Neutral (daily rank #626; weekly #276; yearly #422 out of 950).
- Technical confluence: Neutral (18-signal confluence 0.000; overall technical score 0.096).
- Key levels: Support near 0.9603 and resistance near 0.9911.
- News sentiment bias: Slightly positive-leaning but mostly neutral (0.072 avg; 25% positive / 56% neutral / 19% negative).
- Confirmation / invalidation: A sustained move above 0.9911 supports continuation conditions; a close below 0.9603 increases deterioration risk.
KGNAI evaluates assets using large cross-sectional datasets built from millions of structured data points. Inputs incorporate fundamental metrics, technical structures, and systematically processed news sentiment. Statistical models, machine learning, and AI frameworks are used to assess relative positioning, signal alignment, and probabilistic behavior across broad universes.
- Ranks are comparative across the tracked universe, not absolute price targets.
- Confluence reflects alignment among independent signal groups.
- Support/resistance levels are probabilistic decision zones, not guarantees.
- Sentiment provides contextual bias within the broader analytical framework.
1) KGNAI AI Analysis
Region: FOREX
Total universe size: 950 ranked instruments
- Daily rank: #626 out of 950 — Neutral
- Weekly rank: #276 out of 950 — Neutral
- Monthly rank: #303 out of 950 — Neutral
- 3-Monthly rank: #441 out of 950 — Neutral
- 6-Monthly rank: #408 out of 950 — Neutral
- Yearly rank: #422 out of 950 — Neutral
Cross-horizon ranks cluster in the neutral middle of the universe, with the weekly rank at #276 standing out as relatively stronger than the daily reading at #626. That spread is consistent with a market that has improved versus peers on an intermediate basis but is not yet sustaining the same relative strength day-to-day. The monthly rank (#303) aligns more with the weekly profile than with the daily, suggesting that the short-term softness may be more noise than regime change—though not enough evidence is present to reclassify the state away from Neutral.
Longer-horizon placements (3-month #441, 6-month #408, yearly #422) sit in a similar band, implying no strong drift toward either persistent outperformance or persistent underperformance across the broader FX universe. In practical terms, this is the kind of rank configuration typically associated with range-compatible behavior—where the next directional resolution is more likely to depend on a break of key technical levels than on an already-established, high-conviction trend classification.
The key analytical nuance is the lack of rank acceleration. If a trend were strengthening decisively, ranks would more often compress toward the upper quartile (lower rank numbers) across multiple horizons, rather than remaining mixed with a weak daily position. Until that compression appears, the more disciplined read is to treat AUDCAD as a neutral relative-strength instrument where validation is level-dependent.
KGNAI ranks each instrument across large universes using multiple proprietary AI tests and statistical models (millions of data points). Lower ranks generally indicate stronger probability of favorable performance behavior, while higher ranks indicate weaker probability and more bearish positioning.
Term view: Short-term: Neutral. Mid-term: Neutral. Long-term: Neutral.
Want the full universe and complete rank tables? Unlock full access on KGNAI: https://www.kgnai.com/pricing
2) Price & trend overview
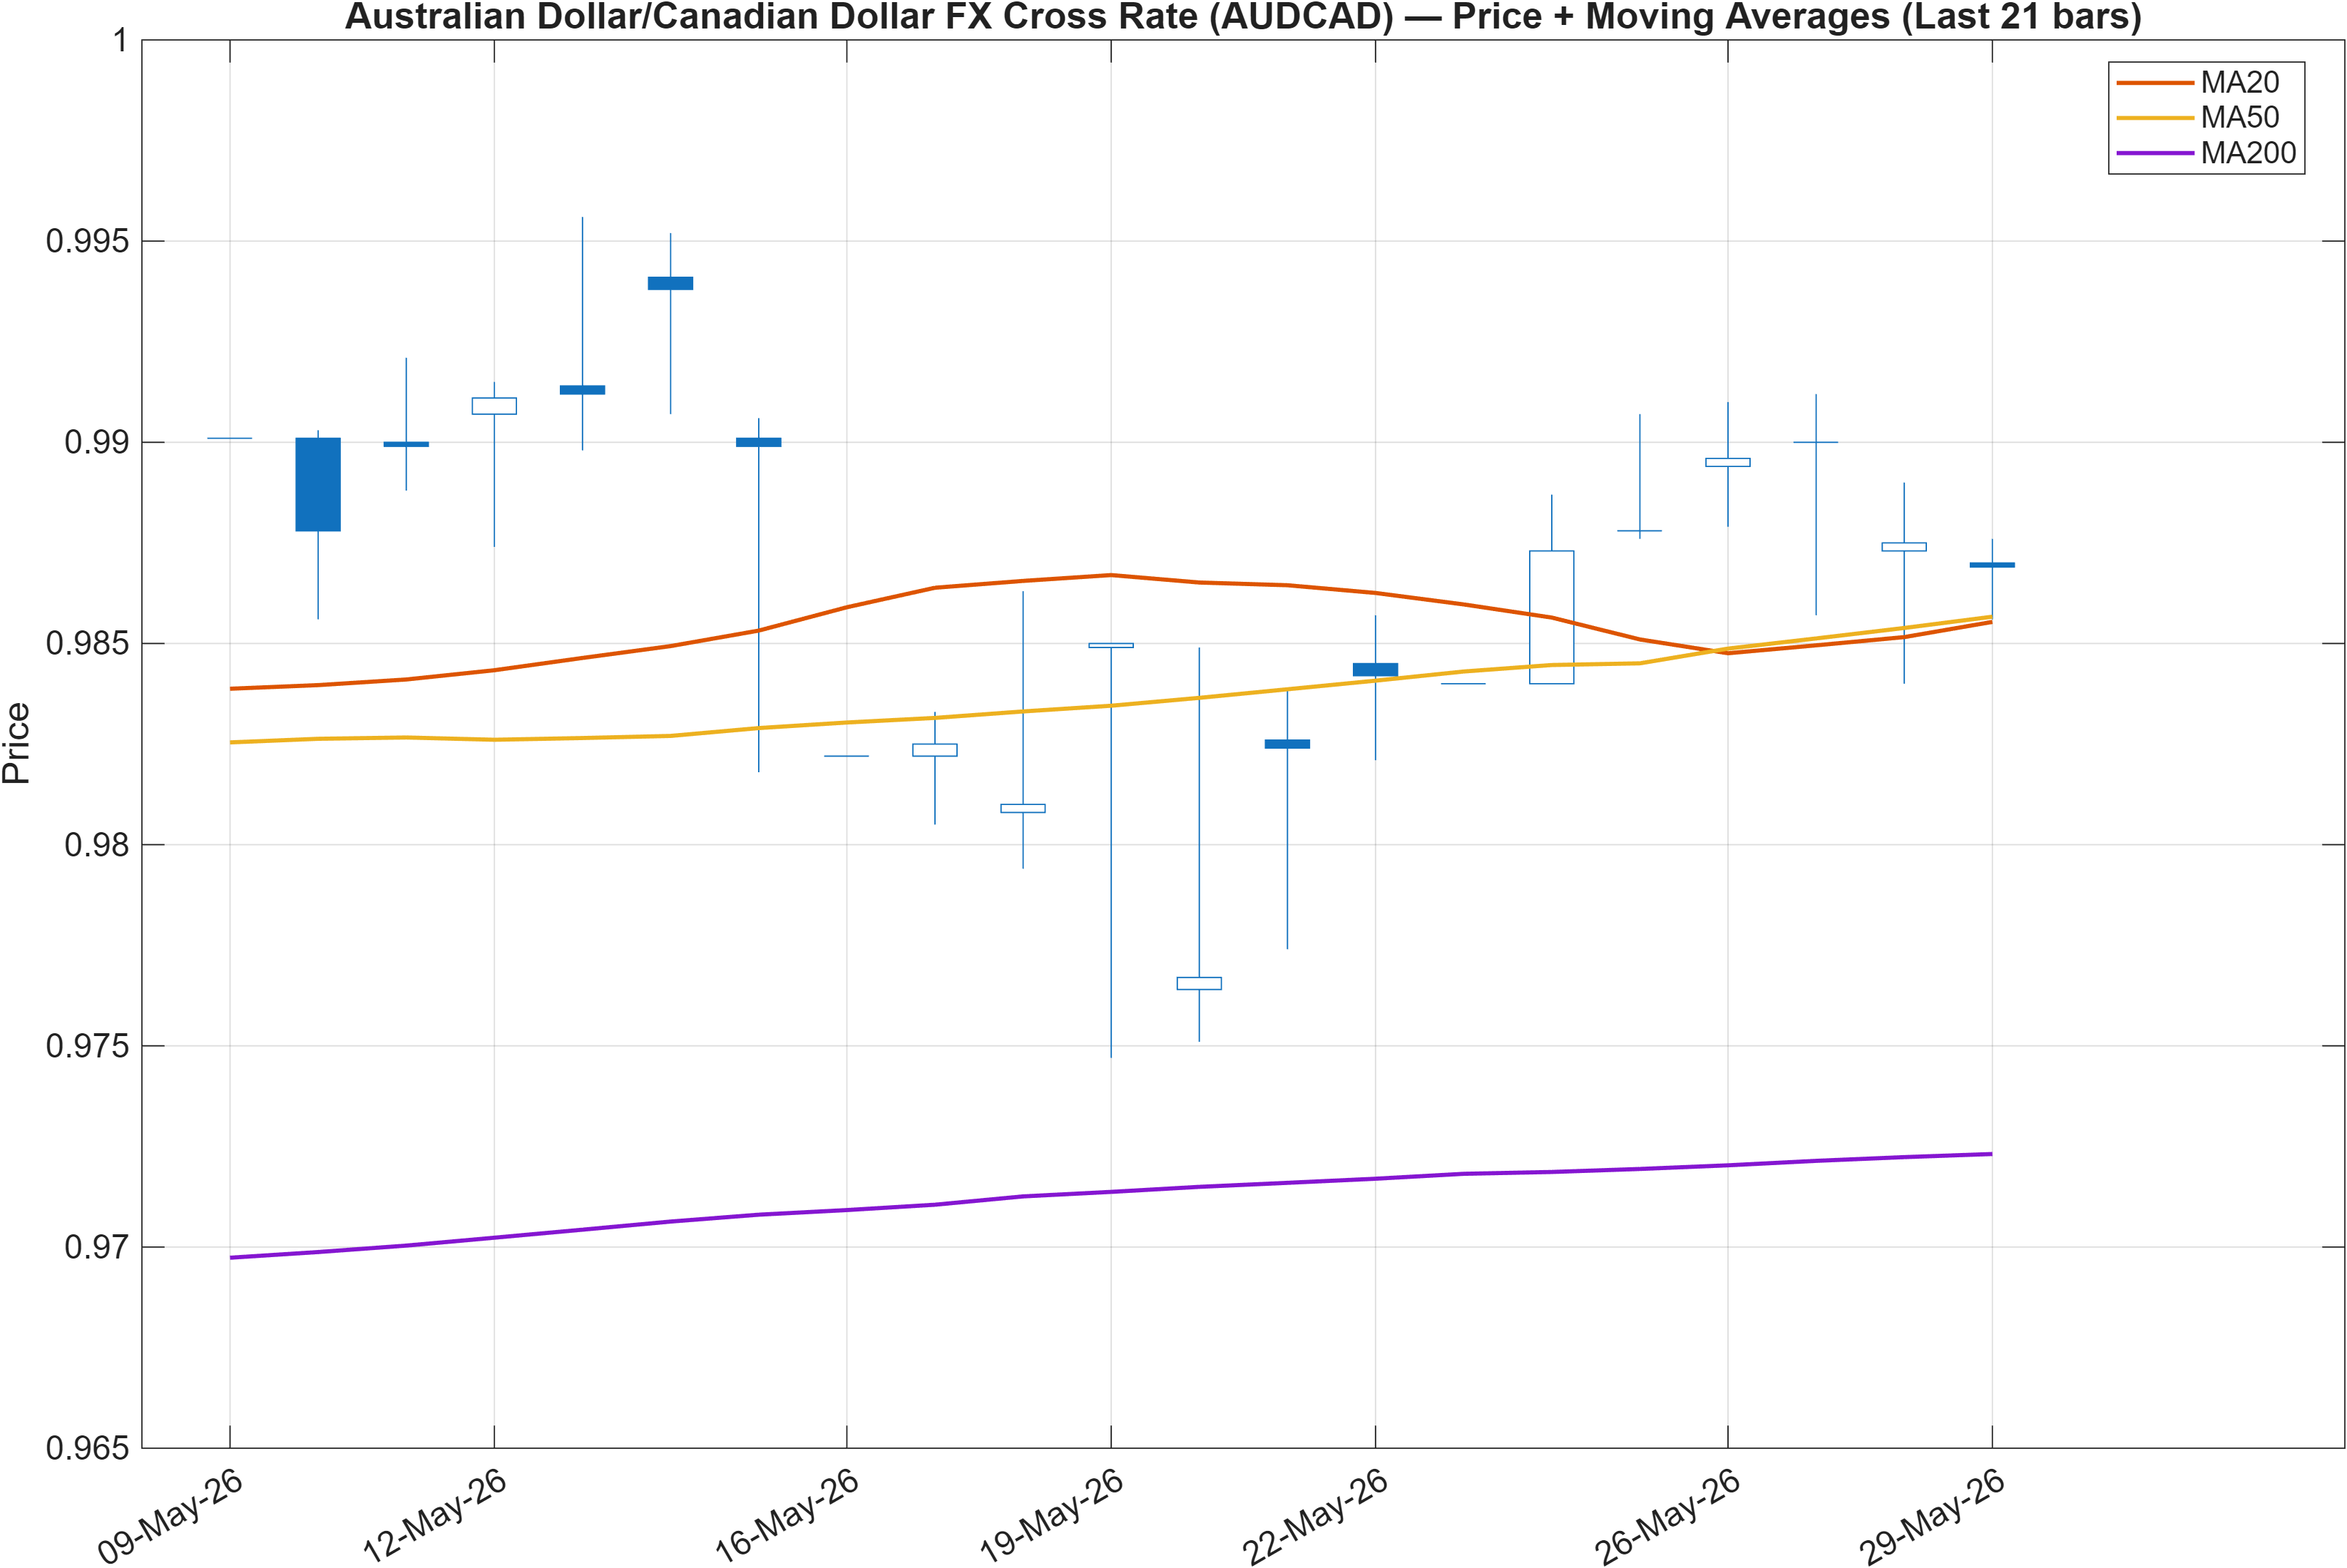
The trend layer is constructive on a state basis: the interpretation flags close vs MA50 = Bullish and MA50 vs MA200 = Bullish. This configuration is typically associated with a market holding above intermediate trend support while maintaining a favorable longer-term moving-average slope relationship. However, a bullish moving-average stack does not automatically imply strong follow-through—particularly when momentum and rank signals are not concurrently upgrading.
The most useful way to frame this setup is alignment versus divergence. Trend state is positive, yet the broader classification remains Neutral across KGNAI horizons, and the overall technical score (later section) remains Neutral at 0.096. That combination often corresponds to a market that is structurally supported but not generating persistent impulse, i.e., it can hold trend conditions while oscillating within a bounded range.
In that environment, the distance to nearby decision zones matters more than extrapolating the moving-average relationship. The support/resistance references at 0.9603 and 0.9911 function as the practical “stress tests” for the bullish MA state: holding above support preserves the trend scaffolding; repeated failures near resistance can turn the bullish stack into a stall rather than continuation.
From a regime perspective, the backdrop here is best described as trend-capable but not trend-confirmed. Confirmation would typically show up as improving short-horizon rank (moving meaningfully off #626) alongside momentum indicators shifting from neutral/slightly negative toward clear positive readings.
Interpretation: Close vs MA50 = Bullish, MA50 vs MA200 = Bullish.
3) Momentum & volatility dashboard
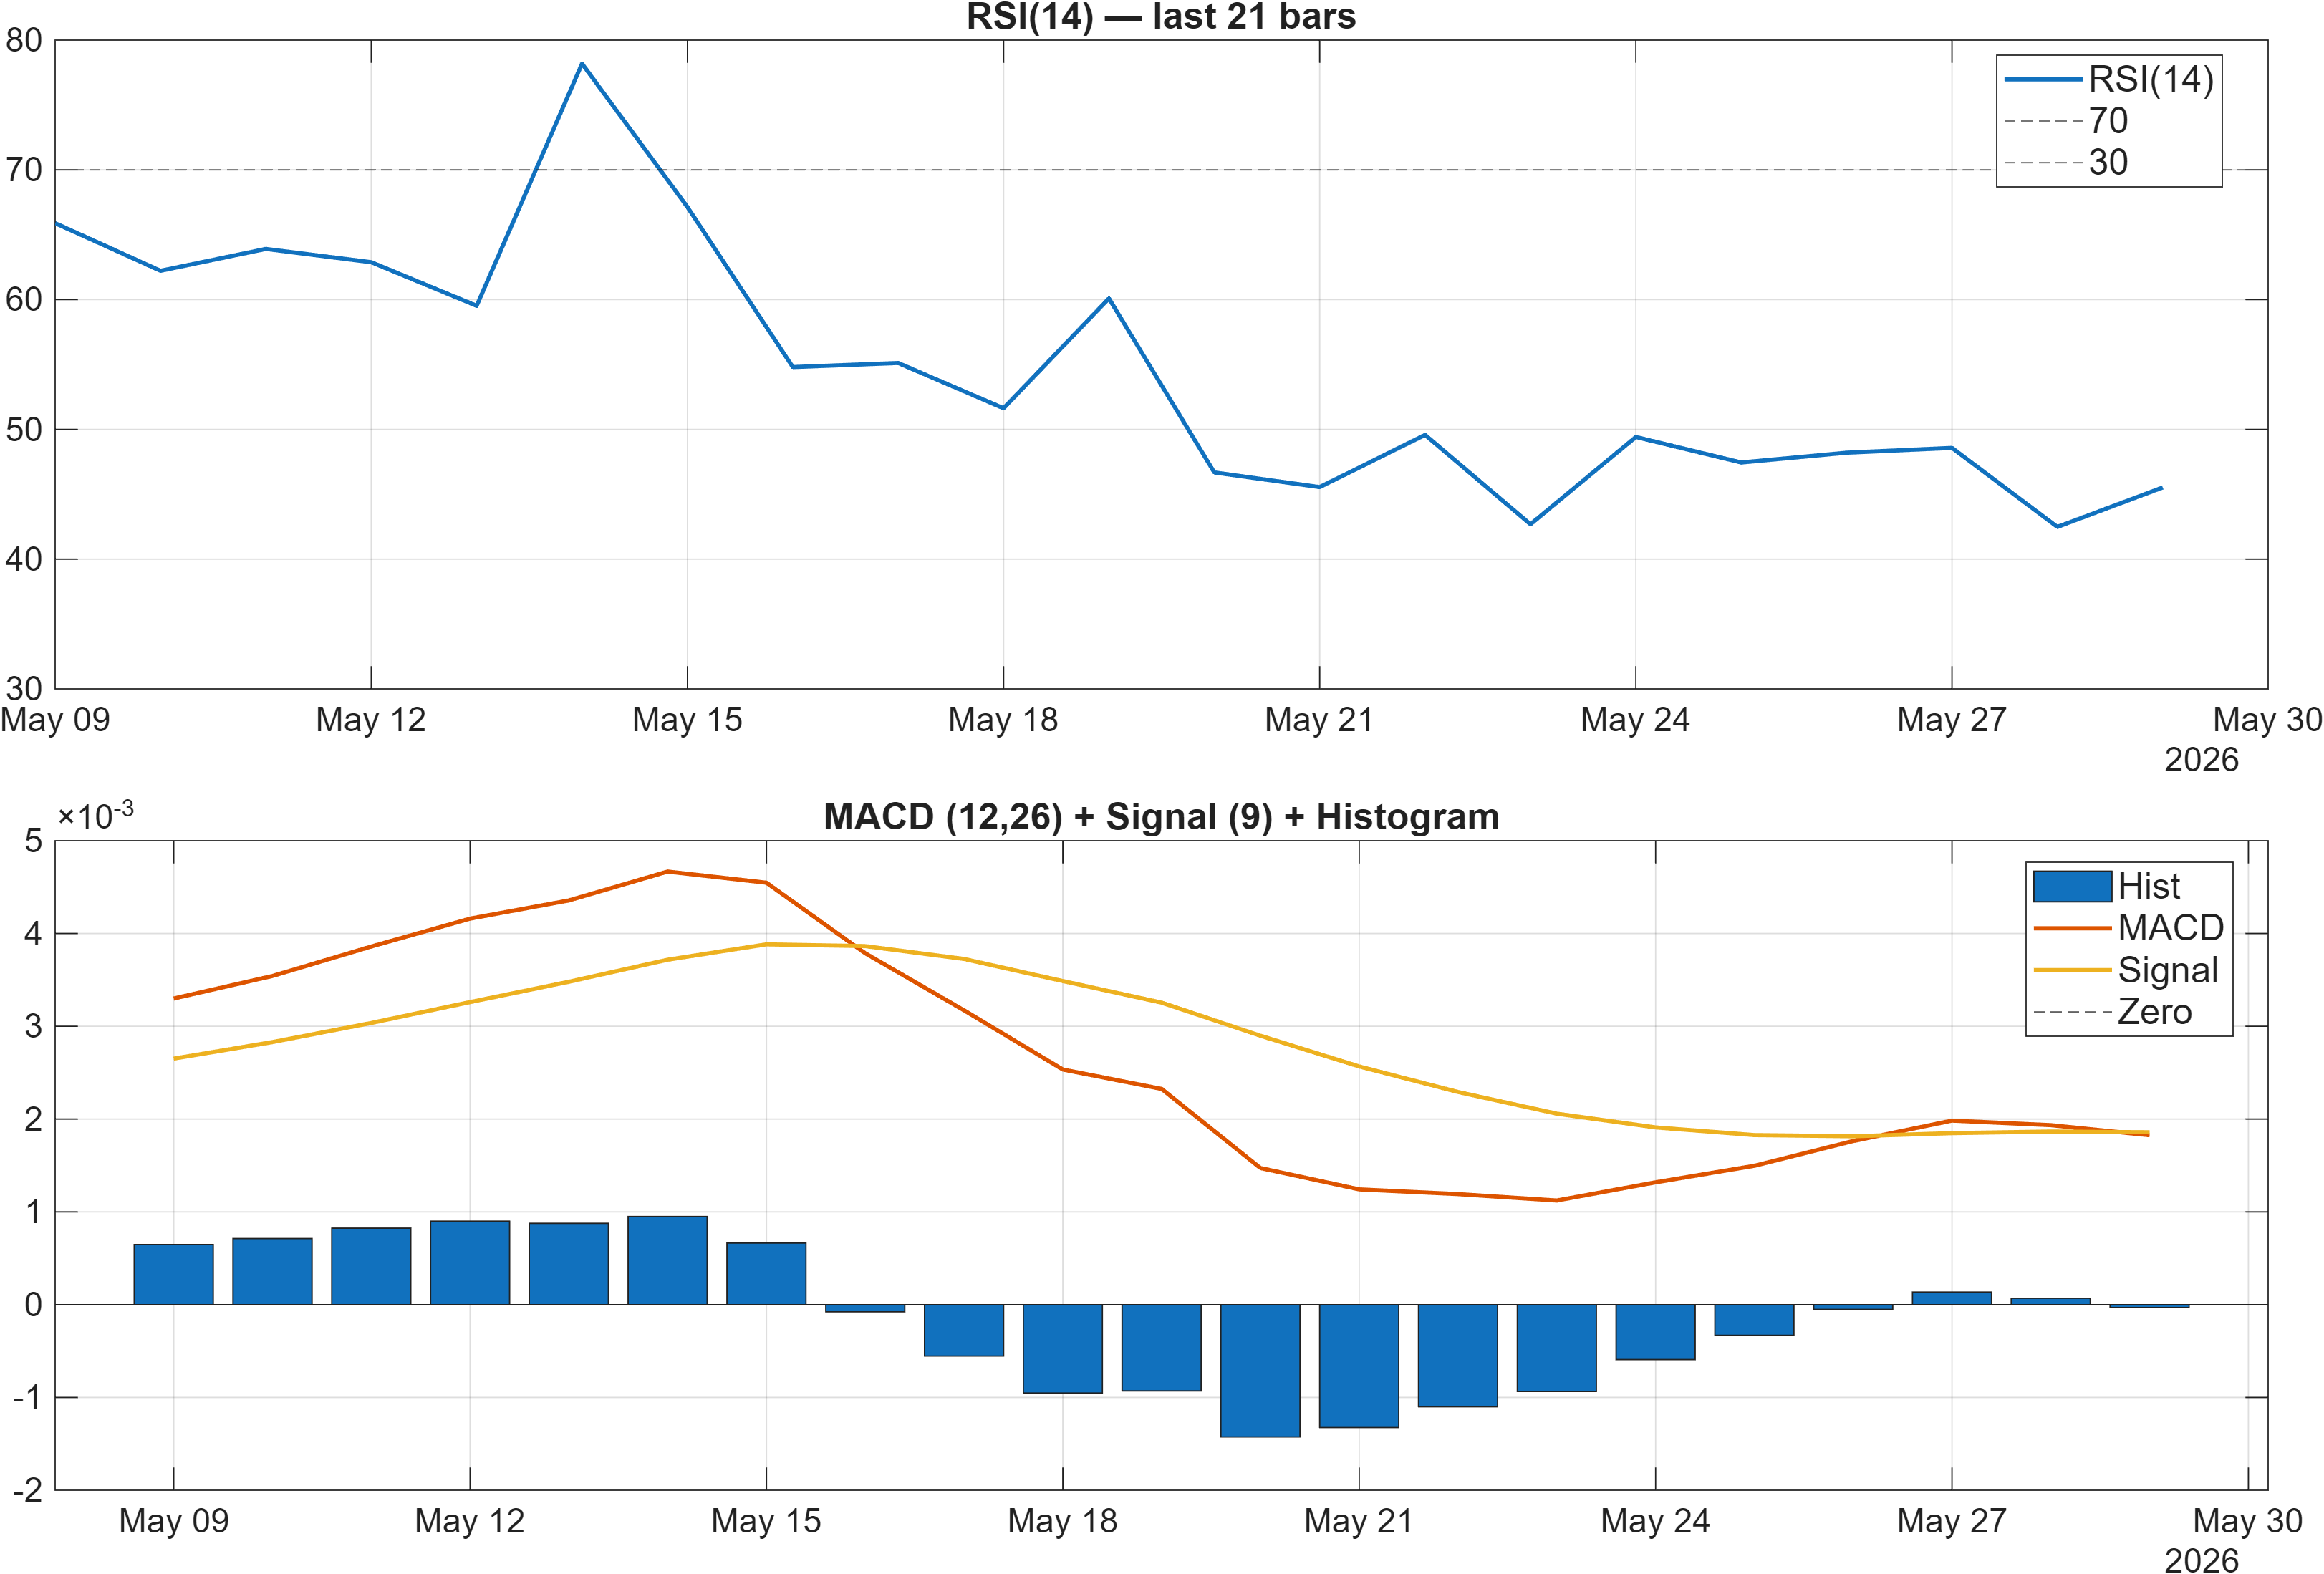
Momentum signals are subdued, and that restraint is a key reason the report remains neutral despite the bullish moving-average state. RSI(14) is 45.52, which is neither oversold nor overbought and sits slightly below the midline—often consistent with consolidation or a mild risk-off bias rather than persistent buying pressure. At the same time, the MACD histogram is effectively flat (interpretation shows -0.0000; the signal table lists -3.172e-05), suggesting limited separation between fast and slow momentum components.
The second layer is volatility regime. Bollinger Bandwidth is 0.0171, indicating relatively tight bands. In market-structure terms, low bandwidth can precede expansion, but it does not specify direction; it primarily highlights that breakouts require confirmation because false moves are common when volatility is compressed.
Within the 18-signal set, multiple momentum/velocity measures lean negative: TS Mom(20) at -0.0009 and ROC(20) at -0.1417 are both flagged Bearish in the signal table. When these coexist with a neutral RSI and a near-zero MACD histogram, the read is less “downtrend” and more insufficient upside impulse for trend continuation.
The actionable takeaway is that AUDCAD’s next higher-quality signal likely requires either (a) momentum improving while volatility stays contained (supporting a grind higher), or (b) volatility expansion that resolves through the key levels in Section 4. Without one of those, the current configuration favors patience and level discipline over directional conviction.
Interpretation: RSI bias = Neutral, MACD hist = -0.0000.
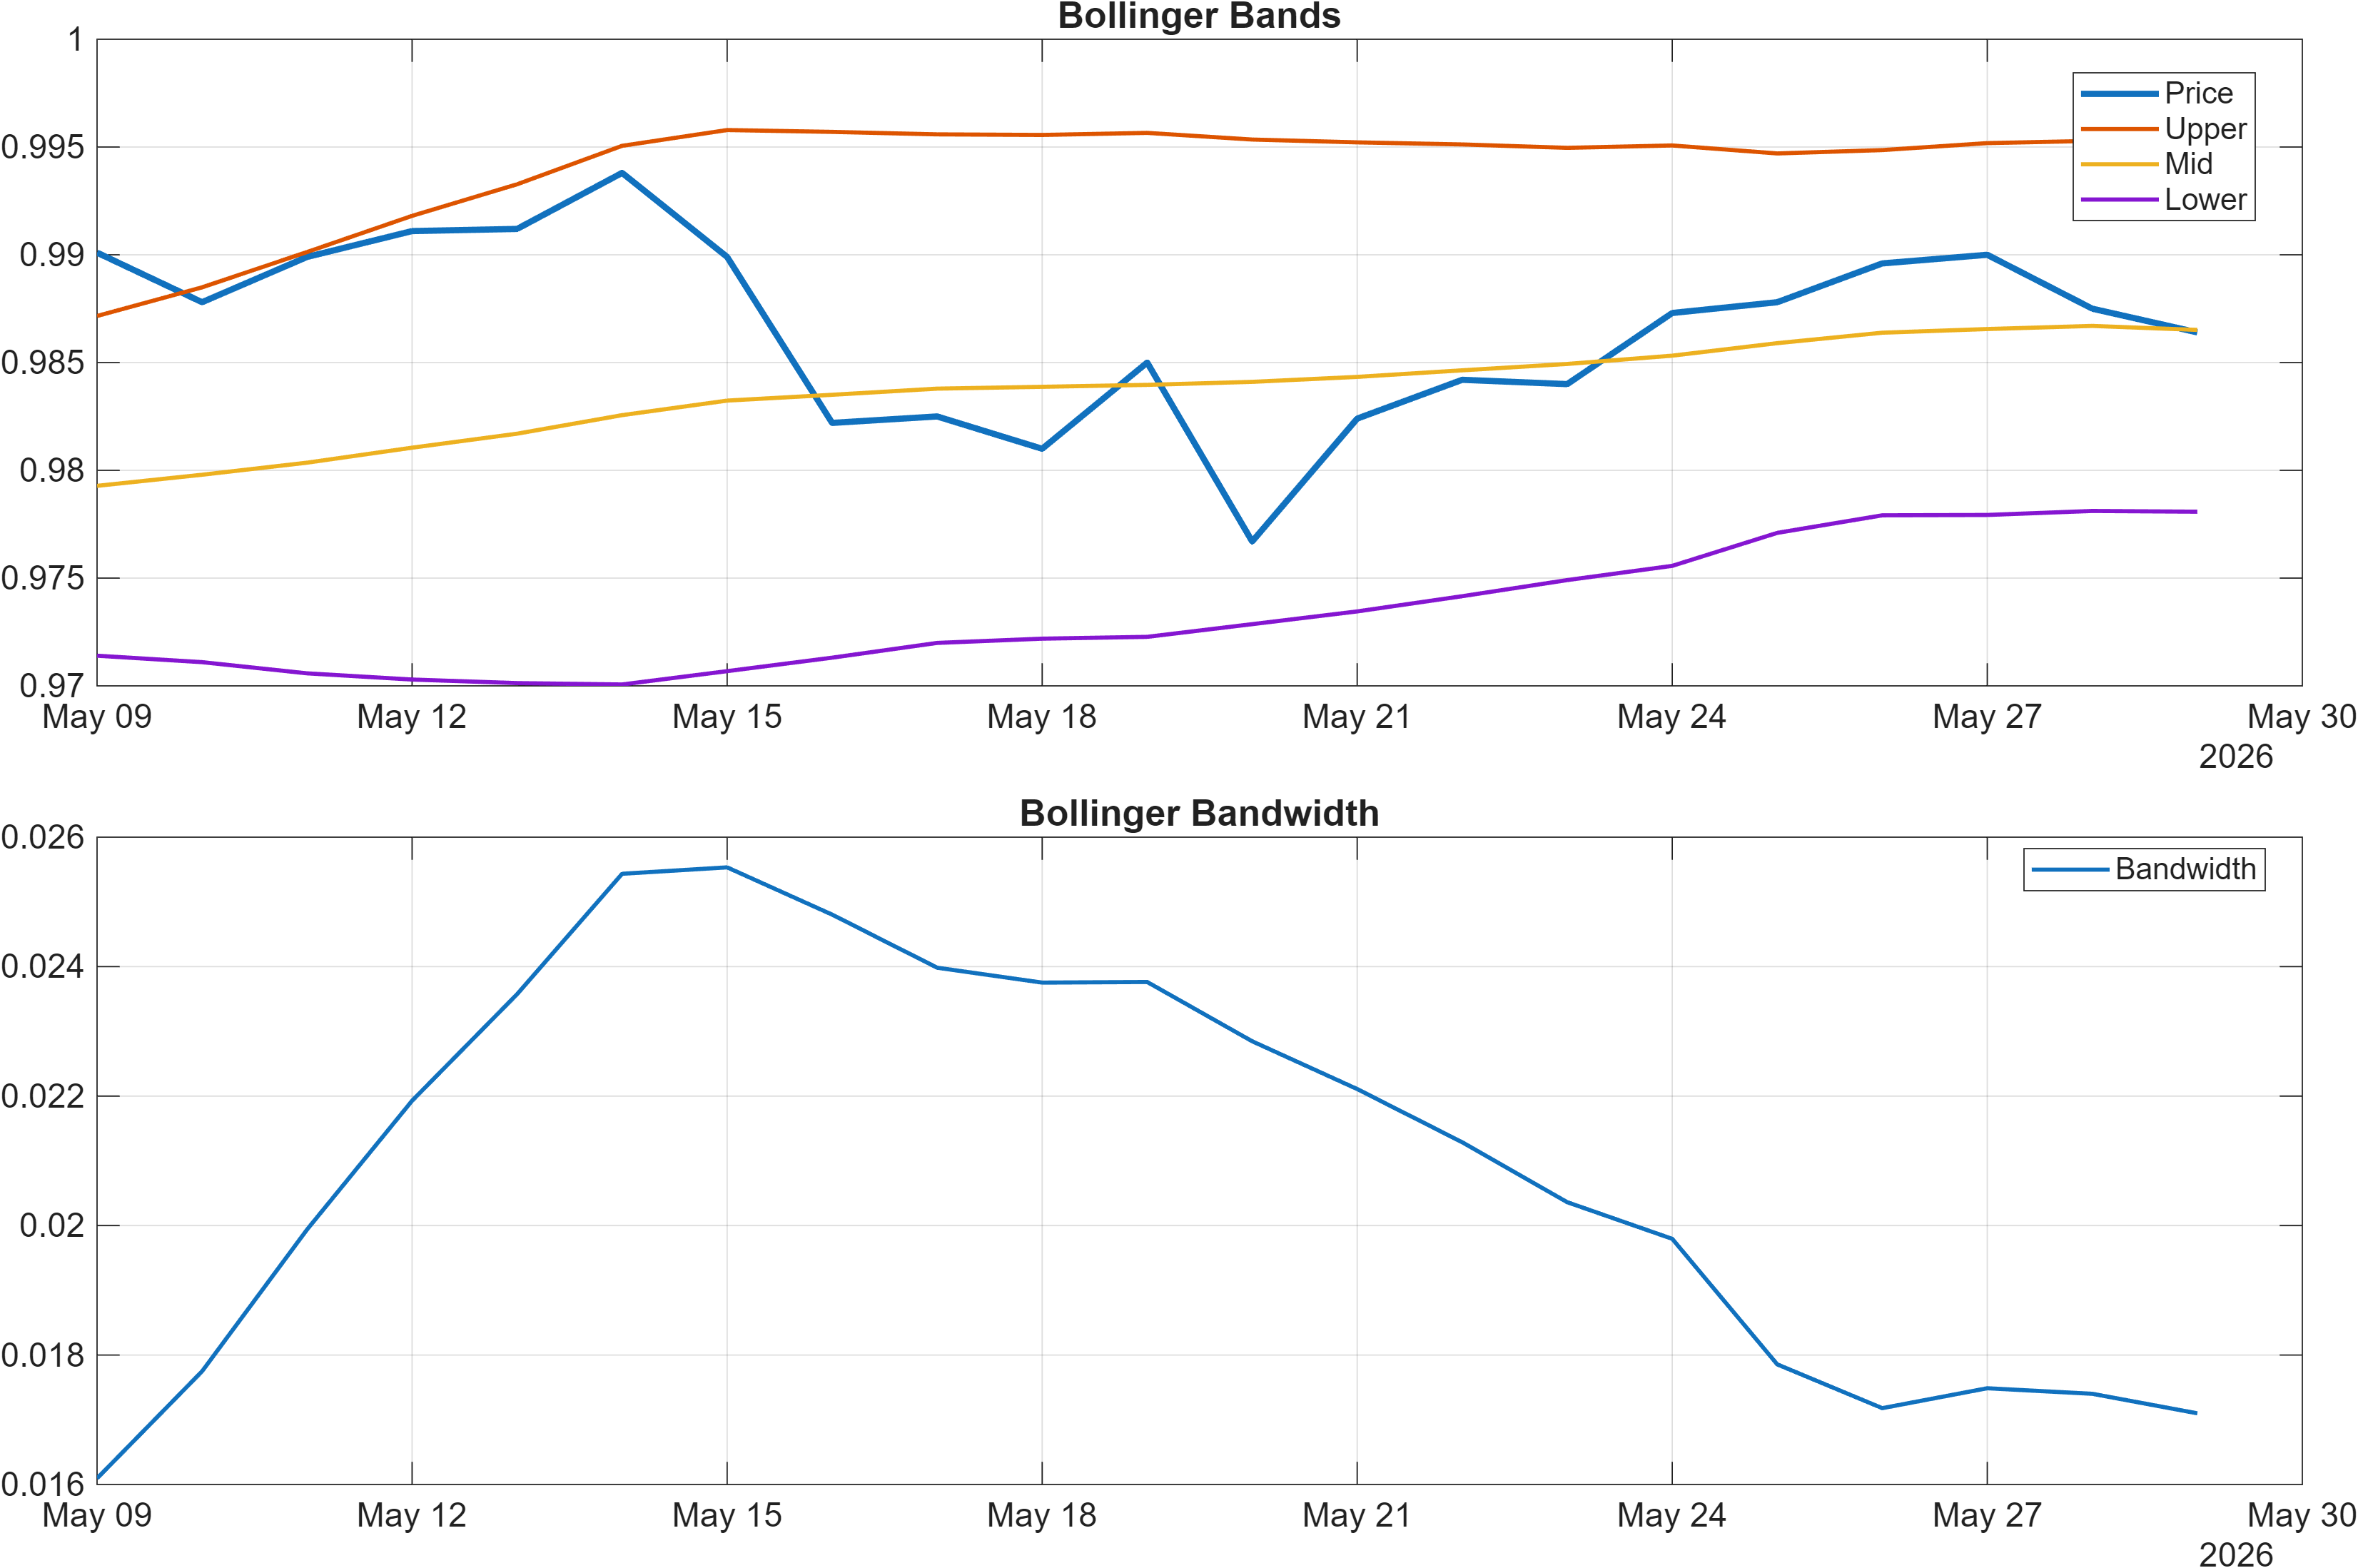
Interpretation: Bandwidth (volatility regime) latest = 0.0171.
4) Support / Resistance zones
Support ~ 0.9603 | Resistance ~ 0.9911
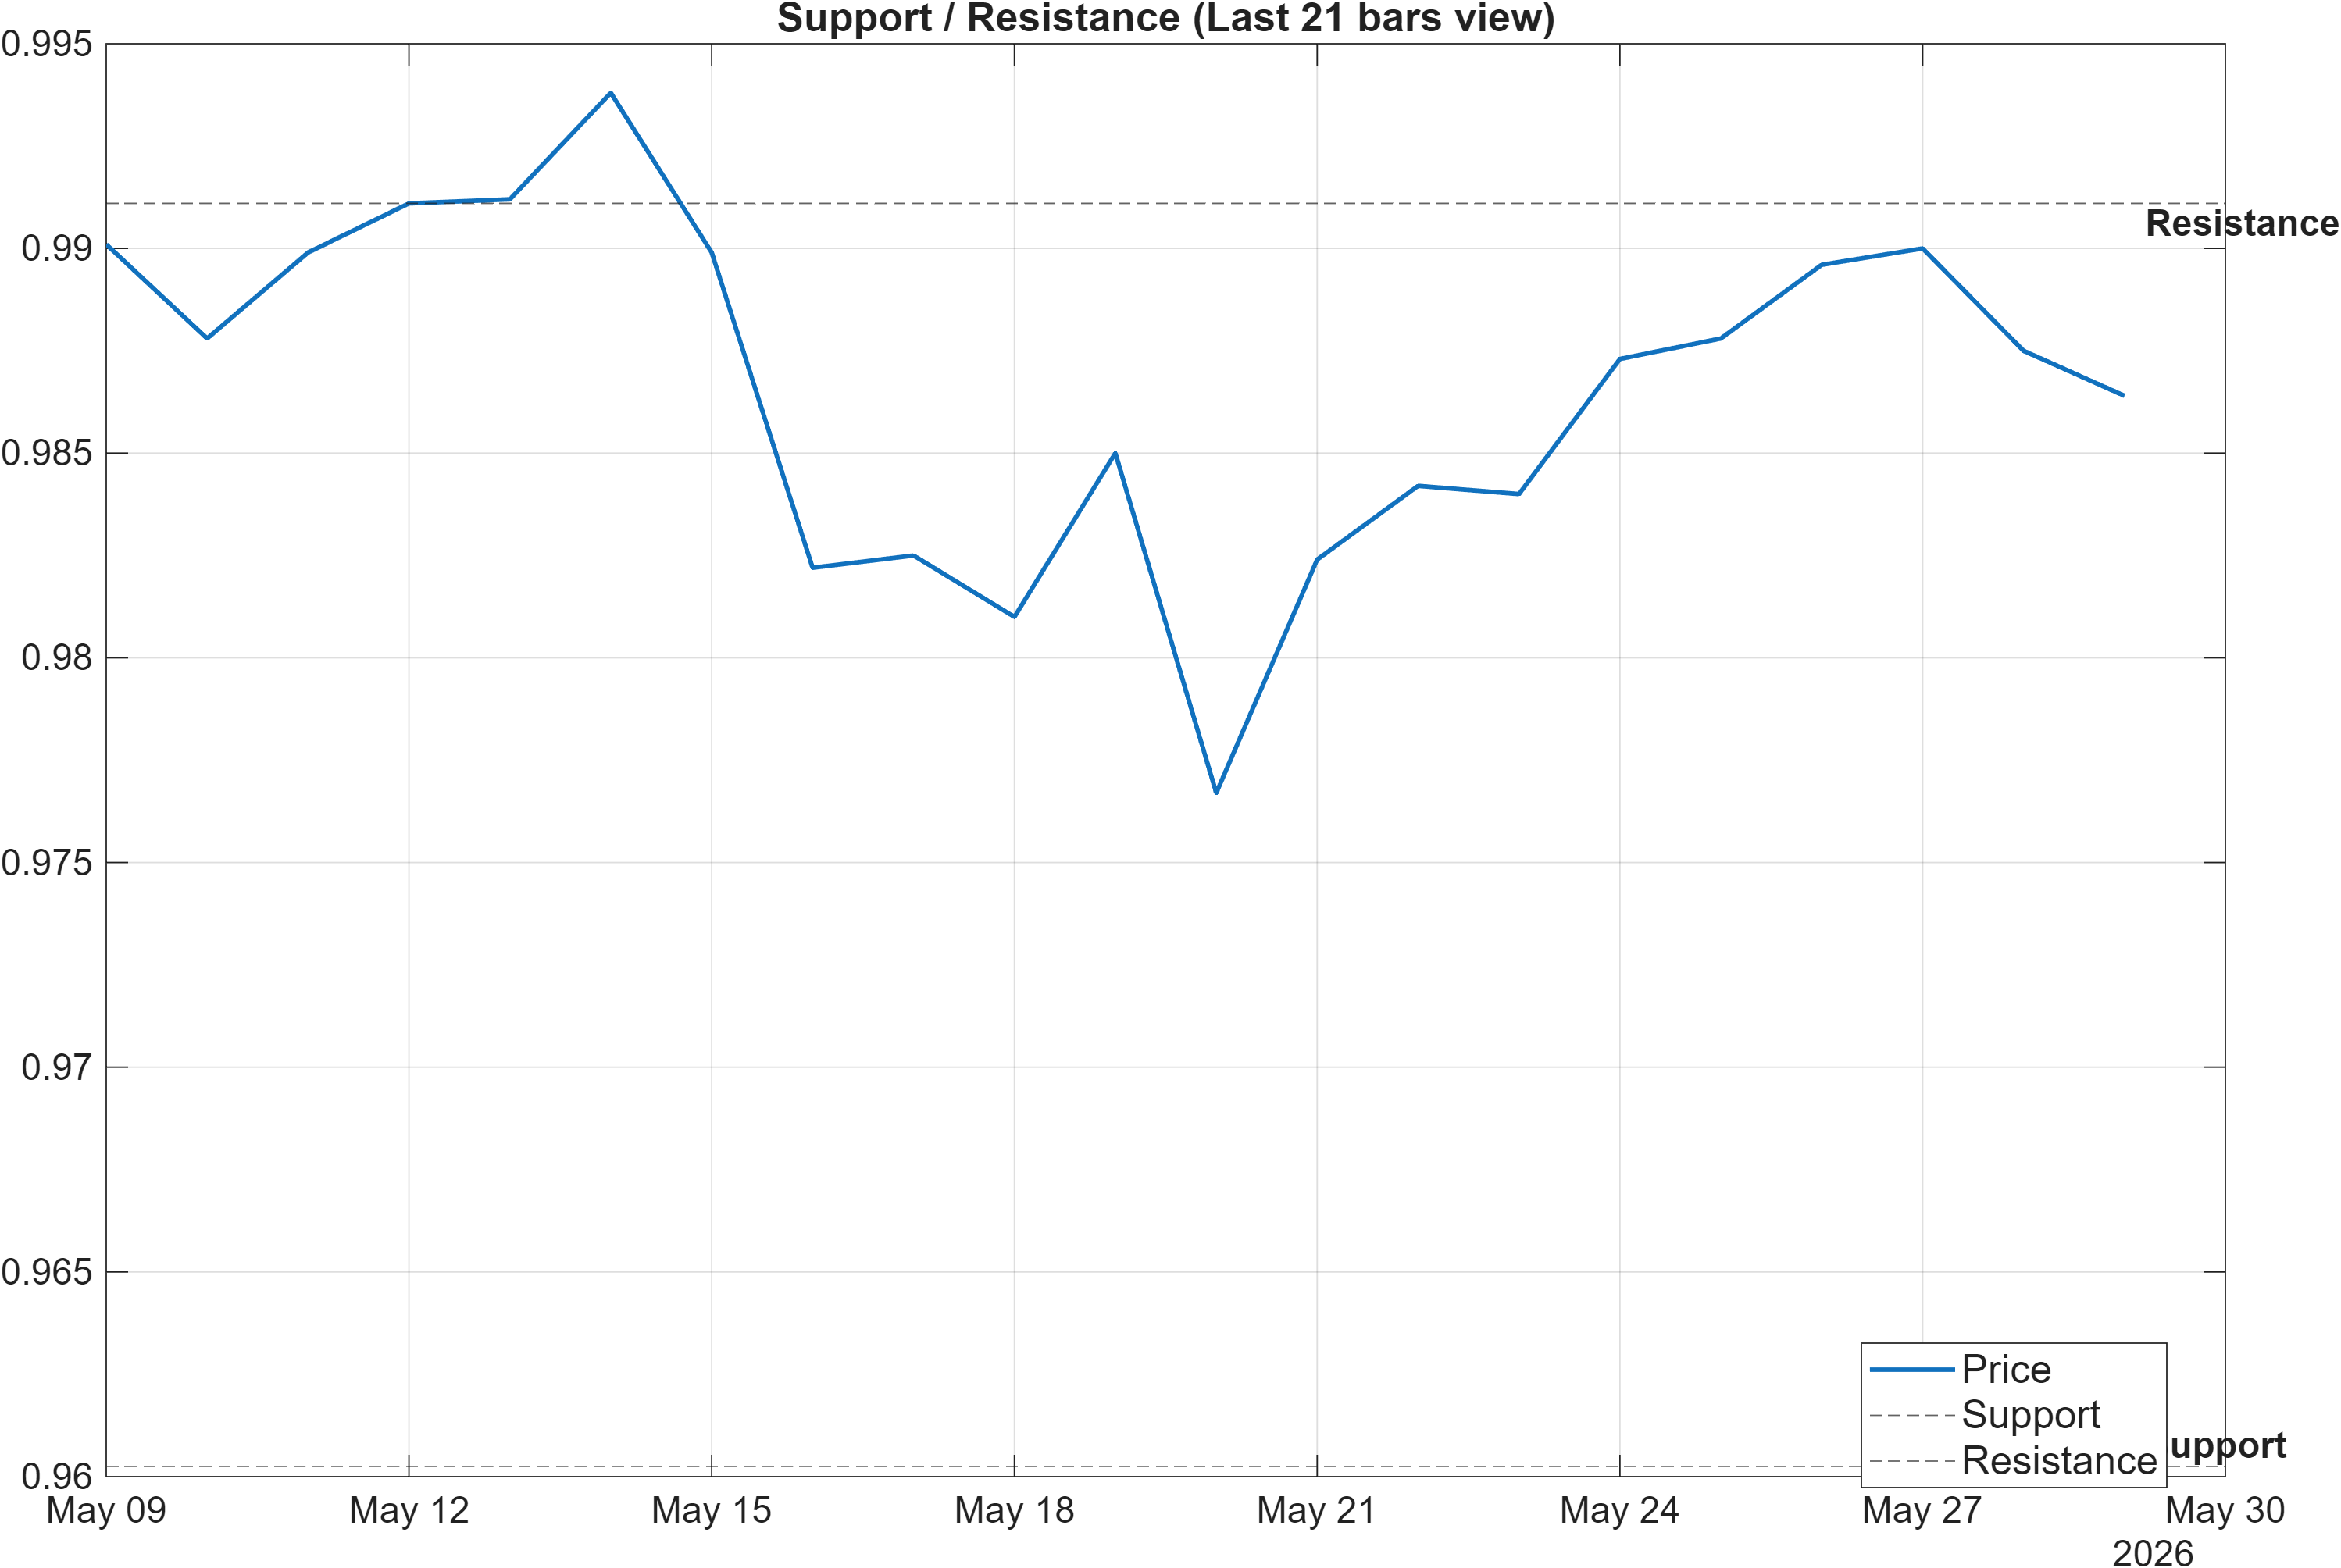
The current technical picture becomes most interpretable when anchored to the two primary decision zones: 0.9603 (support) and 0.9911 (resistance). With volatility tight (bandwidth 0.0171) and confluence neutral (18-signal score 0.000), these levels act less like “targets” and more like validation boundaries for whether the bullish moving-average state can translate into continuation.
A market holding above support while probing resistance tends to indicate that dip-buying remains effective, but in AUDCAD the momentum layer is not offering strong reinforcement: RSI(14) at 45.52 and a near-zero MACD histogram imply that upside attempts may lack follow-through unless breadth/participation improves. In the signal table, the mixed internal picture—Bearish readings in TS Accel (-0.01) and ROC(20) (-0.1417), offset by Bullish MedPx vs Support (0.02635)—supports a view of level-dependent balance.
Because ranks are neutral across horizons (for example, weekly #276 versus daily #626), the more robust framework is to treat 0.9911 as the “continuation gate” and 0.9603 as the “structure break” level. Price behavior around these zones carries more information than mid-range fluctuations—especially in a compressed volatility regime.
If the cross repeatedly rejects near resistance without improving momentum, that pattern tends to reinforce range behavior. Conversely, a sustained hold above resistance would reduce the probability that the bullish MA stack is merely lagging consolidation. A close below support would be inconsistent with the constructive trend state and would increase the odds of a broader deterioration consistent with the weaker daily rank.
Scenario view: Break above resistance with volume → continuation. Close below support → signal deterioration risk.
5) Quant Technical Dashboard (18 Signals)
KGNAI AI Technical Analysis Score (Deep Reinforcement Learning): Rank #323 out of 950 (Rank 1 represents the strongest technical positioning and a higher probability of favorable price behavior. As ranks increase toward the maximum, the probability of favorable outcomes weakens and bearish positioning becomes more dominant.) | Label: Neutral | Score: 0.320
18-Signal Technical Confluence Score: 0.000 (Neutral)
Overall Technical Score (18-signal confluence + DRL rank blend): 0.096 (Neutral)
Note: The blended score reflects signal strength weighted against broader AI technical ranking, which may temporarily diverge.
Blended technical score breakdown: 0.096 (Neutral | Bull 4 / Bear 4 / Neutral 10)
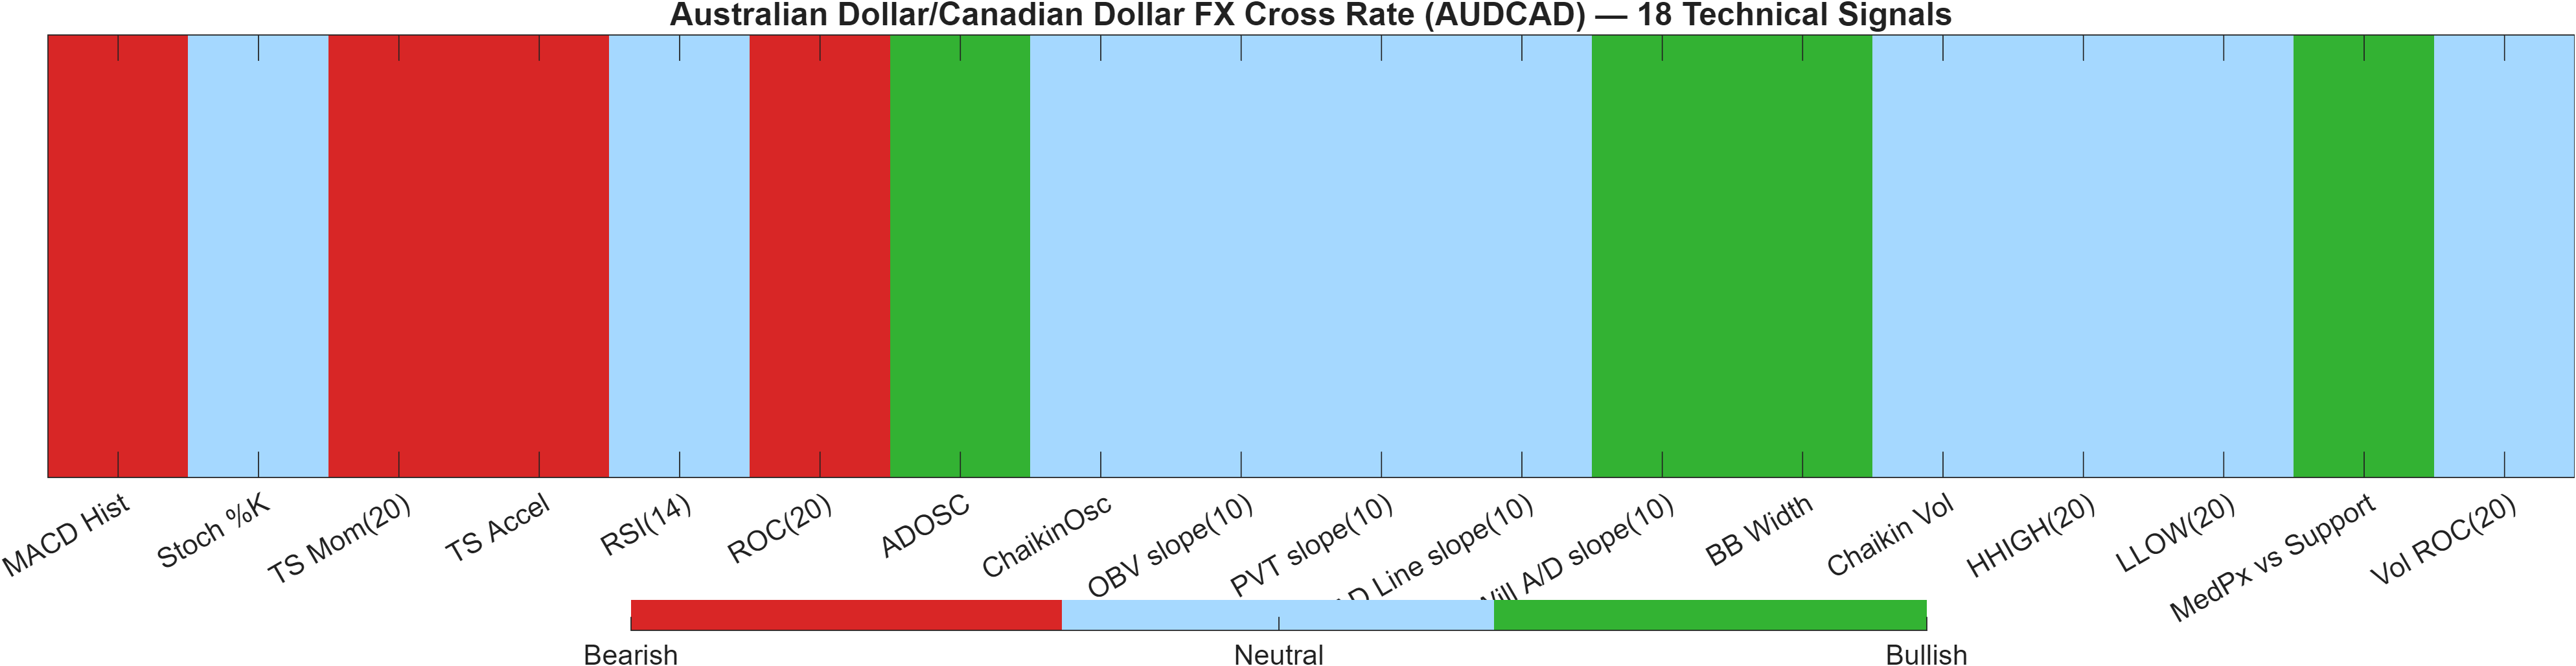
The technical dashboard is best read as a balance-of-evidence rather than a single-indicator verdict. The Deep Reinforcement Learning technical rank at #323 (score 0.320) places AUDCAD around the mid-pack of the 950-instrument universe—consistent with a neutral classification, but not weak enough to imply persistent bearish control. Meanwhile, the 18-signal confluence prints 0.000 and the blended overall technical score sits at 0.096, reinforcing the idea that signals are mixed and largely non-committal.
Internally, the distribution Bull 4 / Bear 4 / Neutral 10 is a classic “compression” profile: enough disagreement to prevent a directional label upgrade, but also enough constructive elements to keep downside calls unconfirmed. The most informative bear-side contributors are momentum/velocity measures—MACD histogram (-3.172e-05), TS Mom(20) (-0.0009), and ROC(20) (-0.1417)—which align with Section 3’s message that upside impulse is not yet dominant.
On the constructive side, accumulation/positioning proxies include ADOSC at 47.5 (Bullish) and Will A/D slope(10) at 0.006 (Bullish), while MedPx vs Support at 0.02635 suggests price remains meaningfully above its referenced support zone. Notably, BB Width at 0.0171 is tagged Bullish within the table even as it describes a low-volatility regime; analytically, that should be interpreted as conditions that can support trend persistence if a breakout is confirmed, rather than a standalone directional forecast.
The key decision is whether the mixed internals begin to tilt: improvements in momentum (MACD/ROC) alongside sustained behavior above resistance would likely be required to move the blended score meaningfully away from 0.096 and out of the neutral band.
Signal table (Bull/Bear/Neutral)
| Indicator | Value | Signal |
|---|---|---|
| MACD Hist | -3.172e-05 | Bearish |
| Stoch %K | 73.29 | Neutral |
| TS Mom(20) | -0.0009 | Bearish |
| TS Accel | -0.01 | Bearish |
| RSI(14) | 45.52 | Neutral |
| ROC(20) | -0.1417 | Bearish |
| ADOSC | 47.5 | Bullish |
| ChaikinOsc | 0 | Neutral |
| OBV slope(10) | 0 | Neutral |
| PVT slope(10) | 0 | Neutral |
| AD Line slope(10) | 0 | Neutral |
| Will A/D slope(10) | 0.006 | Bullish |
| BB Width | 0.0171 | Bullish |
| Chaikin Vol | -35.91 | Neutral |
| HHIGH(20) | 0.9956 | Neutral |
| LLOW(20) | 0.9747 | Neutral |
| MedPx vs Support | 0.02635 | Bullish |
| Vol ROC(20) | — | Neutral |
Interpretation: Indicator-level signals form the base confluence, which is then adjusted using a separate AI-driven technical ranking model. The final technical score summarizes this combined view.
6) News sentiment + extractive gist
Note: Instrument-specific news matches were not found, so the digest includes broader market/sector headlines. Links are provided for verification.
Sentiment score (avg): 0.072 | Positive: 25% | Neutral: 56% | Negative: 19%
KGNAI AI News Sentiment Score (normalized -1 to +1): Not available (as of —) | Label: Not available | Overall news score: 0.07
Positive Developments
Recent coverage across major financial outlets indicates a modest improvement in broad risk tone, helped by signs of easing inflation pressure at the margin and intermittent optimism around de-escalation narratives. For AUDCAD specifically, that backdrop can matter because the cross often reflects the relative balance between commodity-linked currencies and global risk appetite. A sentiment mix with 25% positive and an average score of 0.072 suggests the news flow is not strongly directional, but it is not uniformly defensive either. Where the tone is constructive, it generally clusters around softer inflation surprises, stable-to-lower yields, and episodic risk-on behavior—conditions that can support higher-beta FX and compress volatility. In a chart context where Bollinger Bandwidth is already tight at 0.0171, even a mild improvement in macro tone can become the incremental catalyst that tests resistance rather than immediately changing the regime.
Neutral / Mixed Developments
A large portion of the digest remains informational, consistent with the 56% neutral share in the sentiment breakdown. The dominant implication for AUDCAD is that macro inputs are currently providing context rather than direction: market participants appear to be balancing cross-currents such as commodity price fluctuations, shifting expectations for central-bank paths, and intermittent demand for defensive currencies when uncertainty rises. This fits the broader technical message of a neutral confluence score (0.000) and a mid-pack AI technical rank (#323). In this kind of environment, the market often responds more cleanly to price-level confirmation (e.g., 0.9911 resistance) than to a single macro headline. Until the news flow skews persistently positive or negative, the most reliable use of the digest is to identify what could plausibly trigger volatility expansion.
Negative / Risk Signals
The risk layer in recent coverage is centered on geopolitical uncertainty and the possibility of abrupt shifts in safe-haven demand—factors that can quickly overwhelm an otherwise stable technical setup. While the negative share is not dominant (19%), it is sufficient to keep markets sensitive to adverse surprises, especially in a low-volatility regime (bandwidth 0.0171) where positioning can become complacent. For AUDCAD, these risk pulses can manifest as short, sharp moves that test support (0.9603) without necessarily establishing a persistent trend unless momentum confirms. The technical dashboard already shows some softness in rate-of-change metrics (e.g., ROC(20) -0.1417 and TS Accel -0.01 flagged Bearish), which means that if risk sentiment deteriorates, the market may have less “momentum buffer” to absorb downside pressure before structure is challenged.
- Whether price can sustain acceptance above 0.9911 while RSI(14) lifts from 45.52 toward stronger momentum conditions.
- Any volatility expansion from the current tight regime (bandwidth 0.0171) and whether it resolves above resistance or into support.
- Whether the daily rank (#626) improves toward the weekly/monthly neighborhood (#276/#303), indicating cross-horizon strengthening.
Sources referenced: Reuters, Bloomberg, Yahoo Finance, MarketWatch, Investing.com
Snapshot: AI Rank (Short–Mid–Long): Neutral (Neutral–Neutral–Neutral) · Technical Confluence: Neutral · Key Levels: Support ~0.96 | Resistance ~0.99 · News Sentiment: Neutral
7) Sources
- WTI Price Forecast: Struggles near one-month low, vulnerable around $87.00/below 50% Fibo. — https://www.fxstreet.com/news/wti-price-forecast-struggles-near-one-month-low-vulnerable-around-8700-below-50-fibo-202605290408
- AUD/JPY Price Forecast: Declines to near 114.00, while maintaining bullish technical bias — https://www.fxstreet.com/news/aud-jpy-price-forecast-declines-to-near-11400-while-maintaining-bullish-technical-bias-202605290405
- Swiss Franc declines as market caution lifts USD — https://www.fxstreet.com/news/swiss-franc-declines-as-market-caution-lifts-usd-202605290341
- Gold pauses recovery as firm US inflation reaffirms Fed hike bets amid Iran uncertainty — https://www.fxstreet.com/news/gold-pauses-recovery-as-firm-us-inflation-reaffirms-fed-hike-bets-amid-iran-uncertainty-202605290341
- USD/JPY Price Forecast: Sees more upside towards 160.70 — https://www.fxstreet.com/news/usd-jpy-price-forecast-sees-more-upside-towards-16070-202605290319
- Silver Price Forecast: XAG/USD hovers around $76.00 as interest rate concerns ease — https://www.fxstreet.com/news/silver-price-forecast-xag-usd-hovers-around-7600-as-interest-rate-concerns-ease-202605290240
- United States Dollar Index strengthens as US and Iran agree to 60-day truce, Trump yet to approve — https://www.fxstreet.com/news/united-states-dollar-index-strengthens-as-us-and-iran-agree-to-60-day-truce-trump-yet-to-approve-202605290218
- RBNZ’s Breman signals earlier and steeper rate hikes — https://www.fxstreet.com/news/rbnzs-breman-signals-earlier-and-steeper-rate-hikes-202605290201
You may also like: How KGNAI AI ranks instruments across global markets
Disclaimer: KGNAI provides AI-generated analytics and educational market commentary only. This is not financial advice. Markets involve risk. Always do your own research.