LT (Larsen & Toubro Limited) — 12-Jun-2026 Technical Stance: Short-Term Bullish, Broader Structure Neutral
Larsen & Toubro Limited (LT) is currently characterized by a split signal set: KGNAI’s cross-sectional ranks lean Bullish in the short horizon (daily #205, weekly #163 out of 1220), while the mid-to-long horizon positioning remains Neutral (monthly #669; yearly #278). Technically, the dashboard shows confluence pressure to the downside (18-signal score -0.389, Bearish) even as the blended overall technical score stays Neutral (-0.259), suggesting the model is detecting both deterioration in momentum and the possibility of stabilization around key decision zones. Momentum gauges reinforce the caution: RSI(14) at 20.14 and MACD histogram at -14.4606 point to weak near-term impulse, while Bollinger bandwidth at 0.0711 signals a relatively contained volatility regime where breaks can become more meaningful. Key levels are well-defined at support ~3865.3333 and resistance ~4129.5500.
- Rank stance: Short-term Bullish (daily #205; weekly #163) | Mid-term Neutral (monthly #669; 3-month #418; 6-month #484) | Long-term Neutral (yearly #278)
- Technical confluence label: Bearish (18-signal score -0.389); blended overall technical score Neutral (-0.259)
- Key levels: Support ~3865.3333 | Resistance ~4129.5500
- News sentiment bias: Tape reads Neutral on distribution (avg 0.000; 100% Neutral) while normalized score flags Bullish (0.96)
- Confirmation / invalidation condition: A break above 4129.5500 with volume supports continuation bias; a close below 3865.3333 increases deterioration risk.
KGNAI evaluates assets using large cross-sectional datasets built from millions of structured data points. Inputs incorporate fundamental metrics, technical structures, and systematically processed news sentiment. Statistical models, machine learning, and AI frameworks are used to assess relative positioning, signal alignment, and probabilistic behavior across broad universes.
- Ranks are comparative across the tracked universe, not absolute price targets.
- Confluence reflects alignment among independent signal groups.
- Support/resistance levels are probabilistic decision zones, not guarantees.
- Sentiment provides contextual bias within the broader analytical framework.
1) KGNAI AI Analysis
Region: INDIA
Total universe size: 1220 ranked instruments
- Daily rank: #205 out of 1220 — Bullish
- Weekly rank: #163 out of 1220 — Bullish
- Monthly rank: #669 out of 1220 — Neutral
- 3-Monthly rank: #418 out of 1220 — Neutral
- 6-Monthly rank: #484 out of 1220 — Neutral
- Yearly rank: #278 out of 1220 — Neutral
LT’s ranking profile shows a time-horizon divergence that is common around inflection phases. The daily and weekly ranks (205 and 163) sit in the upper quartile of the 1220-instrument universe, indicating comparatively favorable short-run behavior versus peers. In contrast, the monthly rank (669) falls into the lower half, which tends to be consistent with either (a) a still-repairing trend structure, or (b) a market that is not yet rewarding the longer-duration exposure.
The intermediate windows remain Neutral (3-month #418; 6-month #484), suggesting the model does not see a dominant medium-term edge—more a balance between mean-reversion and trend-following forces. The yearly rank (#278) is also Neutral but comparatively stronger than the monthly reading, which can occur when recent weakness is more concentrated in the last few weeks than across the full year window.
Taken together, the rank stack supports a short-term constructive bias while treating the broader structure as not yet decisively resolved. In this configuration, follow-through matters: short-horizon strength tends to be more durable when it is later confirmed by improving medium-horizon ranks rather than remaining isolated at the front end.
2) Price & trend overview
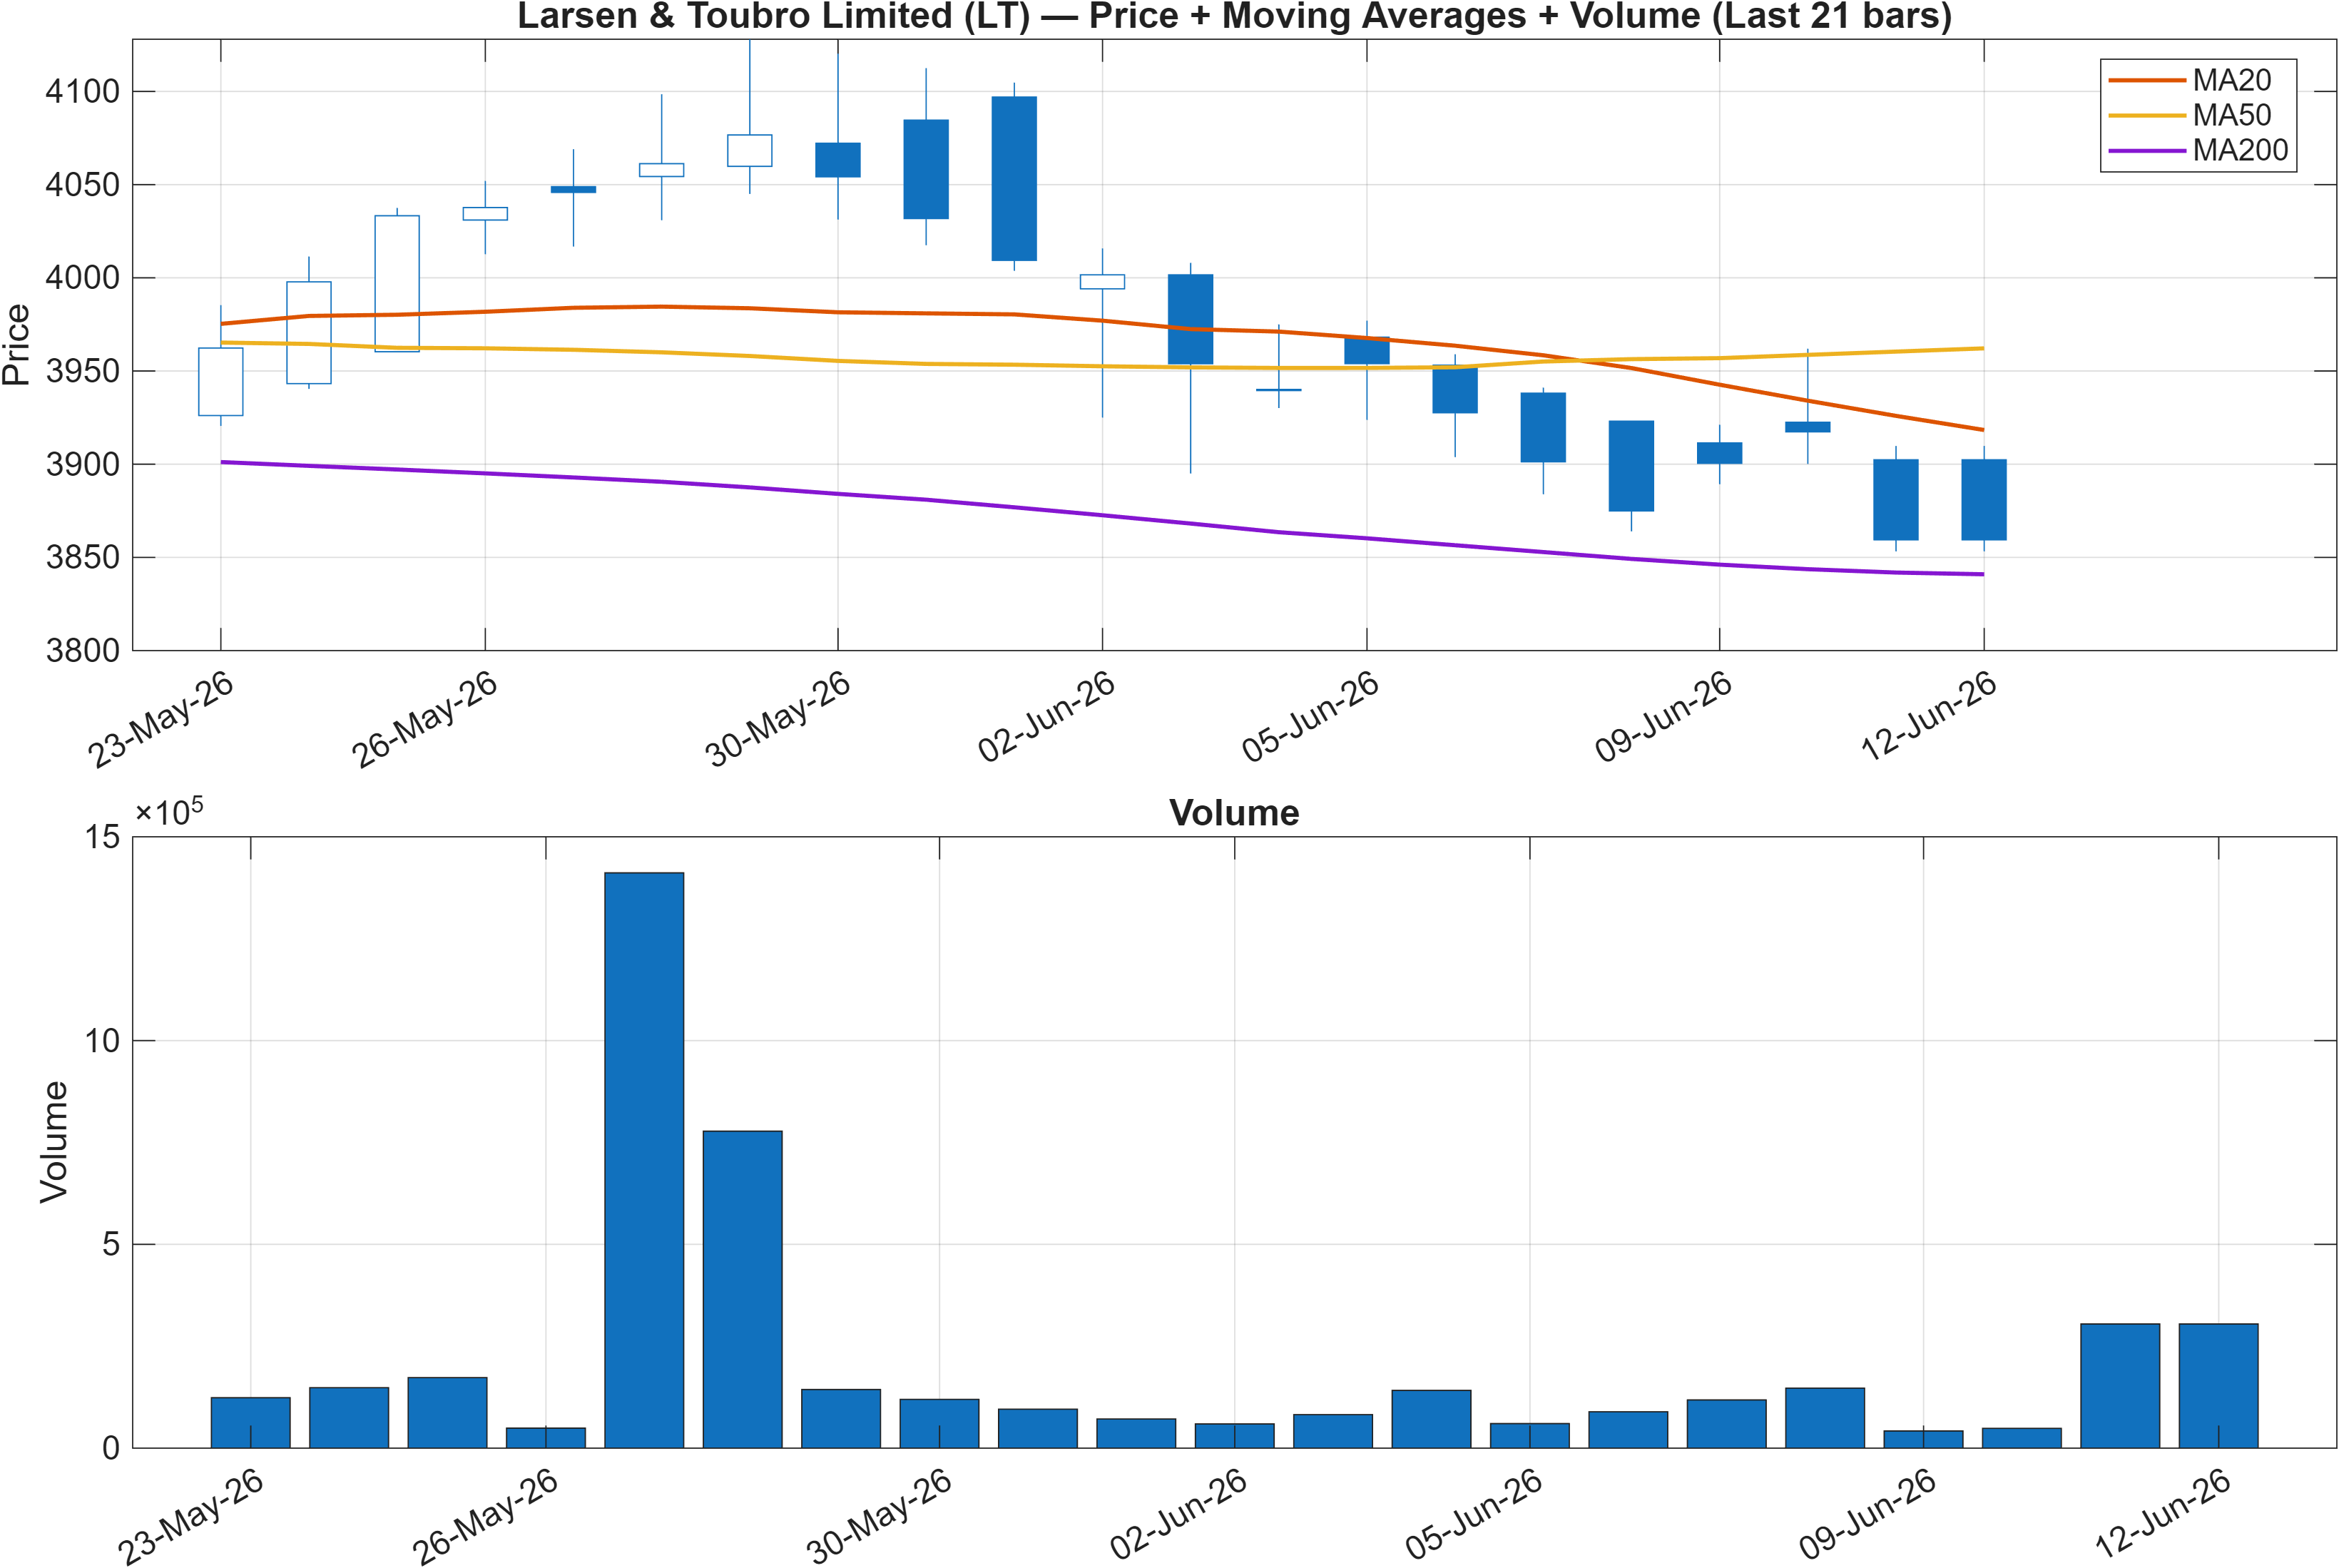
Interpretation: Close vs MA50 = Bearish, MA50 vs MA200 = Bullish.
Trend structure: pullback within a longer-term constructive slope
The moving-average readout shows a mixed trend regime. The close sitting Bearish versus the MA50 signals near-term pressure and a market trading below an intermediate anchor. At the same time, MA50 vs MA200 remains Bullish, which typically aligns with a longer-term uptrend that is undergoing a correction rather than a fully reversed primary trend.
This configuration tends to create two-way risk: rallies can face supply as price approaches the MA50, while dips can attract demand if the longer-term trend continues to be respected. The rank stack (daily #205 and weekly #163 versus monthly #669) is consistent with that reading—short-horizon behavior improving, but not yet strong enough to reassert medium-term leadership.
For positioning discipline, the nearby horizontal zones provide a cleaner decision framework than extrapolating the slope of averages alone. The support at 3865.3333 functions as the primary line where trend-repair attempts either hold or fail. On the upside, 4129.5500 represents the area where recovery becomes harder to dismiss as a mere bounce and begins to resemble re-acceleration. Trend interpretation here is less about calling direction and more about identifying whether price can migrate back above key reference levels with improving participation.
3) Momentum & volatility dashboard
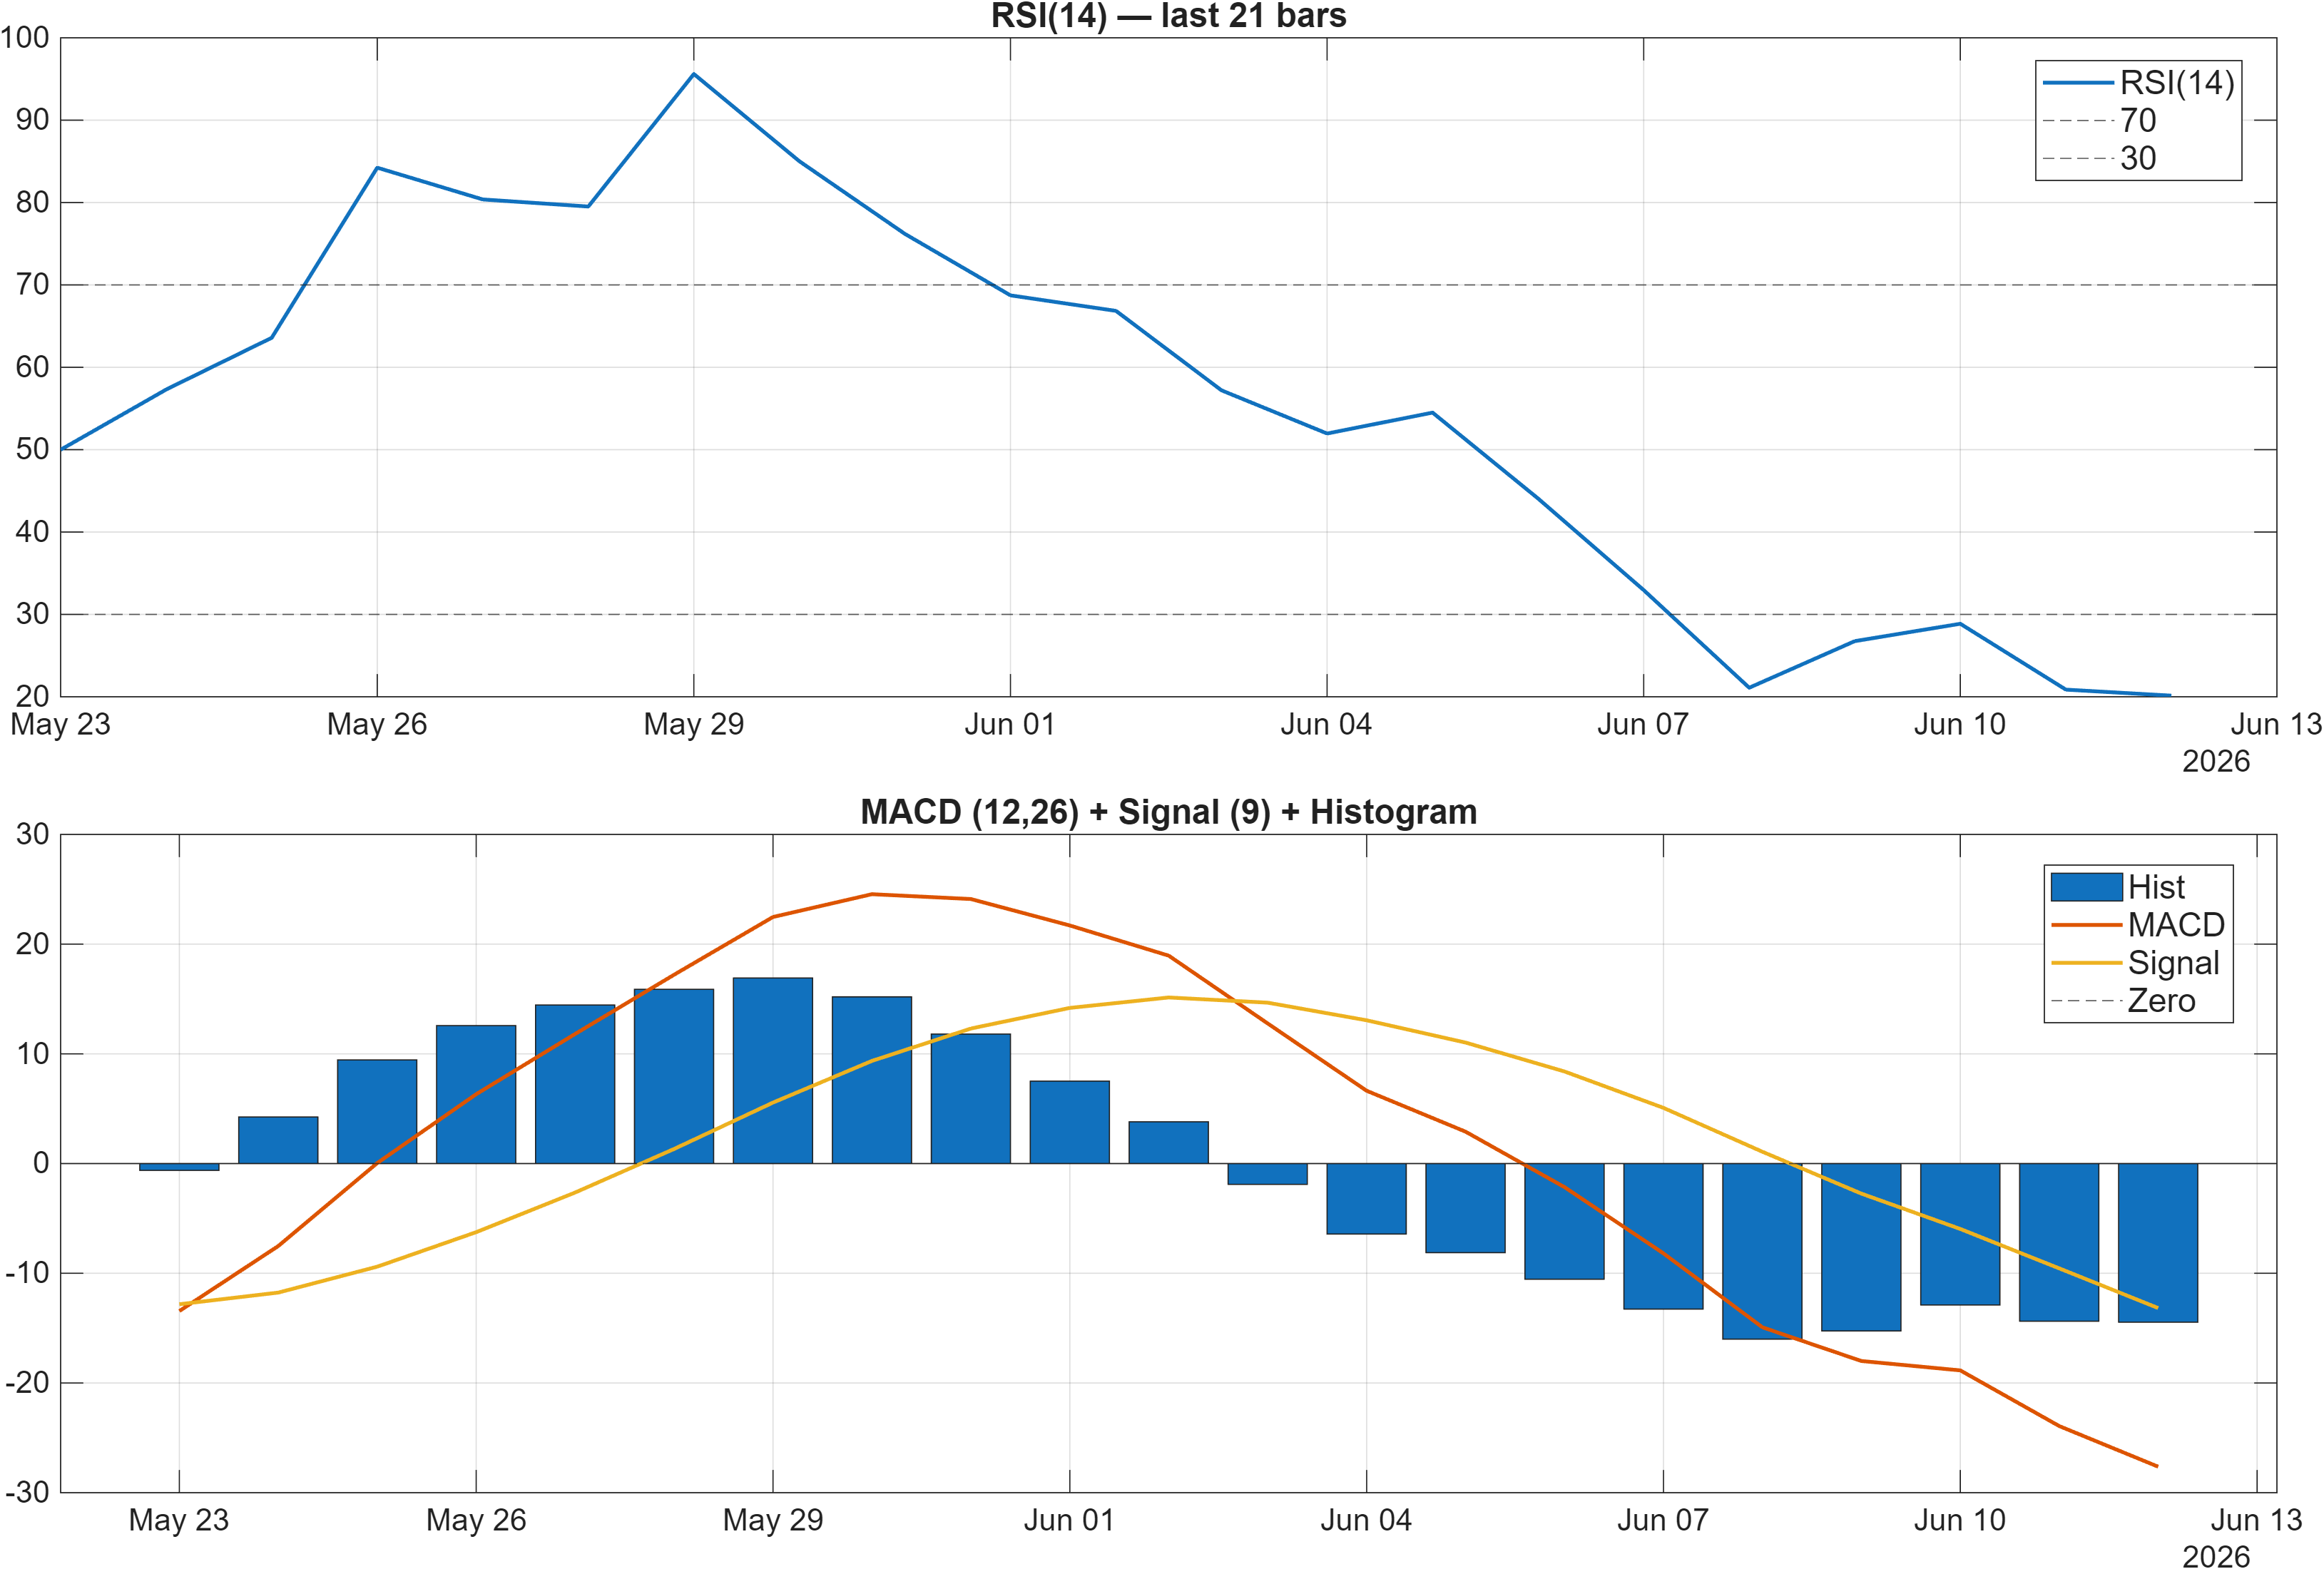
Interpretation: RSI bias = Bearish, MACD hist = -14.4606.
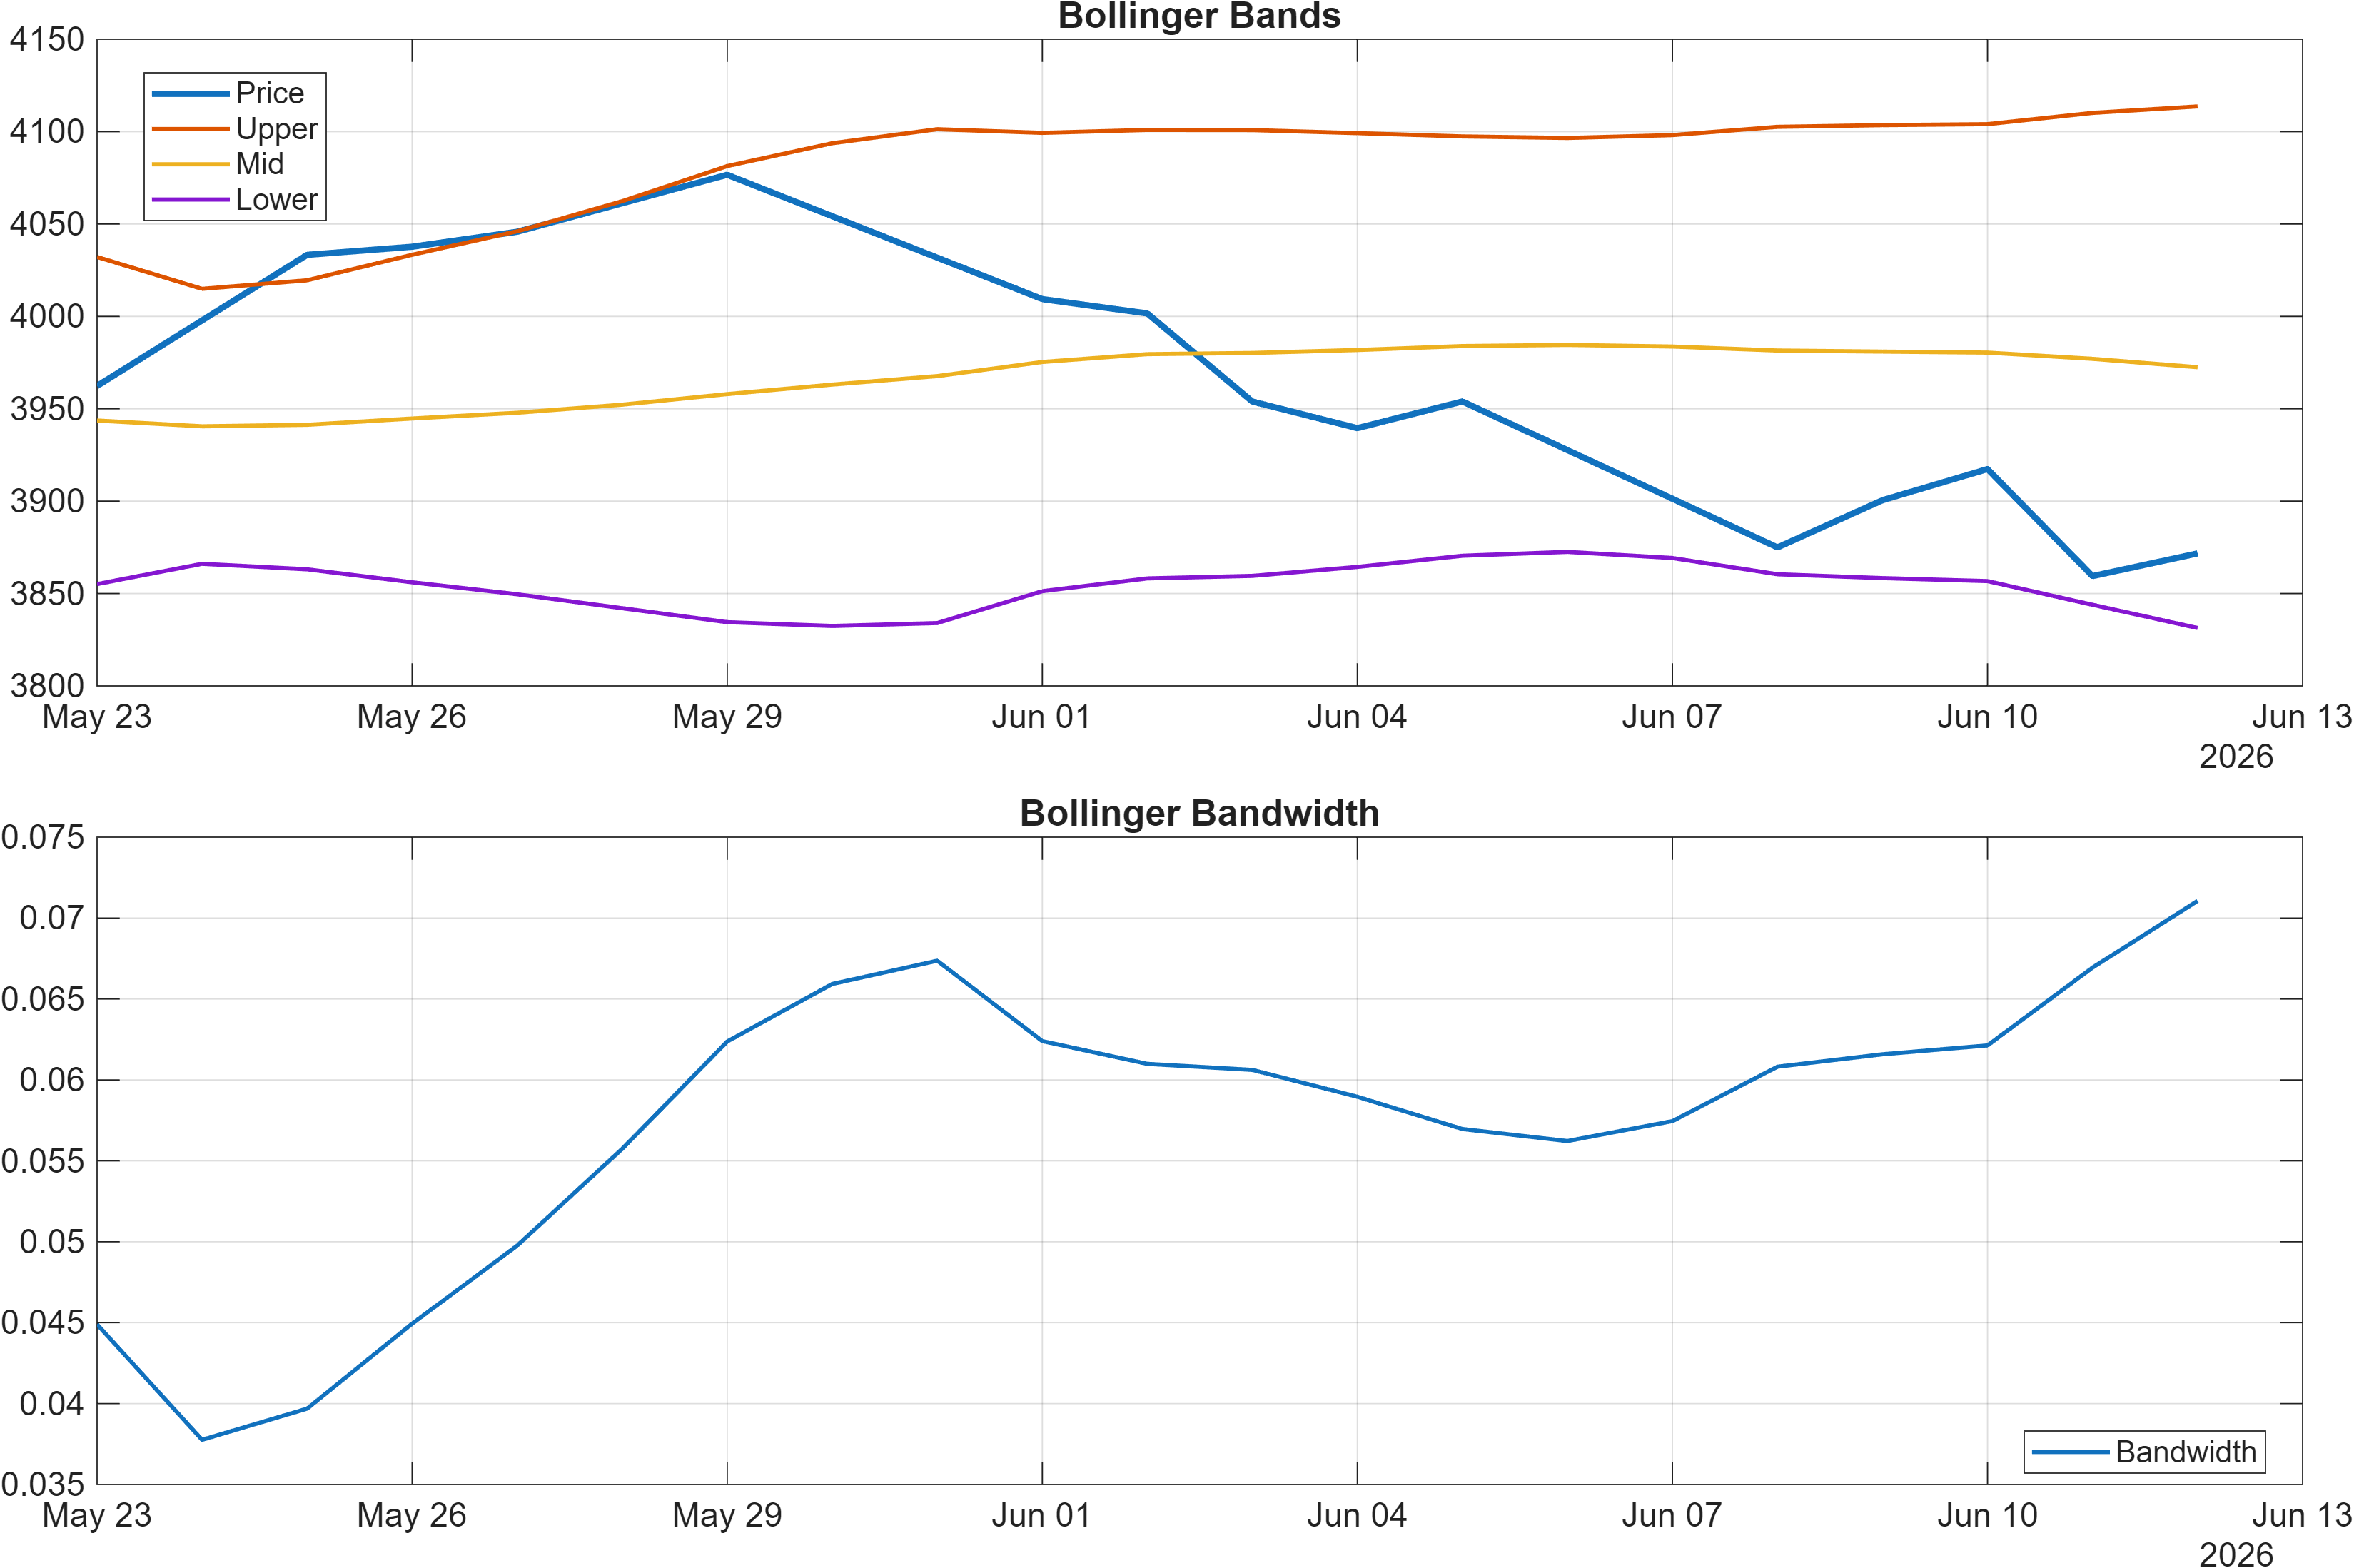
Interpretation: Bandwidth (volatility regime) latest = 0.0711.
Momentum: downside impulse dominates, but conditions are stretched
Momentum indicators are broadly aligned to the downside. RSI(14) at 20.14 carries a Bearish bias and signals a stretched condition that often coincides with late-stage sell pressure. The MACD histogram at -14.4606 reinforces the view that negative momentum remains dominant rather than merely flatlining. This pairing is typically associated with weak follow-through on rallies unless the histogram begins to contract (less negative) alongside RSI recovery.
Volatility regime: contained bandwidth, higher sensitivity to level breaks
Volatility is not signaling panic conditions. The latest Bollinger bandwidth of 0.0711 suggests a relatively contained regime compared with high-expansion episodes, which can matter for tactical planning: when bandwidth is compressed, price can become more responsive to discrete support/resistance zones than to wide-ranging volatility swings. That dynamic can amplify the importance of the nearby levels at 3865.3333 and 4129.5500.
The combined read is a stress-test environment: momentum is weak, but volatility is not broadly destabilized. If momentum improves while bandwidth stays contained, moves can be orderly; if bandwidth expands while RSI remains depressed, the probability of choppy liquidation increases. This is where the technical confluence score in Section 5 becomes particularly informative, as it aggregates multiple momentum and participation measures beyond RSI/MACD alone.
4) Support / Resistance zones
Support ~ 3865.3333 | Resistance ~ 4129.5500
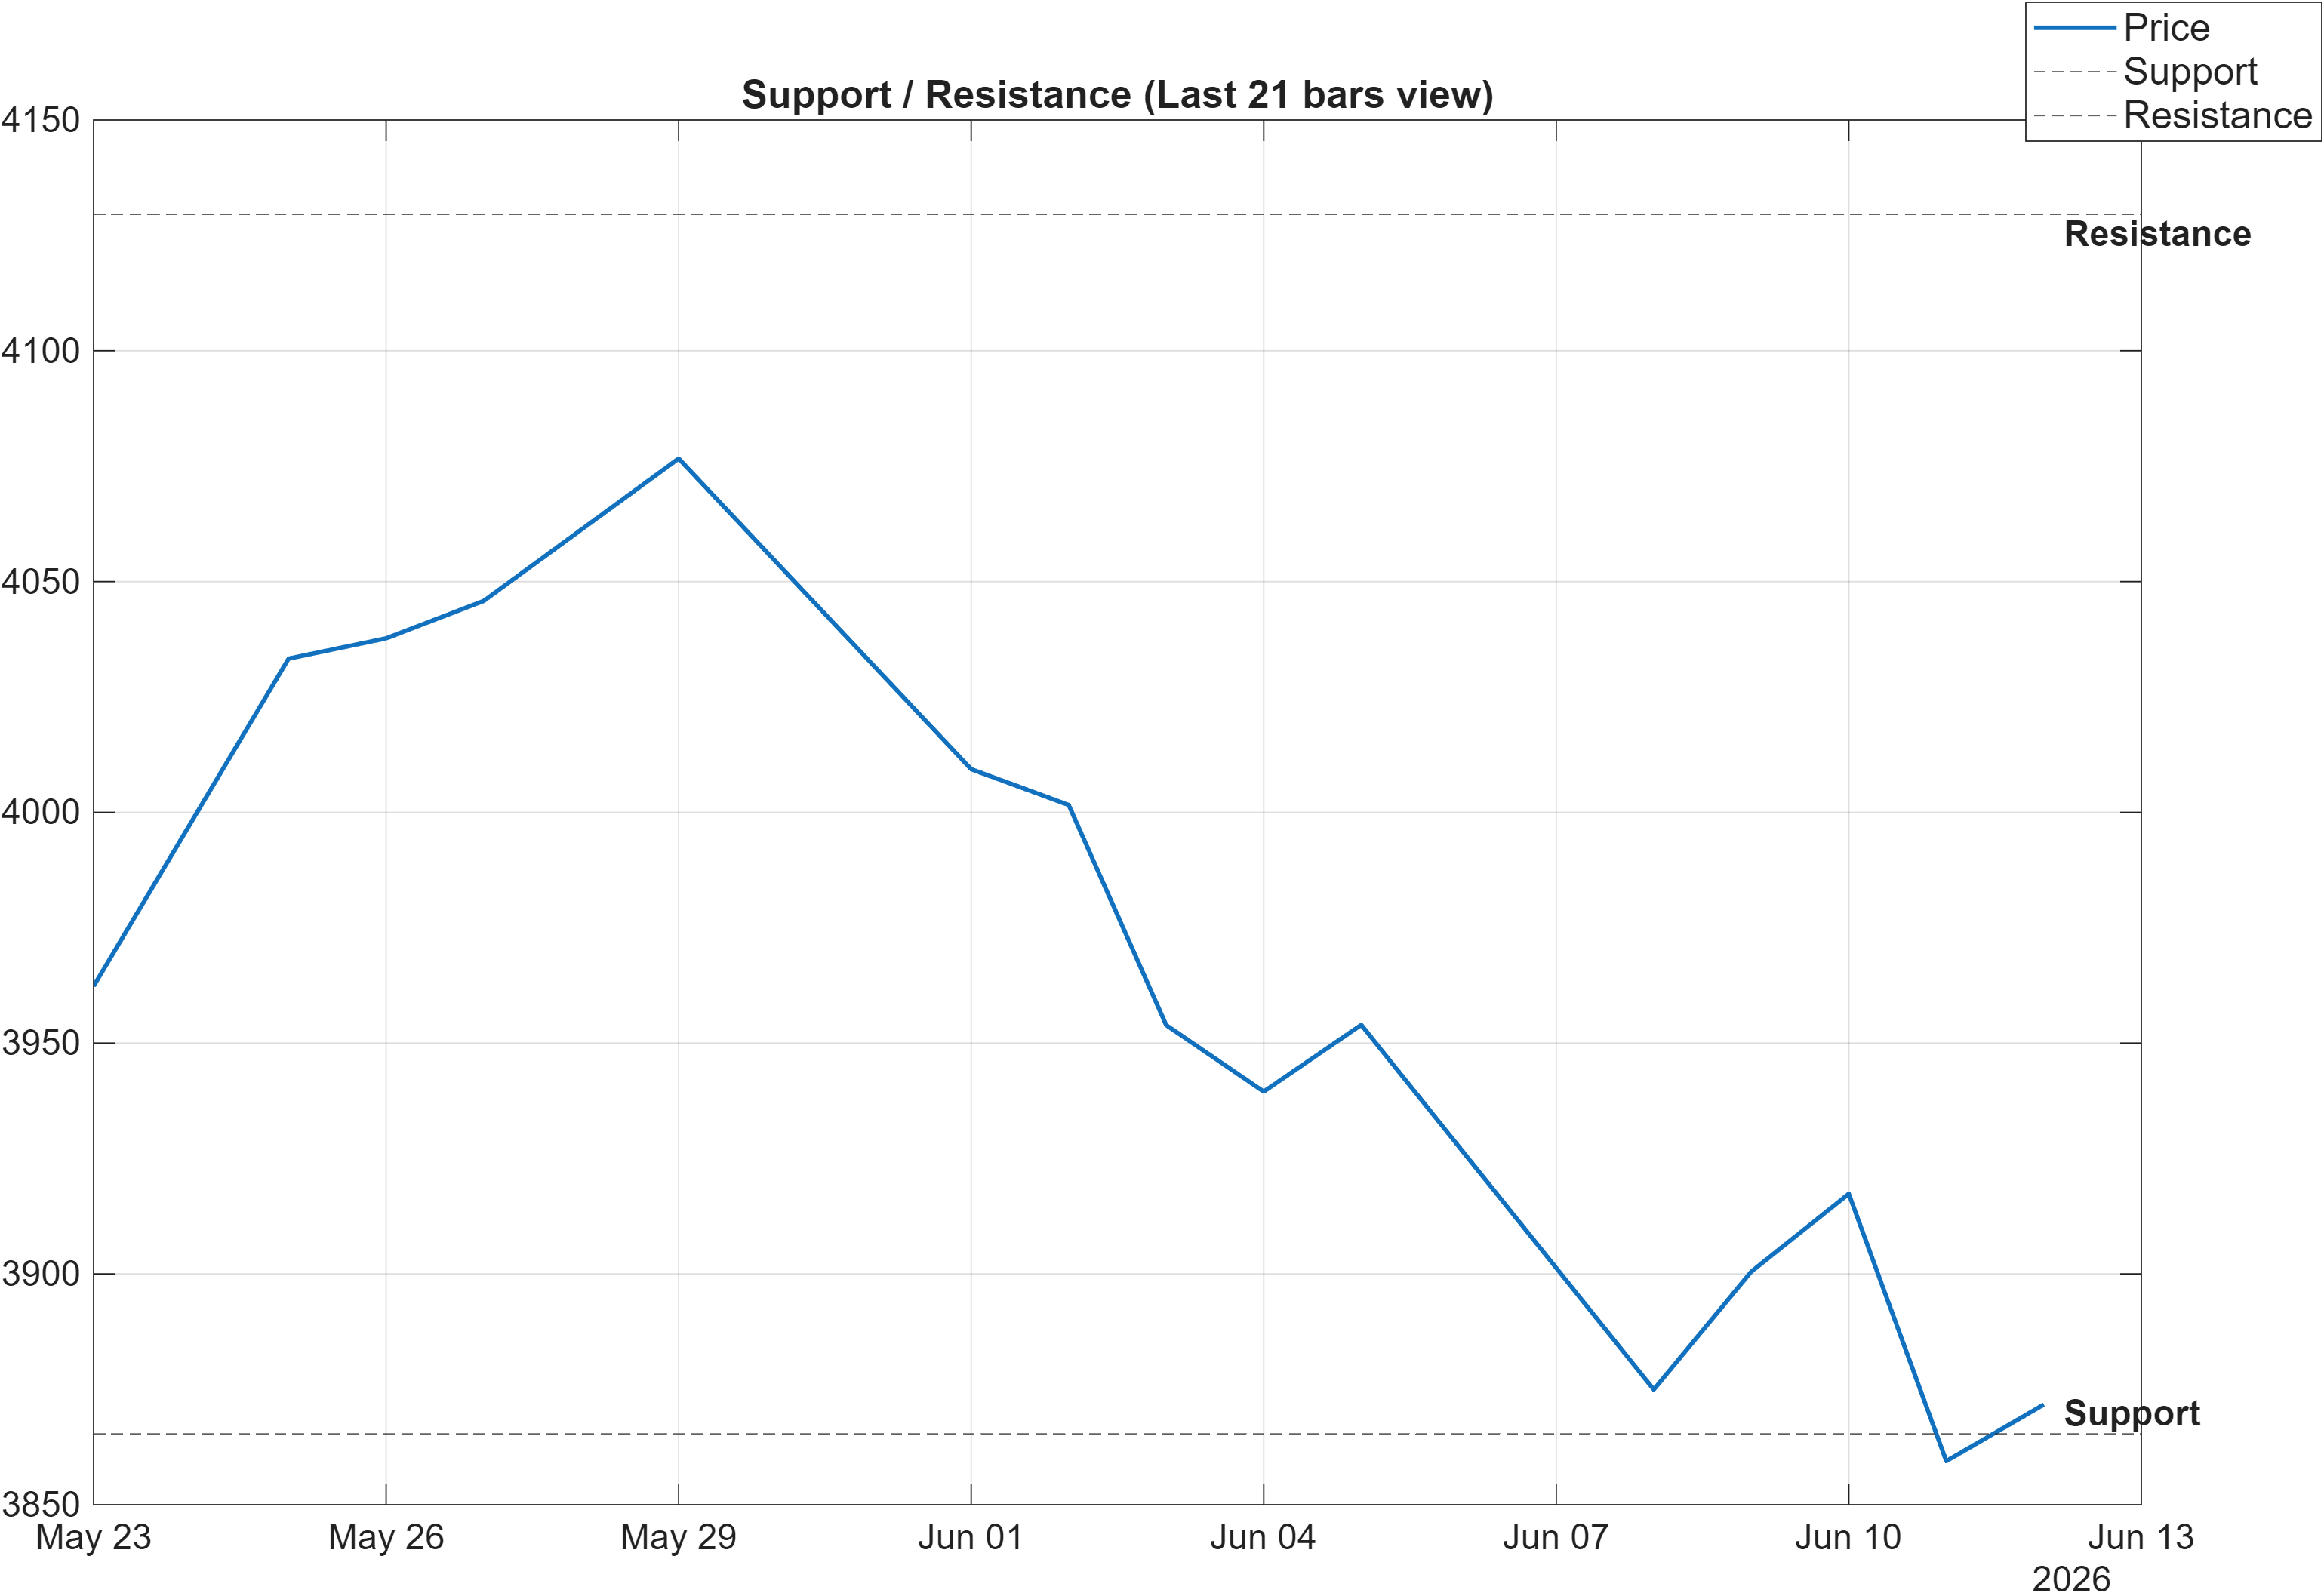
Scenario view: Break above resistance with volume → continuation. Close below support → signal deterioration risk.
Decision zones: mapping confirmation versus deterioration
LT’s current setup benefits from cleanly defined levels. Support at 3865.3333 is the key reference where the current pullback either stabilizes or transitions into deeper damage. With momentum readings already weak (RSI 20.14; MACD histogram -14.4606), repeated tests of support can become consequential: holding the zone tends to favor stabilization mechanics, while a close below can shift market behavior toward faster de-risking and weaker rebound quality.
Resistance at 4129.5500 is the counterpart: reclaiming this level is less about “upside target” framing and more about re-establishing control after a period of weakness. The provided scenario condition—a break above resistance with volume—functions as the cleanest confirmation filter in this report, because it requires both price acceptance and participation rather than a low-conviction drift.
In mixed regimes (short-term ranks Bullish but technical confluence Bearish), levels often carry more signal than indicators alone. With Bollinger bandwidth at 0.0711, a level break can also coincide with a regime shift from contained movement to broader expansion. Practically, that means the distance between 3865.3333 and 4129.5500 acts as LT’s current “decision corridor,” where traders and longer-horizon holders often reassess exposure as new information gets priced in.
5) Quant Technical Dashboard (18 Signals)
KGNAI AI Technical Analysis Score (Deep Reinforcement Learning): Rank #583 out of 1220 (Rank 1 represents the strongest technical positioning and a higher probability of favorable price behavior. As ranks increase toward the maximum, the probability of favorable outcomes weakens and bearish positioning becomes more dominant.) | Label: Neutral | Score: 0.044
18-Signal Technical Confluence Score: -0.389 (Bearish)
Overall Technical Score (18-signal confluence + DRL rank blend): -0.259 (Neutral)
Note: The blended score reflects signal strength weighted against broader AI technical ranking, which may temporarily diverge.
Blended technical score breakdown: -0.259 (Neutral | Bull 4 / Bear 11 / Neutral 3)
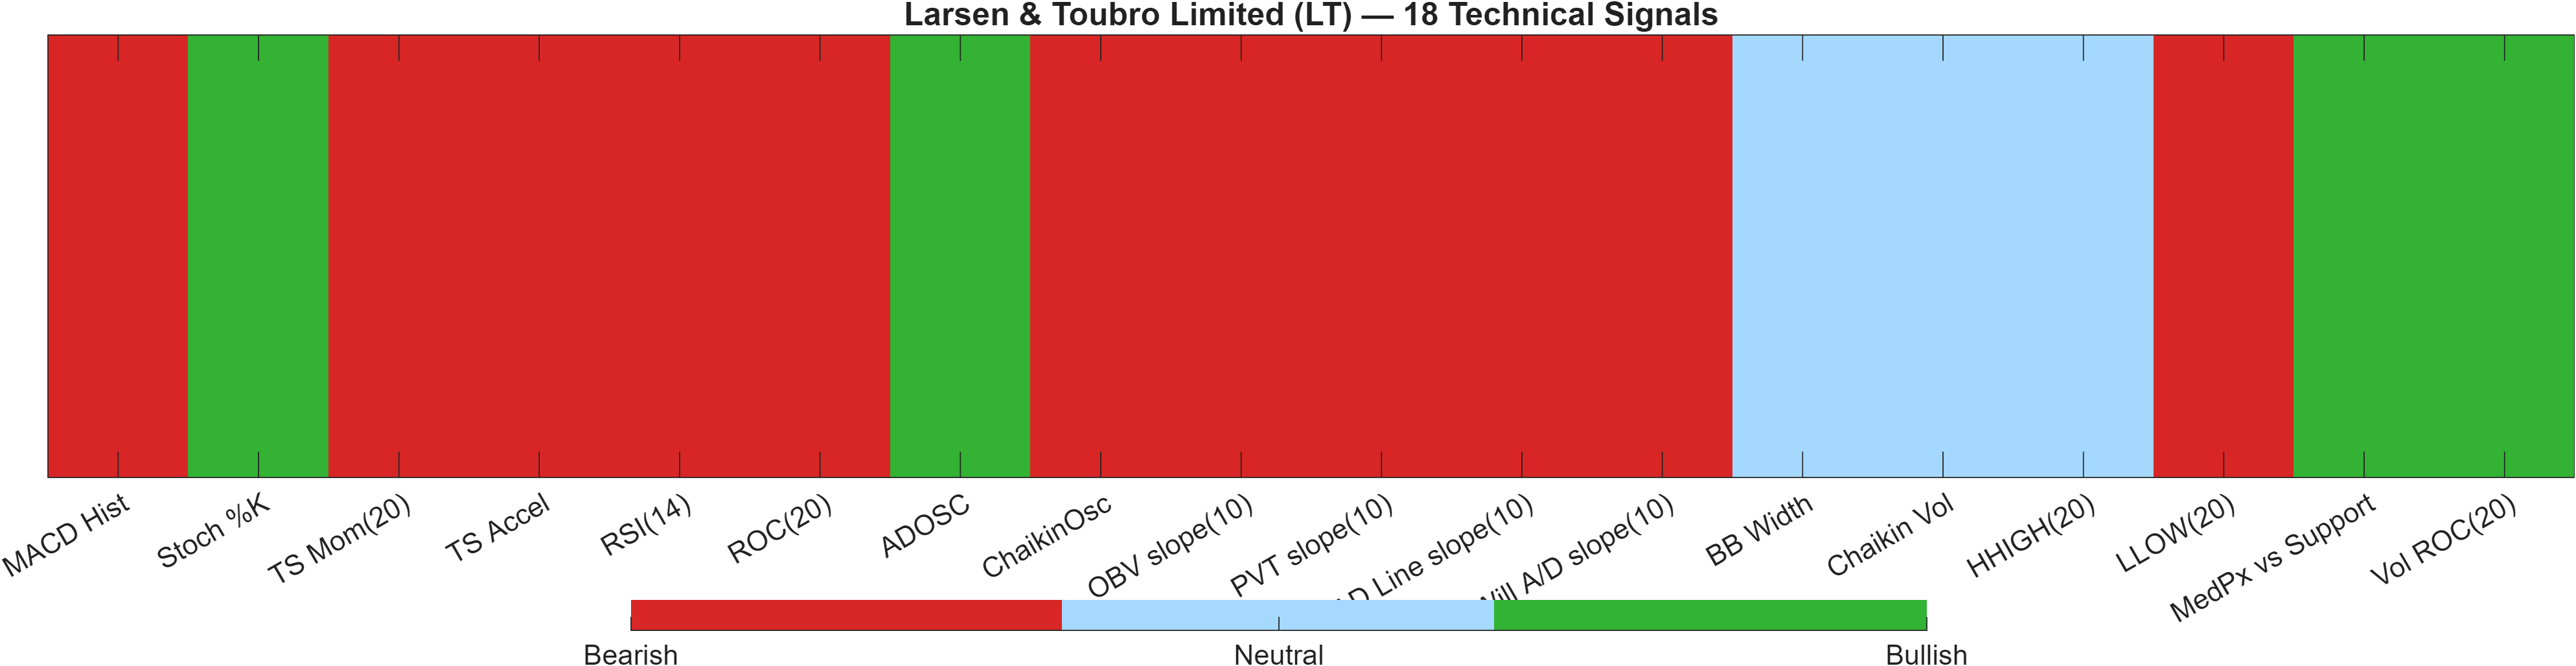
Signal table (Bull/Bear/Neutral)
| Indicator | Value | Signal |
|---|---|---|
| MACD Hist | -14.46 | Bearish |
| Stoch %K | 4.006 | Bullish |
| TS Mom(20) | -138.4 | Bearish |
| TS Accel | -80.03 | Bearish |
| RSI(14) | 20.14 | Bearish |
| ROC(20) | -3.155 | Bearish |
| ADOSC | 12.07 | Bullish |
| ChaikinOsc | -2.513e+05 | Bearish |
| OBV slope(10) | -7.323e+05 | Bearish |
| PVT slope(10) | -7671 | Bearish |
| AD Line slope(10) | -7.317e+05 | Bearish |
| Will A/D slope(10) | -193.9 | Bearish |
| BB Width | 0.07106 | Neutral |
| Chaikin Vol | -31.9 | Neutral |
| HHIGH(20) | 4128 | Neutral |
| LLOW(20) | 3853 | Bearish |
| MedPx vs Support | 16.19 | Bullish |
| Vol ROC(20) | 105.3 | Bullish |
Interpretation: Indicator-level signals form the base confluence, which is then adjusted using a separate AI-driven technical ranking model. The final technical score summarizes this combined view.
Confluence versus AI technical rank: a controlled disagreement
The technical layer is best read as two distinct lenses that are not fully aligned. First, the 18-signal confluence score is -0.389 and labeled Bearish, driven by broad weakness across momentum and participation-style measures. This is consistent with the negative impulse already visible in RSI(14) at 20.14 and MACD histogram -14.46, plus multiple volume/flow slopes flagged as bearish in the signal table.
Second, the Deep Reinforcement Learning (DRL) technical model places LT at rank #583 out of 1220 with a Neutral label and score 0.044. That rank sits near the middle of the universe, implying the AI model does not see extreme technical fragility relative to peers even though short-horizon indicators look stressed.
The blend resolves this into an overall technical score of -0.259 (Neutral), with Bear 11 / Bull 4 / Neutral 3. That composition often describes a market where downside signals are numerous but may be approaching saturation, requiring price-level confirmation (Section 4) to determine whether the regime is deteriorating further or stabilizing.
6) News sentiment + extractive gist
Sentiment score (avg): 0.000 | Positive: 0% | Neutral: 100% | Negative: 0%
KGNAI AI News Sentiment Score (normalized -1 to +1): 0.96 (as of 2026-06-01) | Label: Bullish | Overall news score: 0.84
Positive Developments
Recent coverage across major financial outlets indicates a generally constructive backdrop in tone, though the article-level distribution in this dataset is categorized as Neutral (100%) with an average score of 0.000. The more supportive signal comes from KGNAI’s normalized sentiment measure at 0.96 (Bullish), alongside an overall news score of 0.84, which together suggest that the language and framing in the processed text leans favorable even if the classification bucket remains neutral. In practical reading, this kind of split can occur when commentary is contextually upbeat but not event-driven—for example, emphasizing improving conditions, valuation framing, or catalysts without a discrete company-specific trigger in the supplied feed. For LT, the key analytical question is whether positive tone can translate into price acceptance above resistance rather than remain a background narrative while technical momentum stays weak.
Neutral / Mixed Developments
The dataset’s distribution itself is a neutral signal: 0% positive, 100% neutral, 0% negative implies the captured coverage is not presenting sharp new risks or decisive new positives in categorical terms. That matters because LT’s technical picture is already strained (18-signal confluence -0.389, Bearish), and neutral news flow can leave price action more dependent on internal market mechanics—support/resistance behavior, volume confirmation, and momentum repair. With Bollinger bandwidth at 0.0711, markets often trade “level-to-level,” and neutral information flow tends to maintain that environment rather than forcing an abrupt repricing. In this context, neutral coverage should be read as non-interventionist: it neither validates the bearish technical pressure nor provides a clear catalyst to reverse it.
Negative / Risk Signals
No explicit negative skew is present in the provided sentiment distribution (0% negative), yet risk is still detectable through signal conflict rather than headlines. The primary risk signal is that the news normalization is Bullish (0.96) while the technical layer shows broad bearish breadth (Bear 11 versus Bull 4) and momentum stress (RSI 20.14, MACD histogram -14.4606). When sentiment is supportive but price/momentum remain heavy, the market may be signaling that buyers are either not acting on the narrative or are waiting for more attractive levels and confirmation. From a risk-management standpoint, the most actionable downside condition remains technical: a close below 3865.3333 would align narrative optimism with deteriorating structure, which is typically when volatility can expand beyond the current 0.0711 bandwidth regime.
- What to monitor next: Whether price can reclaim 4129.5500 with volume confirmation.
- What to monitor next: Whether support at 3865.3333 holds during further tests while RSI recovers from 20.14.
- What to monitor next: Whether MACD histogram (-14.4606) begins to contract toward zero alongside stable bandwidth (0.0711).
Snapshot: AI Rank (Short–Mid–Long): Mixed (Bullish–Neutral–Neutral) · Technical Confluence: Bearish · Key Levels: Support ~3865.33 | Resistance ~4129.55 · News Sentiment: Neutral
Sources referenced: Reuters, Bloomberg, Yahoo Finance, MarketWatch, Investing.com
7) Sources
Not available in the provided data.
You may also like: How KGNAI AI ranks instruments across global markets
Disclaimer: KGNAI provides AI-generated analytics and educational market commentary only. This is not financial advice. Markets involve risk. Always do your own research.