AIIL (Authum Investment & Infrastructure Ltd) — 07-Jun-2026 Technical Confluence Turns Mixed While Ranks Stay Bullish
Authum Investment & Infrastructure Ltd (AIIL) enters 07-Jun-2026 with consistently strong KGNAI ranks across time horizons, while shorter-horizon market internals show signs of friction. The cross-sectional positioning remains constructive—highlighted by a Daily rank of #22 and Monthly rank of #9 out of 1220—yet the technical layer is less uniform. The moving-average read flags a close vs MA50 as Bearish even as MA50 vs MA200 remains Bullish, suggesting a trend structure that is intact but experiencing near-term pressure. Momentum is notably soft with RSI(14) at 23.96 and a MACD histogram of -3.2556, while volatility is not extreme with Bollinger bandwidth at 0.1950. Key decision zones frame the setup: support near 431.2250 and resistance near 518.3000. News tone is mildly constructive with an average sentiment score of 0.179, though coverage is broader market/sector in nature.
- Rank stance: Short / Mid / Long all Bullish (Daily #22; Weekly #174; Monthly #9; 3M #6; 6M #14; Yearly #113 out of 1220).
- Technical confluence label: Neutral (blended) with Bearish (18-signal).
- Key levels: Support ~ 431.2250 | Resistance ~ 518.3000.
- News sentiment bias: Mildly positive (avg 0.179; Positive 50% / Neutral 50% / Negative 0%).
- Confirmation / invalidation: Strength is better validated on a break above 518.3000 with volume; risk increases on a close below 431.2250.
KGNAI evaluates assets using large cross-sectional datasets built from millions of structured data points. Inputs incorporate fundamental metrics, technical structures, and systematically processed news sentiment. Statistical models, machine learning, and AI frameworks are used to assess relative positioning, signal alignment, and probabilistic behavior across broad universes.
- Ranks are comparative across the tracked universe, not absolute price targets.
- Confluence reflects alignment among independent signal groups.
- Support/resistance levels are probabilistic decision zones, not guarantees.
- Sentiment provides contextual bias within the broader analytical framework.
1) KGNAI AI Analysis
Region: INDIA
Total universe size: 1220 ranked instruments
- Daily rank: #22 out of 1220 — Bullish
- Weekly rank: #174 out of 1220 — Bullish
- Monthly rank: #9 out of 1220 — Bullish
- 3-Monthly rank: #6 out of 1220 — Bullish
- 6-Monthly rank: #14 out of 1220 — Bullish
- Yearly rank: #113 out of 1220 — Bullish
AIIL’s rank profile is strongest in the intermediate horizons, where the 3-Monthly rank (#6) and Monthly rank (#9) place it in the top decile of the 1220-instrument universe. That consistency matters because it implies the favorable positioning is not dependent on a single lookback window. The Daily rank (#22) supports near-term relative strength, even as the Weekly rank (#174) is less dominant—still constructive, but closer to the upper quartile than the very top tier.
This configuration often reads as structural strength with tactical noise: longer and intermediate horizons remain robust, while the weekly window can reflect recent consolidation, mean reversion, or a temporary rhythm change. Importantly, the Yearly rank (#113) remains Bullish, which helps reduce the probability that near-term softness is part of a broader long-cycle deterioration.
From a portfolio construction perspective, the rank ladder being Bullish across Daily, Monthly, and 3-Monthly horizons suggests regime persistence, but the spread between #6 (3-Monthly) and #174 (Weekly) signals that the instrument may be more sensitive to short-run liquidity and sentiment shifts than its longer-horizon placement would imply. In that context, the best read is to treat AIIL as still relatively strong within its universe, while leaning on technical confluence (Sections 3–5) to gauge whether the short-term digestion is stabilizing or expanding.
Term view: Short-term: Bullish. Mid-term: Bullish. Long-term: Bullish.
2) Price & trend overview
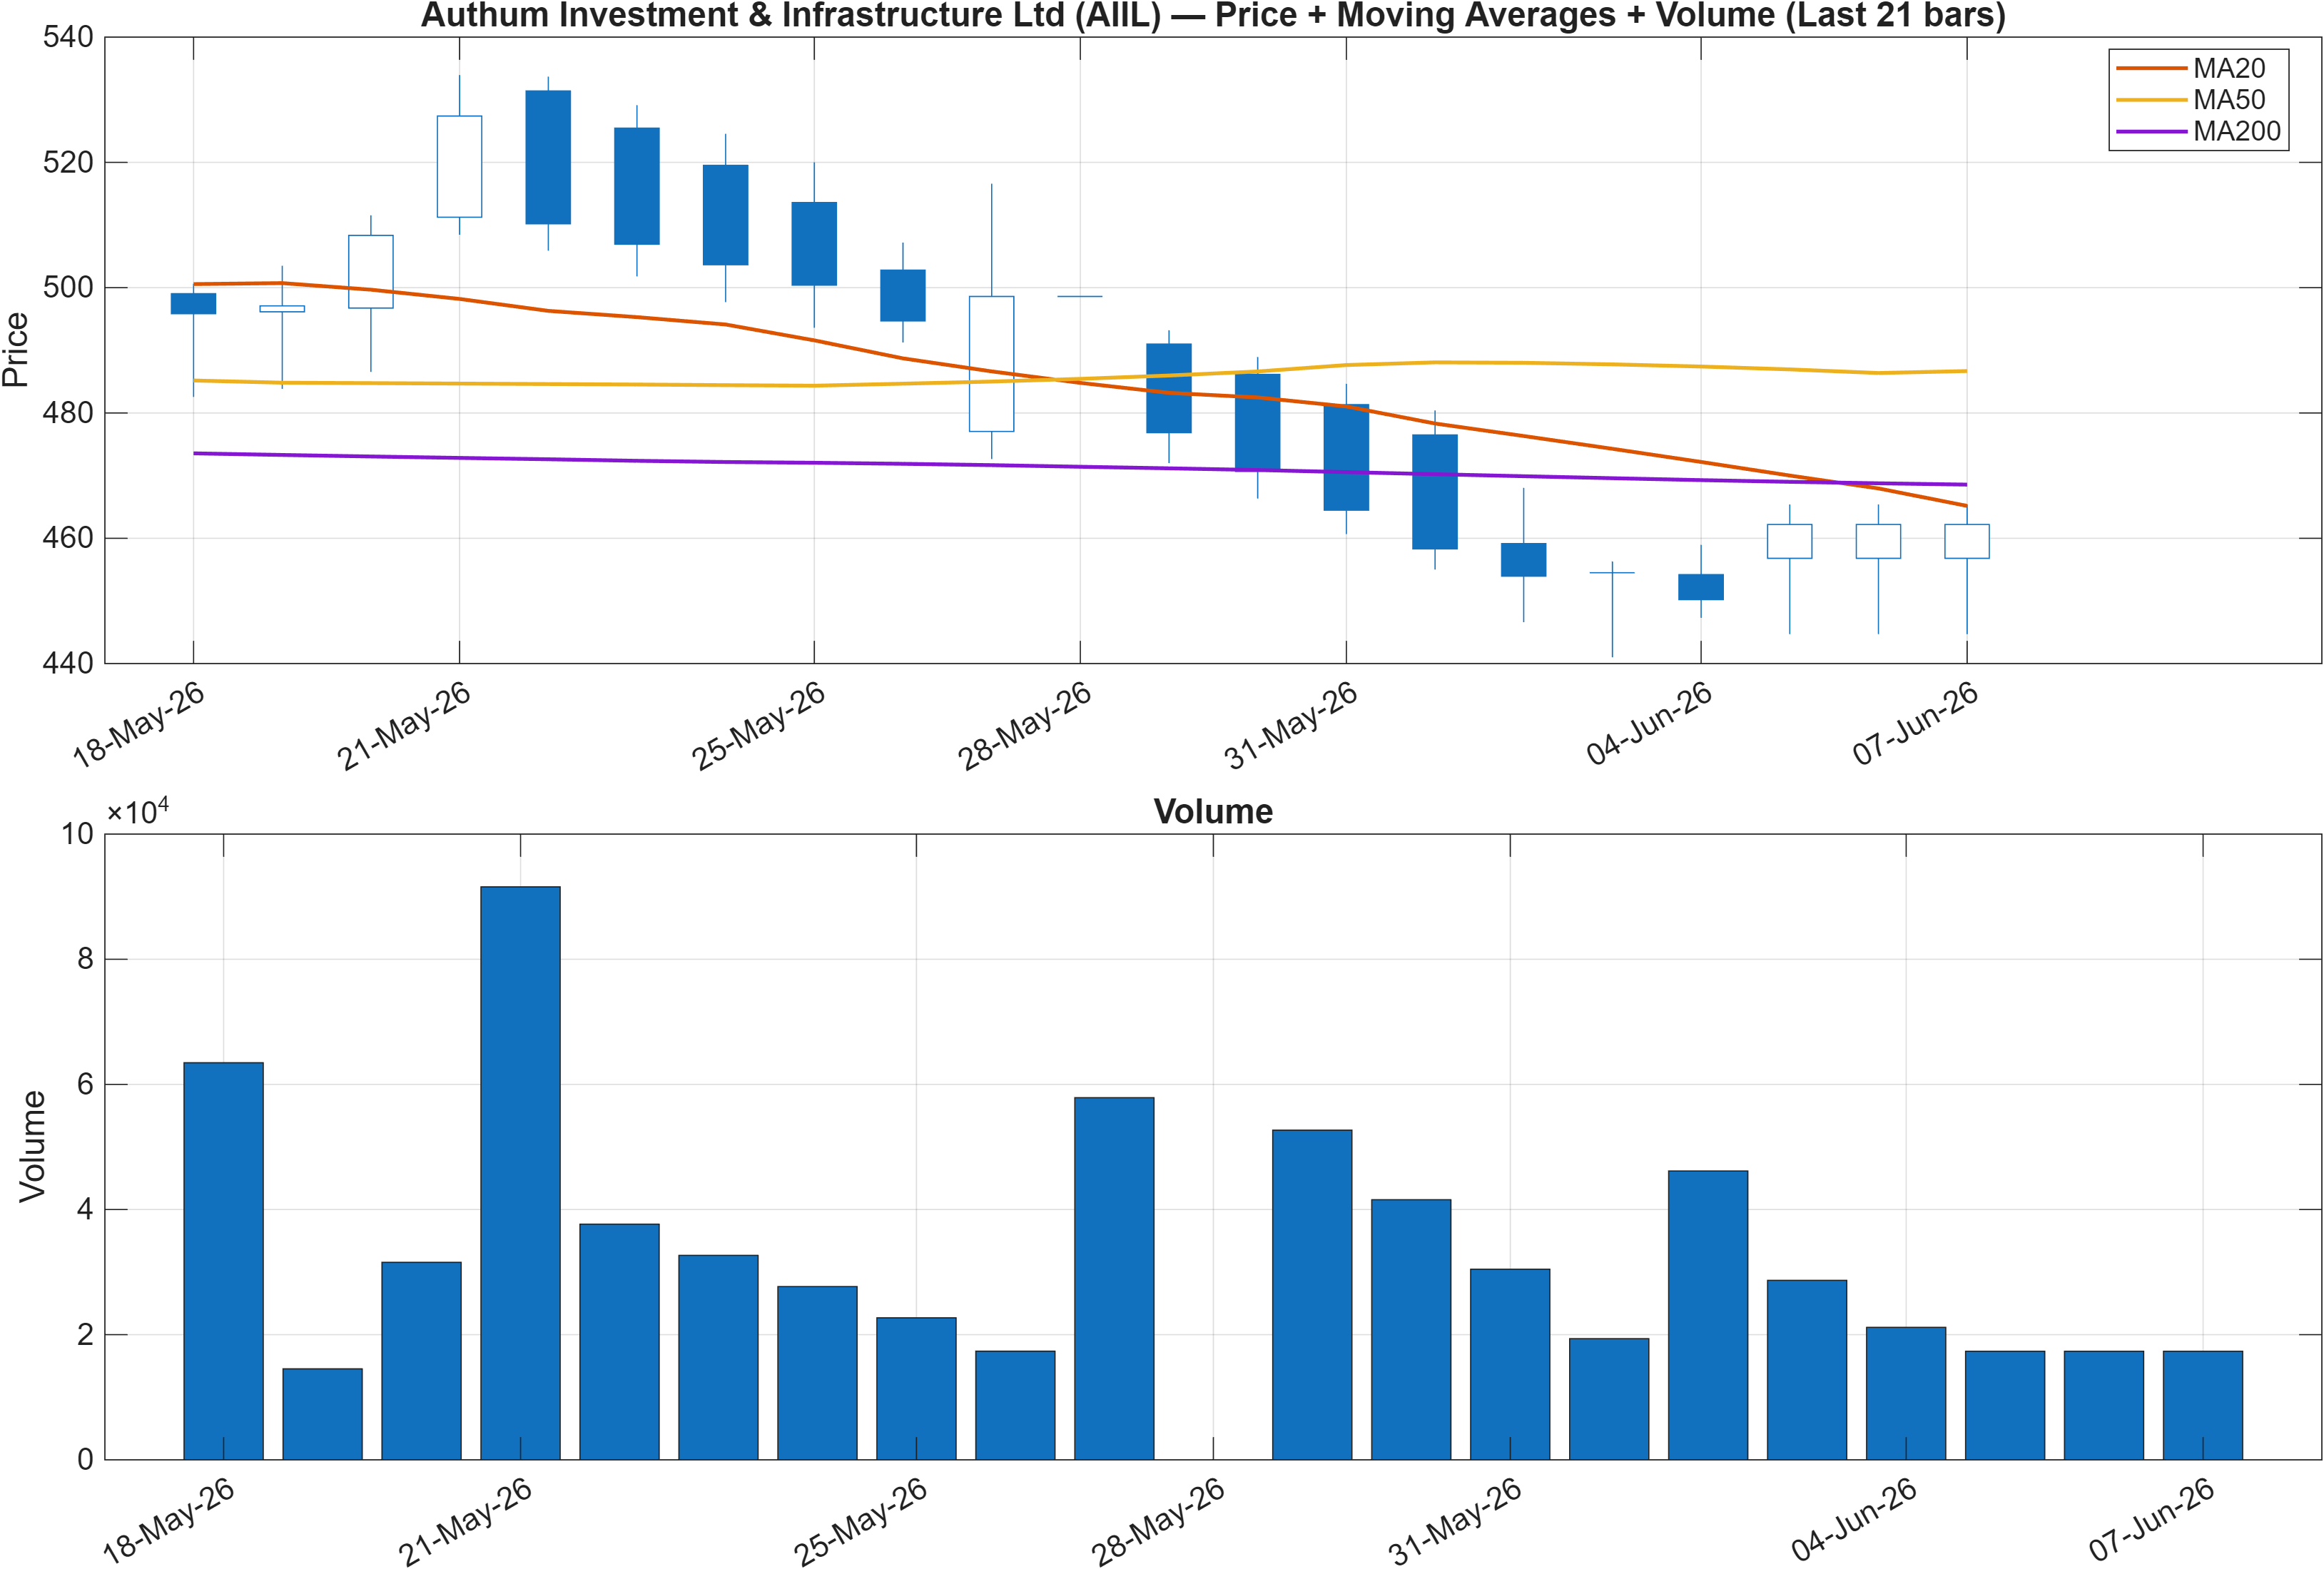
The trend read is explicitly split: Close vs MA50 = Bearish, while MA50 vs MA200 = Bullish. That combination typically describes a market in which the primary trend structure remains intact (a constructive medium/long trend), but price has slipped below the intermediate trend proxy, increasing the chance of choppy trading until the MA50 is recaptured.
This matters because it frames the current phase as consolidation within an upward-leaning regime, rather than a confirmed trend reversal. The rank stack supports that interpretation: Monthly (#9) and 3-Monthly (#6) remain very strong, consistent with a broader uptrend context, while the weekly window is less emphatic at #174.
Price action is best evaluated around the nearby decision zones defined later: support near 431.2250 and resistance near 518.3000. When a close under MA50 coincides with momentum weakness (see RSI and MACD in Section 3), the trend can either (a) reassert quickly via a rebound that restores the MA50 relationship, or (b) extend into a deeper mean-reversion phase that tests structural support.
Volume behavior is presented in the chart and is central to interpreting whether the MA50 break is a temporary dip or a more persistent supply-driven move. In this setup, a stabilization that occurs without expanding downside pressure is more consistent with the strong intermediate ranks; sustained weakness would pull the trend read closer to the bearish momentum cluster highlighted in the dashboard.
3) Momentum & volatility dashboard
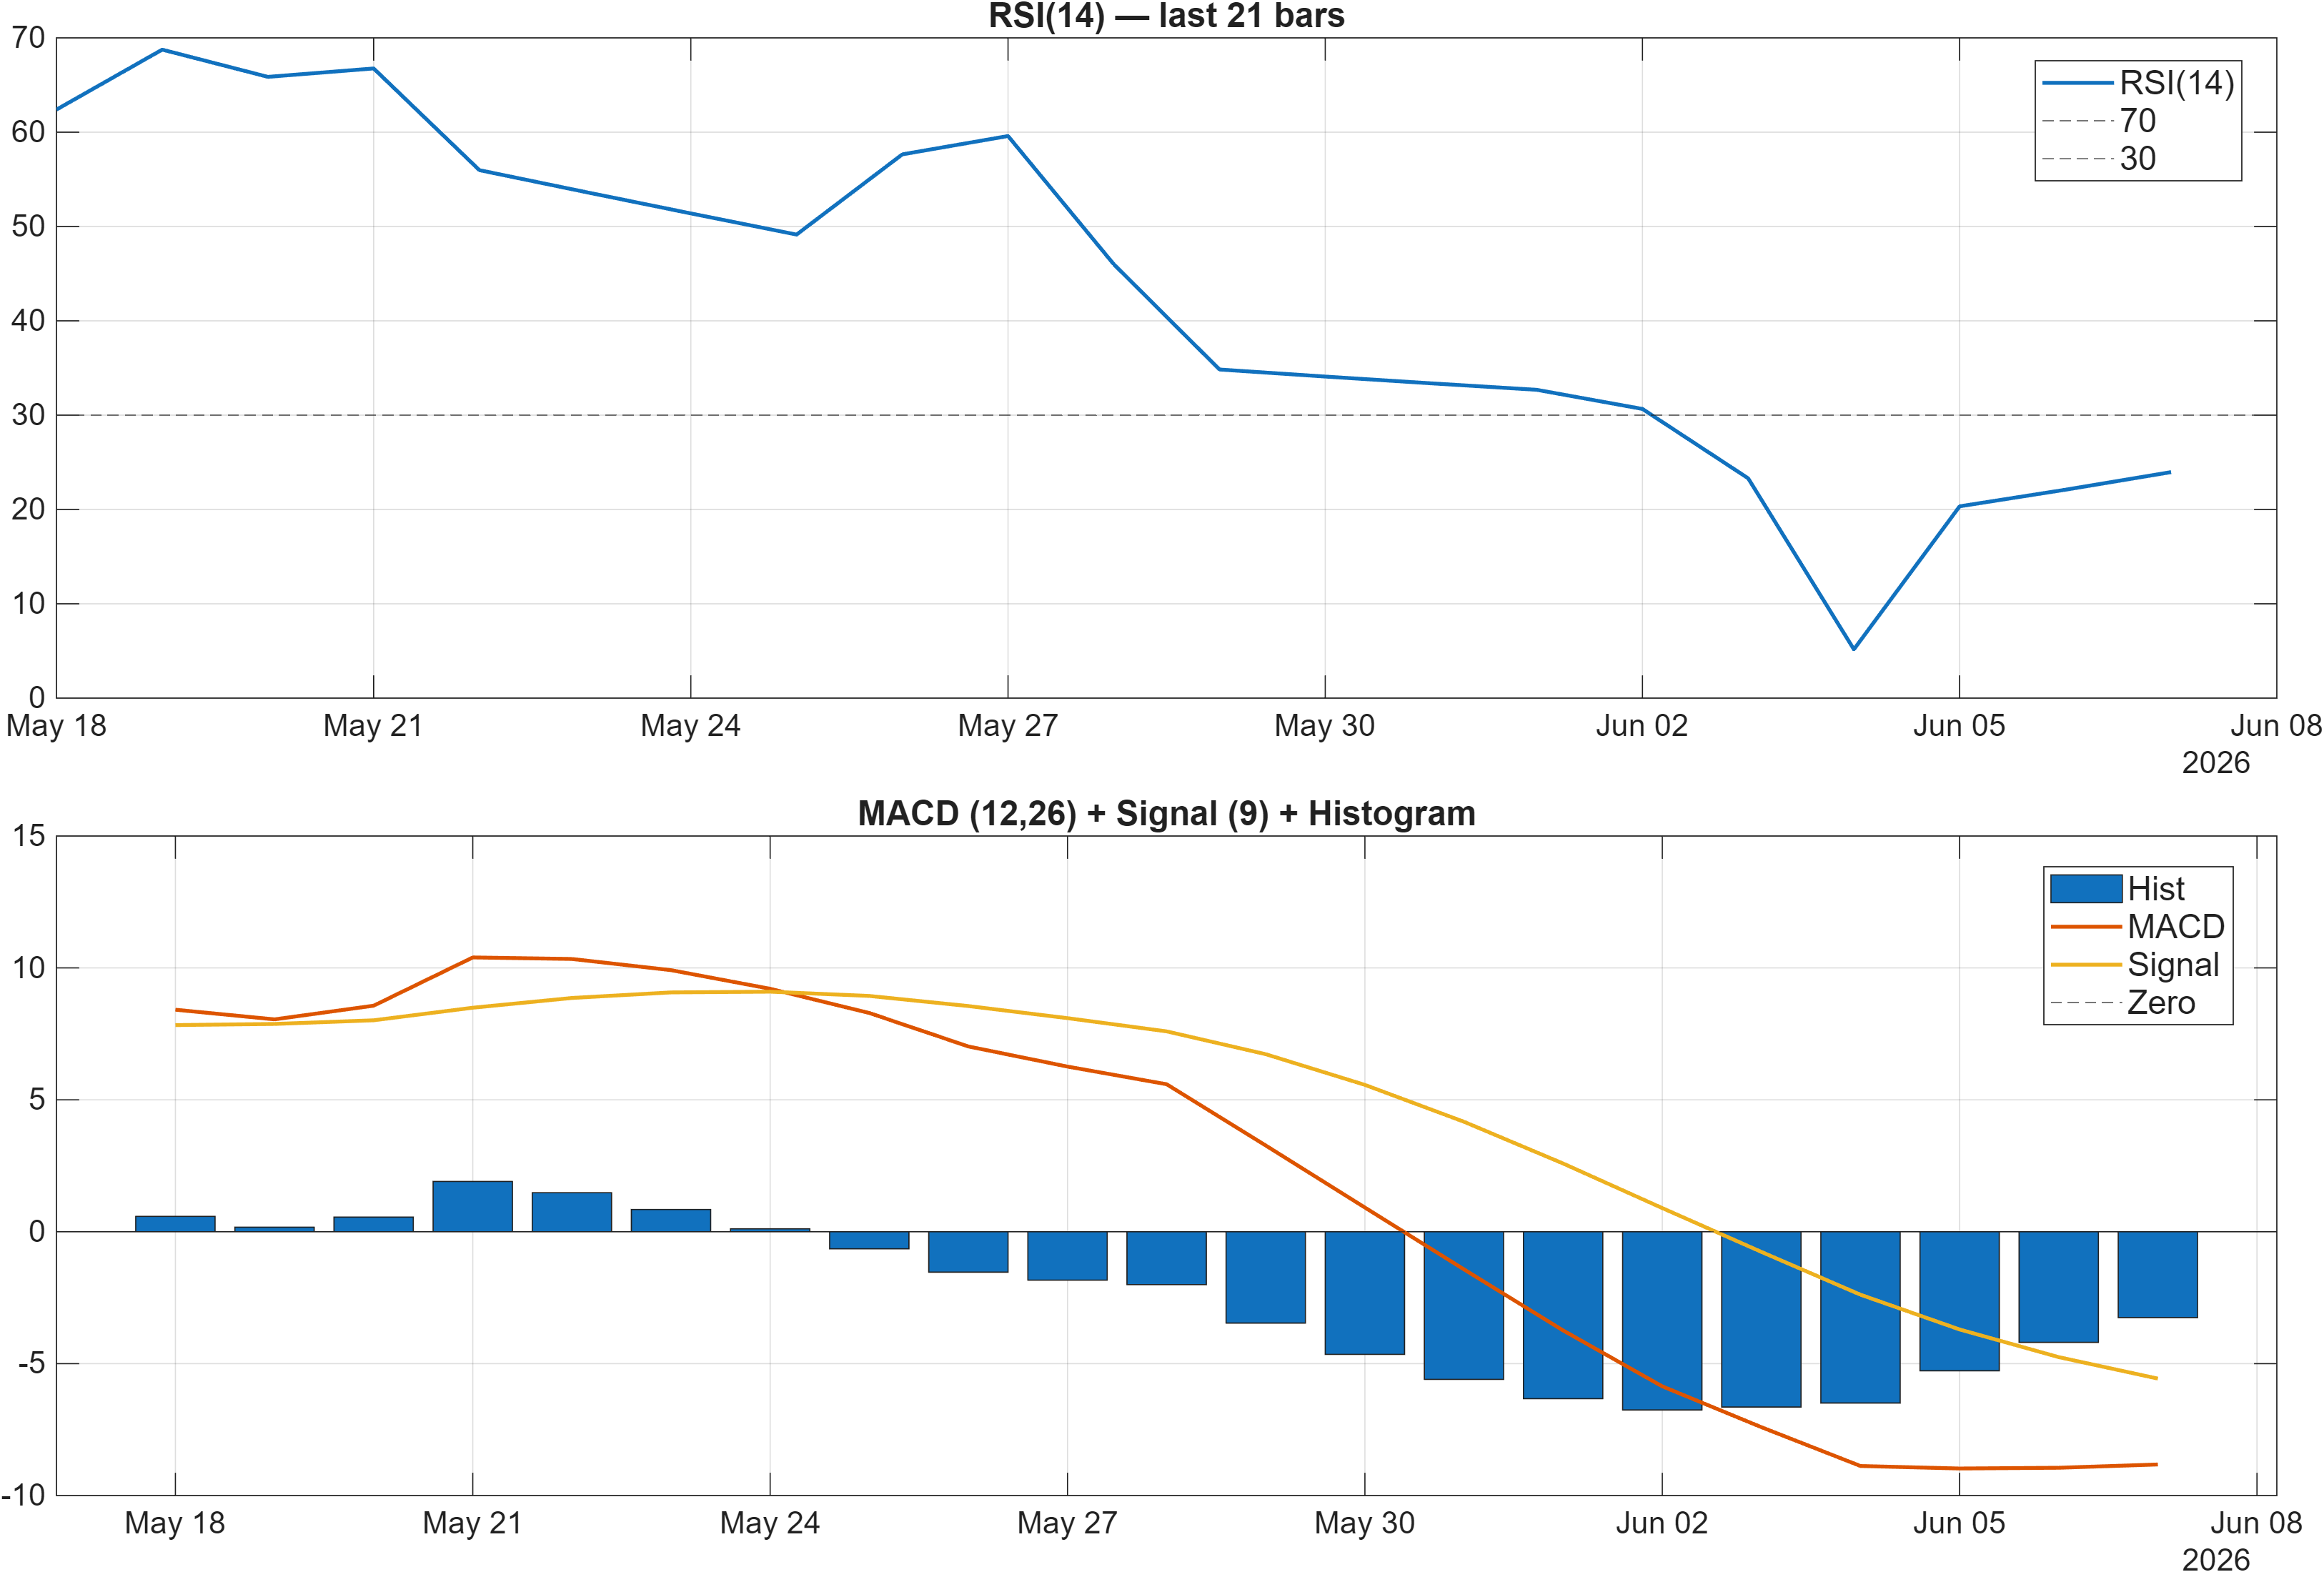
Momentum is currently tilted toward downside pressure. The dashboard flags RSI bias = Bearish, with RSI(14) at 23.96—a level that can coincide with oversold conditions, but in a confluence framework it primarily indicates that sellers have dominated the recent lookback window. The MACD histogram at -3.2556 reinforces that bearish impulse, suggesting that downside momentum has not yet fully mean-reverted.
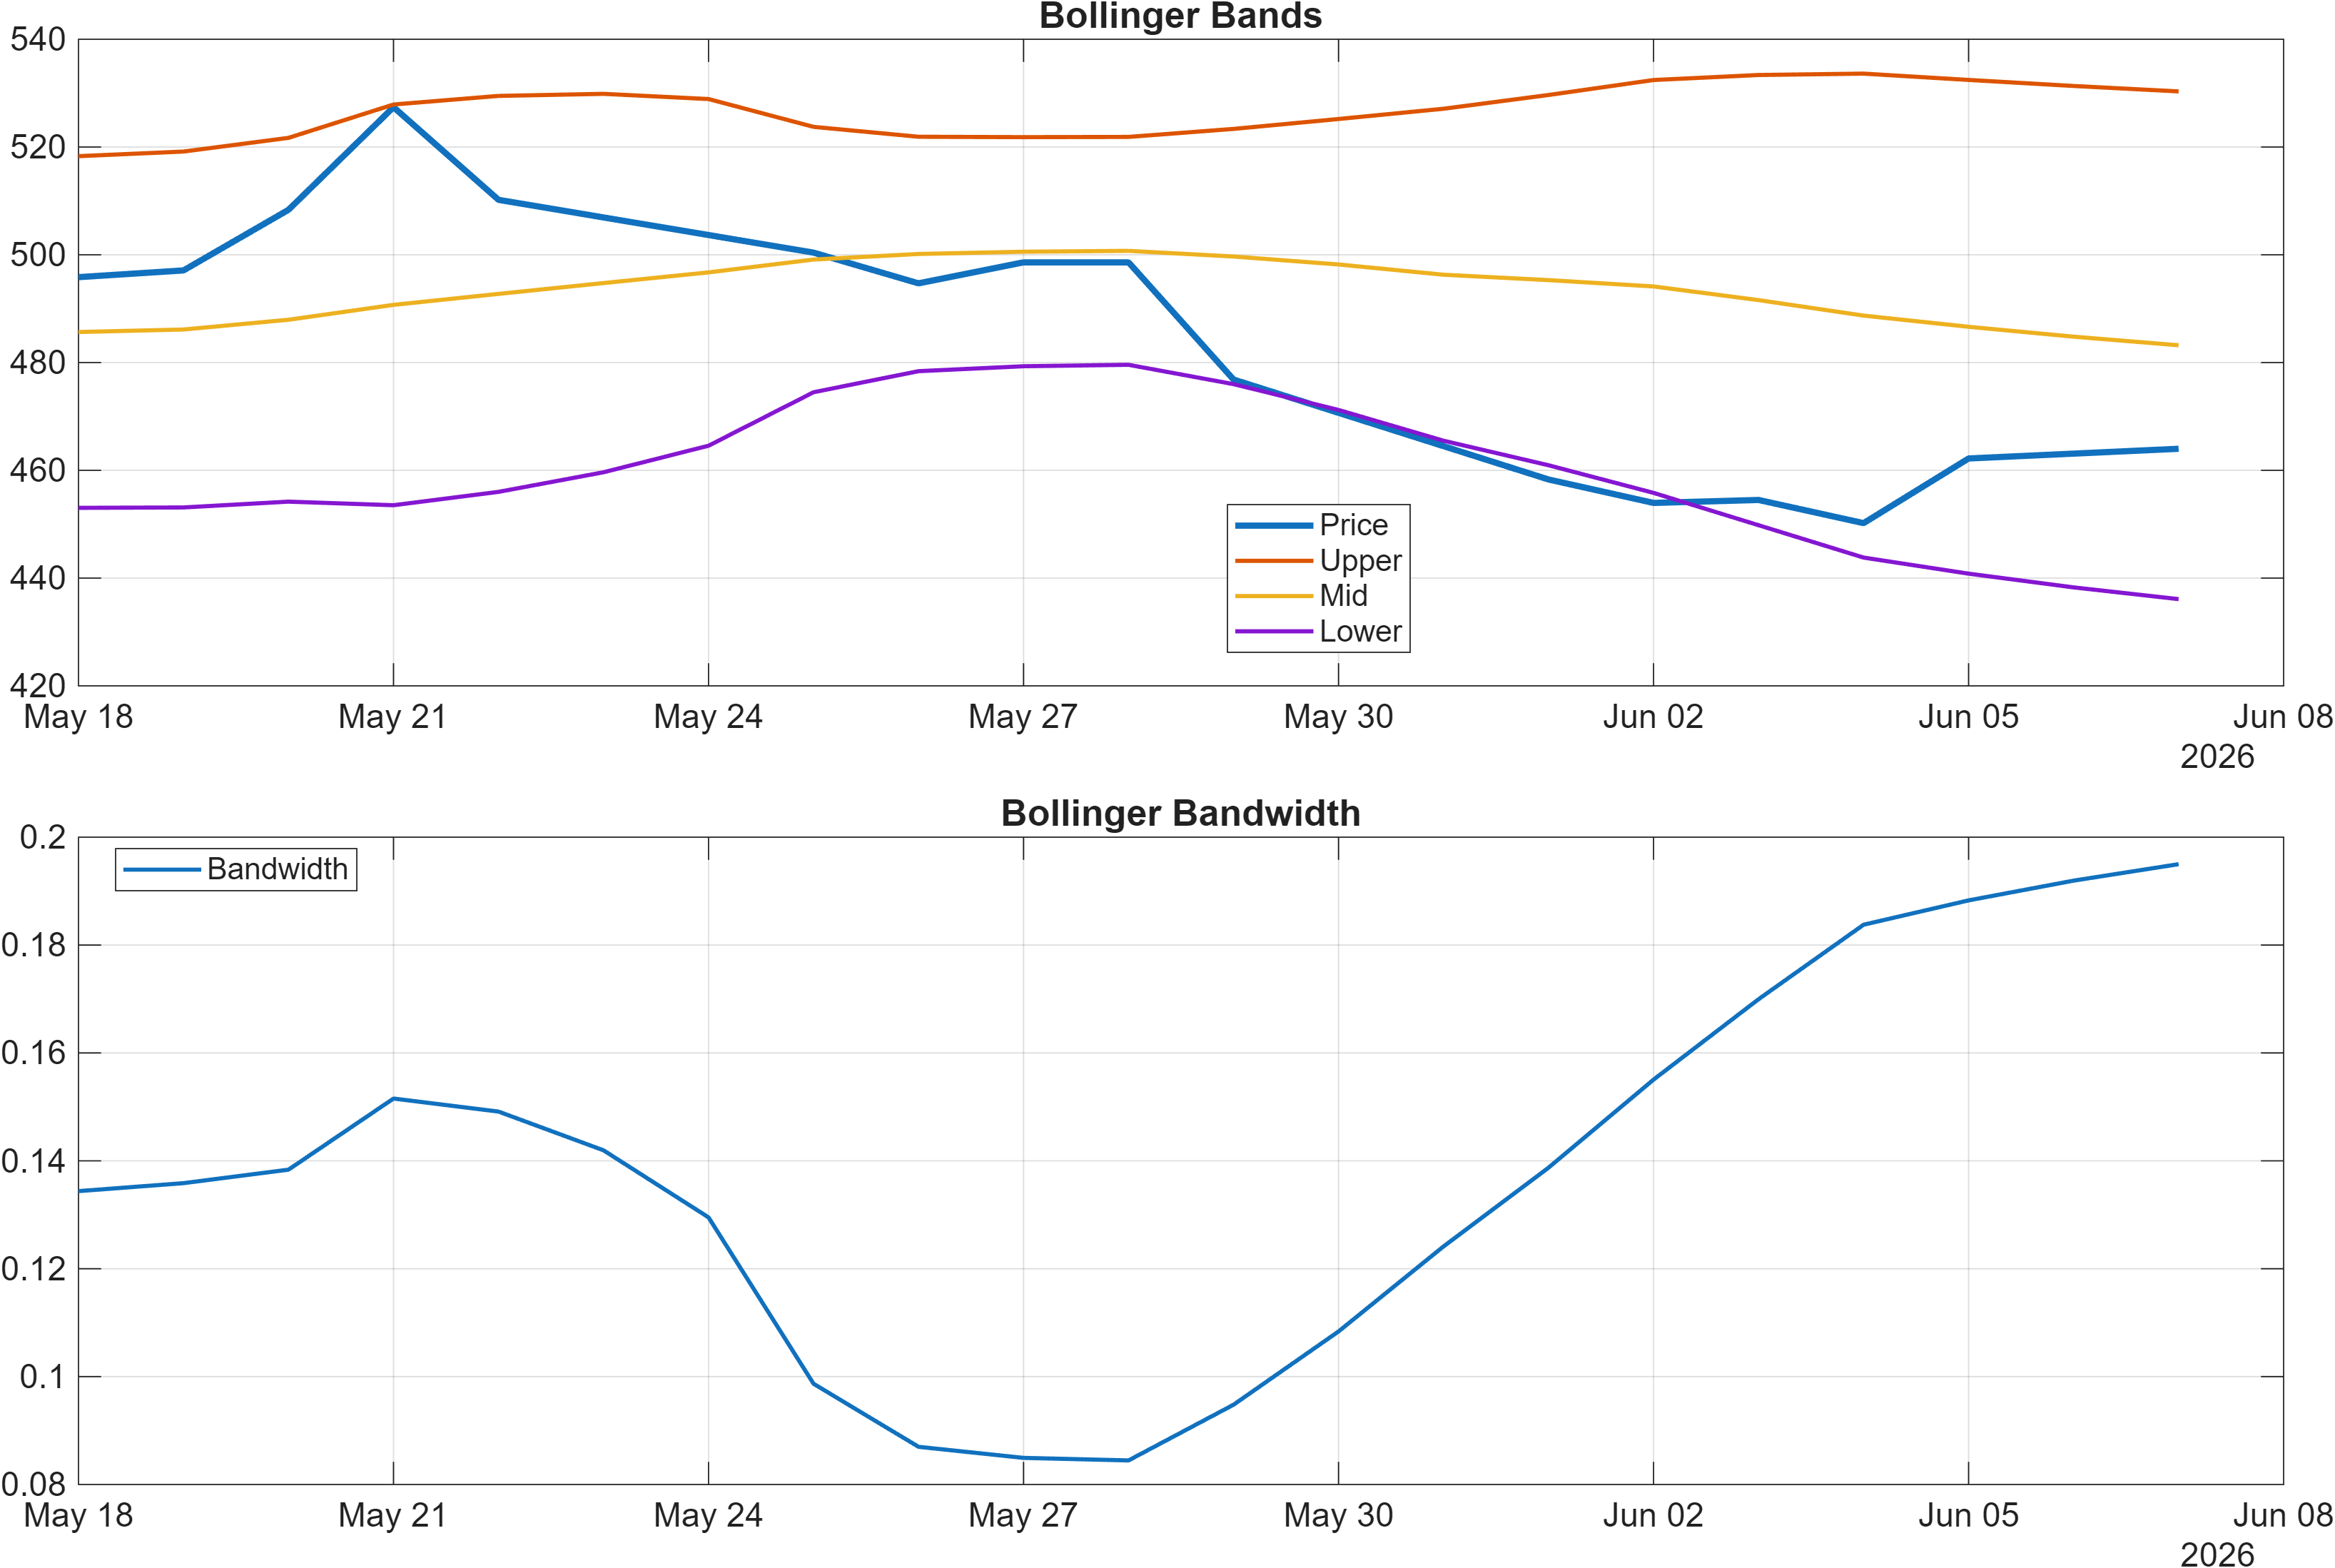
Volatility, however, is not signaling an extreme regime. The Bollinger bandwidth at 0.1950 reads as a contained environment relative to what is usually seen during full capitulation phases. That compression can cut both ways: it can reduce the probability of disorderly moves, but it can also reflect a market that is waiting for a catalyst—often expressed as a later bandwidth expansion.
The key analytical tension is momentum weakness versus broader positioning strength. Strong intermediate ranks (notably #6 over 3 months) can coexist with a negative momentum pocket, but persistence of a negative MACD histogram alongside a depressed RSI tends to delay trend re-acceleration until price structure improves (e.g., reclaiming MA50, or defending support convincingly).
Practically, this dashboard suggests that AIIL is not currently a “clean momentum-long” profile, even if the multi-horizon rank placement remains constructive. Confirmation typically arrives when RSI recovers from depressed levels while MACD histogram begins to contract toward zero, ideally without volatility destabilizing (bandwidth staying controlled while price firms).
4) Support / Resistance zones
Support ~ 431.2250 | Resistance ~ 518.3000
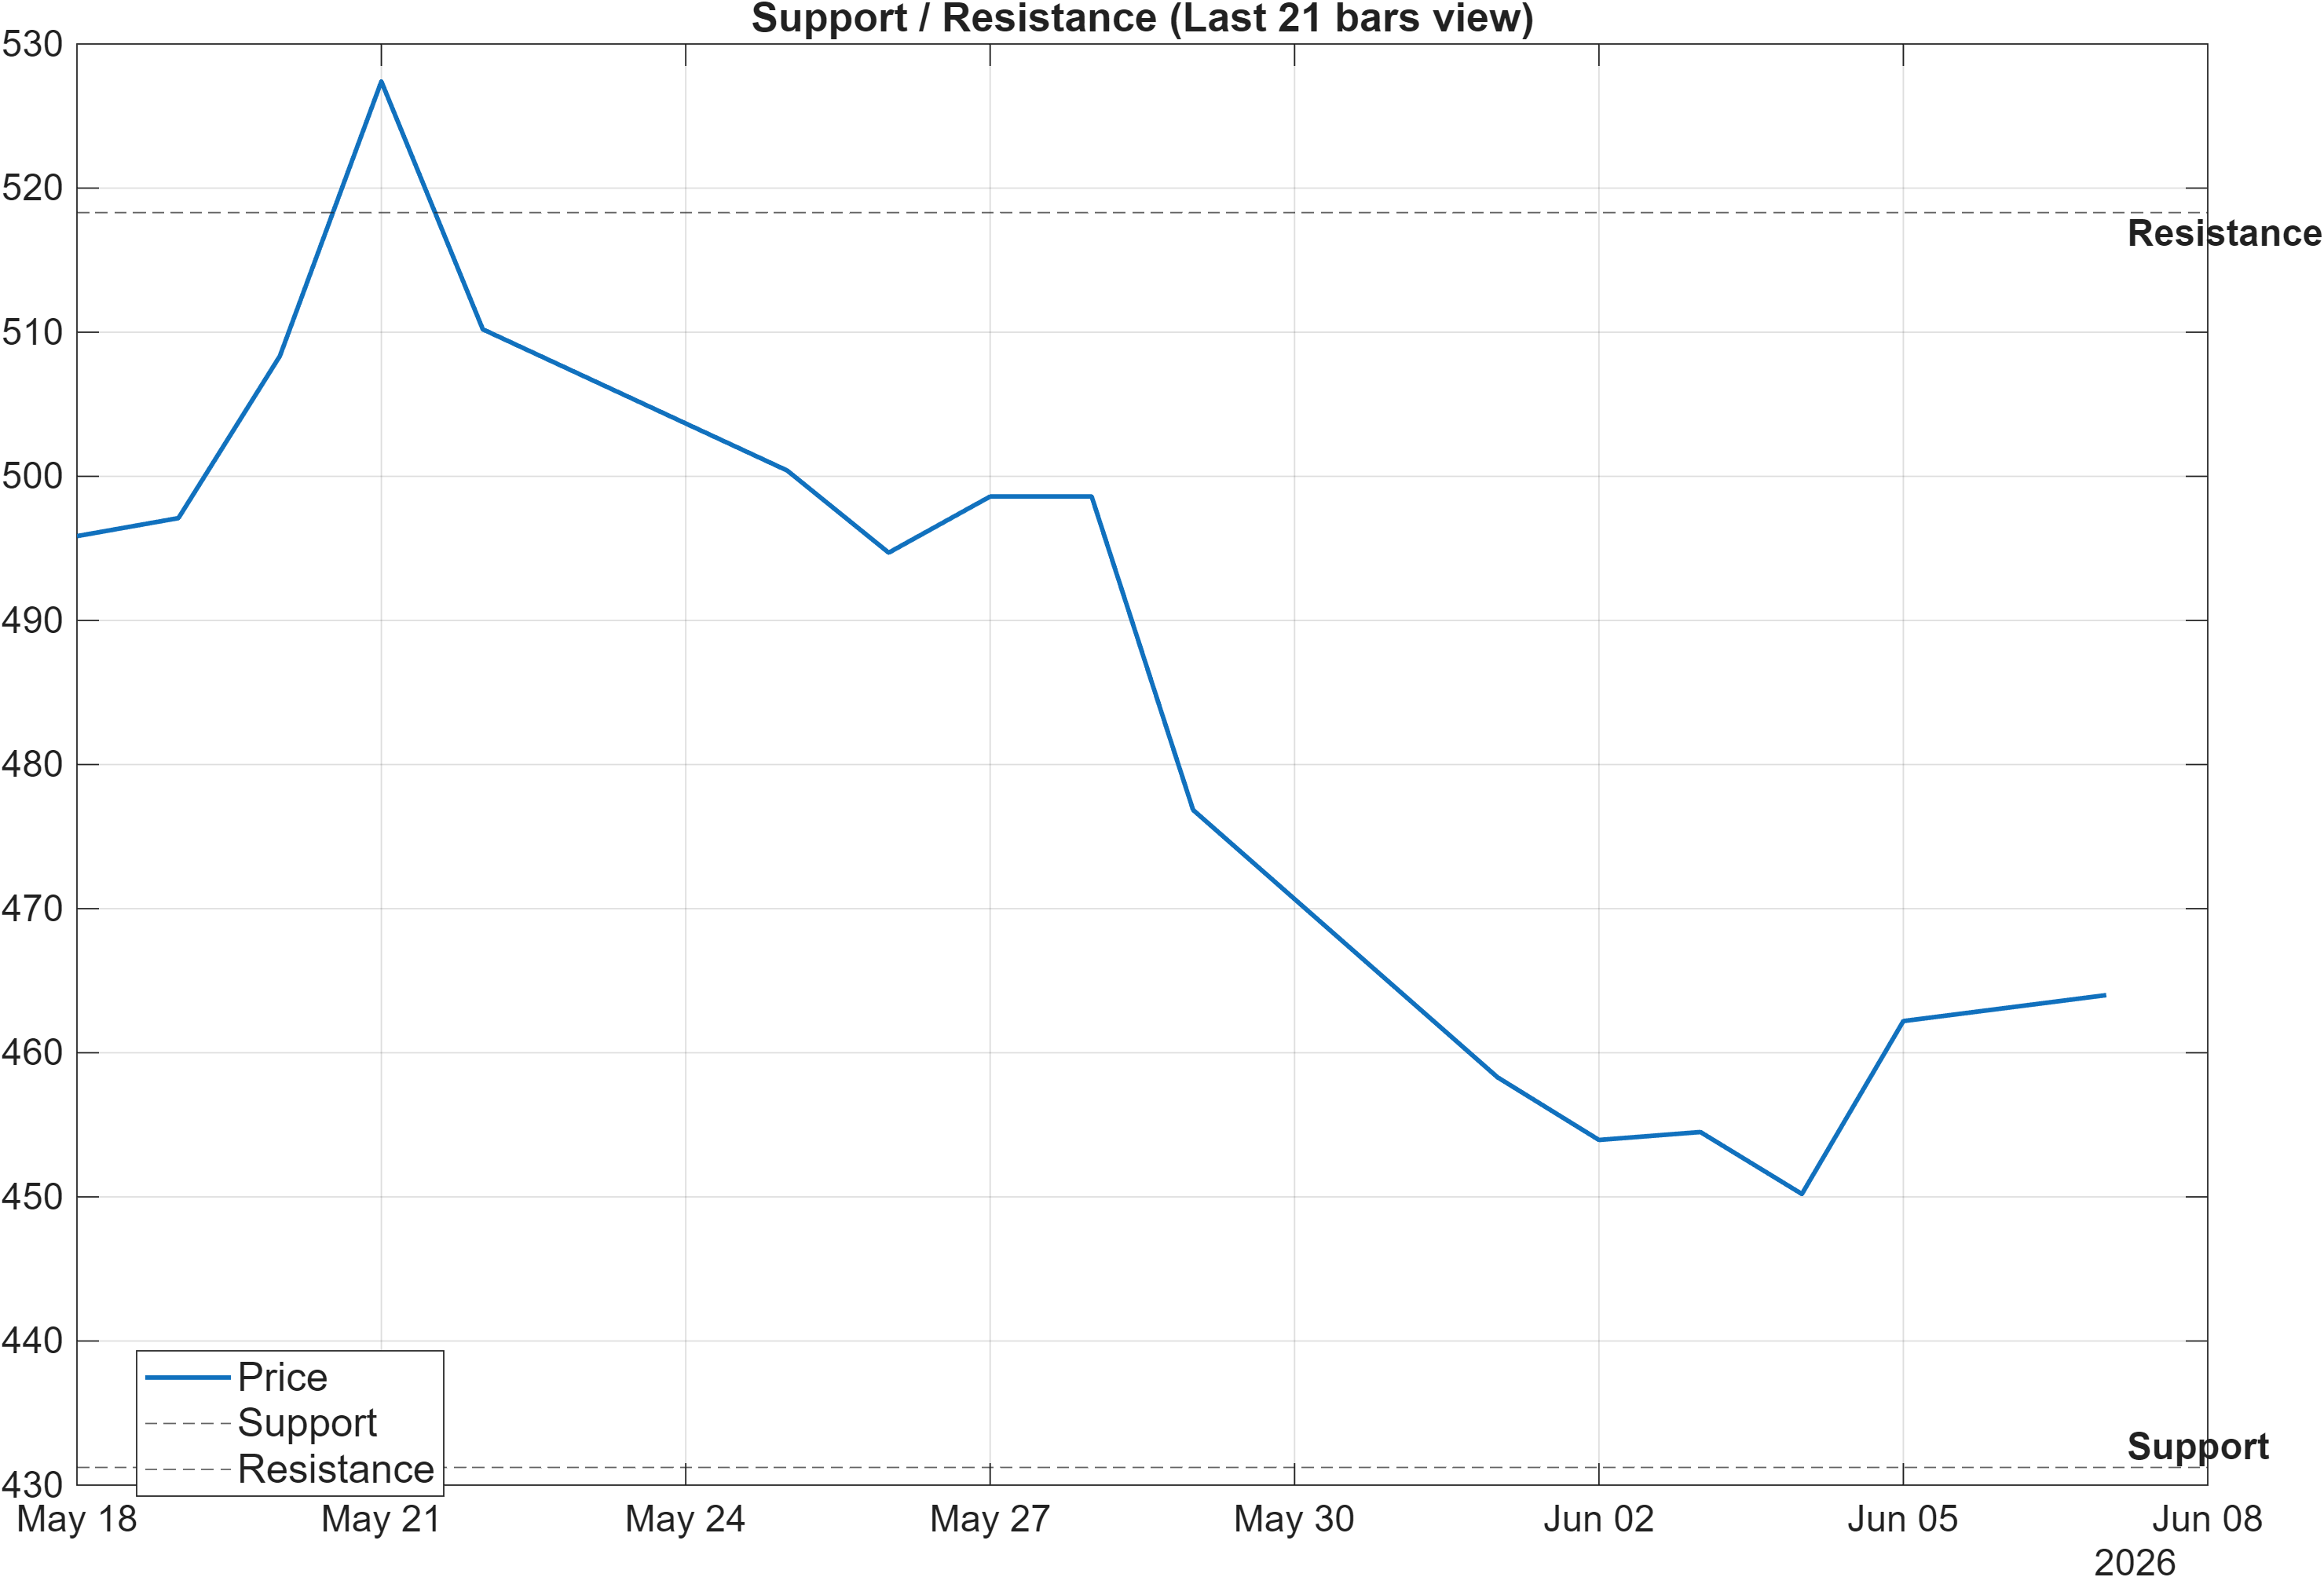
The support/resistance map frames AIIL’s current trade location as a range-defined decision problem. Support is defined near 431.2250, a level that becomes especially relevant given the bearish momentum backdrop (e.g., RSI(14) at 23.96 and MACD histogram at -3.2556). When momentum is weak, supports are tested more frequently; the quality of the response at support often matters more than the first touch.
Resistance sits near 518.3000. In a regime where MA50 vs MA200 is Bullish but close vs MA50 is Bearish, the resistance zone becomes a clean litmus test for whether the broader uptrend is reasserting itself or remaining capped by overhead supply. A constructive resolution would typically require a breakout attempt that is not purely price-based but accompanied by stronger participation (as emphasized by the scenario view: “Break above resistance with volume → continuation”).
The two levels also provide an explicit framework for interpreting the rank/technical divergence. With strong cross-sectional ranks (e.g., Monthly #9, 3-Monthly #6), the market is effectively pricing AIIL as relatively strong versus peers, but the neutral blended technical score (Section 5) suggests the path may remain uneven unless price can either (a) stabilize above support with improving momentum, or (b) decisively reclaim higher structure.
From a risk-control lens, the stated condition “Close below support → signal deterioration risk” is aligned with the current momentum profile: a sustained close below 431.2250 would place the burden of proof on the longer-horizon ranks to remain resilient despite a weakening technical structure.
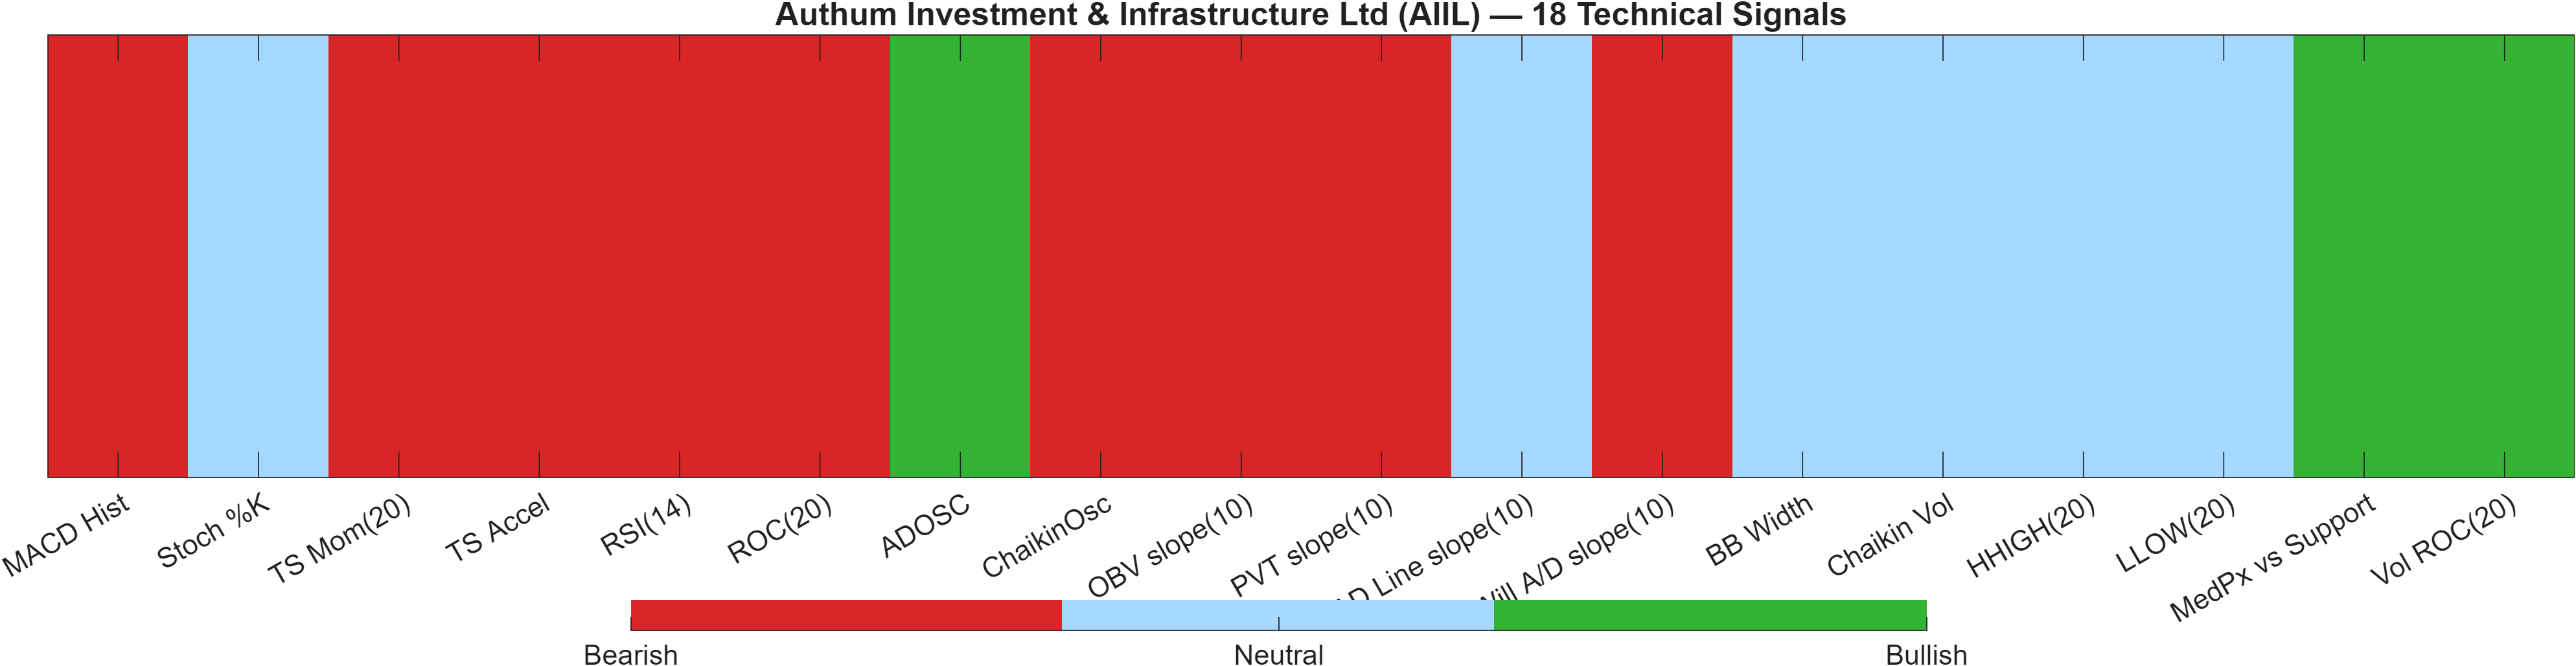
5) Quant Technical Dashboard (18 Signals)
KGNAI AI Technical Analysis Score (Deep Reinforcement Learning): Rank #190 out of 1220 (Rank 1 represents the strongest technical positioning and a higher probability of favorable price behavior. As ranks increase toward the maximum, the probability of favorable outcomes weakens and bearish positioning becomes more dominant.) | Label: Bullish | Score: 0.689
18-Signal Technical Confluence Score: -0.333 (Bearish)
Overall Technical Score (18-signal confluence + DRL rank blend): -0.027 (Neutral)
Note: The blended score reflects signal strength weighted against broader AI technical ranking, which may temporarily diverge.
Blended technical score breakdown: -0.027 (Neutral | Bull 3 / Bear 9 / Neutral 6)
Signal alignment: breadth vs. model-weighted ranking
AIIL’s technical stack is best described as bearish breadth with a moderating model overlay. The 18-signal confluence score is -0.333 (Bearish), consistent with a dashboard where 9 signals are Bearish versus 3 Bullish. Yet the blended output is only -0.027 (Neutral), reflecting that the DRL technical model remains constructive with a 0.689 score and a Bullish label despite a mid-pack rank at #190 out of 1220.
This divergence is analytically important: it suggests that indicator-level weakness is real (breadth is negative), but the broader technical state as learned by the ranking model is not fully consistent with a sustained breakdown. Said differently, the system is not seeing the current weakness as universally “high-risk,” even though many classical signals are tilted bearish.
Indicator details: momentum/flow conflict
| Indicator | Value | Signal |
|---|---|---|
| MACD Hist | -3.256 | Bearish |
| Stoch %K | 40.61 | Neutral |
| TS Mom(20) | -34.9 | Bearish |
| TS Accel | -59.85 | Bearish |
| RSI(14) | 23.96 | Bearish |
| ROC(20) | -6.659 | Bearish |
| ADOSC | 63.04 | Bullish |
| ChaikinOsc | -2735 | Bearish |
| OBV slope(10) | -1.654e+05 | Bearish |
| PVT slope(10) | -3636 | Bearish |
| AD Line slope(10) | — | Neutral |
| Will A/D slope(10) | -74.15 | Bearish |
| BB Width | 0.195 | Neutral |
| Chaikin Vol | -7.743 | Neutral |
| HHIGH(20) | 534 | Neutral |
| LLOW(20) | 441 | Neutral |
| MedPx vs Support | 23.82 | Bullish |
| Vol ROC(20) | 19.38 | Bullish |
The table highlights a key conflict: momentum indicators are weak (RSI(14) 23.96, MACD Hist -3.256, ROC(20) -6.659), while at least some activity/flow measures show constructive elements (ADOSC 63.04, Vol ROC(20) 19.38). This mix is consistent with a market that may be seeing select accumulation signals but has not yet translated them into positive price momentum.
Interpretation: Indicator-level signals form the base confluence, which is then adjusted using a separate AI-driven technical ranking model. The final technical score summarizes this combined view.
6) News sentiment + extractive gist
Note: Instrument-specific news matches were not found, so the digest reflects broader market/sector context. Not available in the provided data for an instrument-specific normalized KGNAI AI News Sentiment Score, while the displayed overall news score is 0.18.
Sentiment metrics skew mildly constructive: average sentiment is 0.179 with 50% Positive and 50% Neutral, and 0% Negative. Recent coverage across major financial outlets indicates a market narrative focused on selective leadership, disciplined positioning, and stock-specific dispersion—conditions that often coexist with uneven short-horizon momentum. For AIIL, that backdrop can be directionally supportive for relative rank persistence, but it does not resolve the near-term technical tension created by a bearish RSI/MACD profile.
Positive Developments
The tone of broader coverage leans toward selective opportunity rather than broad-market exuberance. Commentary emphasizes dispersion—where relative winners can maintain traction even when index-level performance is choppy. This environment can be consistent with AIIL’s strong cross-sectional ranks (notably #9 monthly and #6 over 3 months), because the ranking framework rewards persistence versus peers rather than headline-driven bursts. Coverage also highlights ongoing investor attention to segments typically associated with cyclical or thematic positioning, which can support risk appetite at the margin. Importantly, the absence of negative news classification in the digest (0% Negative) reduces the probability that near-term weakness is being driven by a clearly adverse narrative shock; instead, the setup reads more like technical digestion within an otherwise constructive comparative backdrop.
Neutral / Mixed Developments
Several items are informational and speak more to broader market mechanics than to any issuer-specific catalyst. The “support-test” framing in market commentary aligns with the technical reality that AIIL is operating with defined decision zones—support near 431.2250 and resistance near 518.3000—and that direction may hinge on whether buyers defend key levels while momentum normalizes. Some discussion also centers on index inclusion rules and longer eligibility windows for certain companies, which is relevant mainly as a sentiment backdrop: it reinforces a preference for observable, rule-based frameworks rather than narrative extrapolation. In this context, sentiment is best treated as a soft bias rather than a primary driver.
Negative / Risk Signals
Risk language in the digest is primarily market-structure oriented: emphasis on critical index support areas and the possibility of further weakness if support fails. That framing matters for AIIL because its technical dashboard already shows short-term stress—RSI(14) at 23.96 and MACD histogram at -3.2556—making the tape more sensitive to broader risk-off pulses. Additionally, behavioral-finance reminders about discipline and bias control can be read as a caution against over-weighting single signals: in AIIL’s case, bearish breadth (-0.333) coexists with a neutral blended technical score (-0.027) and Bullish ranks, creating a higher-uncertainty environment until price confirms. The main risk is that weak momentum persists long enough to pressure the 431.2250 support zone.
- What to monitor next: Whether price action holds above 431.2250 as RSI/MACD attempt to stabilize.
- What to monitor next: Any shift from a bearish close-vs-MA50 condition toward reclaiming the MA50 while volatility (bandwidth 0.1950) remains controlled.
- What to monitor next: A breakout attempt toward 518.3000 accompanied by stronger participation (volume confirmation as flagged in the scenario view).
Sources referenced: Reuters, Bloomberg, Yahoo Finance, MarketWatch, Investing.com
Snapshot: AI Rank (Short–Mid–Long): Bullish (Bullish–Bullish–Bullish) · Technical Confluence: Bearish · Key Levels: Support ~431.23 | Resistance ~518.30 · News Sentiment: Positive
7) Sources
- Dalal Street Week Ahead: Will Nifty hold 23,000 as markets test key support? — https://economictimes.indiatimes.com/markets/stocks/news/dalal-street-week-ahead-will-nifty-hold-23000-as-markets-test-key-support/articleshow/131550486.cms
- SpaceX and other mega IPOs may wait years to join the S&P 500 — https://economictimes.indiatimes.com/markets/us-stocks/news/spacex-and-other-mega-ipos-may-wait-years-to-join-the-sp-500/articleshow/131550241.cms
- Stock pickers’ market ahead as RBI flags risks; largecaps, banks and capex plays offer value: George Thomas — https://economictimes.indiatimes.com/markets/expert-view/stock-pickers-market-ahead-as-rbi-flags-risks-largecaps-banks-and-capex-plays-offer-value-george-thomas/articleshow/131549054.cms
- Market turns selective as earnings diverge; power, EVs and midcaps emerge as key bets: Siddhartha Khemka — https://economictimes.indiatimes.com/markets/expert-view/market-turns-elective-as-earnings-diverge-power-evs-and-midcaps-emerge-as-key-bets-siddhartha-khemka/articleshow/131548919.cms
- Macquarie initiates 'Underperform' rating on Meesho, sees 25% downside. Here's why — https://economictimes.indiatimes.com/markets/stocks/news/macquarie-initiates-underperform-rating-on-meesho-sees-25-downside-heres-why/articleshow/131548084.cms
- James Montier’s Formula for Investment Success: Master Your Mind Before the Market — https://economictimes.indiatimes.com/markets/us-stocks/news/james-montiers-formula-for-investment-success-master-your-mind-before-the-market/articleshow/131547763.cms
- Vanguard’s India Portfolio: 12 stocks surge up to 87% in CY26; 2 new Q4 entrants — https://economictimes.indiatimes.com/markets/stocks/news/vanguards-india-portfolio-12-stocks-surge-up-to-87-in-cy26-2-new-q4-entrants/slideshow/131547625.cms
- When is the best time to trade crypto in India? — https://economictimes.indiatimes.com/markets/cryptocurrency/when-is-the-best-time-to-trade-crypto-in-india/articleshow/131547312.cms
You may also like: How KGNAI AI ranks instruments across global markets
Disclaimer: KGNAI provides AI-generated analytics and educational market commentary only. This is not financial advice. Markets involve risk. Always do your own research.