
SPORTKING (Sportking India Ltd) — 31-May-2026 Technicals Supportive, Short-Term Rank Diverges
Sportking India Ltd (SPORTKING) enters the latest readout with a notable timeframe split: the daily rank is #1026 (weak near-term positioning), while higher-timeframe ranks remain decisively constructive, including a monthly rank of #1 and a yearly rank of #5 across a 1221-instrument India universe. On pure chart structure, the moving-average setup is described as bullish (close vs MA50 bullish; MA50 vs MA200 bullish), while momentum remains elevated with RSI(14) at 73.26 and a positive MACD histogram of 0.8482. Volatility is not dormant—Bollinger bandwidth is 0.3163—which can amplify both continuation and pullback risk around defined levels. The primary decision zones remain support near 130.6750 and resistance near 173.5500, with news sentiment skewing positive (0.99 normalized score) despite limited instrument-specific matches in the feed.
- Rank stance: Short-term Bearish (daily #1026) | Mid-term Bullish (weekly #8) | Long-term Bullish (monthly & 3-monthly #1; yearly #5)
- Technical confluence: Bullish (18-signal confluence 0.556; overall blended 0.476) with a Neutral DRL rank (#434)
- Key levels: Support ~ 130.6750 | Resistance ~ 173.5500
- News sentiment bias: Bullish (normalized score 0.99; avg sentiment 0.263)
- Confirmation / invalidation condition: A sustained move above 173.5500 with volume supports continuation; a close below 130.6750 elevates deterioration risk.
KGNAI evaluates assets using large cross-sectional datasets built from millions of structured data points. Inputs incorporate fundamental metrics, technical structures, and systematically processed news sentiment. Statistical models, machine learning, and AI frameworks are used to assess relative positioning, signal alignment, and probabilistic behavior across broad universes.
- Ranks are comparative across the tracked universe, not absolute price targets.
- Confluence reflects alignment among independent signal groups.
- Support/resistance levels are probabilistic decision zones, not guarantees.
- Sentiment provides contextual bias within the broader analytical framework.
KGNAI Signal + Technical Snapshot + News Sentiment Digest
As of: 31-May-2026
Ticker: SPORTKING
1) KGNAI AI Analysis
Region: INDIA
Total universe size: 1221 ranked instruments
- Daily rank: #1026 out of 1221 — Bearish
- Weekly rank: #8 out of 1221 — Bullish
- Monthly rank: #1 out of 1221 — Bullish
- 3-Monthly rank: #1 out of 1221 — Bullish
- 6-Monthly rank: #11 out of 1221 — Bullish
- Yearly rank: #5 out of 1221 — Bullish
Timeframe dispersion: short-term weakness vs longer-horizon strength
The rank profile is dominated by a clear horizon mismatch. SPORTKING’s daily rank (#1026) places it in the weaker tail of the tracked universe on the shortest lookback, while the weekly rank (#8) shifts to the upper tier, and the monthly and 3-monthly ranks (#1 in both) sit at the extreme strong end. The yearly reading (#5) further reinforces that longer-horizon positioning remains unusually constructive relative to peers.
This configuration often indicates that recent price behavior is either consolidating after an extended advance or experiencing a near-term reaction that has not yet altered higher-timeframe structure. The key analytical point is persistence: if the daily weakness remains transient while weekly/monthly strength holds, the regime can be interpreted as trend-consistent with tactical volatility. Conversely, if short-term rank deterioration persists, it can become the first place where broader alignment begins to break.
KGNAI’s term view already encodes this split—short-term bearish with mid- and long-term bullish bias—so interpretation hinges on whether subsequent updates pull the weekly rank down from the top decile toward the middle of the distribution. Until that happens, the most consistent read is structural strength with short-horizon fragility, rather than a confirmed regime reversal.
KGNAI ranks each instrument across large universes using multiple proprietary AI tests and statistical models (millions of data points). Lower ranks generally indicate stronger probability of favorable performance behavior, while higher ranks indicate weaker probability and more bearish positioning.
2) Price & trend overview
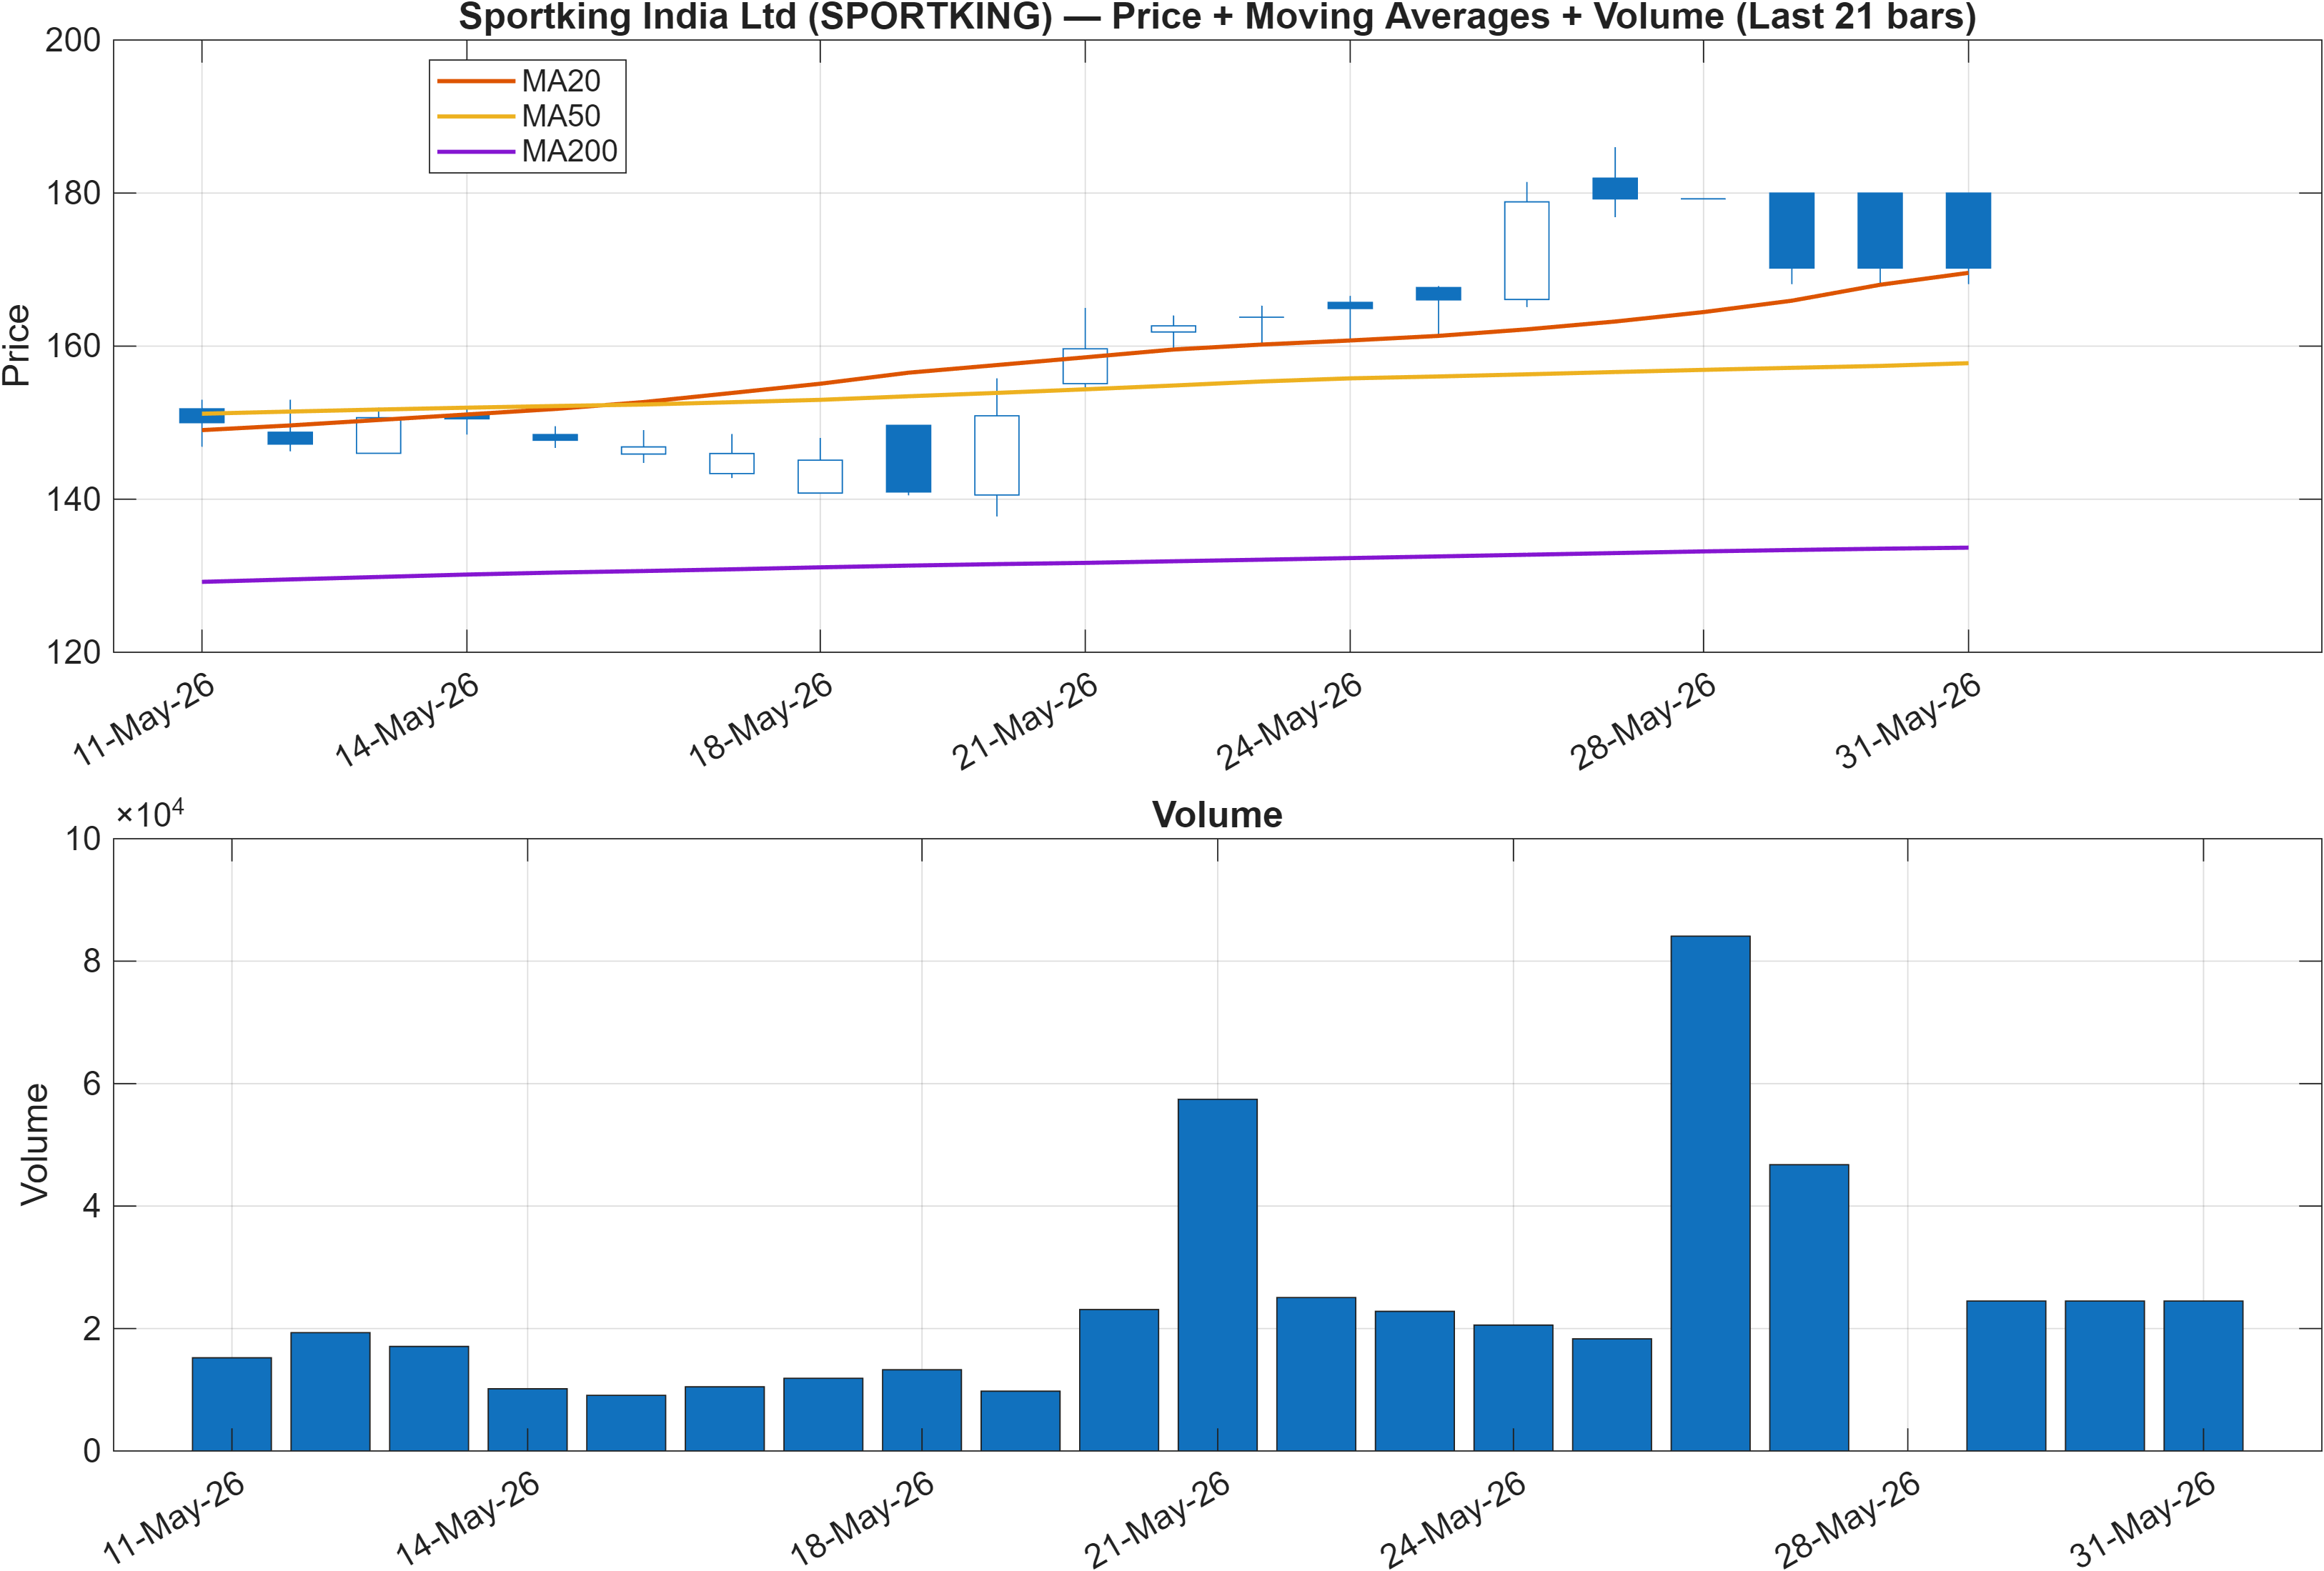
Interpretation: Close vs MA50 = Bullish, MA50 vs MA200 = Bullish.
Trend state: constructive structure with near-term pressure risk
The trend readout is supportive on two independent moving-average relationships: price action is described as bullish versus the MA50, and the MA50 vs MA200 relationship is also bullish. This combination typically characterizes a market that retains an upward structural bias, where pullbacks are more often evaluated as mean-reversion within trend rather than immediate trend failure.
The main tension comes from cross-checking this with the rank dispersion highlighted earlier: a bullish trend structure can coexist with a weak daily rank (#1026) when the market is undergoing a short-term digestion phase—often visible as choppy candles, slower follow-through, or intermittent volume bursts. In that environment, the moving averages can lag, staying constructive even as short-horizon behavior becomes less favorable.
Practical interpretation is therefore about trend integrity versus timing. With long-horizon ranks anchored near the top of the universe (monthly/3-monthly #1, yearly #5), the moving-average stack becomes a structural “backdrop,” while tactical decisions are better framed around whether price holds above probabilistic support (130.6750) and whether subsequent advances can approach resistance (173.5500) without a pronounced rise in rejection wicks or distribution signals.
If the MA-based trend remains bullish while momentum measures stay elevated (for example, RSI(14) at 73.26), the setup leans toward continuation risk-on; if the daily weakness persists and price begins to violate key zones, the trend read can shift from “supportive” to “late-cycle,” even before longer averages flip.
3) Momentum & volatility dashboard
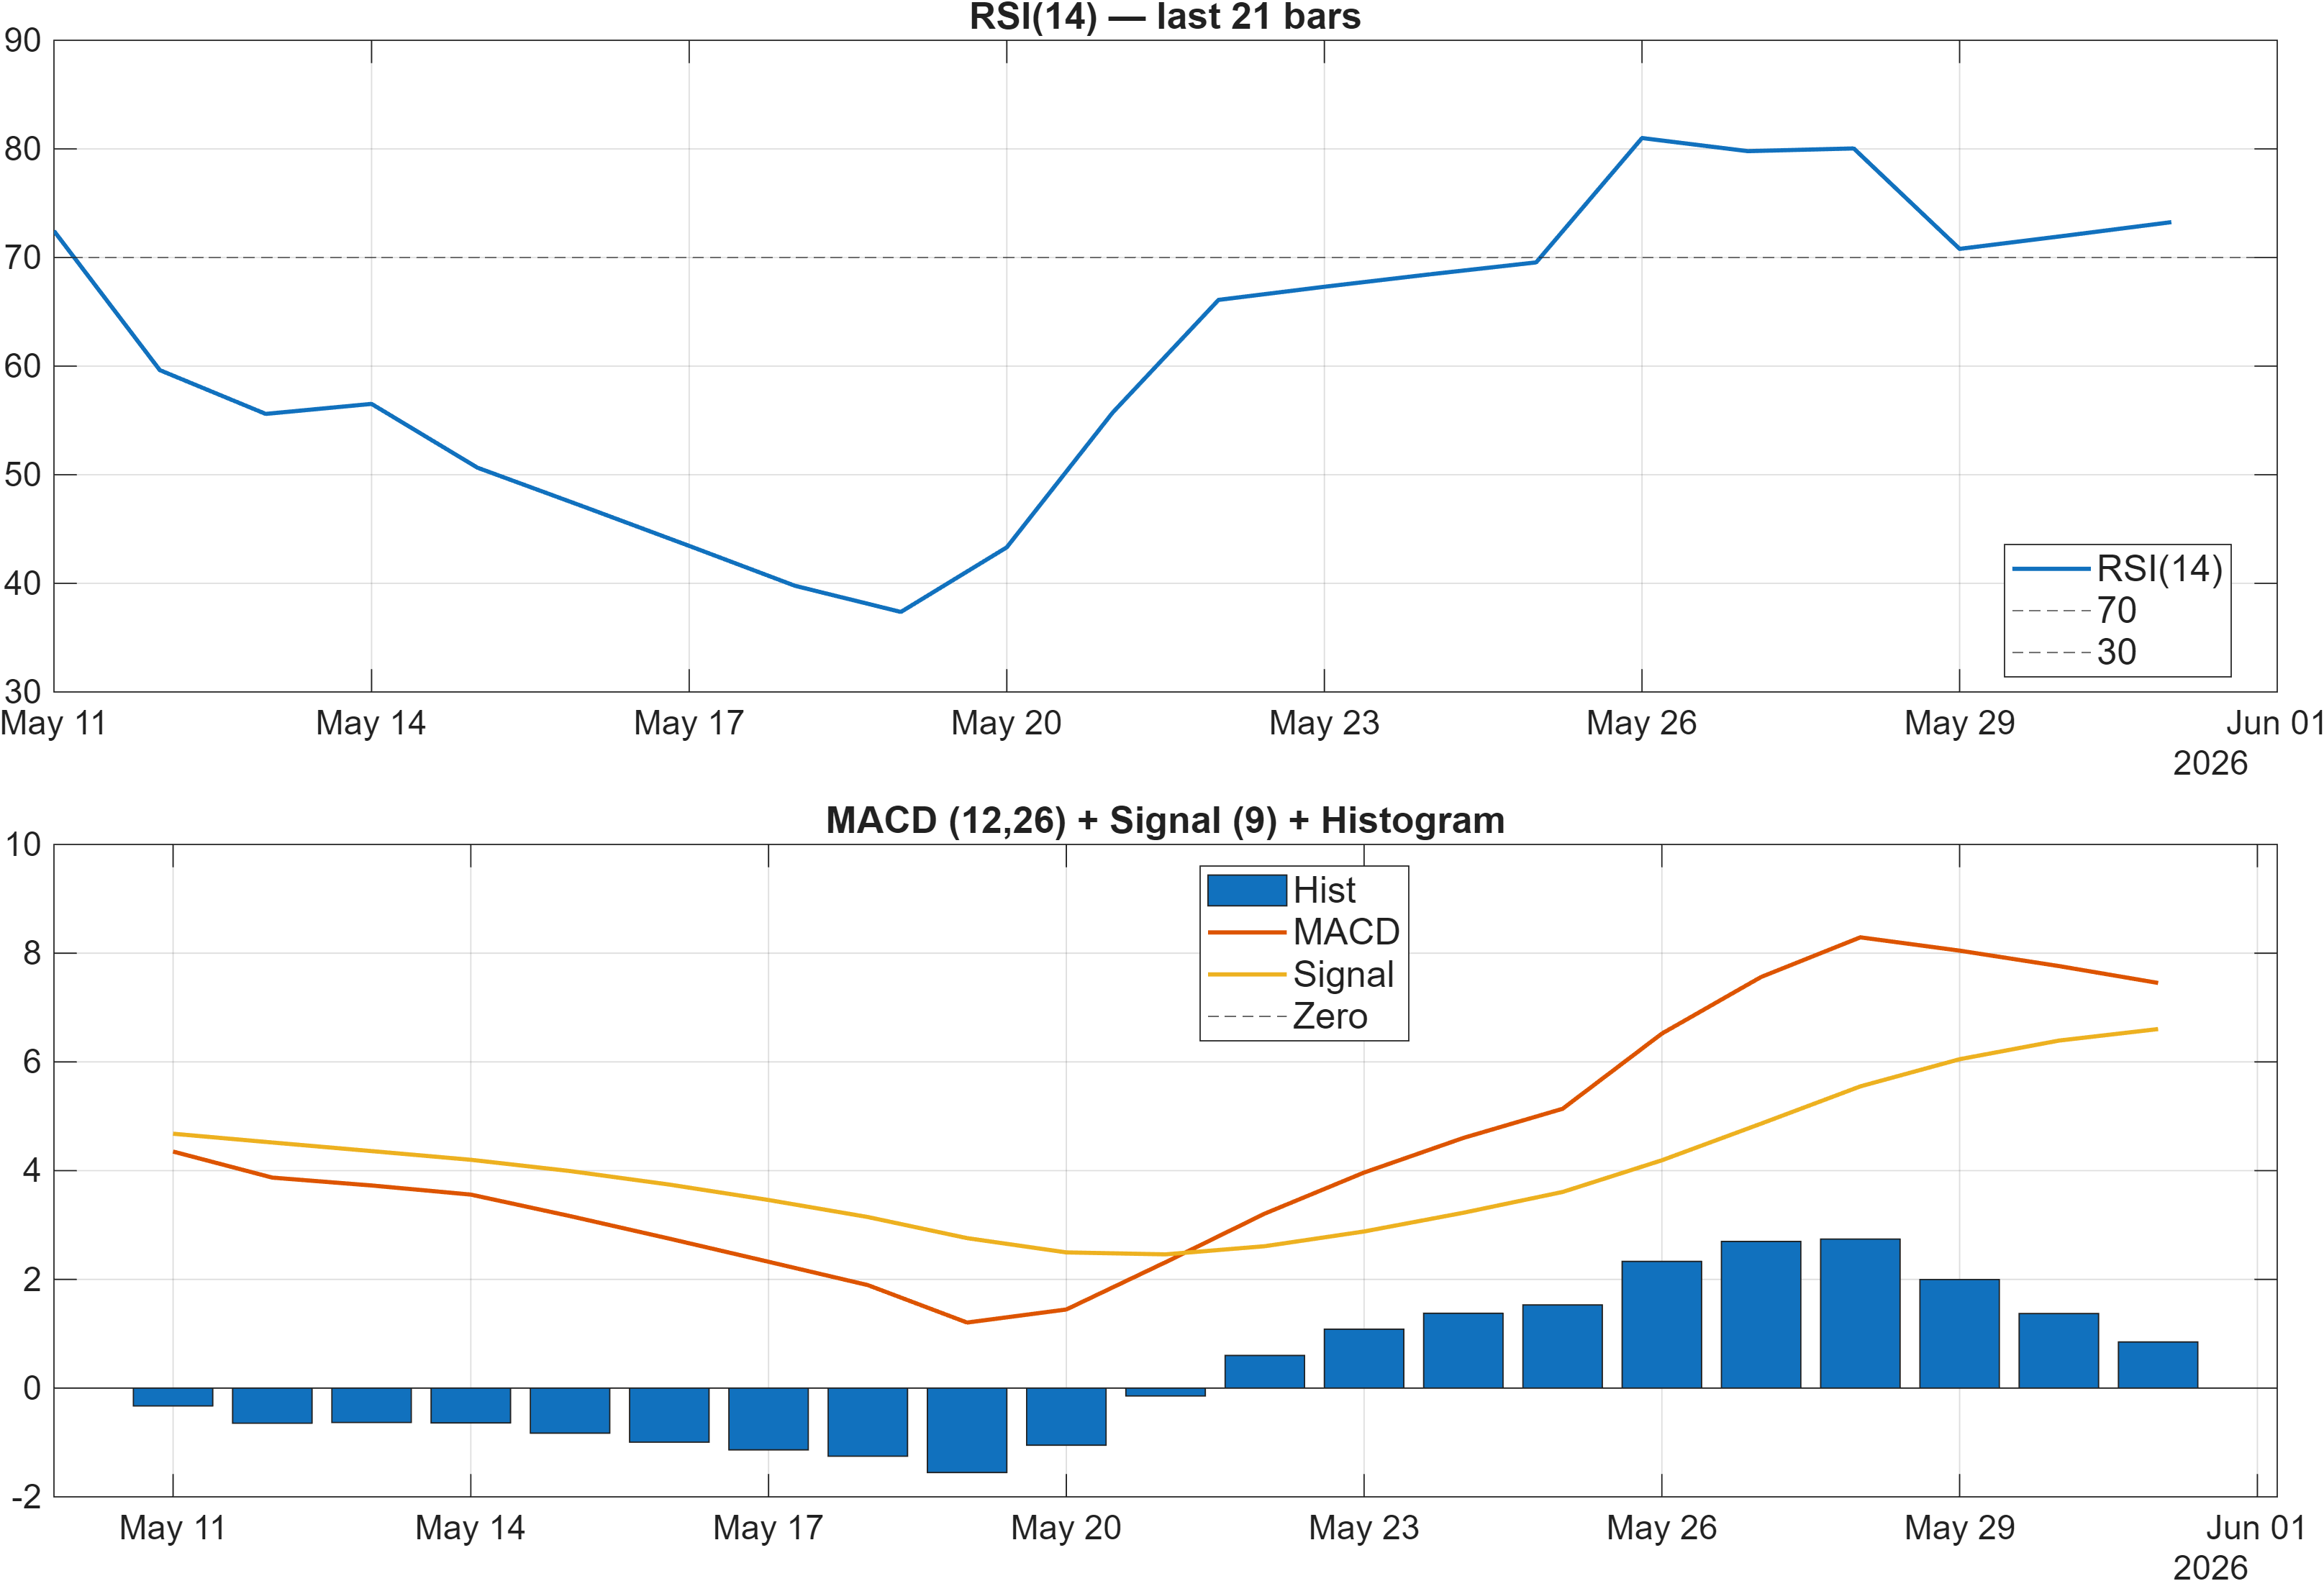
Interpretation: RSI bias = Bullish, MACD hist = 0.8482.
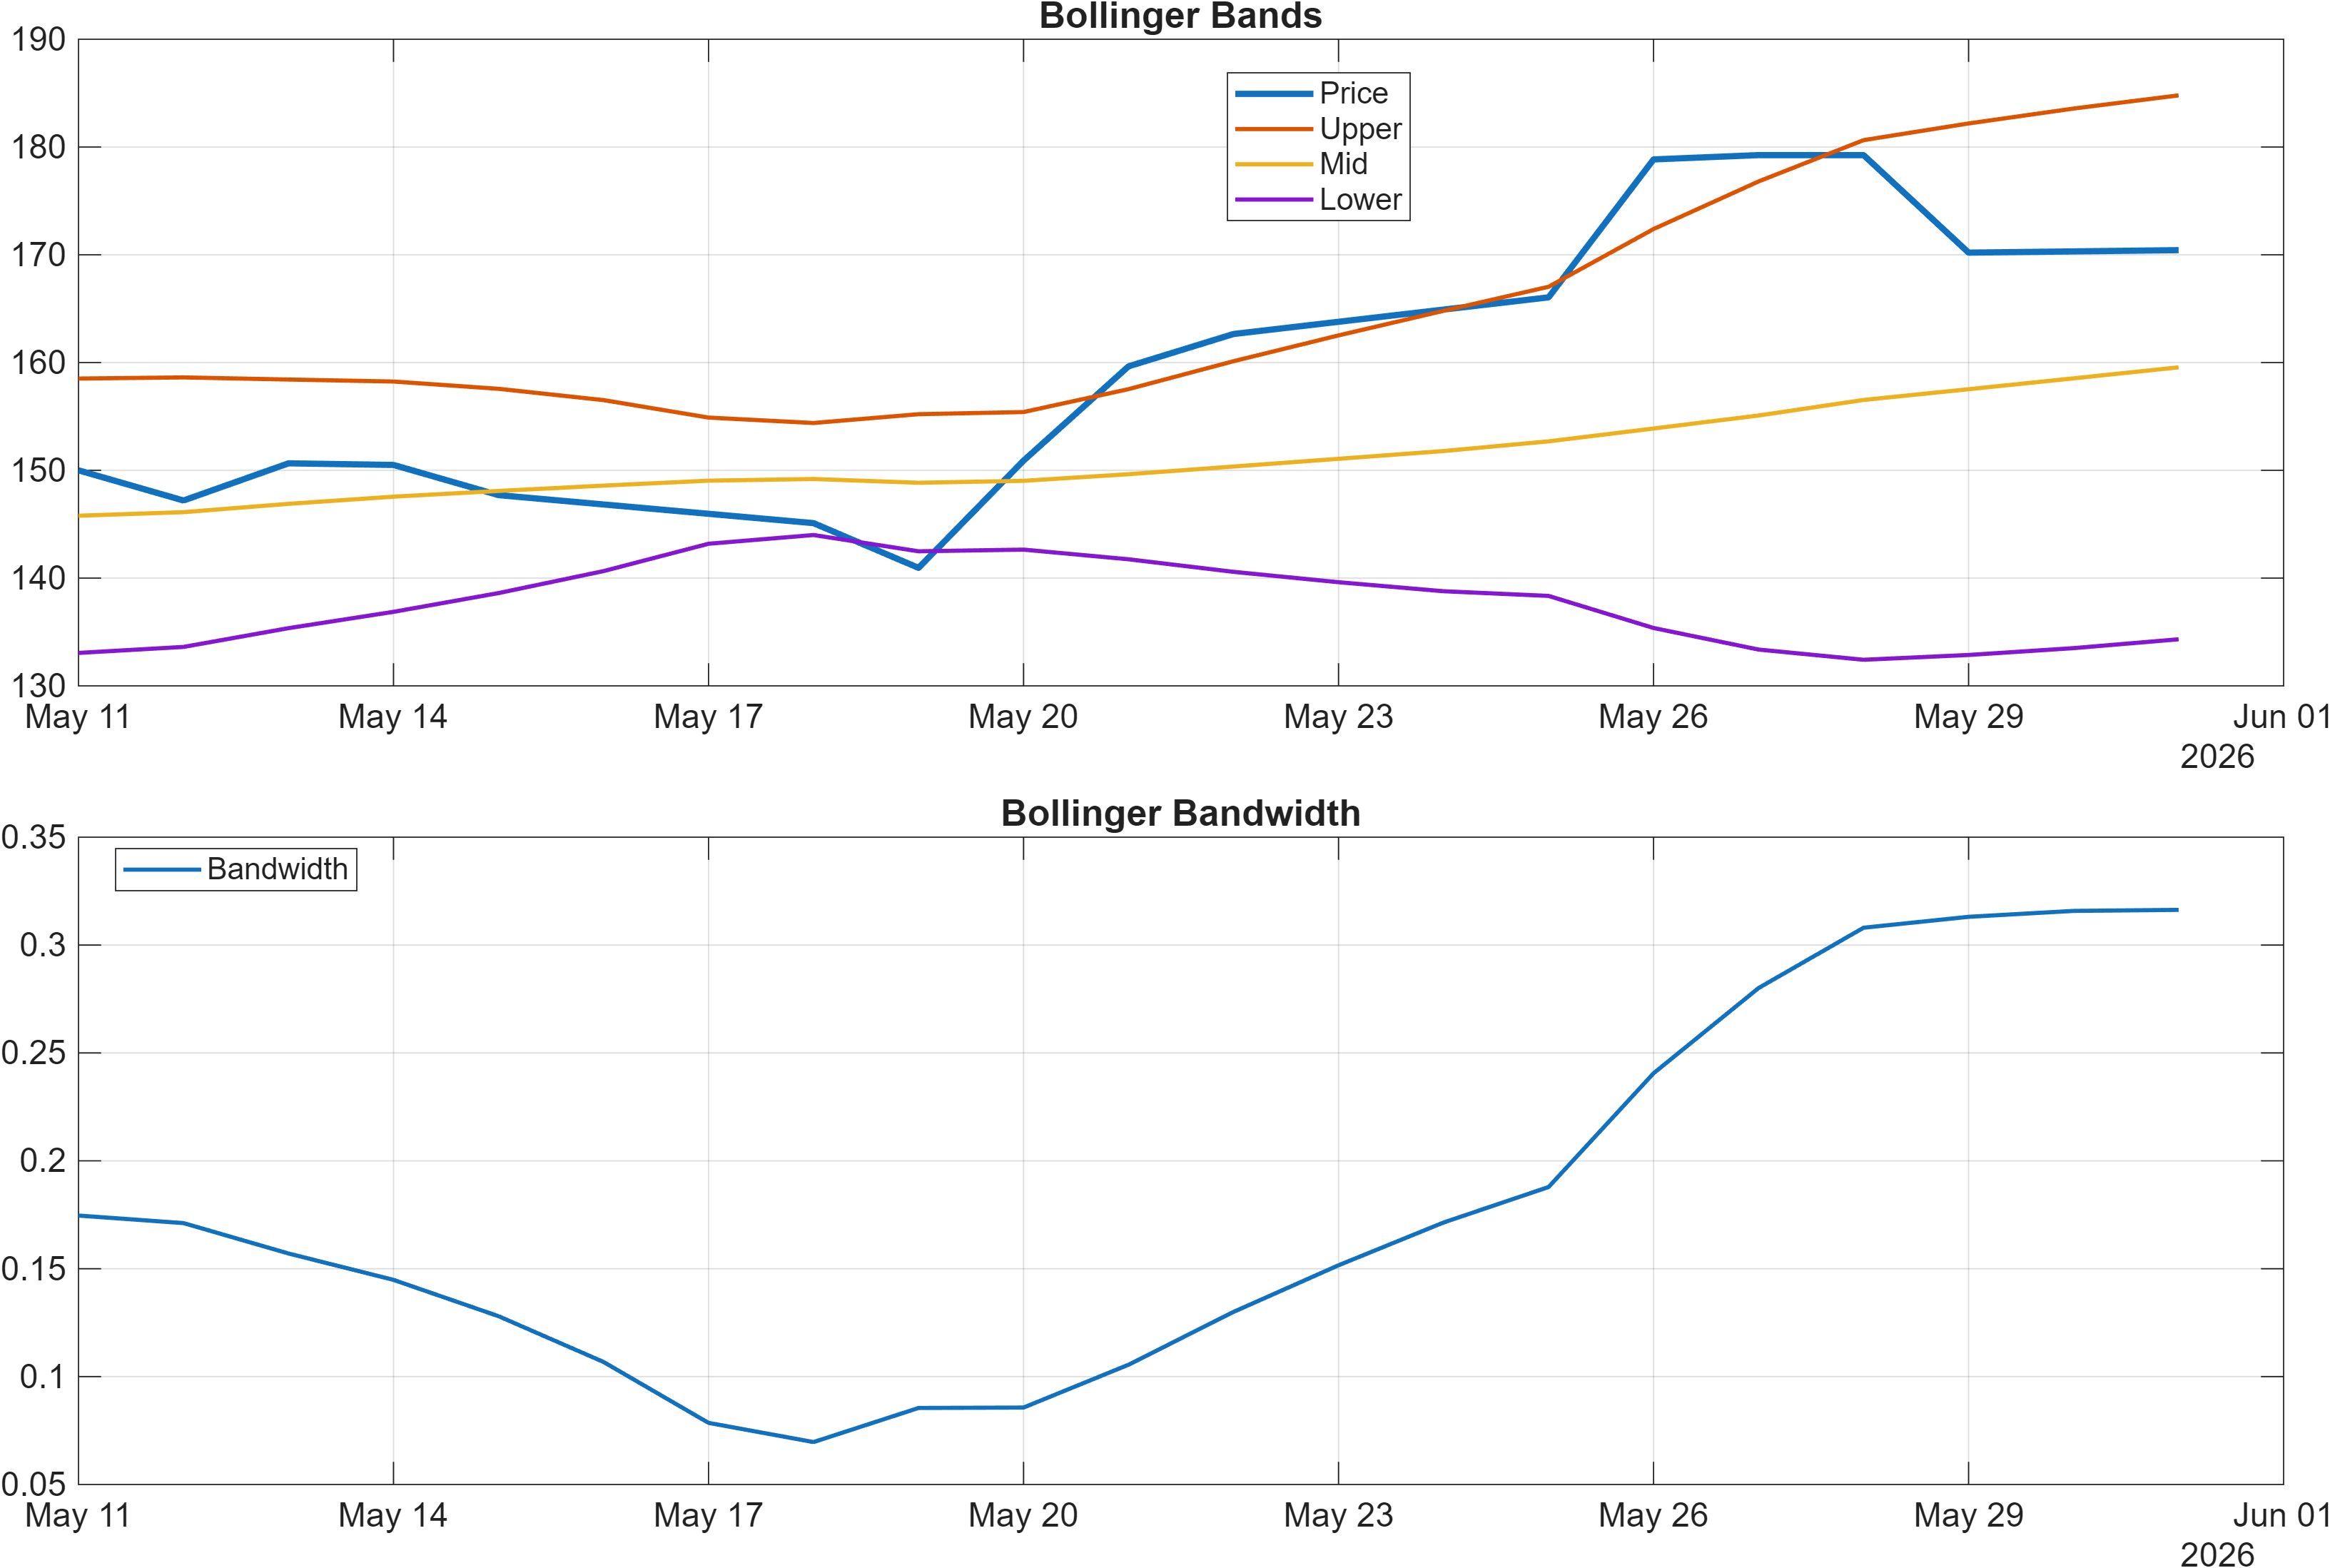
Interpretation: Bandwidth (volatility regime) latest = 0.3163.
Momentum: elevated conditions with a “continuation vs cooling” fork
Momentum indicators lean constructive, but they are not uniformly “low risk.” The RSI(14) at 73.26 is flagged bullish, which is consistent with strong trend behavior; however, RSI at this level can also coincide with crowded momentum where incremental upside requires sustained demand. Meanwhile, the MACD histogram at 0.8482 remains positive, indicating that momentum has not rolled over into a clear downside impulse.
Volatility adds another dimension. The latest Bollinger bandwidth of 0.3163 suggests an environment where price ranges are not compressed. In non-compressed regimes, breakouts can extend, but pullbacks can also be swift—timing error bars increase, even when the structural bias is positive. This can help explain how a short-term rank can degrade even while longer-horizon signals remain strong: day-to-day outcomes become more sensitive to volatility clustering.
The most informative synthesis is momentum persistence vs exhaustion. If MACD stays positive while RSI remains elevated without sharp negative divergence, the setup is typically interpreted as trend persistence. If RSI begins to fall meaningfully from elevated territory while daily ranks remain weak (currently #1026), it can signal that the market is transitioning from impulse to consolidation—often producing multiple failed pushes toward resistance (173.5500) before direction resolves.
Overall, momentum and volatility together describe a market that can move decisively, but where confirmation should be sought in price behavior around defined zones rather than assuming indicator readings alone will “carry” the next leg.
4) Support / Resistance zones
Support ~ 130.6750 | Resistance ~ 173.5500
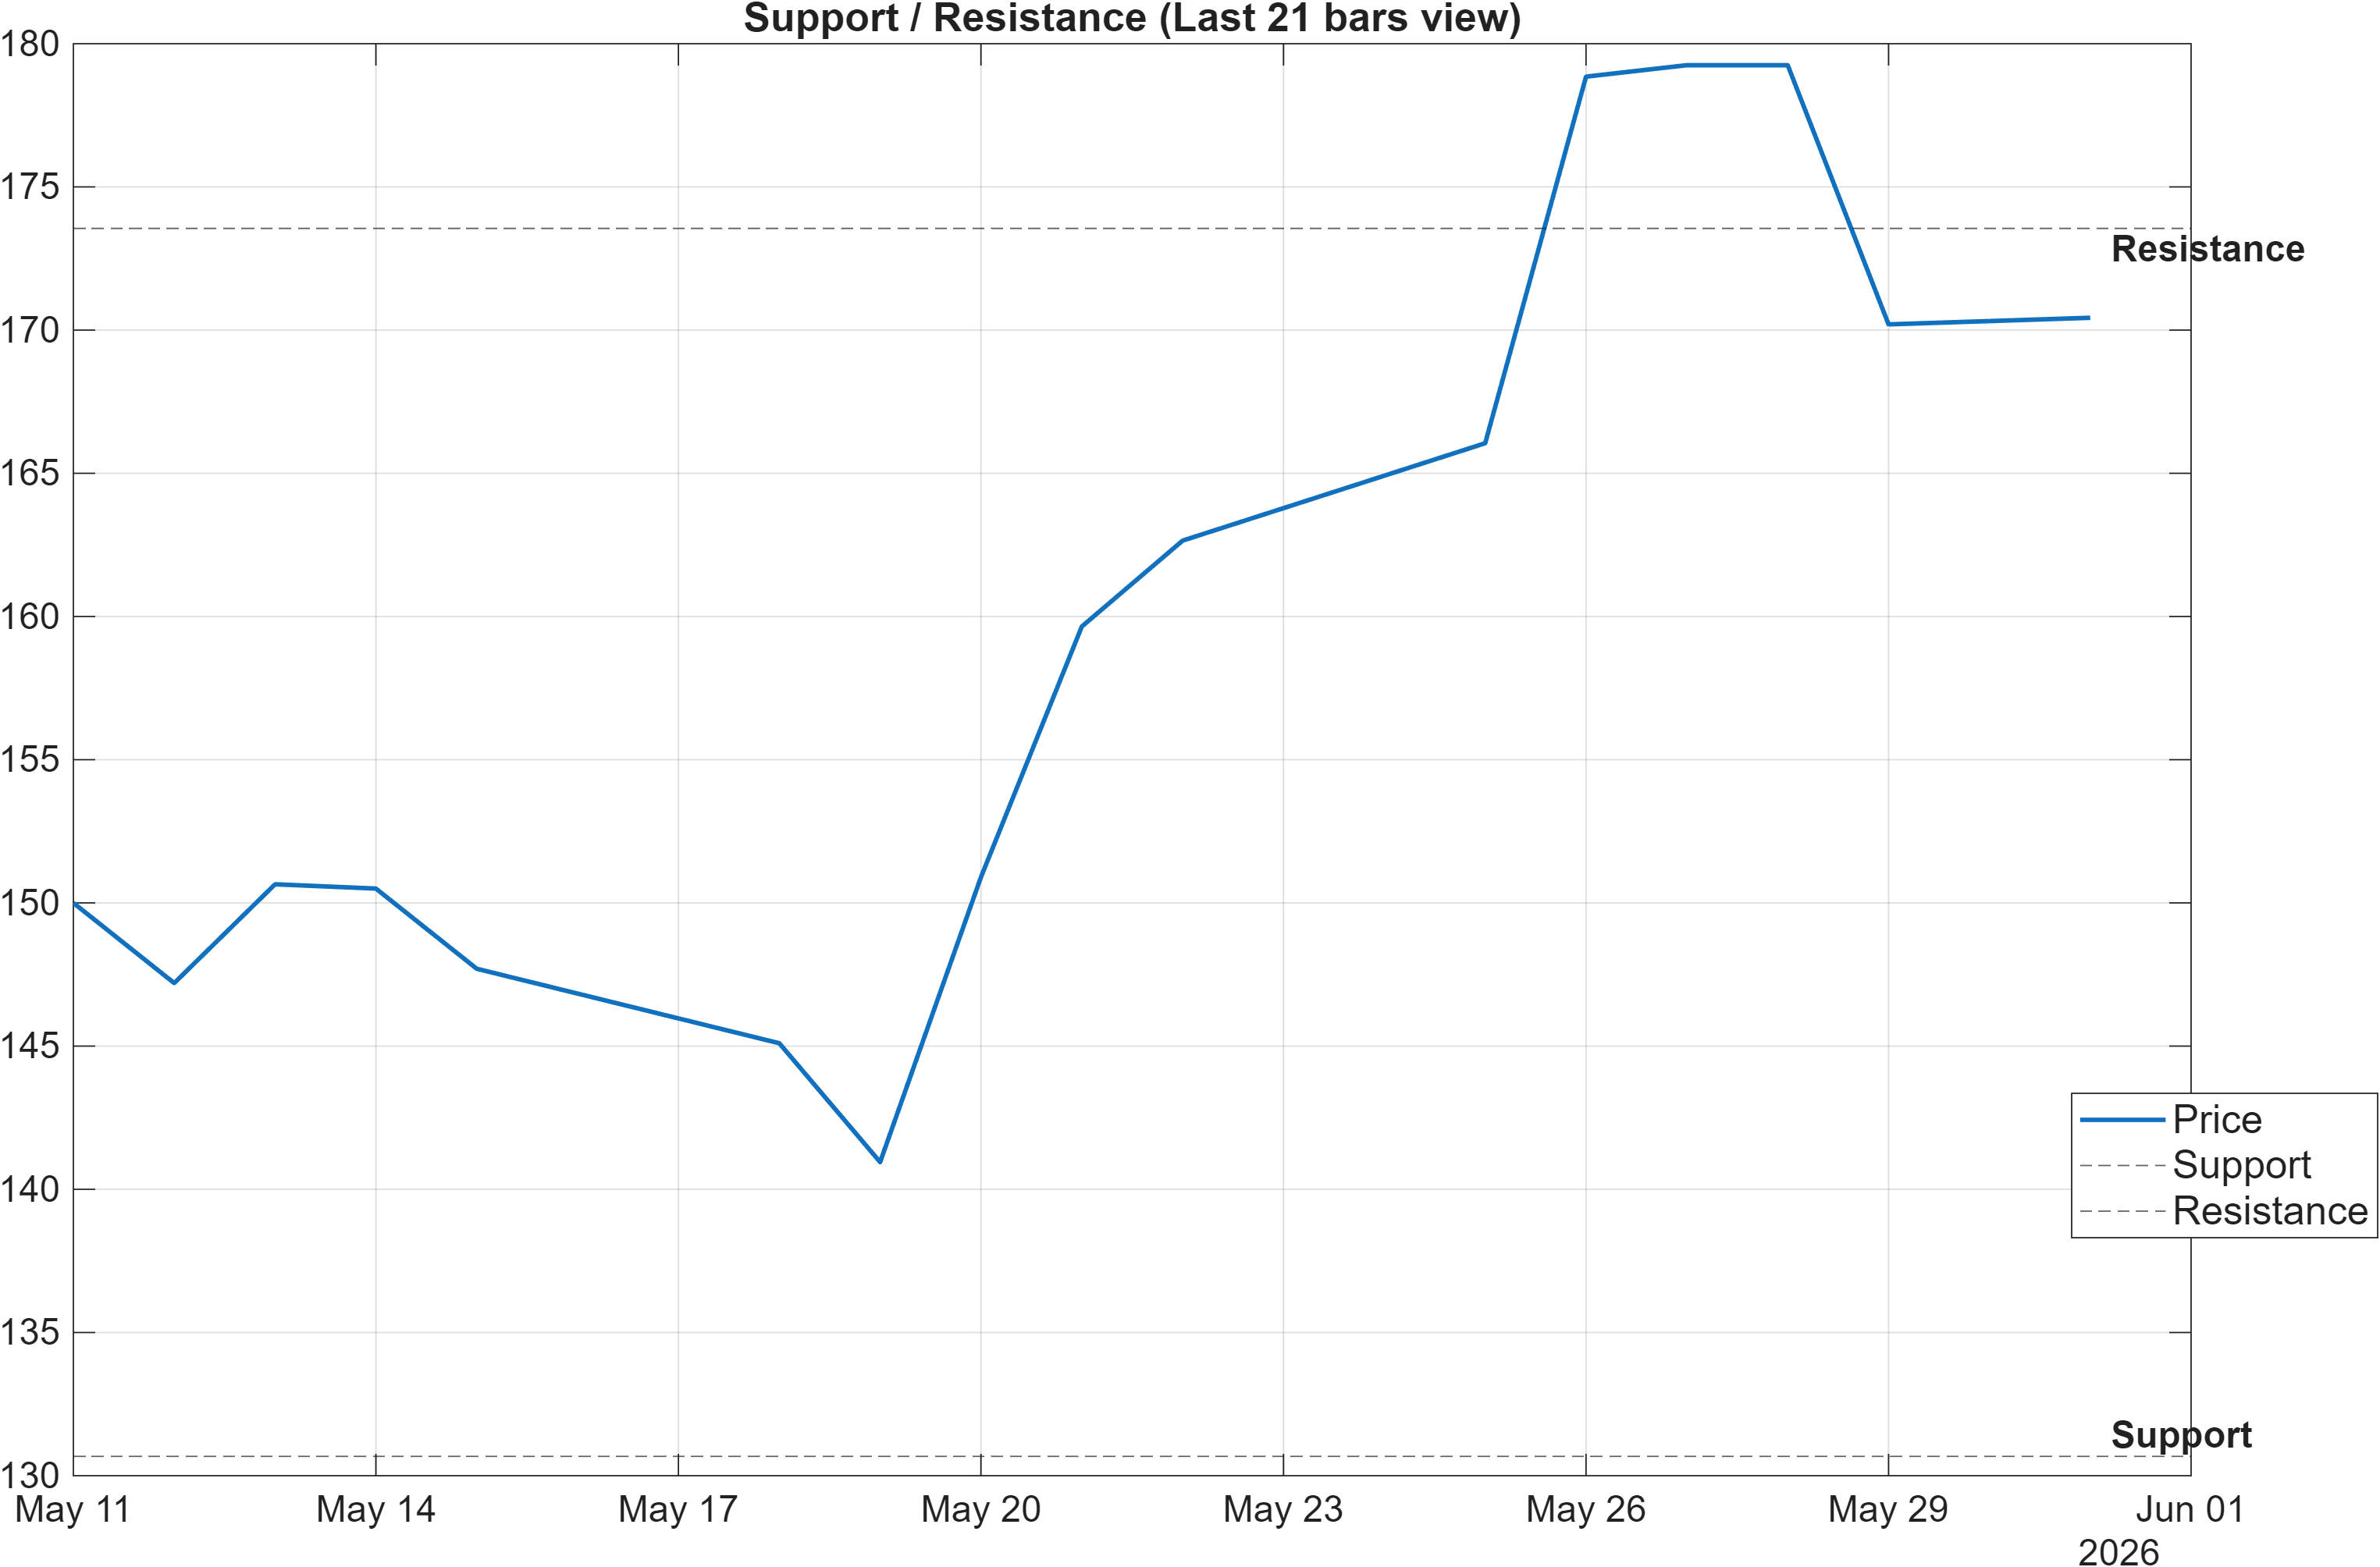
Scenario view: Break above resistance with volume → continuation. Close below support → signal deterioration risk.
Decision zones: probabilistic boundaries for regime validation
The levels are cleanly defined and should be treated as decision zones rather than single-price triggers. The support area near 130.6750 represents the zone where longer-horizon strength (monthly/3-monthly rank #1, yearly #5) is most likely to be defended if the broader structure remains intact. A close below support, as stated in the scenario view, would not just be a minor pullback—it would raise the probability that the short-term bearish rank (#1026) is starting to “infect” higher timeframes.
The resistance area near 173.5500 is the primary checkpoint for continuation. In a bullish moving-average regime, repeated tests of resistance without follow-through often matter more than the first touch: it can reveal whether momentum (RSI 73.26, MACD hist 0.8482) is still being funded by incremental demand. A break above resistance “with volume,” as the model states, is best interpreted as confirmation of trend persistence rather than an isolated breakout print.
Because volatility is not compressed (bandwidth 0.3163), overshoots and shakeouts around both levels are plausible. That makes closing behavior and follow-through more informative than intraday spikes. If the market begins to respect higher lows above support while gradually absorbing supply near resistance, it would align with the overwhelmingly strong higher-timeframe ranks. If price action instead accelerates downward and closes below support, the most consistent interpretation is a transition toward a weaker regime—even if some indicators remain bullish due to lag.
5) Quant Technical Dashboard (18 Signals)
KGNAI AI Technical Analysis Score (Deep Reinforcement Learning): Rank #434 out of 1221 (Rank 1 represents the strongest technical positioning and a higher probability of favorable price behavior. As ranks increase toward the maximum, the probability of favorable outcomes weakens and bearish positioning becomes more dominant.) | Label: Neutral | Score: 0.289
18-Signal Technical Confluence Score: 0.556 (Bullish)
Overall Technical Score (18-signal confluence + DRL rank blend): 0.476 (Bullish)
Note: The blended score reflects signal strength weighted against broader AI technical ranking, which may temporarily diverge.
Blended technical score breakdown: 0.476 (Bullish | Bull 12 / Bear 2 / Neutral 4)
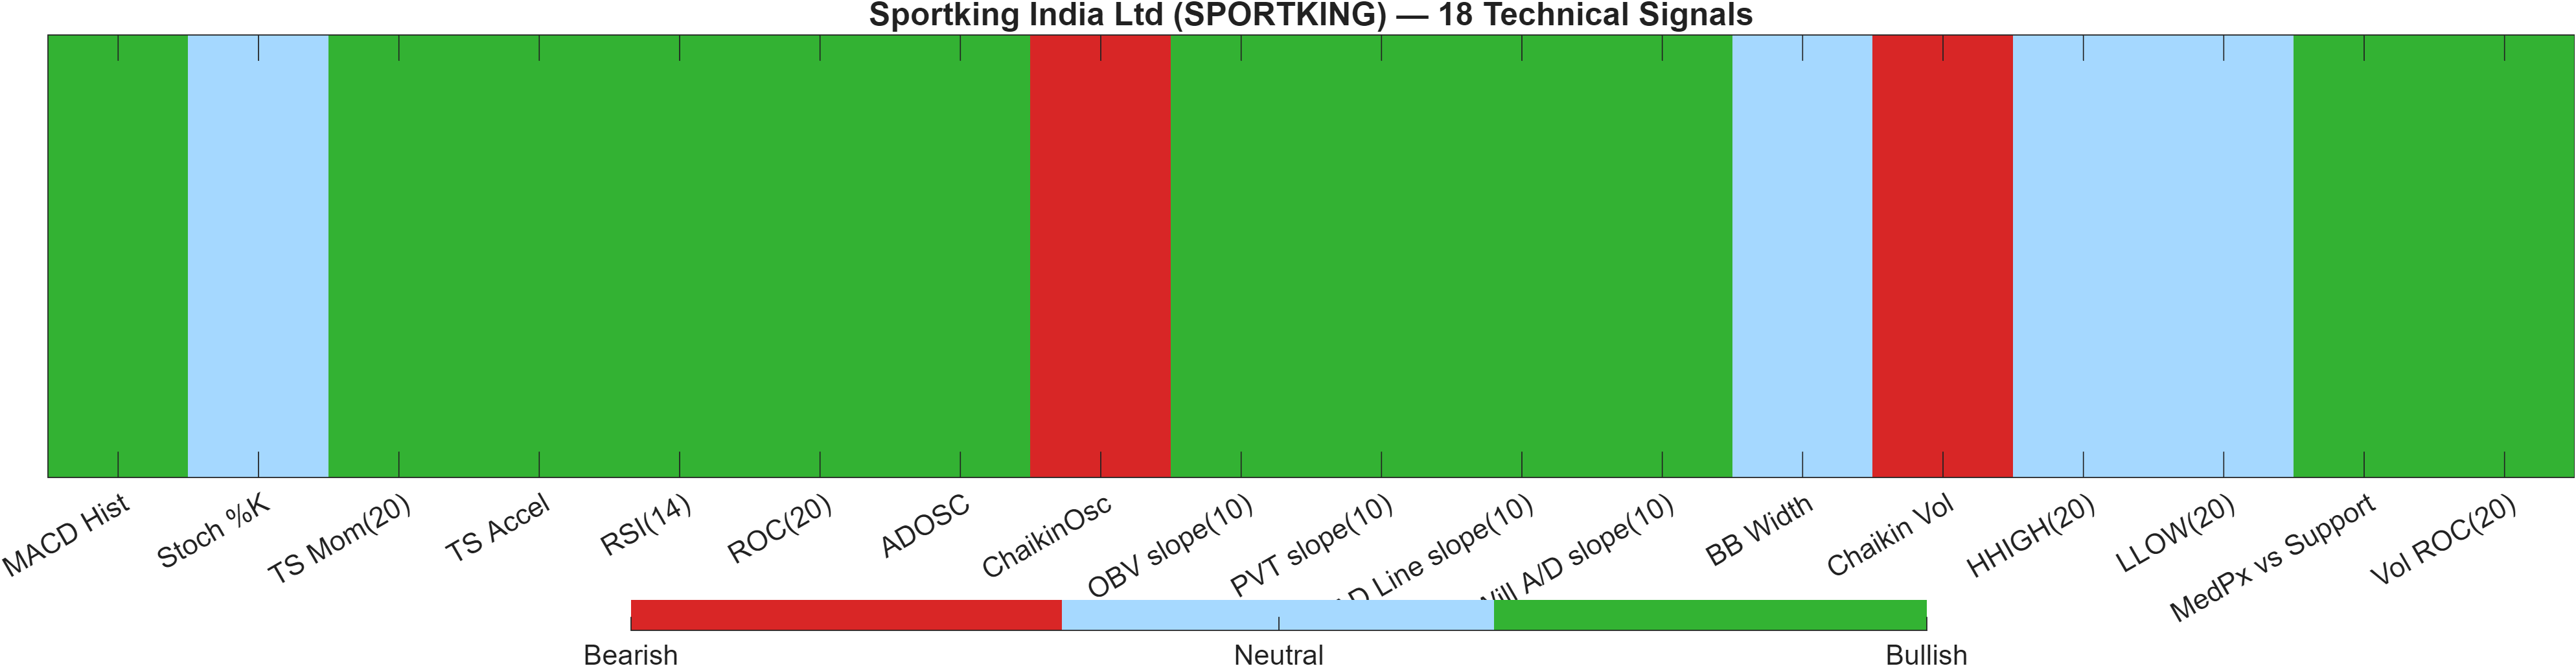
Confluence vs model rank: why “Bullish” can coexist with “Neutral”
The dashboard highlights a useful tension between signal confluence and model-ranked positioning. The 18-signal confluence score is 0.556 (Bullish), and the blended overall technical score remains 0.476 (Bullish). Yet the Deep Reinforcement Learning technical rank is #434 (neutral label; score 0.289), which implies the broader pattern library is not classifying current structure as top-tier relative to the full universe.
This is consistent with an environment where many classical indicators remain constructive, but the market may be operating with higher tactical noise—a condition that can be captured by cross-sectional models even when traditional readings look favorable. The blend breakdown (Bull 12 / Bear 2 / Neutral 4) suggests breadth is on the bullish side, but the presence of bearish elements means the setup is not “uniformly” strong.
Two indicator clusters matter most for interpreting this mix. First, momentum/price indicators remain supportive with a positive MACD histogram (0.8482) and elevated RSI(14) (73.26), consistent with trend persistence. Second, volatility and flow indicators are more nuanced: BB Width (0.3163) is neutral and volatility-linked signals include bearish readings (e.g., Chaikin Vol in the table), which can coincide with less stable continuation paths.
Net: the dashboard supports a bullish bias on confluence, while the neutral DRL rank argues for stricter confirmation at key levels (support 130.6750, resistance 173.5500) rather than assuming that bullish confluence alone will dominate near-term outcomes.
Signal table (Bull/Bear/Neutral)
| Indicator | Value | Signal |
|---|---|---|
| MACD Hist | 0.8482 | Bullish |
| Stoch %K | 39.81 | Neutral |
| TS Mom(20) | 23 | Bullish |
| TS Accel | 11 | Bullish |
| RSI(14) | 73.26 | Bullish |
| ROC(20) | 15.78 | Bullish |
| ADOSC | 8.824 | Bullish |
| ChaikinOsc | -350 | Bearish |
| OBV slope(10) | 1.931e+05 | Bullish |
| PVT slope(10) | 6248 | Bullish |
| AD Line slope(10) | 2.177e+04 | Bullish |
| Will A/D slope(10) | 21.15 | Bullish |
| BB Width | 0.3163 | Neutral |
| Chaikin Vol | 16.21 | Bearish |
| HHIGH(20) | 186 | Neutral |
| LLOW(20) | 137.8 | Neutral |
| MedPx vs Support | 43.38 | Bullish |
| Vol ROC(20) | 26.71 | Bullish |
Interpretation: Indicator-level signals form the base confluence, which is then adjusted using a separate AI-driven technical ranking model. The final technical score summarizes this combined view.
6) News sentiment + extractive gist
Note: Instrument-specific news matches were not found, so the digest includes broader market/sector headlines. Links are provided for verification.
Sentiment score (avg): 0.263 | Positive: 69% | Neutral: 19% | Negative: 12%
KGNAI AI News Sentiment Score (normalized -1 to +1): 0.99 (as of 2026-05-21) | Label: Bullish | Overall news score: 0.99
Positive Developments
Recent coverage across major financial outlets indicates a constructive tone, consistent with the news readout showing 69% positive items and a high normalized sentiment score of 0.99. The positive stream is dominated by corporate results narratives and risk-on market framing rather than SPORTKING-specific catalysts, which matters because it can support broader positioning without necessarily explaining short-term rank weakness (#1026 daily). In aggregate, the messaging centers on earnings resilience in select companies, demand-linked themes, and periods of improved risk appetite in equities. For a stock already showing bullish technical structure (moving-average relationships described as bullish), a supportive market tape can reduce the friction of continuation attempts toward the 173.5500 resistance zone. That said, because these are sector/market headlines, the impact is best treated as a contextual tailwind rather than a direct fundamental driver within this report’s scope.
Neutral / Mixed Developments
The mixed set aligns with the 19% neutral share in the sentiment breakdown and largely reflects informational policy and cross-asset updates. The key analytical implication is that “neutral” coverage can still raise dispersion in outcomes: markets may absorb incremental policy or flow changes without a consistent directional response. With SPORTKING’s higher-timeframe ranks extremely strong (monthly and 3-monthly #1), neutral news flow becomes relevant mainly through its effect on volatility conditions—already non-trivial given Bollinger bandwidth at 0.3163. In this regime, price can oscillate between support (130.6750) and resistance (173.5500) without immediate trend invalidation, while tactical signals (daily rank) remain sensitive. Net effect: neutral news does not contradict the bullish technical bias, but it also does not provide additional confirmation.
Negative / Risk Signals
Risk-toned coverage—reflected in the 12% negative share—primarily emphasizes volatility, consolidation phases, and episodic flow-driven moves. For SPORTKING, the relevance is less about any direct company-specific risk (not available in the provided data) and more about how risk-off intervals can test technical levels and expose the daily-rank fragility. When broader markets rotate into consolidation, trend-following structures can remain intact while momentum cools; this maps to the coexistence of bullish indicators like MACD histogram 0.8482 and elevated RSI 73.26 with a weak short-term rank (#1026). In such conditions, the most important risk signal is mechanical: a close below 130.6750 would align price action with negative tape effects and increase the probability that the multi-horizon strength begins to compress.
- Whether sentiment remains elevated (normalized 0.99) if volatility stays high (bandwidth 0.3163).
- Price acceptance/rejection behavior near 173.5500 and whether follow-through is supported by volume.
- Any shift in daily rank (#1026) toward the weekly regime (#8) as a sign of re-alignment.
Sources referenced: Reuters, Bloomberg, Yahoo Finance, MarketWatch, Investing.com
Snapshot: AI Rank (Short–Mid–Long): Mixed (Bullish tilt) (Bearish–Bullish–Bullish) · Technical Confluence: Bullish · Key Levels: Support ~130.68 | Resistance ~173.55 · News Sentiment: Positive
7) Sources
The source list in the draft contained itemized links. Per KGNAI publication format, this report summarizes coverage without reproducing headline lists or outbound URLs.
You may also like: How KGNAI AI ranks instruments across global markets
Disclaimer: KGNAI provides AI-generated analytics and educational market commentary only. This is not financial advice. Markets involve risk. Always do your own research.