
KESORAM INDUSTRIES LTD. (KESORAMIND) — 03-Jun-2026 Neutral-to-Bearish Technical Posture with Weak Short-Term Rank
KESORAM INDUSTRIES LTD. (KESORAMIND) enters 03-Jun-2026 with a split profile across time horizons: short-term KGNAI ranks sit in the weaker tail of the 1221-instrument universe (Daily #1135, Weekly #1064), while the Monthly rank improves to a more neutral posture (#381). This pattern often reflects a market still digesting recent pressure even as intermediate positioning stabilizes. On the technical layer, the blended framework remains tilted bearish: the Deep Reinforcement Learning technical rank is #1132 with a -0.854 score, and the overall blended technical score is -0.451 despite a near-neutral 18-signal confluence of -0.278. Momentum indicators are not uniformly stressed (RSI(14) 52.27 is neutral), but MACD histogram stays negative (-0.1737), and volatility conditions (Bollinger bandwidth 0.1555) highlight a regime where follow-through should be validated at key levels rather than assumed.
- Rank stance: Short-term Bearish (Daily #1135; Weekly #1064) | Mid-term Neutral (Monthly #381) | Long-term Neutral (Yearly #867)
- Technical confluence label: 18-signal confluence -0.278 Neutral, but blended technical score -0.451 Bearish
- Key decision zones: Support ~ 9.9125 | Resistance ~ 13.4617
- News sentiment bias: Average sentiment 0.191 with 62% positive / 38% neutral / 0% negative (instrument-specific matches not found in provided digest)
- Confirmation / invalidation: A sustained push above 13.4617 with volume would better align trend continuation; repeated closes below 9.9125 would increase deterioration risk versus the current neutral mid-term rank.
KGNAI evaluates assets using large cross-sectional datasets built from millions of structured data points. Inputs incorporate fundamental metrics, technical structures, and systematically processed news sentiment. Statistical models, machine learning, and AI frameworks are used to assess relative positioning, signal alignment, and probabilistic behavior across broad universes.
- Ranks are comparative across the tracked universe, not absolute price targets.
- Confluence reflects alignment among independent signal groups.
- Support/resistance levels are probabilistic decision zones, not guarantees.
- Sentiment provides contextual bias within the broader analytical framework.
1) KGNAI AI Analysis
Region: INDIA
Total universe size: 1221 ranked instruments
- Daily rank: #1135 out of 1221 — Bearish
- Weekly rank: #1064 out of 1221 — Bearish
- Monthly rank: #381 out of 1221 — Neutral
- 3-Monthly rank: #939 out of 1221 — Neutral
- 6-Monthly rank: #966 out of 1221 — Neutral
- Yearly rank: #867 out of 1221 — Neutral
Cross-horizon alignment: short-term weakness vs mid-term stabilization
The rank curve is notably non-linear across horizons. Daily (#1135) and Weekly (#1064) positioning sit in the weakest band of the universe, consistent with near-term fragility and a market still requiring confirmation before re-rating. By contrast, the Monthly rank improves materially to #381, placing KESORAMIND closer to a middle-of-the-pack posture relative to peers—more consistent with consolidation than persistent deterioration.
The longer windows remain Neutral (3-Month #939, 6-Month #966, Yearly #867), which suggests that the short-term pressure has not yet translated into a clean long-horizon breakdown in the model’s comparative assessment. This configuration often appears when price action is mean-reverting within a broader range, or when trend signals are mixed across independent tests.
Within the KGNAI framing, the practical implication is not a forecast but a prioritization of invalidation discipline: a weak short-term rank typically demands that bullish interpretations be contingent on confirmation at key levels, while the neutral mid/long ranks keep the door open for stabilization if momentum and volume regain coherence.
KGNAI ranks each instrument across large universes using multiple proprietary AI tests and statistical models (millions of data points). Lower ranks generally indicate stronger probability of favorable performance behavior, while higher ranks indicate weaker probability and more bearish positioning.
Term view: Short-term: Bearish. Mid-term: Neutral. Long-term: Neutral.
Want the full universe and complete rank tables? Unlock full access on KGNAI: https://www.kgnai.com/pricing
2) Price & trend overview
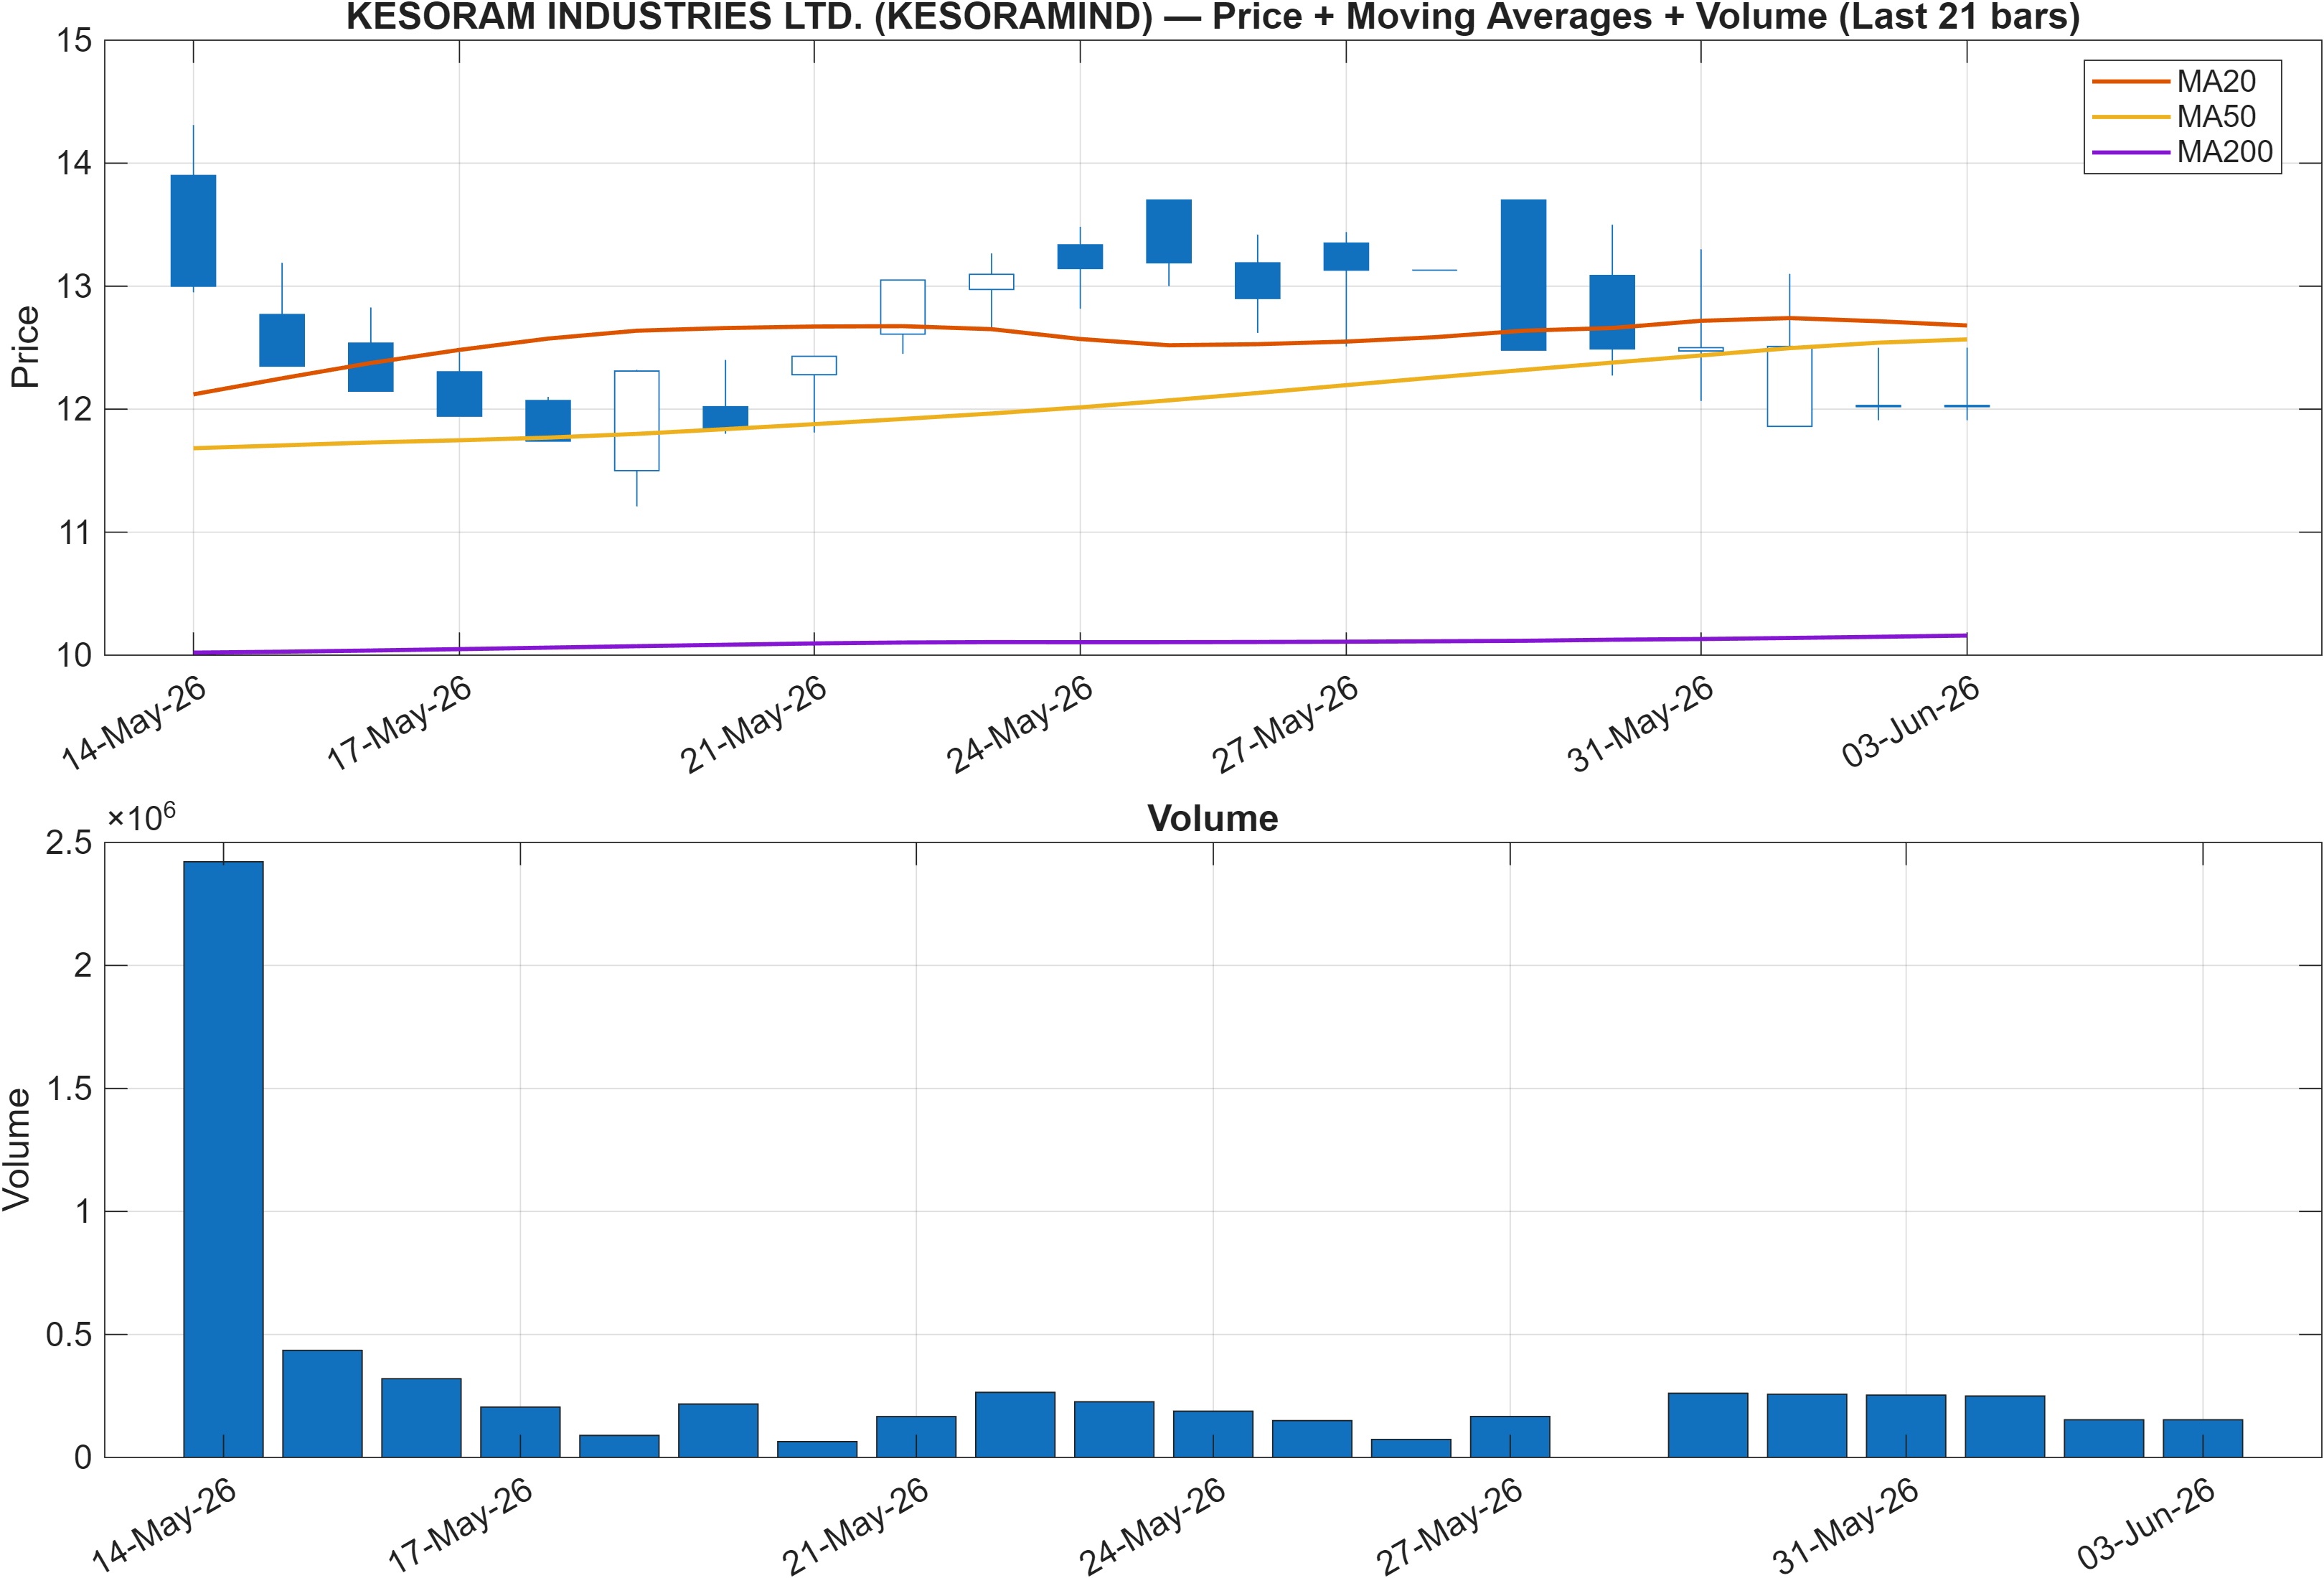
Trend structure: mixed moving-average state and conditional follow-through
The moving-average read is internally split: Close vs MA50 = Bearish while MA50 vs MA200 = Bullish. This combination typically corresponds to a pullback or retracement within a longer-window uptrend structure, rather than a fully synchronized downtrend. In market-structure terms, the tape is signaling that the shorter lookback is under pressure even as the broader trend baseline has not fully rolled over.
This is where the rank stack becomes contextually useful: the weak Daily/Weekly ranks (#1135 and #1064) are consistent with price trading below the intermediate trend proxy (MA50), while the neutral longer ranks (Yearly #867) align with the MA50 remaining above MA200. The result is a regime where timing risk increases—entries and exits become more sensitive to confirmation than to broad thesis.
Practically, trend continuation signals are more credible when short-term price regains alignment with MA50 while maintaining the longer MA structure. Conversely, if the close persists below MA50 and other momentum metrics fail to recover (see MACD histogram -0.1737), the odds rise that the longer-window trend state will degrade over time rather than immediately.
Volume context is provided in Figure 1; however, precise volume statistics are Not available in the provided data. As a substitute for exact figures, later sections incorporate volume-derived indicators (e.g., Vol ROC(20) -64.83) to judge whether participation is supporting or resisting any price-based turn.
3) Momentum & volatility dashboard
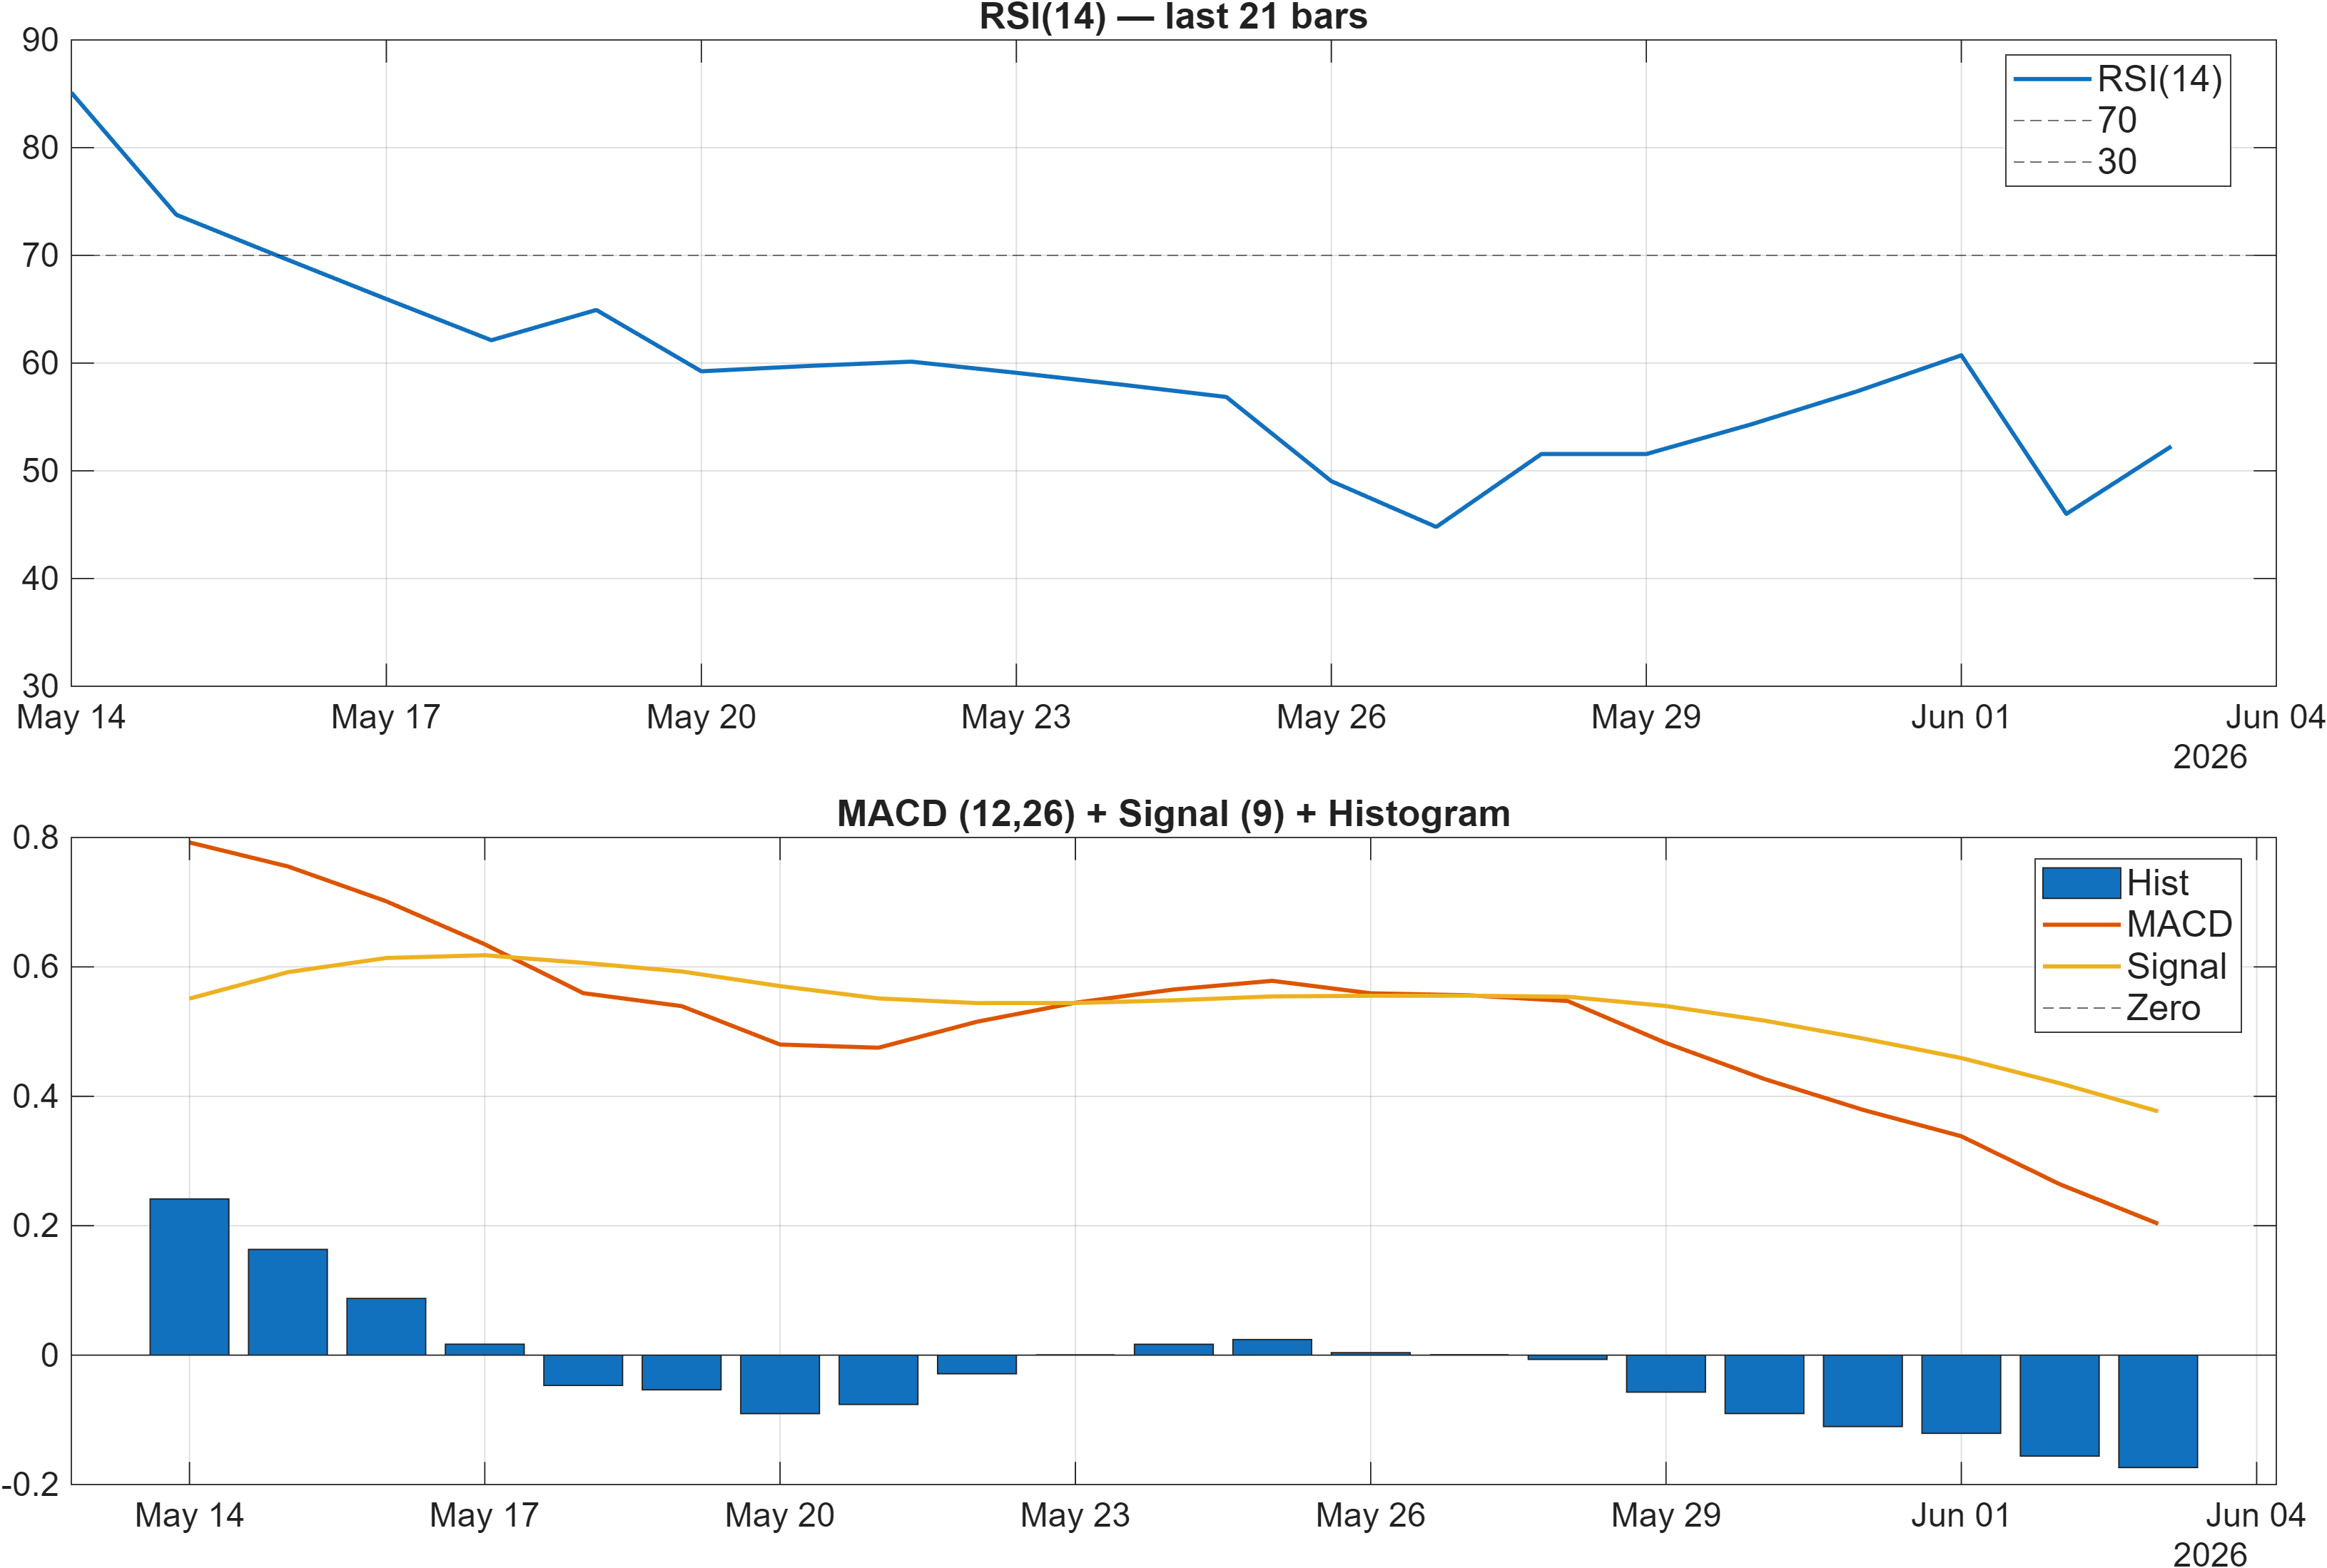
Interpretation: RSI bias = Neutral, MACD hist = -0.1737.
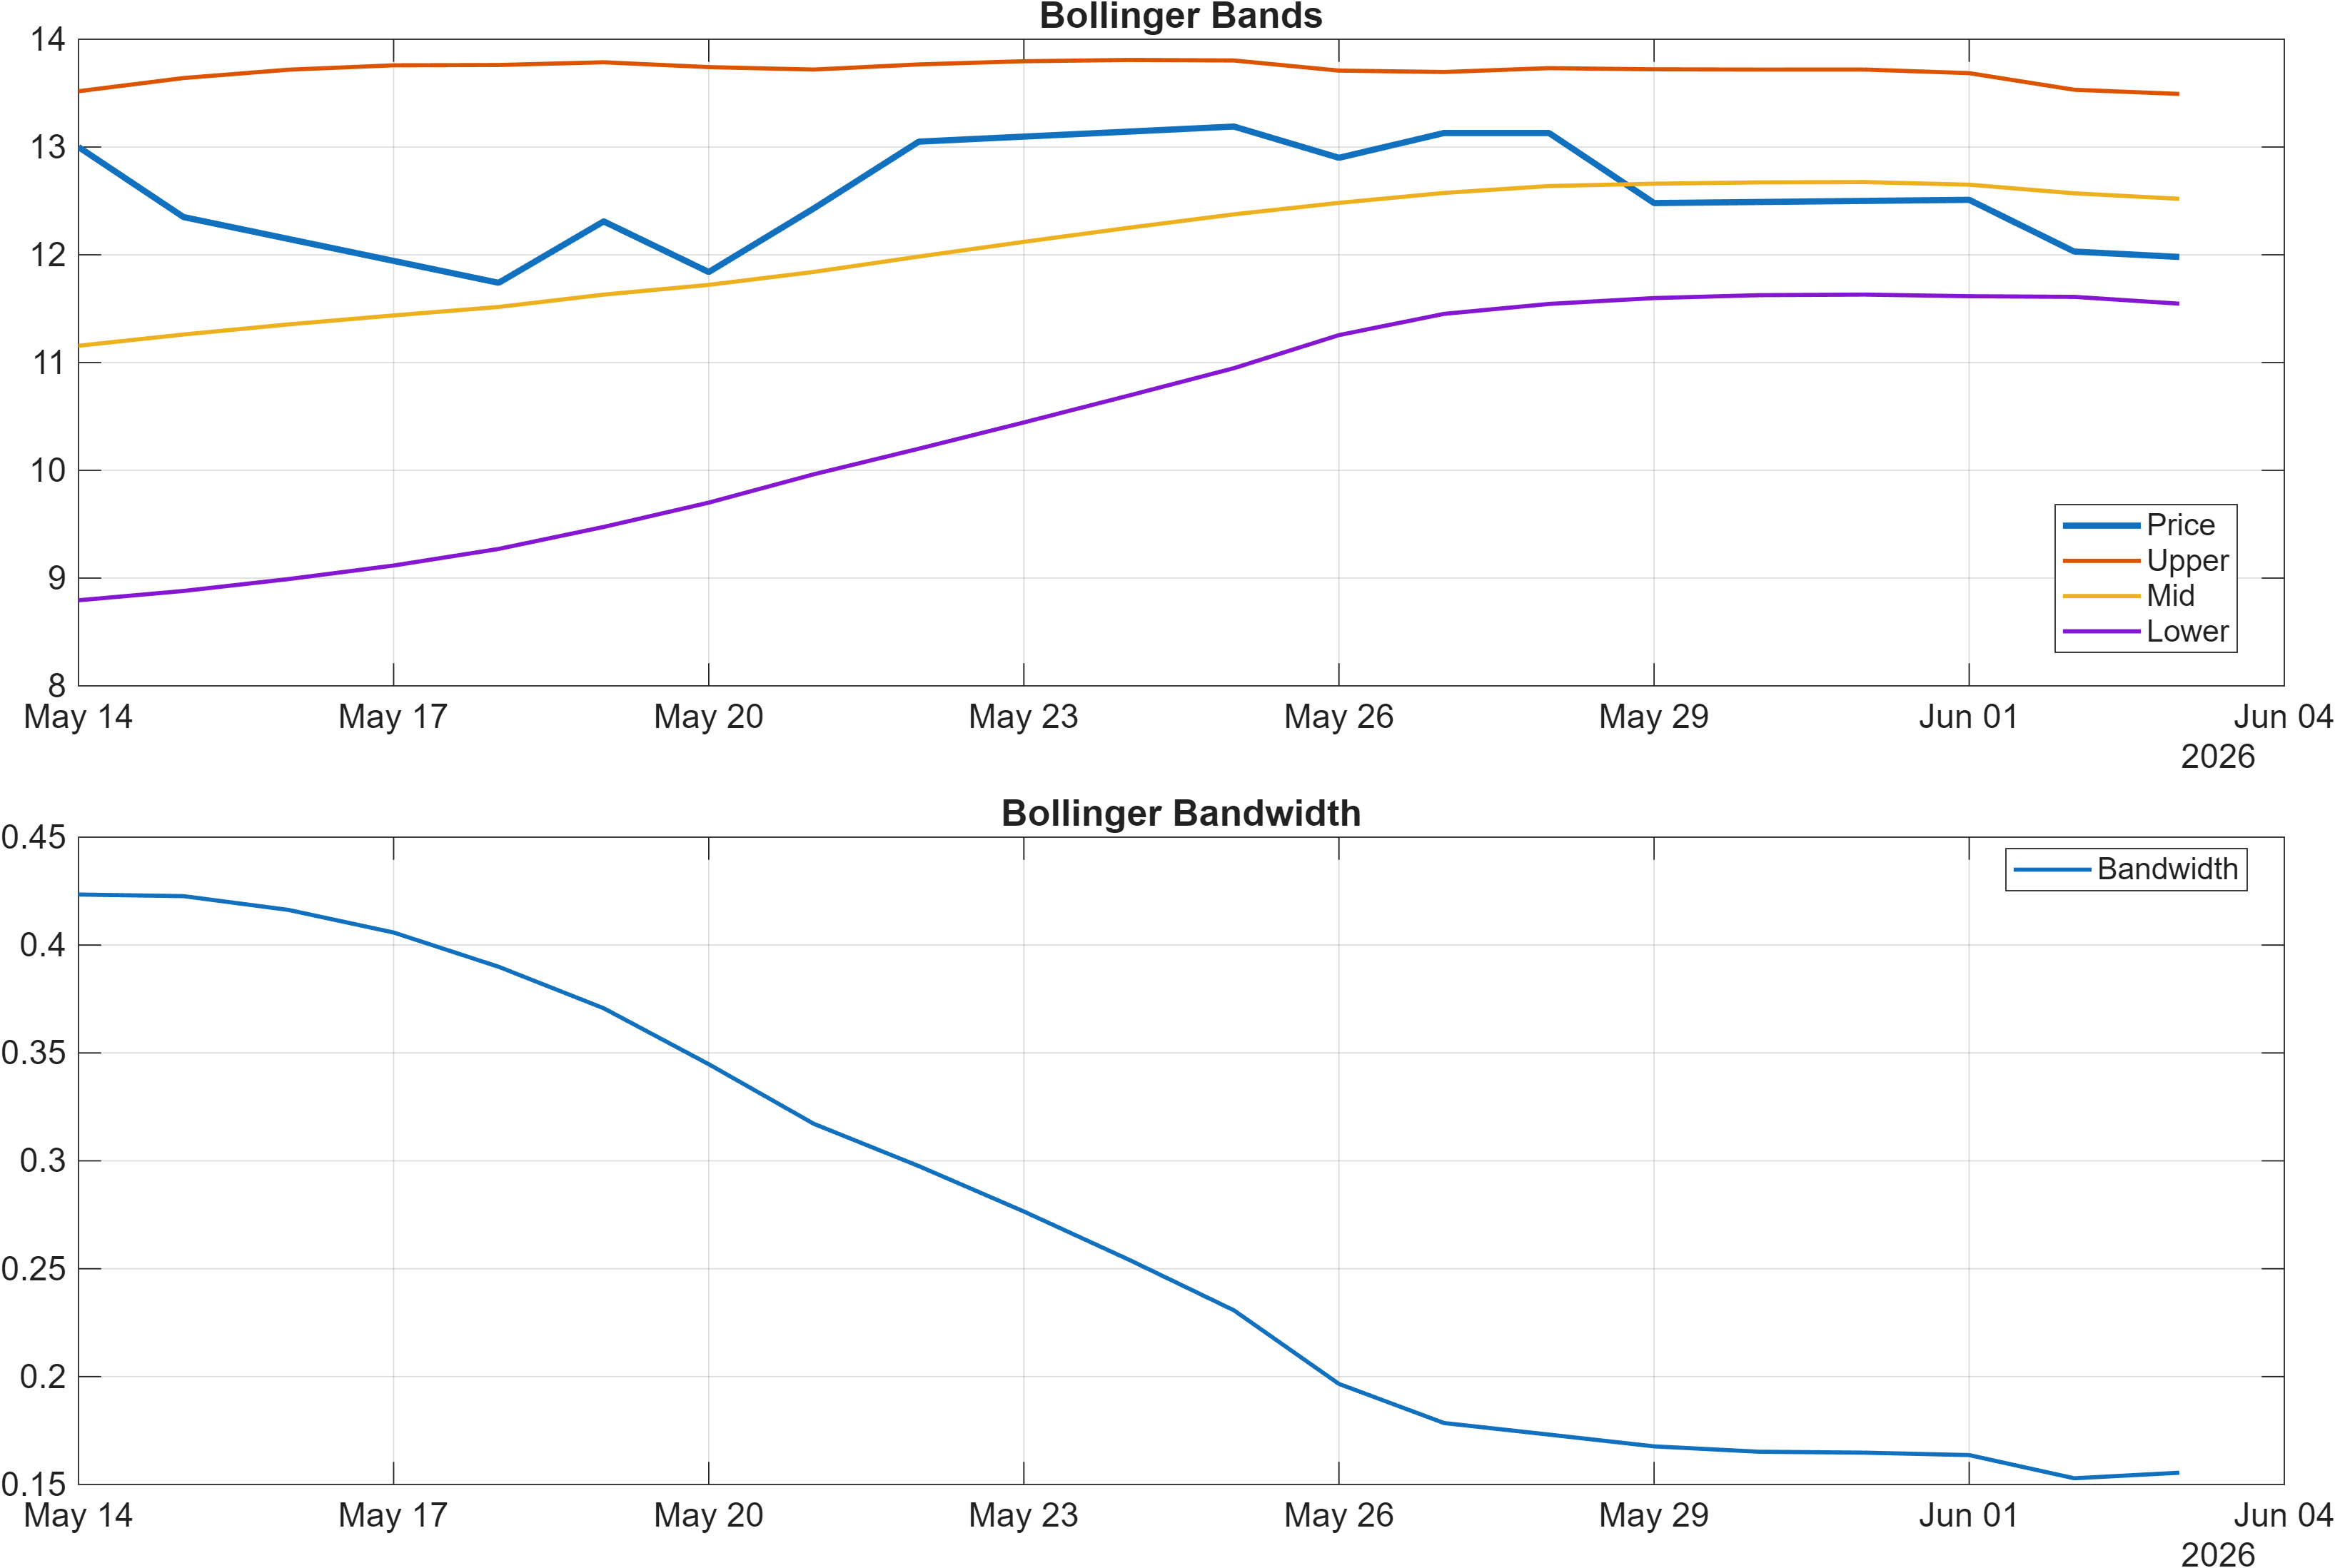
Interpretation: Bandwidth (volatility regime) latest = 0.1555.
Momentum state: neutral RSI with negative MACD implies incomplete reversal
The momentum mix is best described as stabilizing but not resolving. RSI(14) at 52.27 sits near the middle of its range, consistent with a market that is not extended. However, MACD histogram at -0.1737 remains negative, indicating the faster trend component has not yet re-asserted upward momentum. This tension often appears in range-bound conditions or during early-stage basing where confirmation tends to show up first through MACD improvement rather than RSI alone.
Volatility regime: Bollinger bandwidth and compression/expansion risk
Bollinger bandwidth at 0.1555 points to a defined volatility regime that can support directional expansion if paired with decisive price movement. The risk in such states is that volatility expansion is direction-agnostic; without price confirmation at decision zones, moves can fail quickly. That is consistent with the conservative interpretation framework: volatility conditions can set up opportunity, but do not provide direction by themselves.
Short-cycle positioning: oversold oscillator vs broader momentum drag
Short-cycle oscillators can diverge from broader momentum. Stoch %K at 9.239 prints a bullish signal consistent with a short-term oversold or rebound setup, yet medium-short momentum measures remain soft (TS Mom(20) -0.32; ROC(20) -2.996). When this occurs, bounces can be tradable but are often vulnerable to fading unless supported by improving trend indicators and stronger participation.
4) Support / Resistance zones
Support ~ 9.9125 | Resistance ~ 13.4617
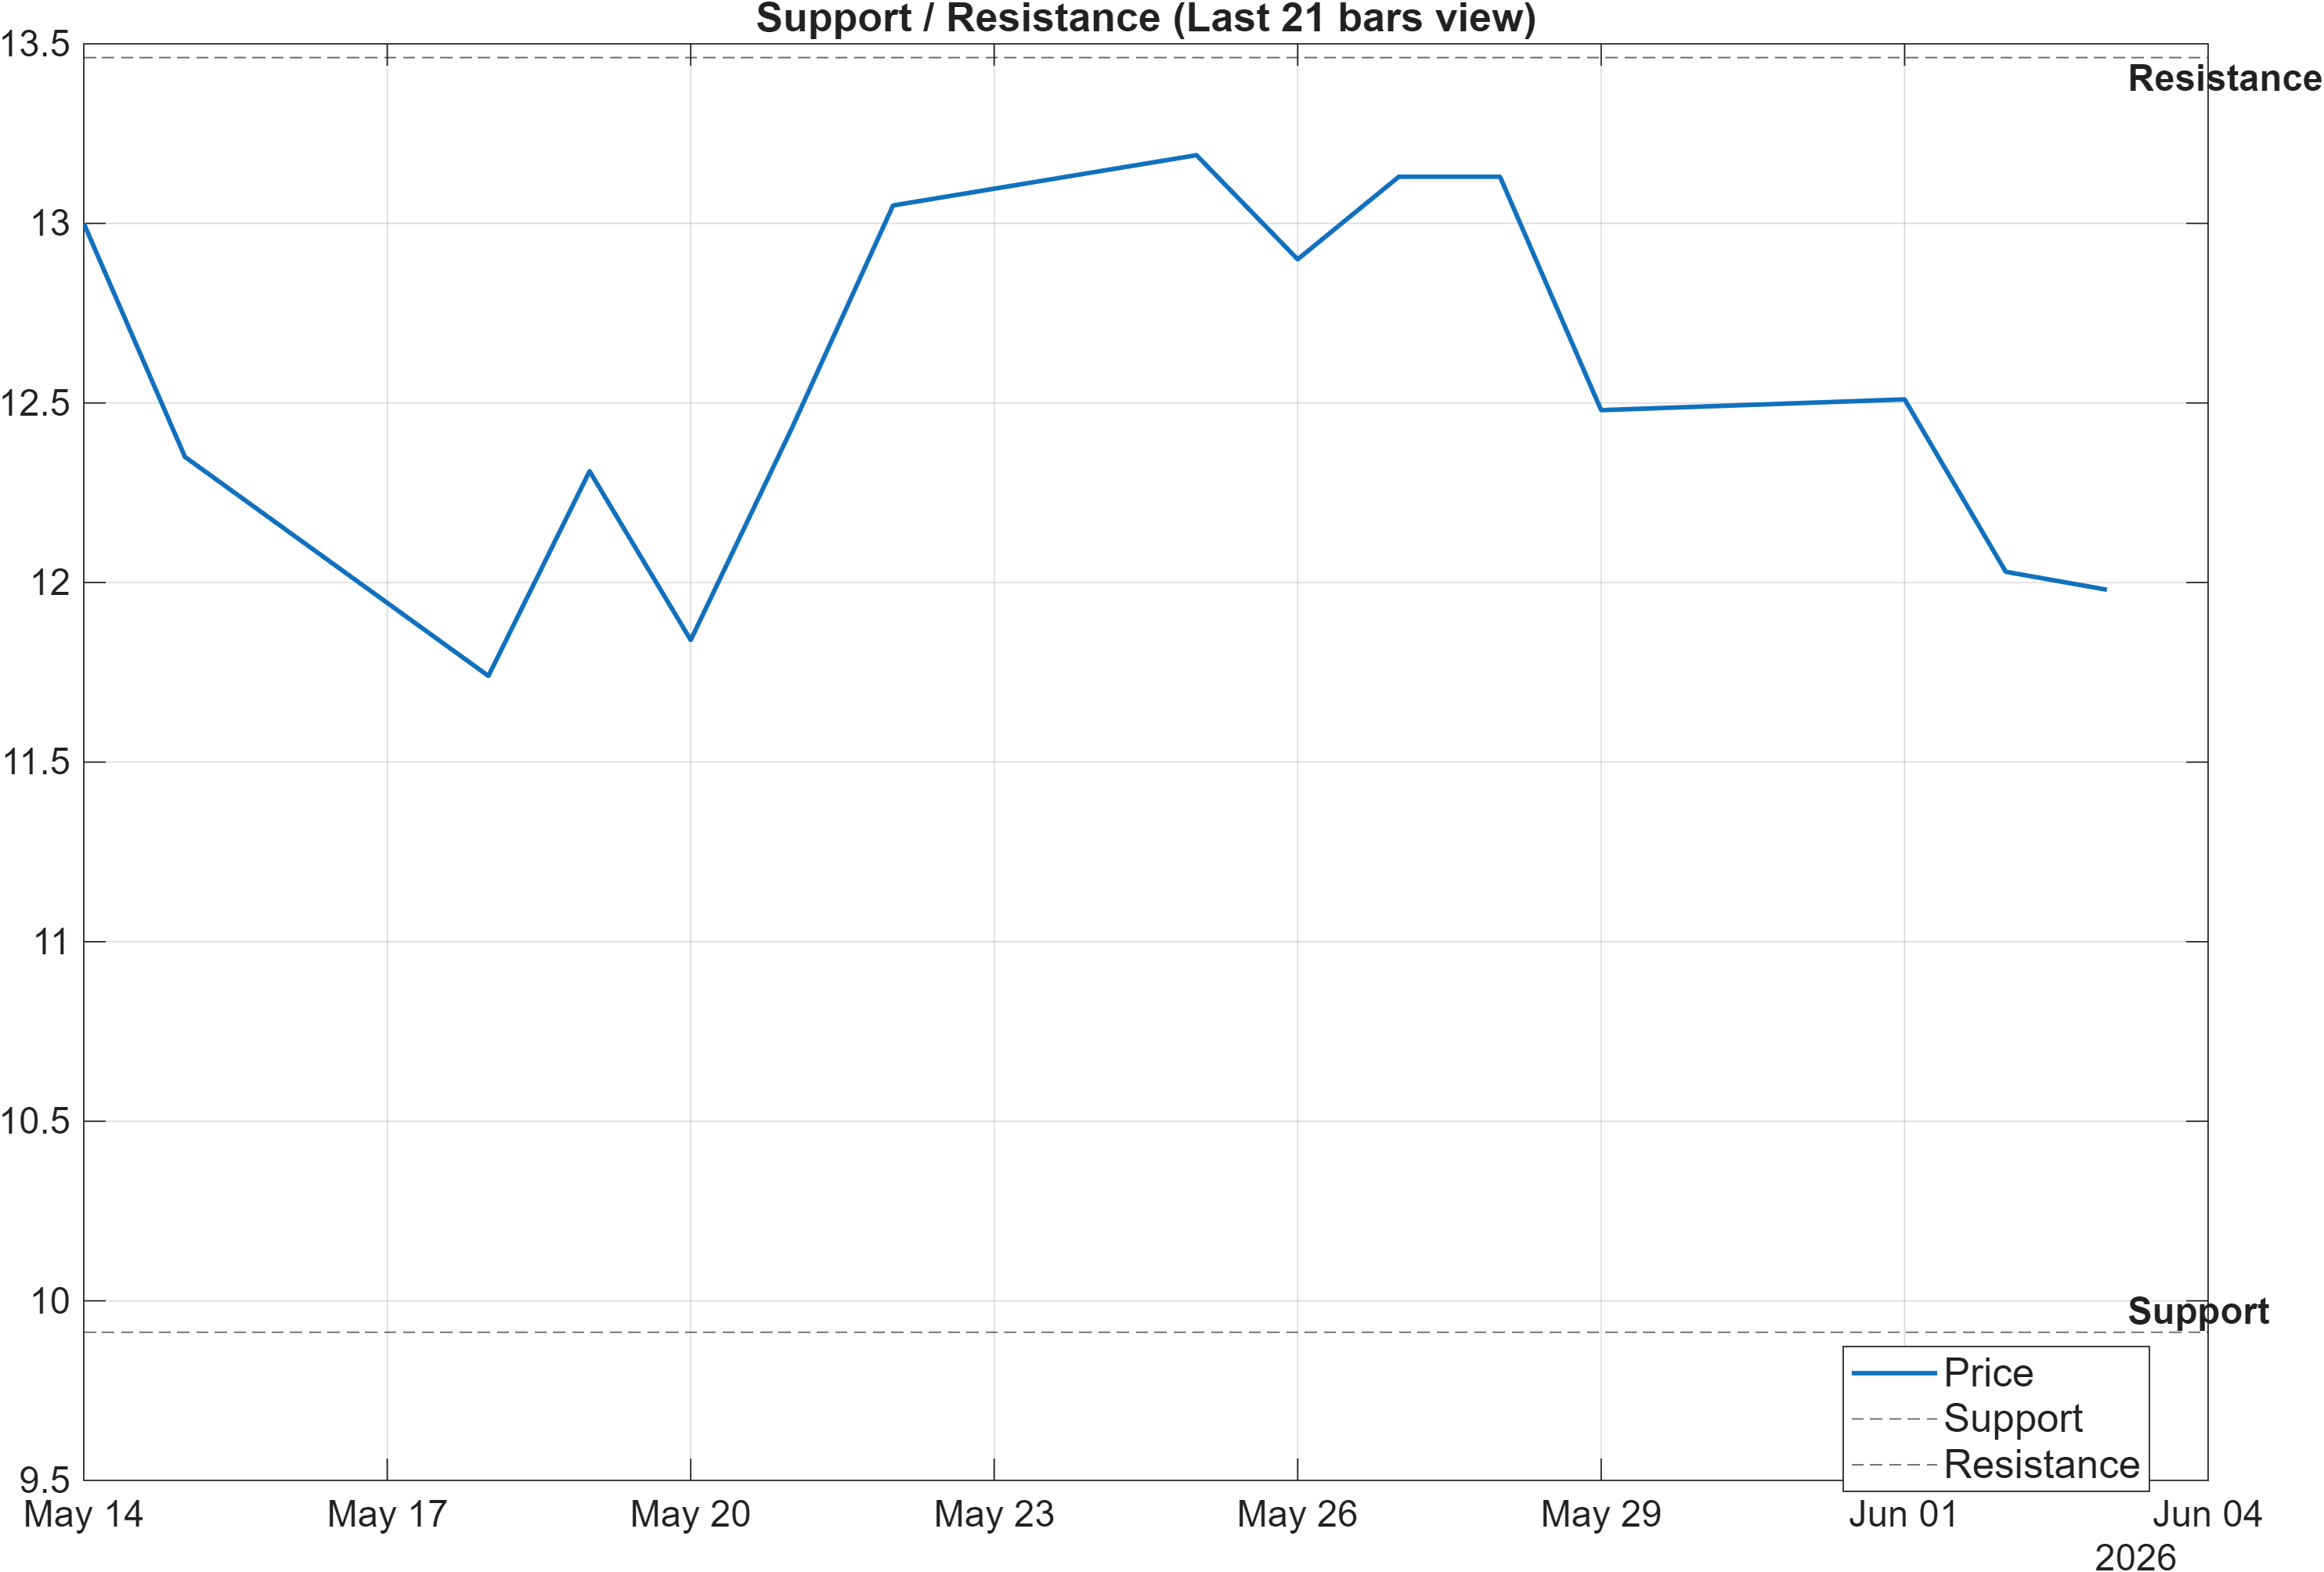
Scenario view: Break above resistance with volume → continuation. Close below support → signal deterioration risk.
Decision-zone framing: probabilistic levels that organize confirmation
The support/resistance map is cleanly defined: support ~ 9.9125 and resistance ~ 13.4617. Given the mixed trend condition (Close vs MA50 bearish, MA50 vs MA200 bullish), these zones function less as “targets” and more as regime validators. A market in transition will frequently test boundaries; what matters is how price behaves after those tests.
On the upside, a sustained move through 13.4617 gains analytical weight only if it arrives with participation that reverses weak short-term conditions (Daily rank #1135) and improves momentum evidence (MACD histogram currently -0.1737). Without that, break attempts can degrade into range extensions that fail back into the prior structure.
On the downside, repeated closes below 9.9125 would be more than a local technical event. It would likely force re-assessment of the “neutral” longer ranks (e.g., Yearly #867) by shifting the market from pullback-within-trend toward deterioration. In that scenario, short-cycle bullish signals (like Stoch %K 9.239) become less relevant, as downside persistence tends to overwhelm oscillator-based mean reversion.
A final nuance: the signal table includes “MedPx vs Support” at 2.293 with a bullish read. That supports the view that price has not fully lost structural footing yet, but it does not override weakness in trend and participation metrics.
5) Quant Technical Dashboard (18 Signals)
KGNAI AI Technical Analysis Score (Deep Reinforcement Learning): Rank #1132 out of 1221 (Rank 1 represents the strongest technical positioning and a higher probability of favorable price behavior. As ranks increase toward the maximum, the probability of favorable outcomes weakens and bearish positioning becomes more dominant.) | Label: Bearish | Score: -0.854
18-Signal Technical Confluence Score: -0.278 (Neutral)
Overall Technical Score (18-signal confluence + DRL rank blend): -0.451 (Bearish)
Note: The blended score reflects signal strength weighted against broader AI technical ranking, which may temporarily diverge.
Blended technical score breakdown: -0.451 (Bearish | Bull 5 / Bear 10 / Neutral 3)
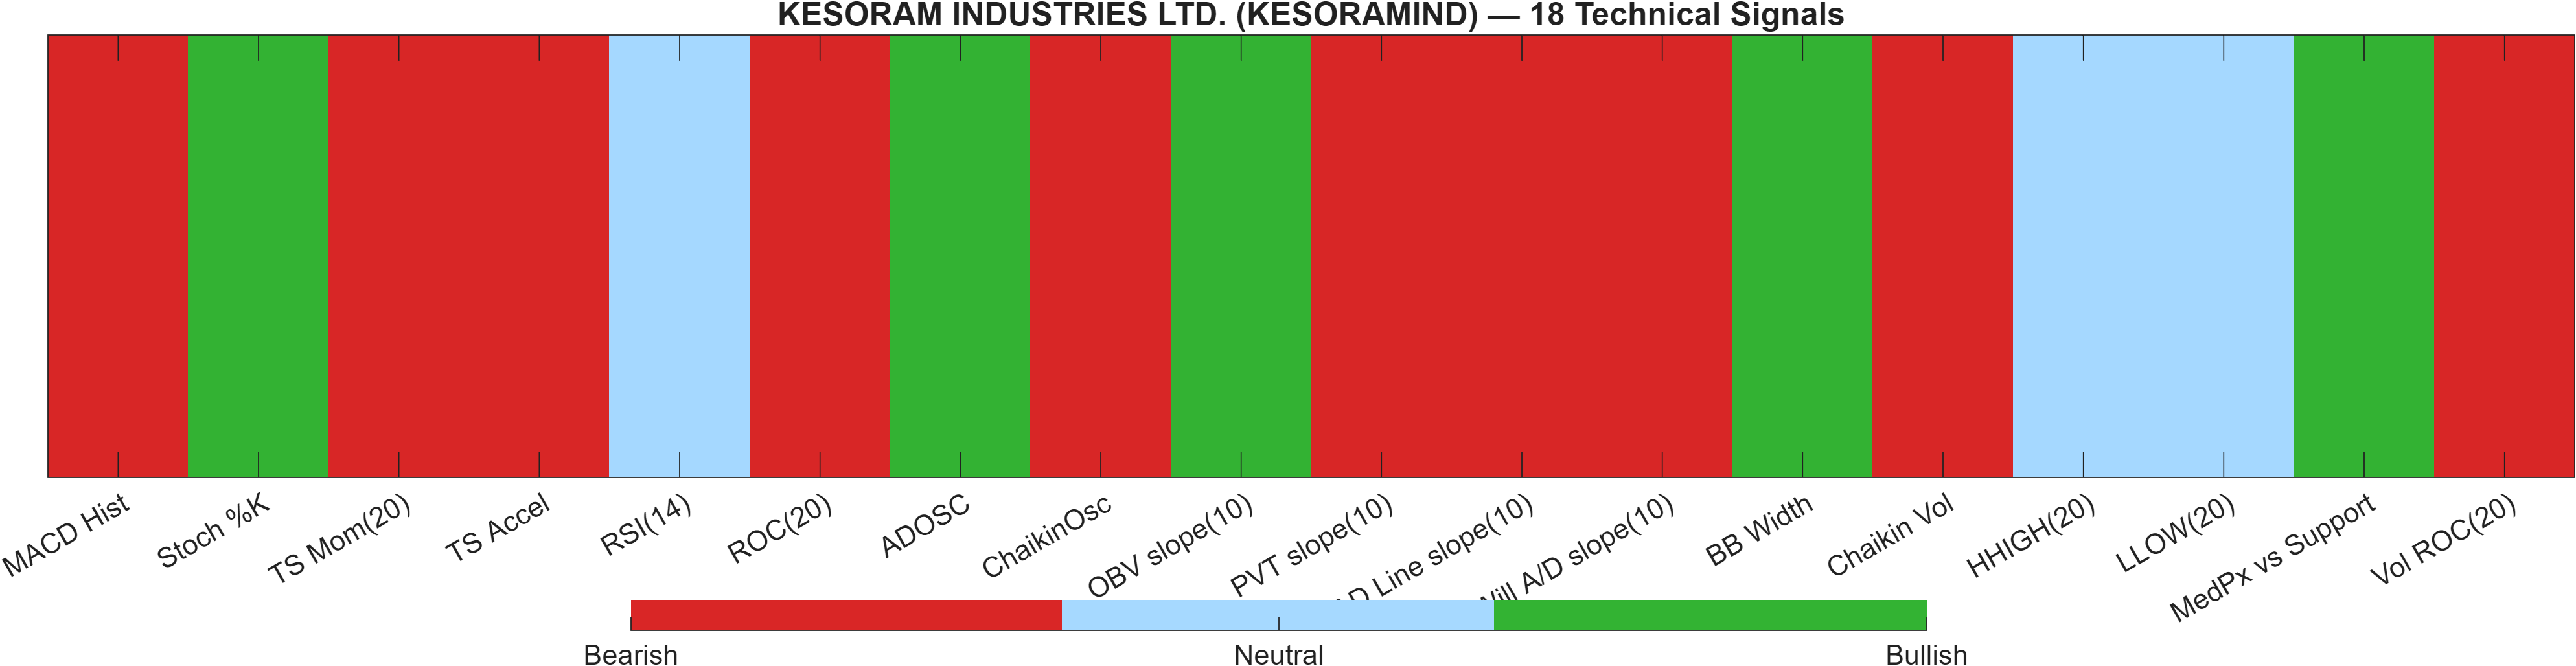
Signal blend: neutral confluence overridden by weaker AI technical rank
The dashboard highlights a key analytical feature of the KGNAI stack: confluence and AI rank can diverge. Here, the 18-signal confluence score is -0.278 and labeled Neutral, implying that individual indicators are not uniformly bearish. Yet the Deep Reinforcement Learning technical rank is #1132 with a -0.854 score, pulling the blended technical score to -0.451 and a Bearish label.
Internal dispersion: participation and momentum skew bearish despite select bullish pockets
The breakdown (Bull 5 / Bear 10 / Neutral 3) indicates a bearish skew that is not extreme but persistent. Bullish pockets exist—Stoch %K 9.239 and ADOSC 50.85 point to some short-cycle improvement—yet broader momentum/flow measures lean negative (TS Accel -2.4, PVT slope(10) -1.629e+04, and Vol ROC(20) -64.83). This mixture often produces rallies that require confirmation because buying pressure is not consistently supported across volume and trend components.
Volatility signal interpretation: bandwidth as a setup, not a direction call
BB Width 0.1555 is tagged bullish within the signal table, reflecting a volatility regime that can facilitate expansion. However, with MACD histogram at -0.1737 and the blended score bearish, the more disciplined read is that volatility conditions may enable movement, while direction should be resolved at resistance 13.4617 and validated by improving momentum/participation.
Signal table (Bull/Bear/Neutral)
| Indicator | Value | Signal |
|---|---|---|
| MACD Hist | -0.1737 | Bearish |
| Stoch %K | 9.239 | Bullish |
| TS Mom(20) | -0.32 | Bearish |
| TS Accel | -2.4 | Bearish |
| RSI(14) | 52.27 | Neutral |
| ROC(20) | -2.996 | Bearish |
| ADOSC | 50.85 | Bullish |
| ChaikinOsc | -1.91e+05 | Bearish |
| OBV slope(10) | 5.893e+05 | Bullish |
| PVT slope(10) | -1.629e+04 | Bearish |
| AD Line slope(10) | -7.069e+05 | Bearish |
| Will A/D slope(10) | -0.11 | Bearish |
| BB Width | 0.1555 | Bullish |
| Chaikin Vol | 22.88 | Bearish |
| HHIGH(20) | 13.7 | Neutral |
| LLOW(20) | 11.21 | Neutral |
| MedPx vs Support | 2.293 | Bullish |
| Vol ROC(20) | -64.83 | Bearish |
Interpretation: Indicator-level signals form the base confluence, which is then adjusted using a separate AI-driven technical ranking model. The final technical score summarizes this combined view.
6) News sentiment + extractive gist
Note: Instrument-specific news matches were not found, so the digest includes broader market/sector headlines. Links are provided for verification.
Sentiment score (avg): 0.191 | Positive: 62% | Neutral: 38% | Negative: 0%
KGNAI AI News Sentiment Score (normalized -1 to +1): Not available (as of —) | Label: Not available | Overall news score: 0.19
Positive Developments
Recent coverage across major financial outlets indicates a constructive tone in broader risk assets, with pockets of optimism tied to earnings strength, upbeat outlook language, and renewed interest in select themes. The aggregate sentiment read supports this: an average score of 0.191 with 62% positive classification and no negative items flagged in the provided mix. Because the digest is not instrument-specific for KESORAMIND, the primary use is contextual—gauging whether the surrounding environment is likely to support follow-through when technical levels are tested. In that respect, a positive ambient tape can reduce the probability of immediate breakdowns, but it does not substitute for confirmation when the asset’s short-term ranks are still weak (Daily #1135; Weekly #1064). For KESORAMIND, constructive broader tone would be most relevant if price begins to resolve higher toward resistance 13.4617 and momentum improves from MACD histogram -0.1737.
Neutral / Mixed Developments
The neutral component (38%) suggests a meaningful share of coverage remains informational rather than directional, emphasizing market drivers and macro-sensitive monitoring without a clear risk-on or risk-off conclusion. This matters because mixed background narratives often coincide with choppier intraday structure and selective leadership—conditions that can keep oscillators like RSI(14) (52.27) pinned near neutral while trend measures remain unresolved. For KESORAMIND, that aligns with the broader technical message: volatility conditions (bandwidth 0.1555) may permit expansion, but direction is still best treated as conditional on level-based confirmation and participation.
Negative / Risk Signals
While the sentiment breakdown reports 0% negative in the provided classification, the presence of “risk” themes in the digest highlights an important limitation: headline tone and market impact can diverge. Cross-market risk narratives—regulatory uncertainty, abrupt single-name drawdowns, and event-driven volatility—can raise correlation spikes and undermine technically fragile setups. Given KESORAMIND’s bearish blended technical score (-0.451) and weak AI technical rank (#1132), any broad-based risk-off impulse could increase the probability that support 9.9125 is tested. The disciplined interpretation is to treat sentiment as contextual bias, not as a primary signal, especially when instrument-specific news matching is not available in the provided data.
What to monitor next
- Whether price action can reclaim intermediate trend alignment (Close vs MA50 currently bearish) while approaching 13.4617.
- Whether MACD histogram (-0.1737) improves alongside participation proxies (e.g., Vol ROC(20) -64.83).
- Whether repeated closes hold above 9.9125 during volatility changes (bandwidth 0.1555).
7) Sources
- US stocks today: US stocks end modestly higher as AI zeal overcomes Middle East jitters
- Alkem Labs sees Rs 930 crore block deal as promoter family entities pare stake; Goldman, Morgan Stanley among key buyers
- Ahead of Market: 10 things that will decide stock market action on Wednesday
- CMR Green raises Rs 188 crore in IPO anchor round; SBI MF, ICICI Pru MF among top investors
- Market Trading Guide: Parag Milk among two stock recommendations for Wednesday
- US stocks: Fulcrum shares plummet over 50% after scrapping lead sickle-cell drug on FDA concerns
- US SEC, Elon Musk defend 'compromise' settlement over Twitter purchases
- US stocks today: US stocks slip at open after record highs
You may also like: How KGNAI AI ranks instruments across global markets
Disclaimer: KGNAI provides AI-generated analytics and educational market commentary only. This is not financial advice. Markets involve risk. Always do your own research.