RELIANCE (Reliance Industries Limited) — 05-Jun-2026 Neutral stance with bearish technical confluence
Reliance Industries Limited (RELIANCE) screens as a neutral-ranked instrument in KGNAI’s cross-sectional universe as of 05-Jun-2026, while the underlying technical stack leans bearish. The rank profile is mixed across horizons: the weekly rank (#173 of 1221) sits in the stronger cohort versus a softer daily rank (#636 of 1221), with most longer horizons clustering in neutral territory (e.g., monthly #342, yearly #363). Price structure also shows a defensive tilt with the close positioned below the MA50 and MA50 below MA200. Momentum readings echo that pressure—RSI(14) at 20.39 and a MACD histogram of -2.8124—while volatility is relatively contained with Bollinger bandwidth at 0.0605. News analytics are unusually constructive despite neutral headline classification: sentiment mix reads 100% neutral with a normalized score of 0.97, creating a notable sentiment-versus-price tension.
Key Takeaways
- Rank stance (Short / Mid / Long): Neutral / Neutral / Neutral; weekly is comparatively stronger at #173 while daily is softer at #636 (universe: 1221).
- Technical confluence: Bearish with 18-signal score -0.444 and overall technical score -0.456.
- Key levels: Support near 1311.0250; resistance near 1446.6062.
- News sentiment bias: Bullish normalized sentiment score 0.97 (overall news score 0.71), despite 0.000 average sentiment and 100% neutral distribution.
- Confirmation / invalidation condition: A volume-backed break above 1446.6062 would strengthen continuation evidence; a close below 1311.0250 increases deterioration risk per the scenario framing.
What KGNAI Measures
KGNAI evaluates assets using large cross-sectional datasets built from millions of structured data points. Inputs incorporate fundamental metrics, technical structures, and systematically processed news sentiment. Statistical models, machine learning, and AI frameworks are used to assess relative positioning, signal alignment, and probabilistic behavior across broad universes.
How to Read This Report
- Ranks are comparative across the tracked universe, not absolute price targets.
- Confluence reflects alignment among independent signal groups.
- Support/resistance levels are probabilistic decision zones, not guarantees.
- Sentiment provides contextual bias within the broader analytical framework.
1) KGNAI AI Analysis
Region: INDIA
Total universe size: 1221 ranked instruments
- Daily rank: #636 out of 1221 — Neutral
- Weekly rank: #173 out of 1221 — Bullish
- Monthly rank: #342 out of 1221 — Neutral
- 3-Monthly rank: #306 out of 1221 — Neutral
- 6-Monthly rank: #528 out of 1221 — Neutral
- Yearly rank: #363 out of 1221 — Neutral
The rank stack for RELIANCE is characterized by mid-horizon resilience alongside short-horizon softness. The weekly rank (#173) places the name in a relatively stronger slice of the 1221-instrument universe, consistent with a constructive intermediate positioning. That contrasts with the daily rank (#636), which sits closer to the lower half and indicates that near-term behavior has been less favorable in the model’s probability framing.
Longer horizons—monthly (#342), 3-monthly (#306), 6-monthly (#528), and yearly (#363)—cluster in neutral territory, suggesting the model is not seeing decisive persistence in either direction. Practically, this pattern is often associated with a regime that is transitional: enough stabilization to lift the weekly profile, but insufficient breadth across horizons to reclassify the broader stance.
Importantly, the term view remains Neutral across short-, mid-, and long-term labels, which aligns with the idea that the weekly strength has not yet propagated into a multi-horizon trend signal. For allocation workflows, the key analytical question becomes whether the near-term drag (daily rank) resolves upward to confirm the weekly strength, or whether weekly momentum fades back toward the longer neutral cluster.
Term view: Short-term: Neutral. Mid-term: Neutral. Long-term: Neutral.
Want the full universe and complete rank tables? Unlock full access on KGNAI: https://www.kgnai.com/pricing
2) Price & trend overview
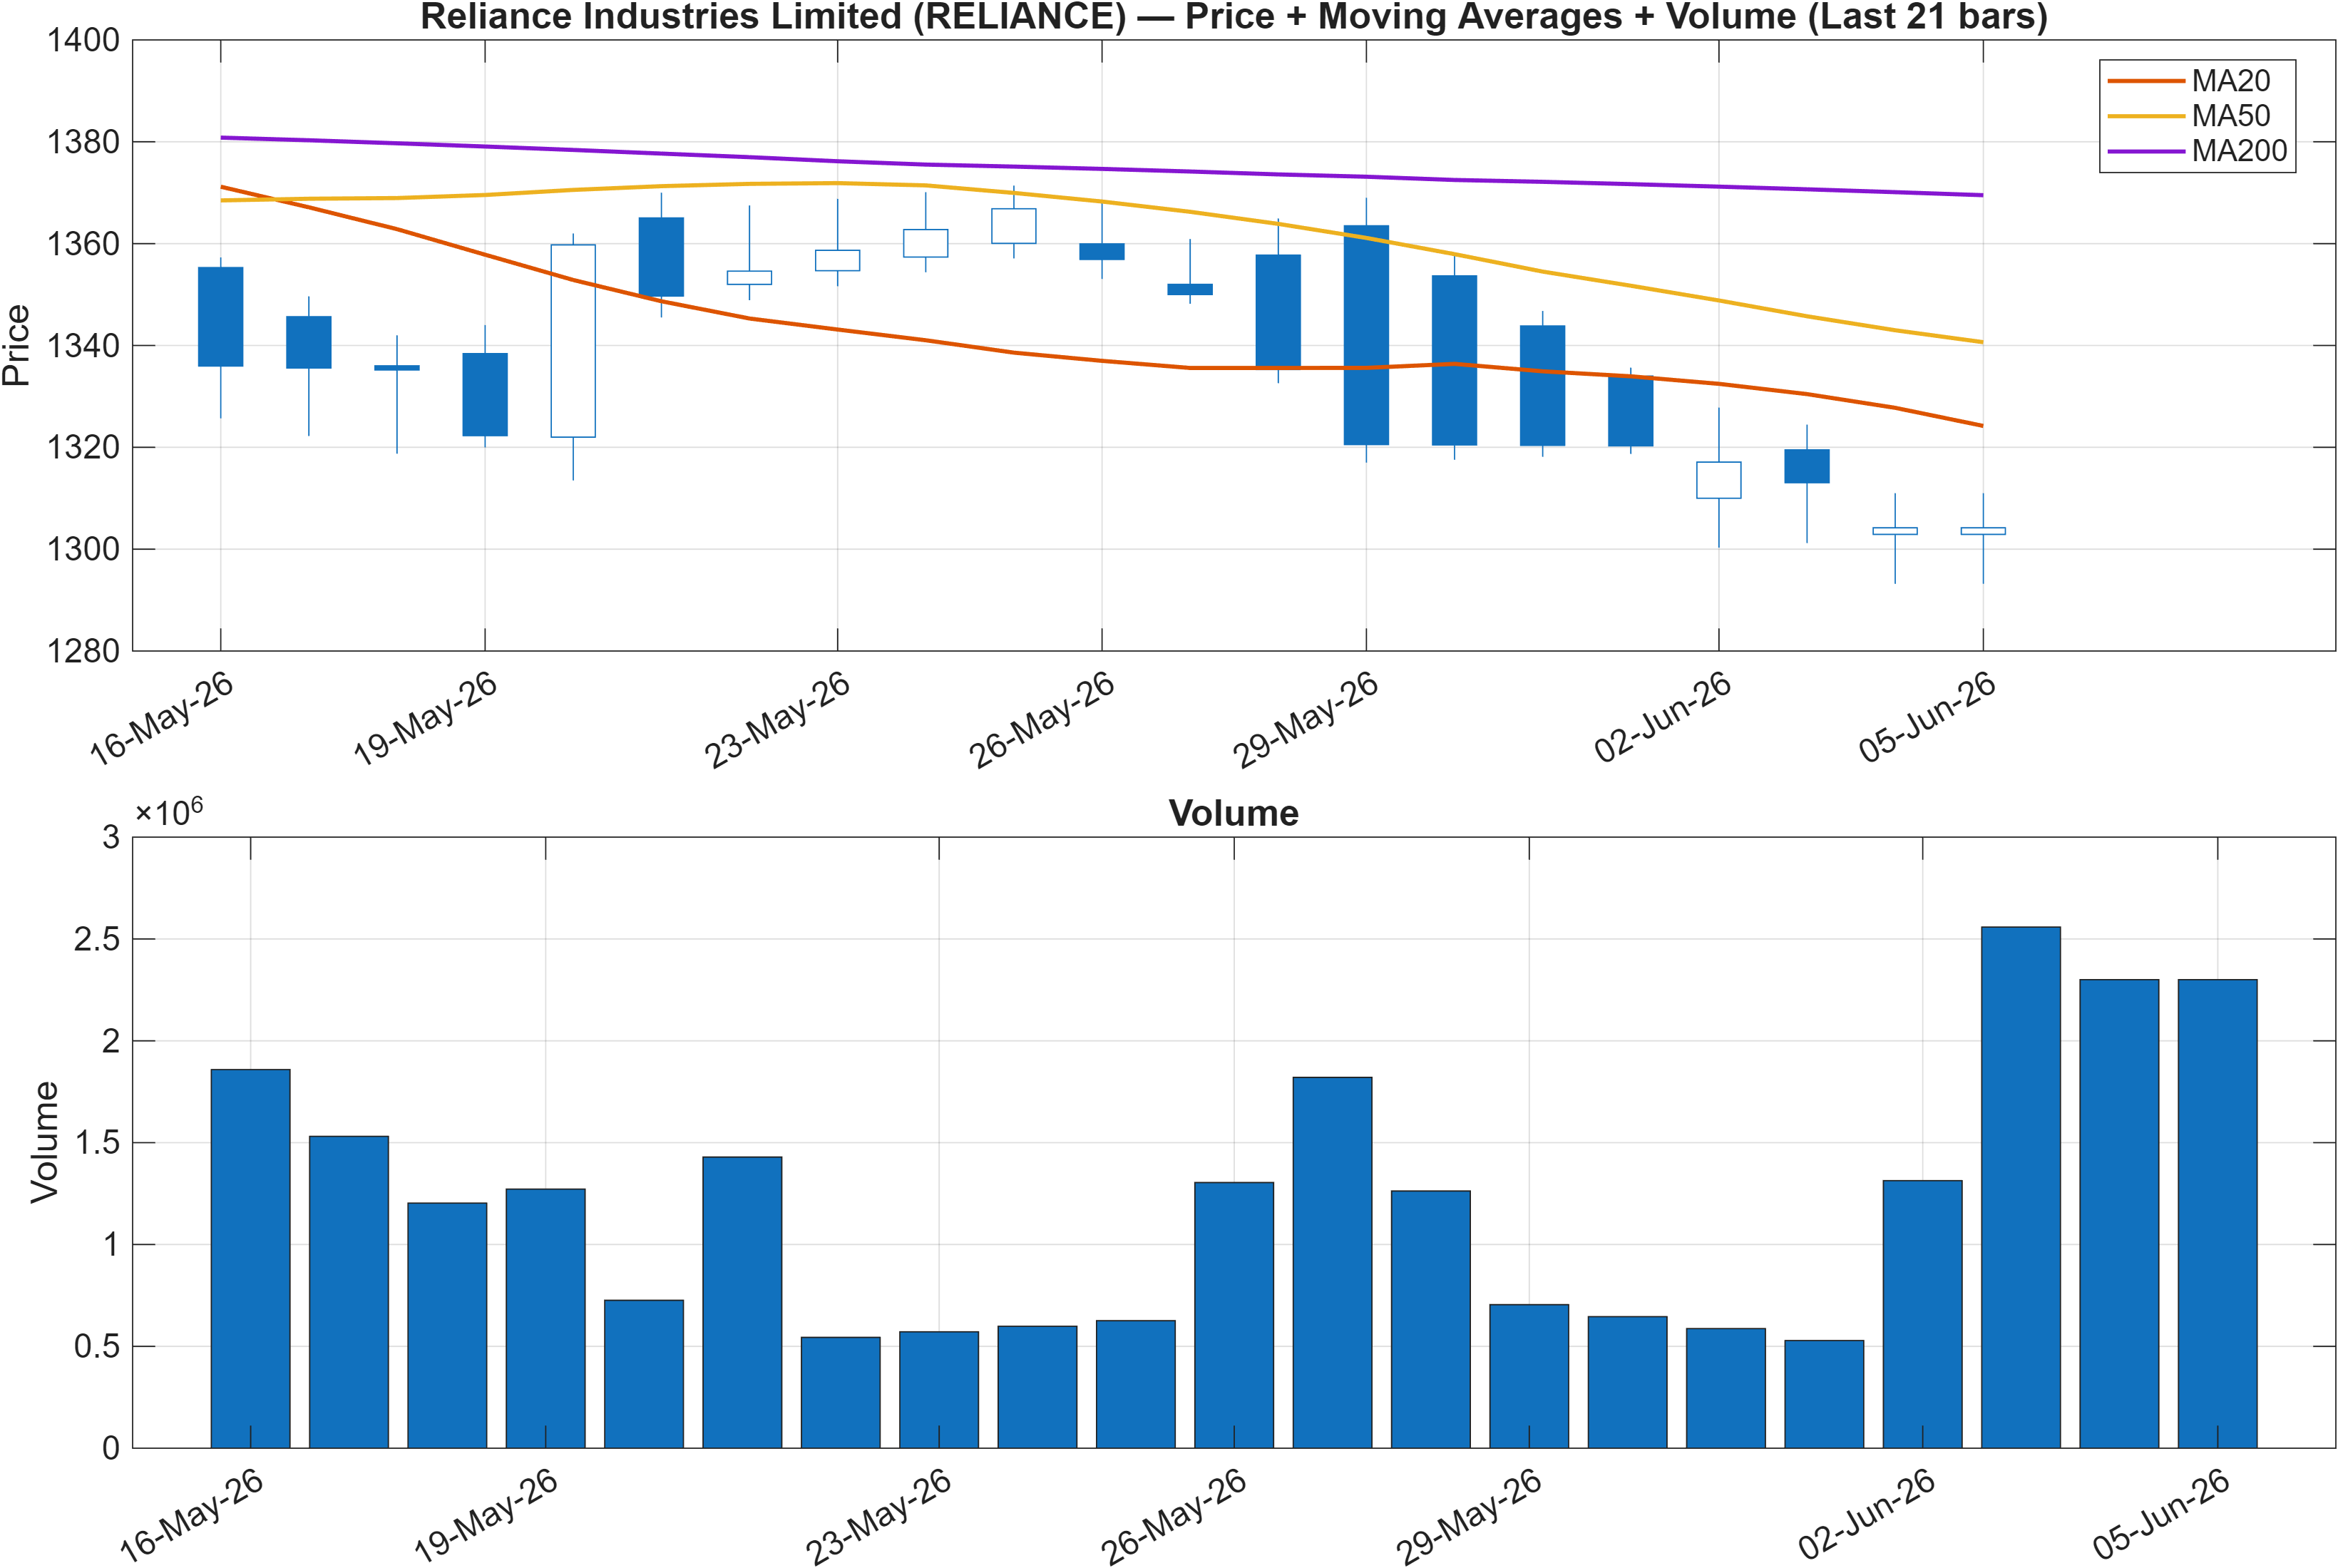
Interpretation: Close vs MA50 = Bearish, MA50 vs MA200 = Bearish.
Trend structure is currently defined by a two-layer moving-average headwind: the close remains below the MA50, and the MA50 is below the MA200. That configuration typically reflects a market where rallies can face overhead supply until price reclaims the shorter average and the slope relationship begins to heal. In this context, the key analytical issue is not a single-day fluctuation but whether the instrument can move from mean-reversion attempts into a more durable trend repair.
The rank behavior provides additional nuance. Despite the bearish moving-average read, the weekly rank (#173) is notably stronger than the daily rank (#636). That divergence often appears when a market is trying to stabilize after weakness: intermediate signals improve first, while short-horizon noise and residual selling pressure remain visible in daily behavior. The longer horizon ranks (e.g., monthly #342 and yearly #363) staying neutral supports the interpretation of an unresolved trend regime rather than a clean continuation phase.
From a market-structure perspective, the trend framework suggests that confirmation would likely require more than a brief bounce; it would require evidence that the close can persistently work back toward the moving averages, reducing the distance to MA50 and ultimately challenging the longer-term trend filter. Until then, the price-and-trend layer remains consistent with a defensive posture even as some intermediate rank signals appear less negative than the short-term tape implies.
3) Momentum & volatility dashboard
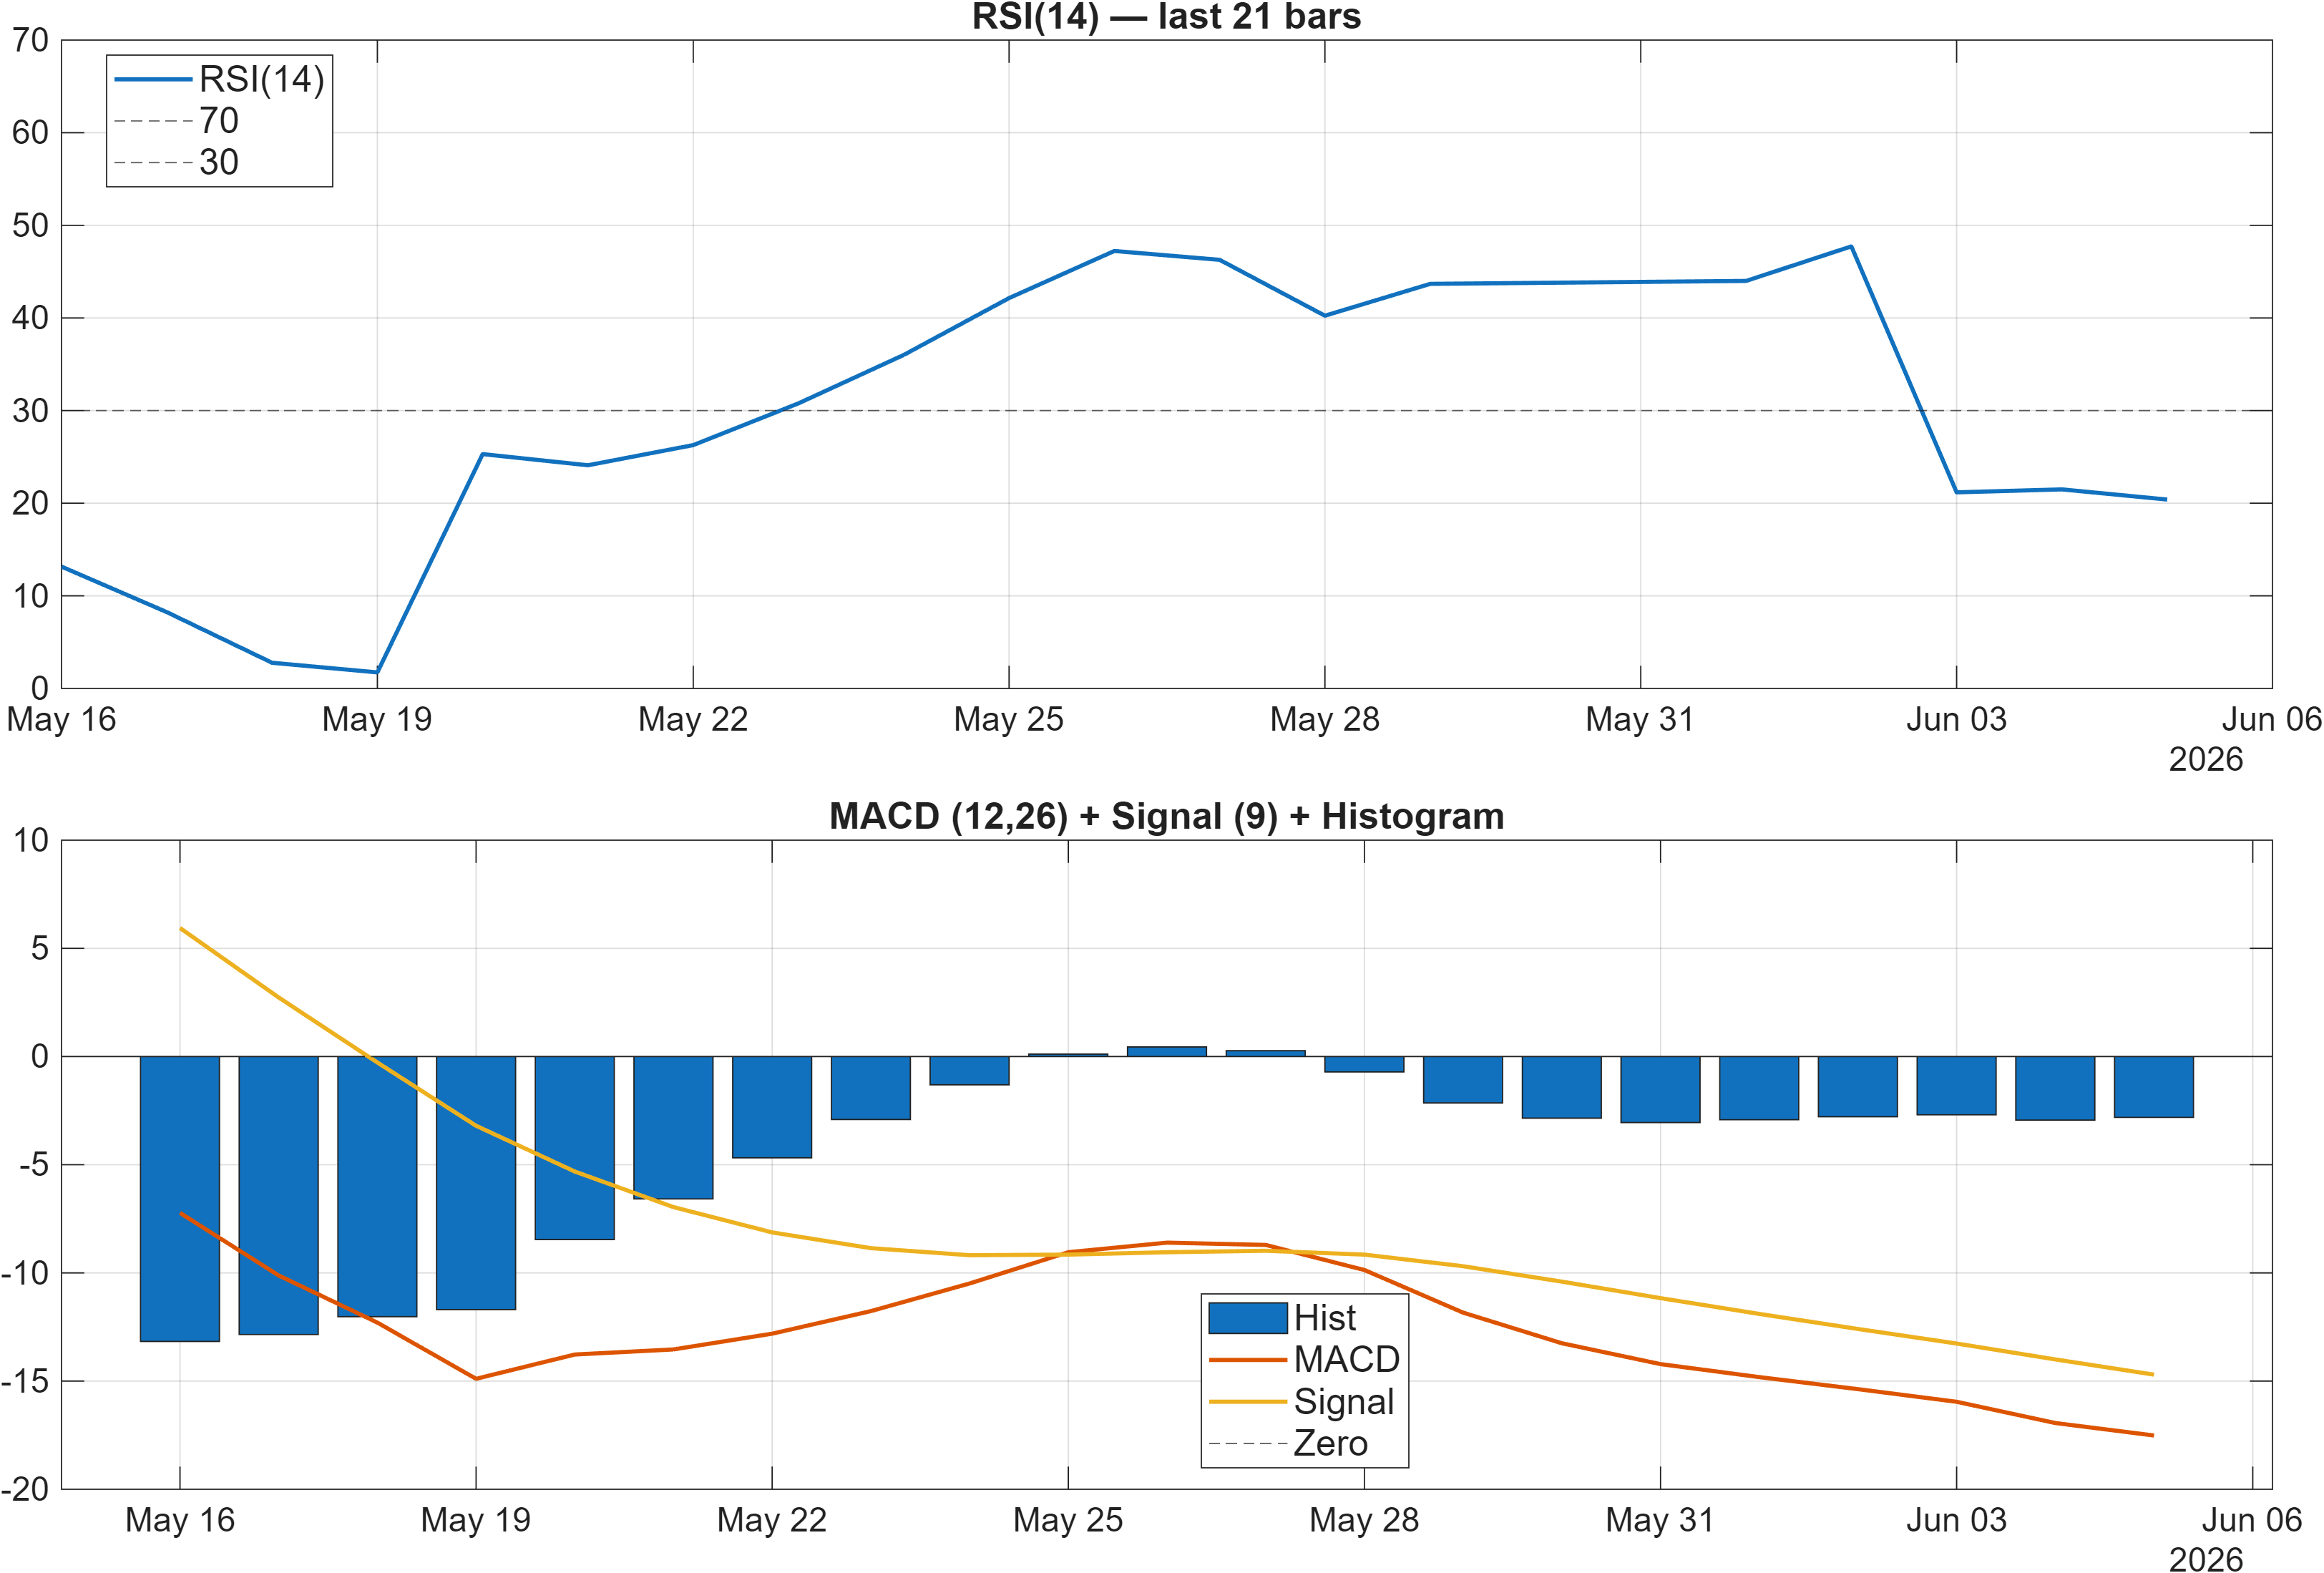
Interpretation: RSI bias = Bearish, MACD hist = -2.8124.

Interpretation: Bandwidth (volatility regime) latest = 0.0605.
Momentum metrics point to a market that is stretched to the downside but not yet exhibiting a confirmed trend reversal signature. The RSI(14) at 20.39 is deeply depressed, consistent with bearish momentum conditions and potential oversold dynamics. At the same time, the MACD histogram at -2.8124 indicates that negative momentum remains present rather than fully dissipating. This combination often describes a phase where downside pressure has been intense, yet follow-through on stabilization must be validated through improving MACD behavior rather than assumed from RSI alone.
Volatility context adds an important constraint. With Bollinger bandwidth at 0.0605, the regime is relatively contained compared with what is typically observed during disorderly selloffs. A tighter bandwidth during weak momentum can imply compression: price is not expanding in range even as momentum is negative, which can precede a directional move once the compression resolves. The direction of that resolution is not specified by bandwidth itself; it becomes more interpretable when paired with support/resistance behavior and the broader confluence stack.
In practical signal terms, the current dashboard suggests a tension between oversold readings and still-negative trend impulse. If RSI begins to recover while the MACD histogram moves materially toward zero, it would align with an improving short-term rank profile. Conversely, persistent negative MACD alongside a low RSI can still occur in trending declines, especially when moving averages remain bearishly configured.
4) Support / Resistance zones
Support ~ 1311.0250 | Resistance ~ 1446.6062
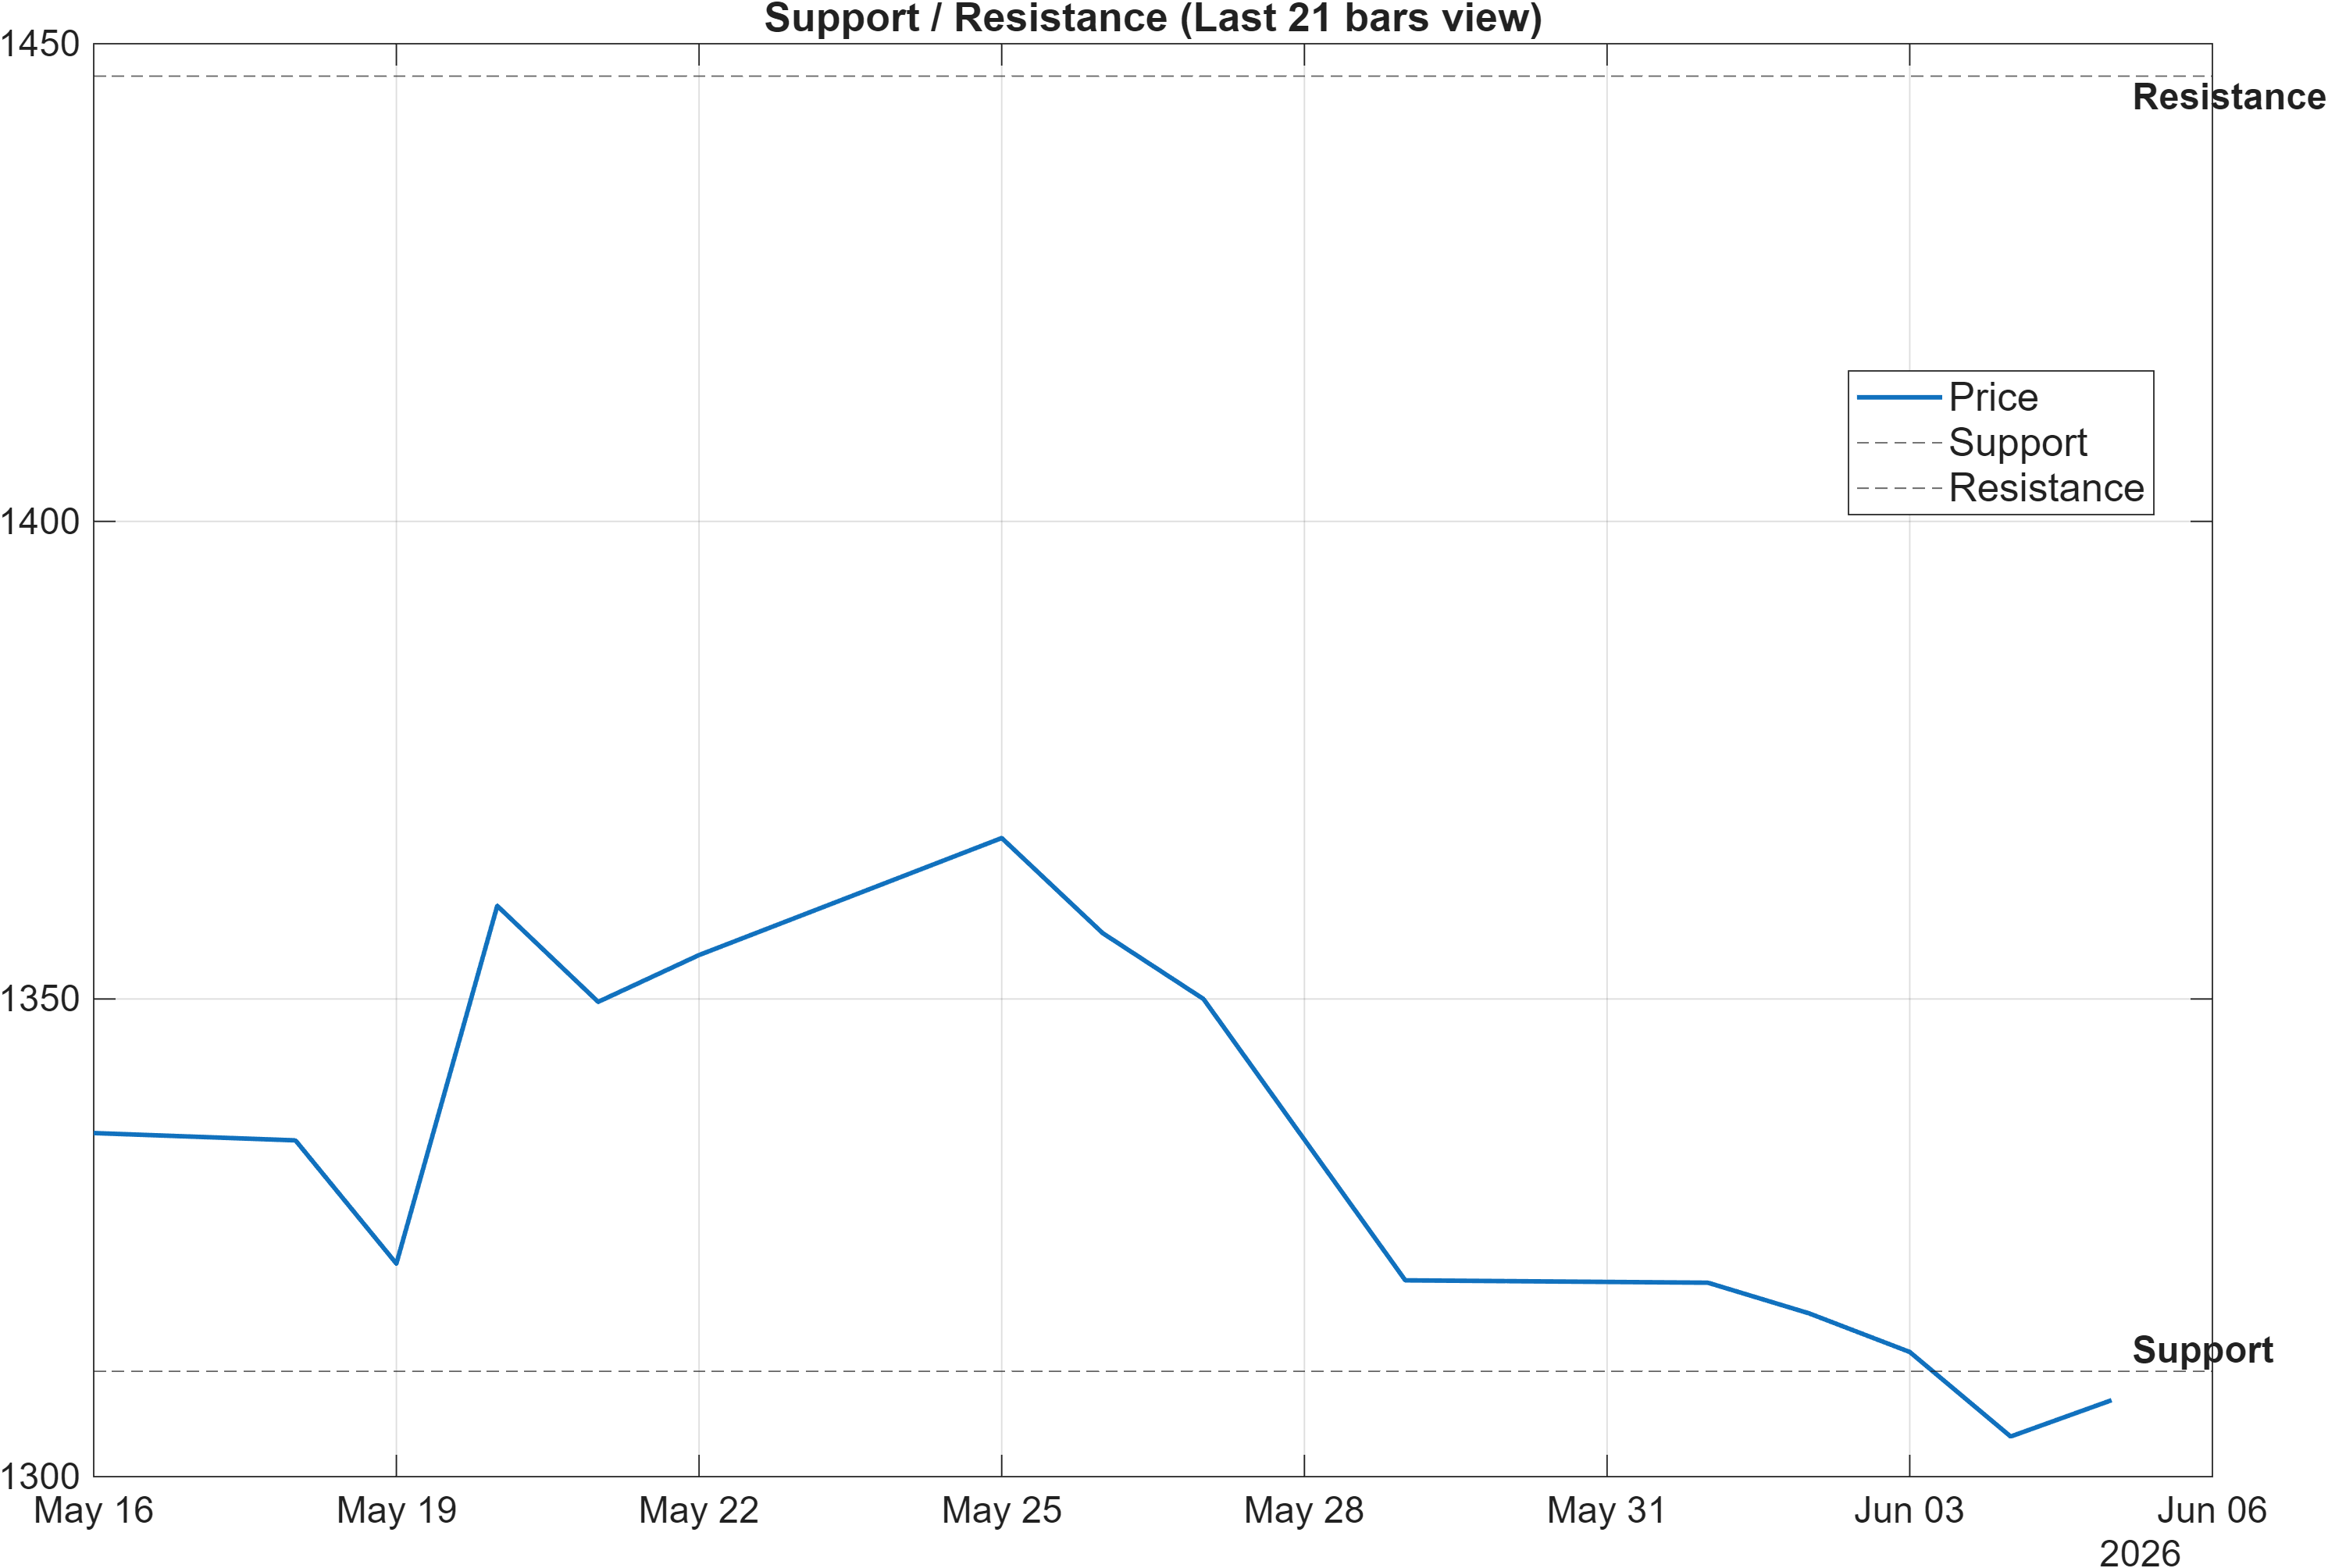
Scenario view: Break above resistance with volume → continuation. Close below support → signal deterioration risk.
The level map frames the current market as a two-sided decision zone rather than a one-direction trend channel. The nearby support at ~1311.0250 is the primary reference for downside control: given the bearish momentum context (e.g., MACD histogram -2.8124), a close below support would be consistent with renewed deterioration and would likely pressure the already weak technical confluence readings.
On the upside, resistance at ~1446.6062 defines the threshold for re-acceleration. The scenario framing explicitly ties a break above resistance to continuation with volume, which matters because the trend layer remains bearish (close below MA50; MA50 below MA200). In other words, the market would need to do more than bounce; it would need to reclaim an upper boundary and demonstrate participation to argue that the intermediate strength implied by the weekly rank (#173) is converting into durable price behavior.
The distance between these two levels also supports a regime view: this is not a tight micro-range, but a zone where moves can develop enough magnitude to shift multi-signal alignment. With volatility relatively contained (bandwidth 0.0605), a decisive move through either boundary may be easier to detect because the regime has not been dominated by wide, noisy swings. Until a boundary is resolved, the level framework argues for prioritizing confirmation over anticipation, particularly given the neutral cross-horizon rank stance.
5) Quant Technical Dashboard (18 Signals)
KGNAI AI Technical Analysis Score (Deep Reinforcement Learning): Rank #906 out of 1221 (Rank 1 represents the strongest technical positioning and a higher probability of favorable price behavior. As ranks increase toward the maximum, the probability of favorable outcomes weakens and bearish positioning becomes more dominant.) | Label: Neutral | Score: -0.484
18-Signal Technical Confluence Score: -0.444 (Bearish)
Overall Technical Score (18-signal confluence + DRL rank blend): -0.456 (Bearish)
Note: The blended score reflects signal strength weighted against broader AI technical ranking, which may temporarily diverge.
Blended technical score breakdown: -0.456 (Bearish | Bull 4 / Bear 12 / Neutral 2)
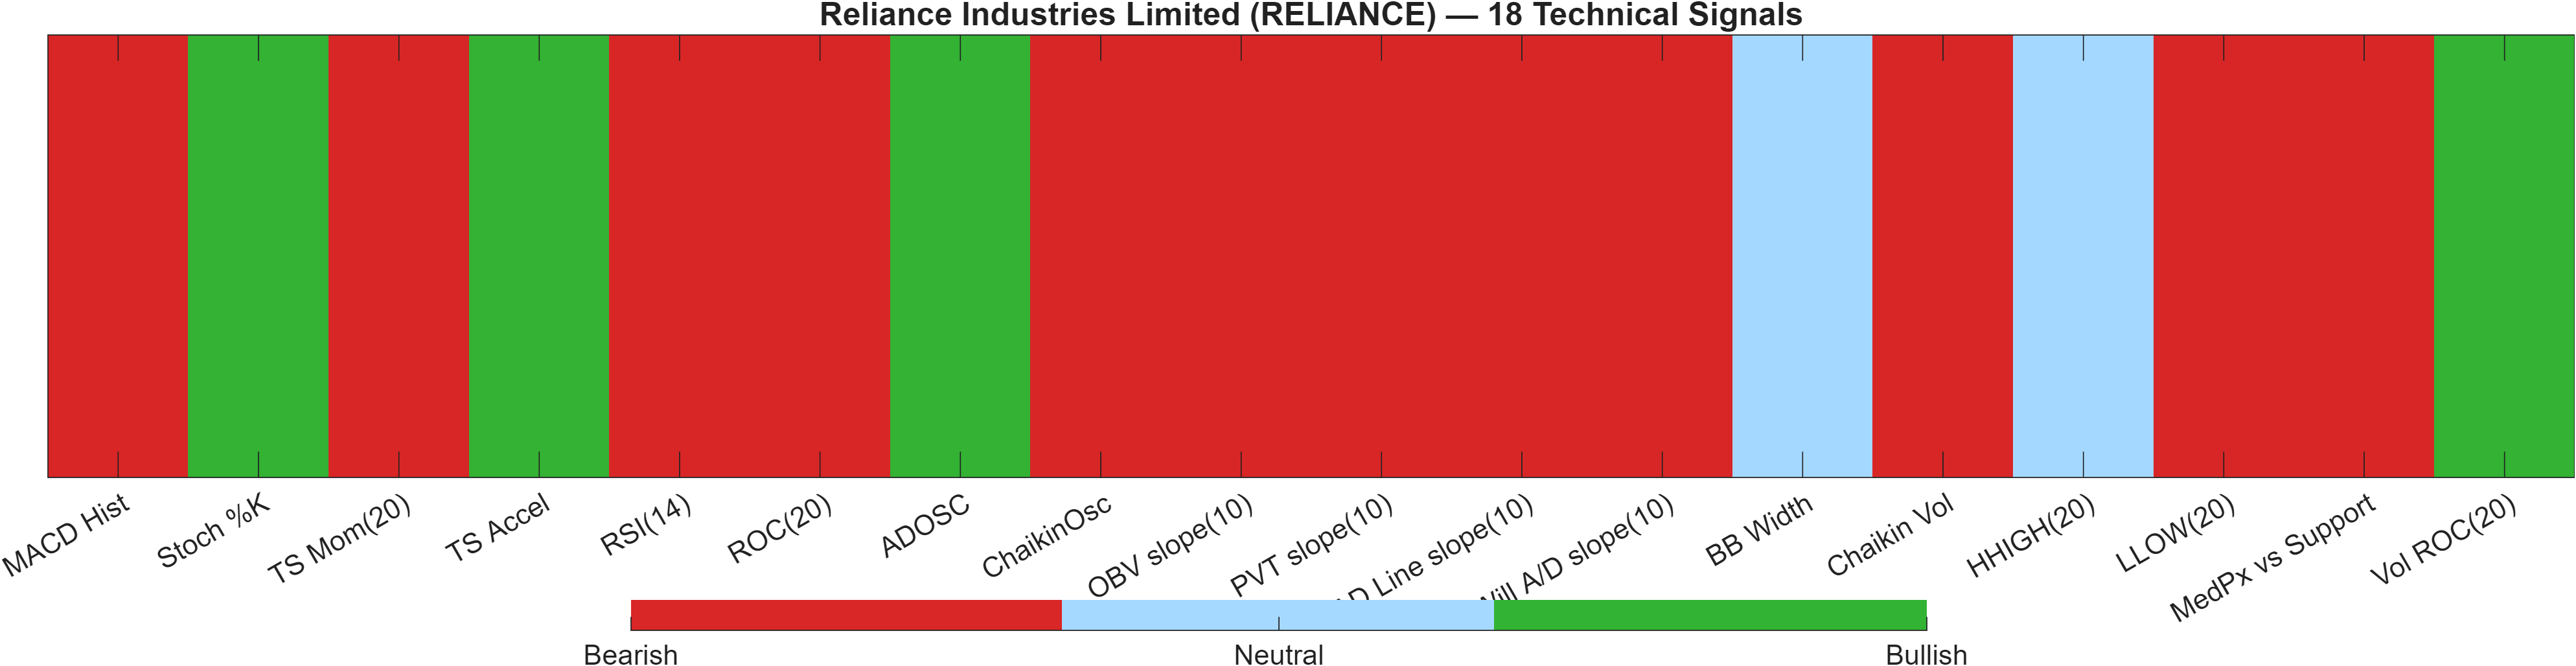
Signal alignment: breadth vs concentration
| Indicator | Value | Signal |
|---|---|---|
| MACD Hist | -2.812 | Bearish |
| Stoch %K | 14.51 | Bullish |
| TS Mom(20) | -31.38 | Bearish |
| TS Accel | 21.93 | Bullish |
| RSI(14) | 20.39 | Bearish |
| ROC(20) | -2.065 | Bearish |
| ADOSC | 53.65 | Bullish |
| ChaikinOsc | -4.946e+05 | Bearish |
| OBV slope(10) | -1.172e+07 | Bearish |
| PVT slope(10) | -5.747e+04 | Bearish |
| AD Line slope(10) | -3.017e+06 | Bearish |
| Will A/D slope(10) | -199.1 | Bearish |
| BB Width | 0.06048 | Neutral |
| Chaikin Vol | 19.95 | Bearish |
| HHIGH(20) | 1371 | Neutral |
| LLOW(20) | 1293 | Bearish |
| MedPx vs Support | -8.925 | Bearish |
| Vol ROC(20) | 50.24 | Bullish |
Interpretation: Indicator-level signals form the base confluence, which is then adjusted using a separate AI-driven technical ranking model. The final technical score summarizes this combined view.
The technical dashboard shows broad bearish participation rather than a narrow, single-indicator warning. The blended structure is explicitly negative: 18-signal confluence -0.444 and overall technical score -0.456, with breadth of Bear 12 versus Bull 4 and Neutral 2. This is consistent with a market where multiple independent families—momentum, volume/accumulation proxies, and range/position measures—are not yet aligning around recovery.
The AI technical ranking adds a second lens. The Deep Reinforcement Learning technical rank is #906 out of 1221 with a score of -0.484 and a Neutral label. That combination (neutral label but weak score/rank) fits the note that the blended score can diverge temporarily: the DRL layer may be recognizing non-linear stabilization patterns even while the simpler confluence stack remains bearish.
A key nuance is that some “fast” oscillators can improve early without overturning broader weakness—e.g., Stoch %K at 14.51 flags a bullish/oversold condition while RSI(14) at 20.39 and MACD histogram -2.812 remain bearish. Until the bearish breadth narrows and the composite scores move closer to neutral, the dashboard continues to describe a market where rebounds may be tactical rather than structurally confirmed.
6) News sentiment + extractive gist
Sentiment score (avg): 0.000 | Positive: 0% | Neutral: 100% | Negative: 0%
KGNAI AI News Sentiment Score (normalized -1 to +1): 0.97 (as of 2026-06-04) | Label: Bullish | Overall news score: 0.71
Positive Developments
Recent coverage across major financial outlets indicates a constructive narrative backdrop around RELIANCE that is more policy- and positioning-oriented than strictly price-led. Commentary has highlighted internal planning around cash and treasury management ahead of a central-bank decision context, which can be read as operational preparedness rather than a directional market call. Separate research commentary has discussed longer-dated infrastructure themes tied to data-centre capacity expansion in India, where Reliance is frequently cited as comparatively well-positioned due to existing infrastructure adjacency. Notably, KGNAI’s normalized news sentiment prints 0.97 (labelled Bullish) with an overall news score of 0.71, suggesting the language tone of coverage is supportive even if individual items are framed as informational rather than explicitly positive.
Neutral / Mixed Developments
The news distribution is classified as 100% neutral with an average sentiment score of 0.000, implying the item-level labeling is dominated by descriptive reporting rather than overtly directional takes. This matters because it can produce a “quietly constructive” backdrop: high-level narratives may be favorable, but the actual items may not provide immediate catalysts that translate into near-term price follow-through. In the current setup—where technical confluence is bearish (-0.444) and moving-average structure remains negative—neutral news flow may be insufficient to alter trend behavior on its own. The market’s response will likely hinge on how price behaves around key levels such as 1311.0250 and 1446.6062, rather than on incremental informational updates.
Negative / Risk Signals
Risk signaling in recent coverage appears more thematic than company-specific, centered on macro sensitivity and rate expectations. References to potential policy tightening can influence funding conditions and opportunity costs for cash deployment, which may affect broad positioning even when the company is described as preparing for multiple scenarios. The key analytical tension is that sentiment is strongly positive on the normalized scale (0.97) while technical conditions remain weak—e.g., RSI(14) at 20.39 and MACD histogram -2.8124. When sentiment and price-based signals diverge, outcomes often depend on whether price can reclaim resistance (1446.6062) or instead breaks down through support (1311.0250), which would validate the bearish technical breadth.
- What to monitor next: Price reaction and volume behavior on tests of 1446.6062 (resistance).
- What to monitor next: Any sustained loss of 1311.0250 (support) versus quick reclaim behavior.
- What to monitor next: Whether momentum improves as MACD histogram (-2.8124) trends toward zero alongside RSI recovery.
Snapshot: AI Rank (Short–Mid–Long): Neutral (Neutral–Neutral–Neutral) · Technical Confluence: Bearish · Key Levels: Support ~1311.03 | Resistance ~1446.61 · News Sentiment: Neutral
Sources referenced: Reuters, Bloomberg, Yahoo Finance, MarketWatch, Investing.com
7) Sources
Not available in the provided data.
You may also like: How KGNAI AI ranks instruments across global markets
Disclaimer: KGNAI provides AI-generated analytics and educational market commentary only. This is not financial advice. Markets involve risk. Always do your own research.