RBLBANK (RBL Bank Ltd) — 10-Jun-2026 Technical Strength vs Elevated Risk Metrics
RBL Bank Ltd (RBLBANK) enters 10-Jun-2026 with a notable cross-horizon split: the daily rank sits at #118 out of 1220 (upper decile, constructive), while the monthly rank is #1065 (lower tail, structurally weak). This type of dispersion typically signals a short-term upswing occurring inside a still-fragile medium-to-long regime. Technically, the system-level composite leans supportive: the 18-signal confluence score is 0.556 and the overall blended technical score is 0.655, both labeled bullish, with the AI technical model showing DRL rank #68. Momentum readings remain constructive (RSI bias bullish; MACD histogram 1.0226), while volatility is not yet in a high-expansion phase (Bollinger bandwidth 0.0795). Key price decision zones are well-defined at support ~311.3000 and resistance ~353.4583, which frame the conditions for either continuation or deterioration.
- Rank stance: Short-term Neutral (daily rank #118 is strong), Mid-term Bearish (weekly #584 is mid-pack; monthly #1065 weak), Long-term Bearish (6-monthly #981).
- Technical confluence: Bullish (overall technical score 0.655; DRL tech rank #68).
- Key levels: Support ~311.3000 | Resistance ~353.4583.
- News sentiment bias: Neutral overall tone, with headline mix skewing mildly constructive (avg 0.096; positives 44% vs negatives 6%).
- Confirmation / invalidation: Strength is better supported on a break above 353.4583 with volume; risk rises on a close below 311.3000.
KGNAI evaluates assets using large cross-sectional datasets built from millions of structured data points. Inputs incorporate fundamental metrics, technical structures, and systematically processed news sentiment. Statistical models, machine learning, and AI frameworks are used to assess relative positioning, signal alignment, and probabilistic behavior across broad universes.
- Ranks are comparative across the tracked universe, not absolute price targets.
- Confluence reflects alignment among independent signal groups.
- Support/resistance levels are probabilistic decision zones, not guarantees.
- Sentiment provides contextual bias within the broader analytical framework.
1) KGNAI AI Analysis
Region: INDIA
Total universe size: 1220 ranked instruments
- Daily rank: #118 out of 1220 — Bullish
- Weekly rank: #584 out of 1220 — Neutral
- Monthly rank: #1065 out of 1220 — Bearish
- 3-Monthly rank: #936 out of 1220 — Neutral
- 6-Monthly rank: #981 out of 1220 — Bearish
- Yearly rank: #974 out of 1220 — Neutral
Cross-horizon dispersion: short-term lift inside a weaker regime
The ranking curve is not monotonic across timeframes, which is often more informative than any single point estimate. The daily rank (#118) sits in the upper decile of the 1220-instrument universe, a profile consistent with near-term participation and favorable short-run behavior. By contrast, the monthly rank (#1065) places the instrument in the weaker tail, indicating that longer-window tests still classify the broader setup as risk-elevated. The weekly rank (#584) is closer to the middle of the distribution, suggesting the short-term impulse has not yet translated into persistent mid-horizon leadership.
This mix aligns with the stated term view: Short-term Neutral while mid- and long-term remain Bearish. In practice, such a configuration tends to be sensitive to level-based confirmation (i.e., whether price can hold above decision zones and whether follow-through emerges). It also increases the probability of “false breaks” where strong daily behavior fails to carry into the monthly composite. The 3-monthly rank (#936) and yearly rank (#974) both land in the lower portion of the universe but avoid the extreme tail, consistent with a market that can rally tactically without clearly resolving the broader ranking drag.
The analytical stance here is therefore conditional: the short window is supportive, but the weight of evidence across longer windows still requires confirmation before treating the move as regime change.
Want the full universe and complete rank tables? Unlock full access on KGNAI: https://www.kgnai.com/pricing
2) Price & trend overview
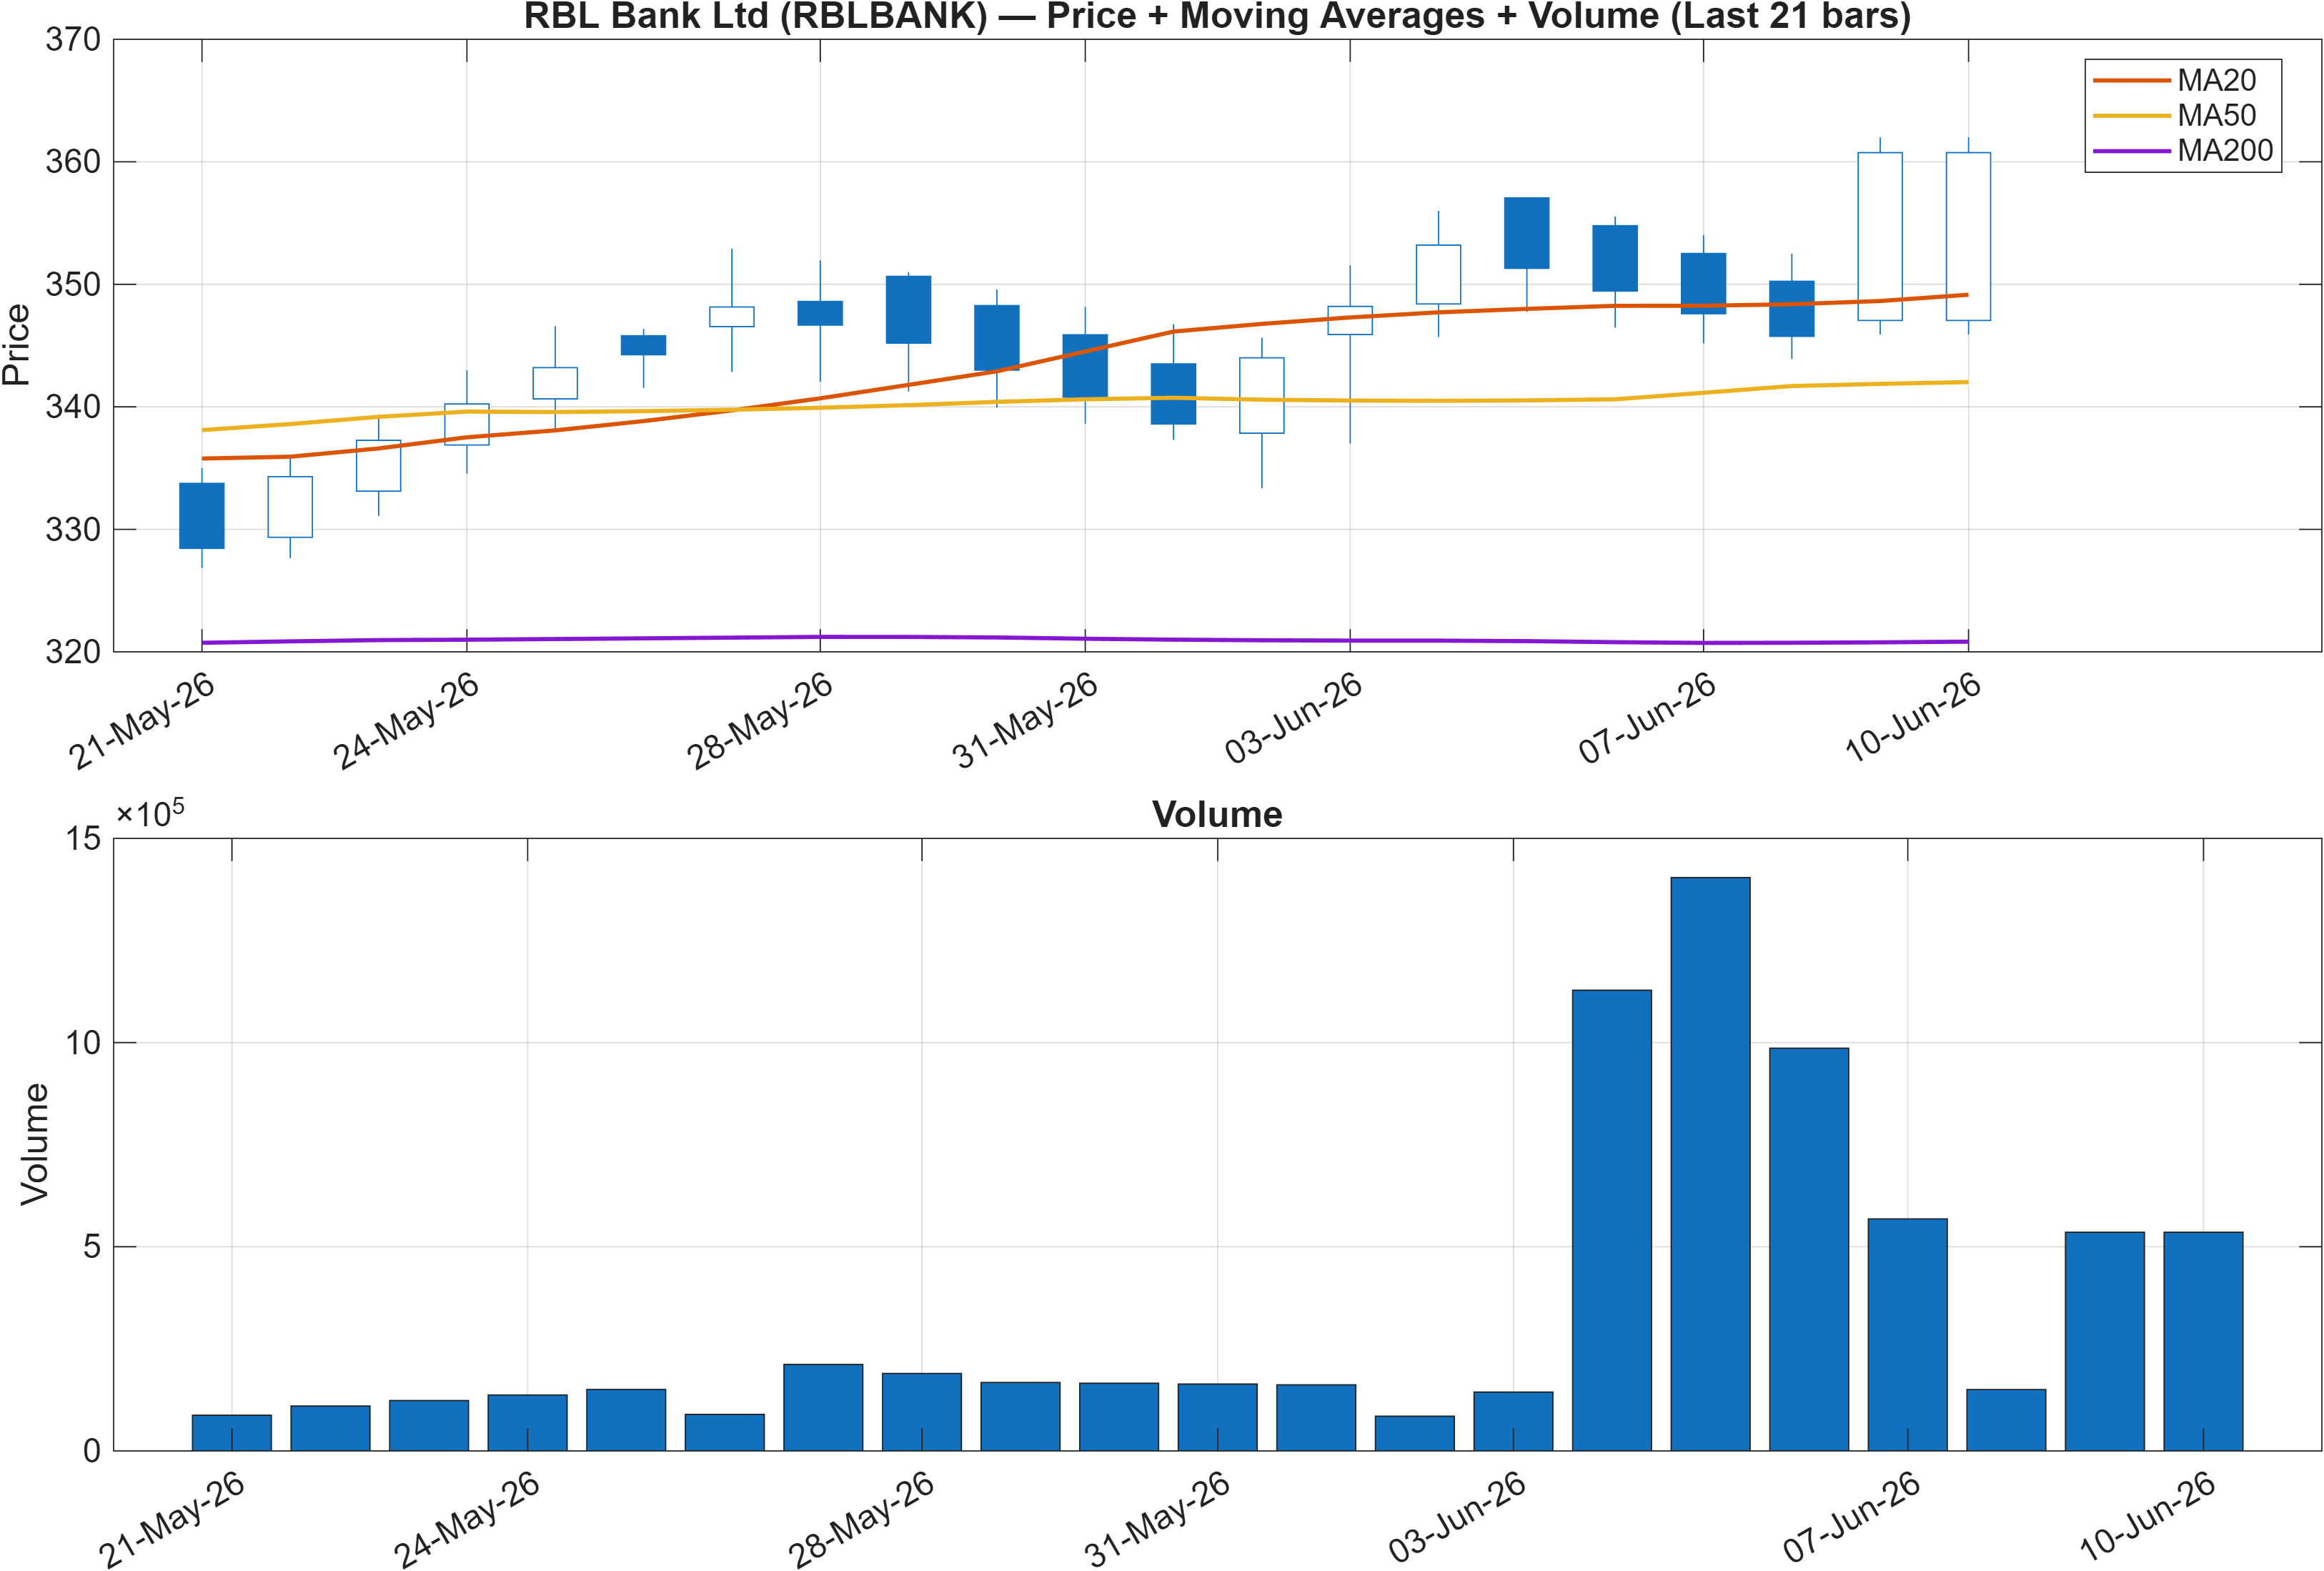
Trend structure: moving-average alignment supportive, but ranks argue for caution
The trend read is constructive on classical moving-average structure: close vs MA50 = Bullish and MA50 vs MA200 = Bullish. This configuration often reflects an established advance or a recovery that has progressed far enough to re-stack intermediate and long averages in a favorable order. When this trend backdrop appears alongside a strong AI technical rank (DRL rank #68), the market is typically rewarding directional persistence more than mean reversion.
The main analytical friction is that the broader KGNAI horizon ranks remain heavy—most notably the monthly rank (#1065) and 6-monthly rank (#981). That divergence matters because moving averages can look clean after a strong swing even while the cross-sectional, longer-window tests still detect structural weakness versus the broader universe. In other words, the chart can “heal” faster than the regime assessment.
For positioning discipline, the practical implication is to treat the moving-average alignment as a necessary condition for a more durable shift, but not a sufficient one. Confirmation is more likely if the instrument can sustain trend behavior through nearby decision zones (see support/resistance) and if momentum measures remain consistent with trend continuation (see RSI/MACD). Without that, the MA alignment can degrade quickly—especially if the market transitions into a higher-volatility regime.
3) Momentum & volatility dashboard
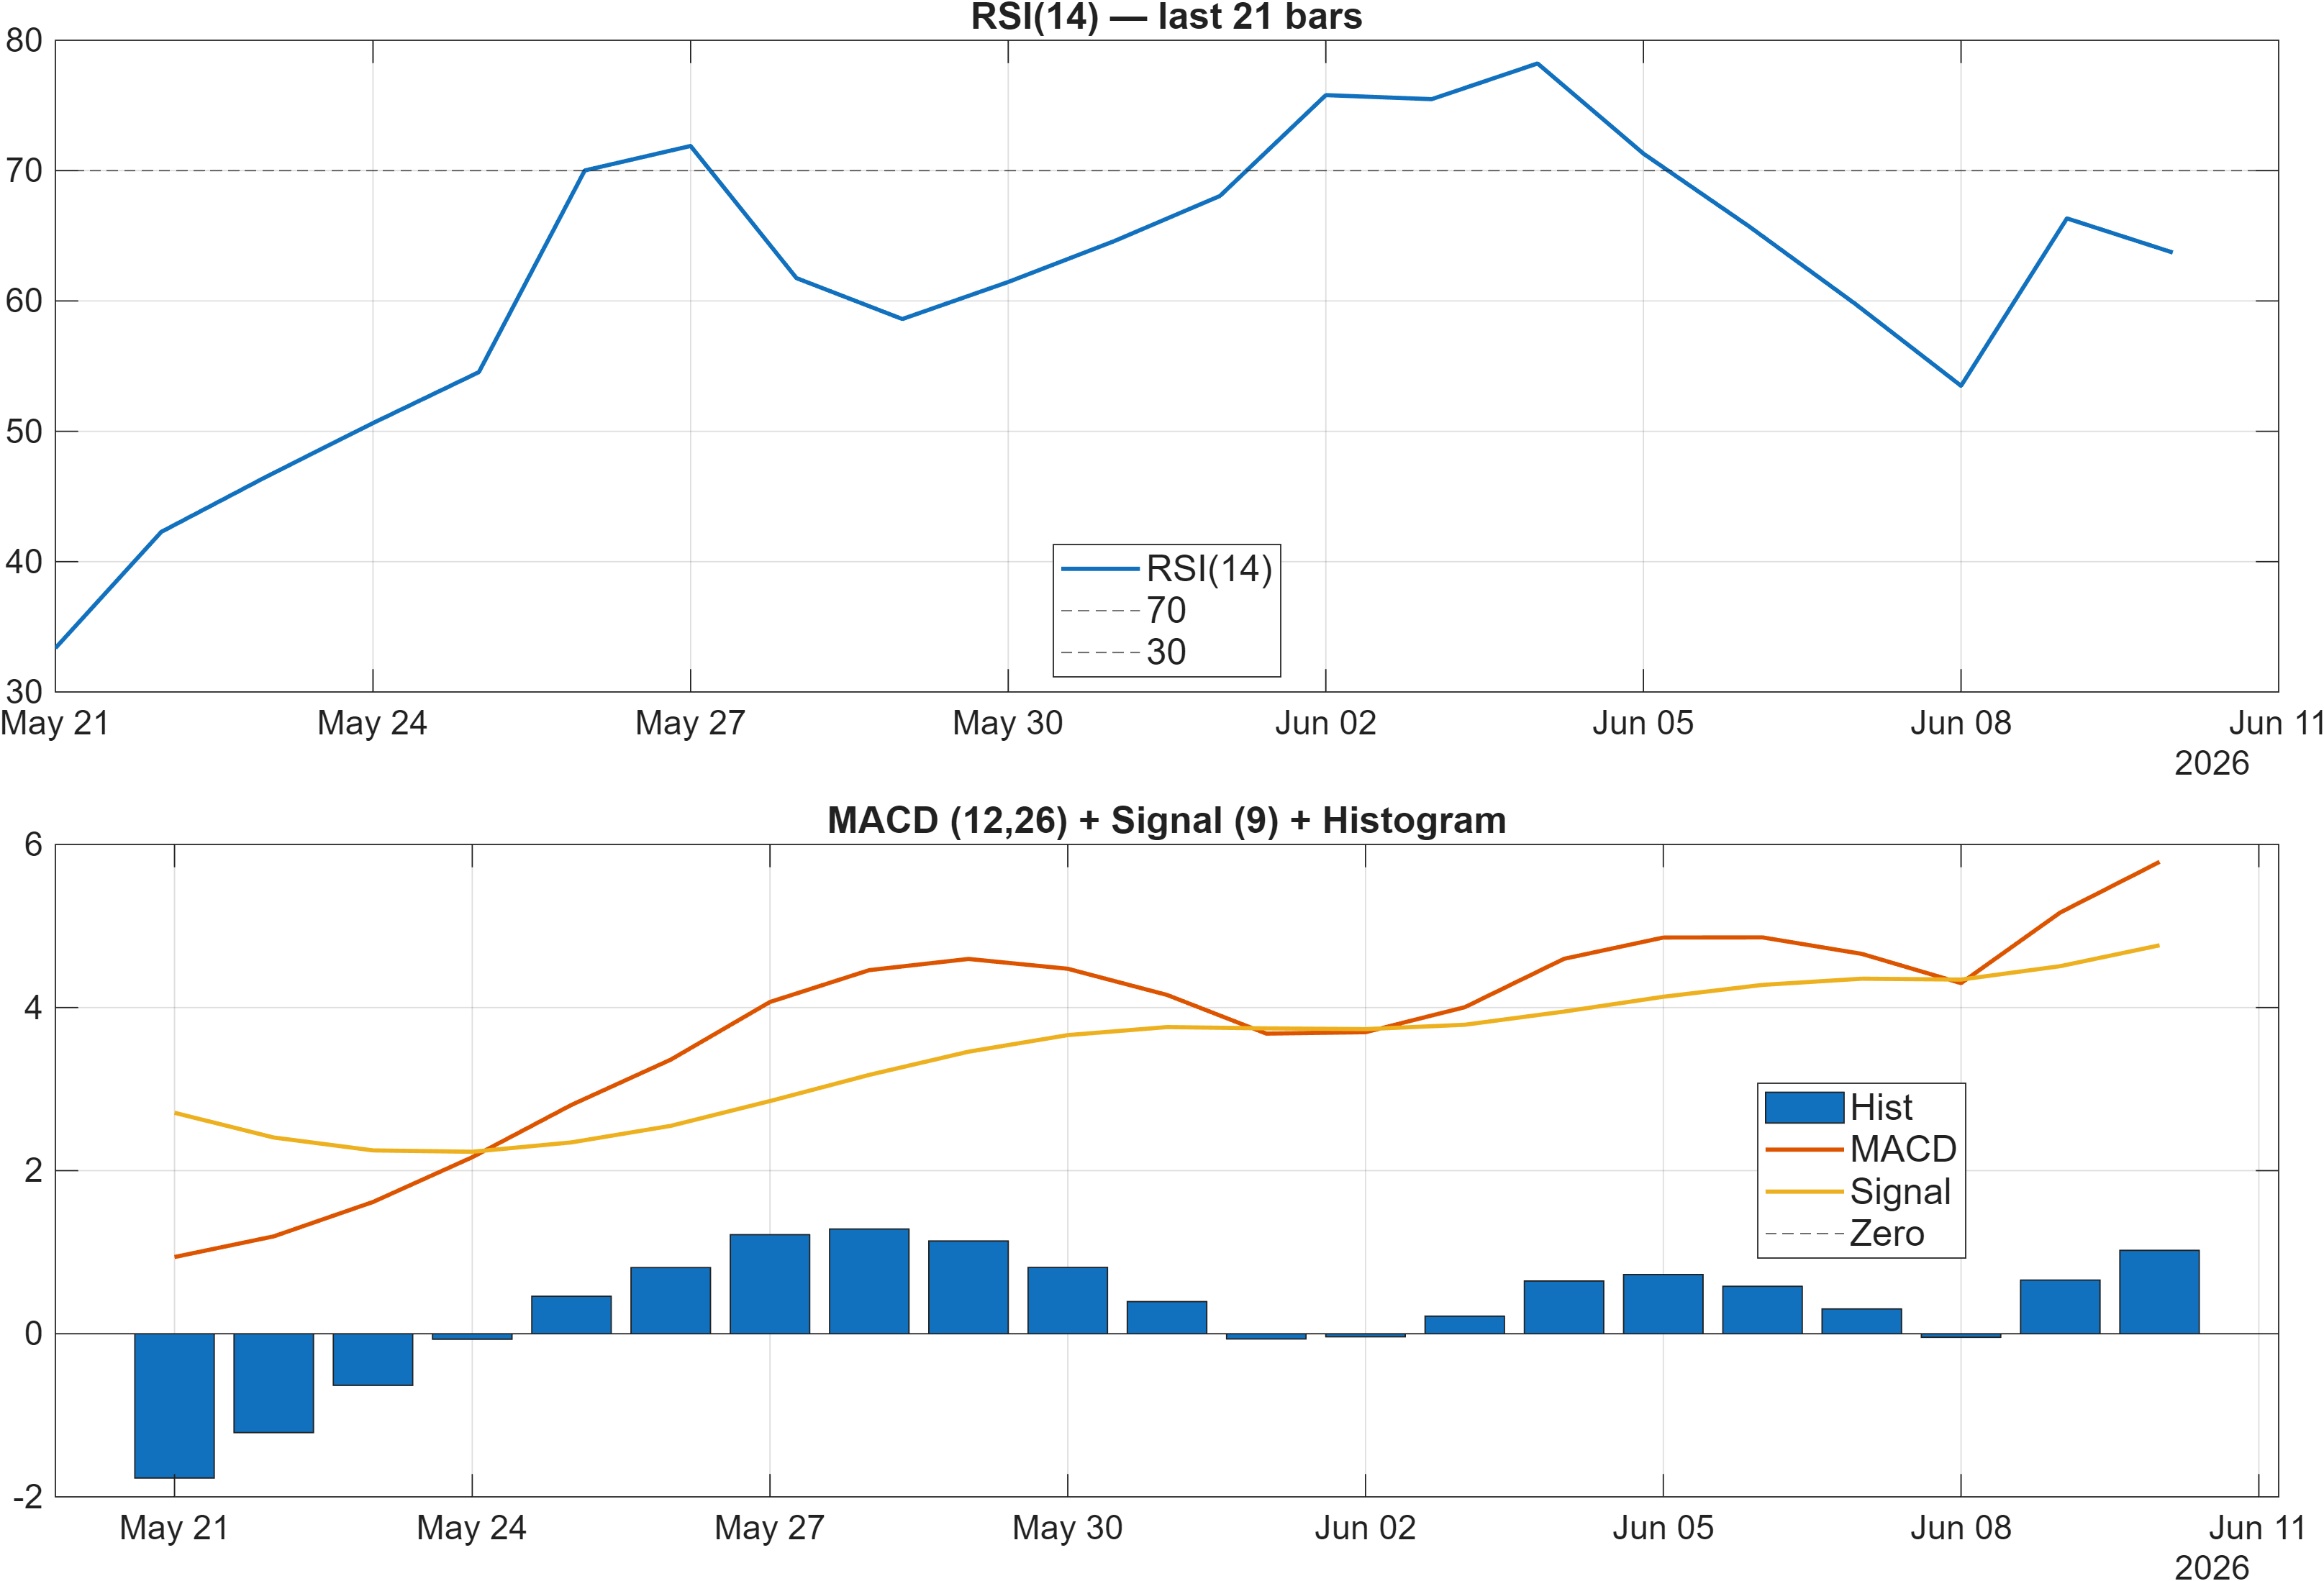
Interpretation: RSI bias = Bullish, MACD hist = 1.0226.
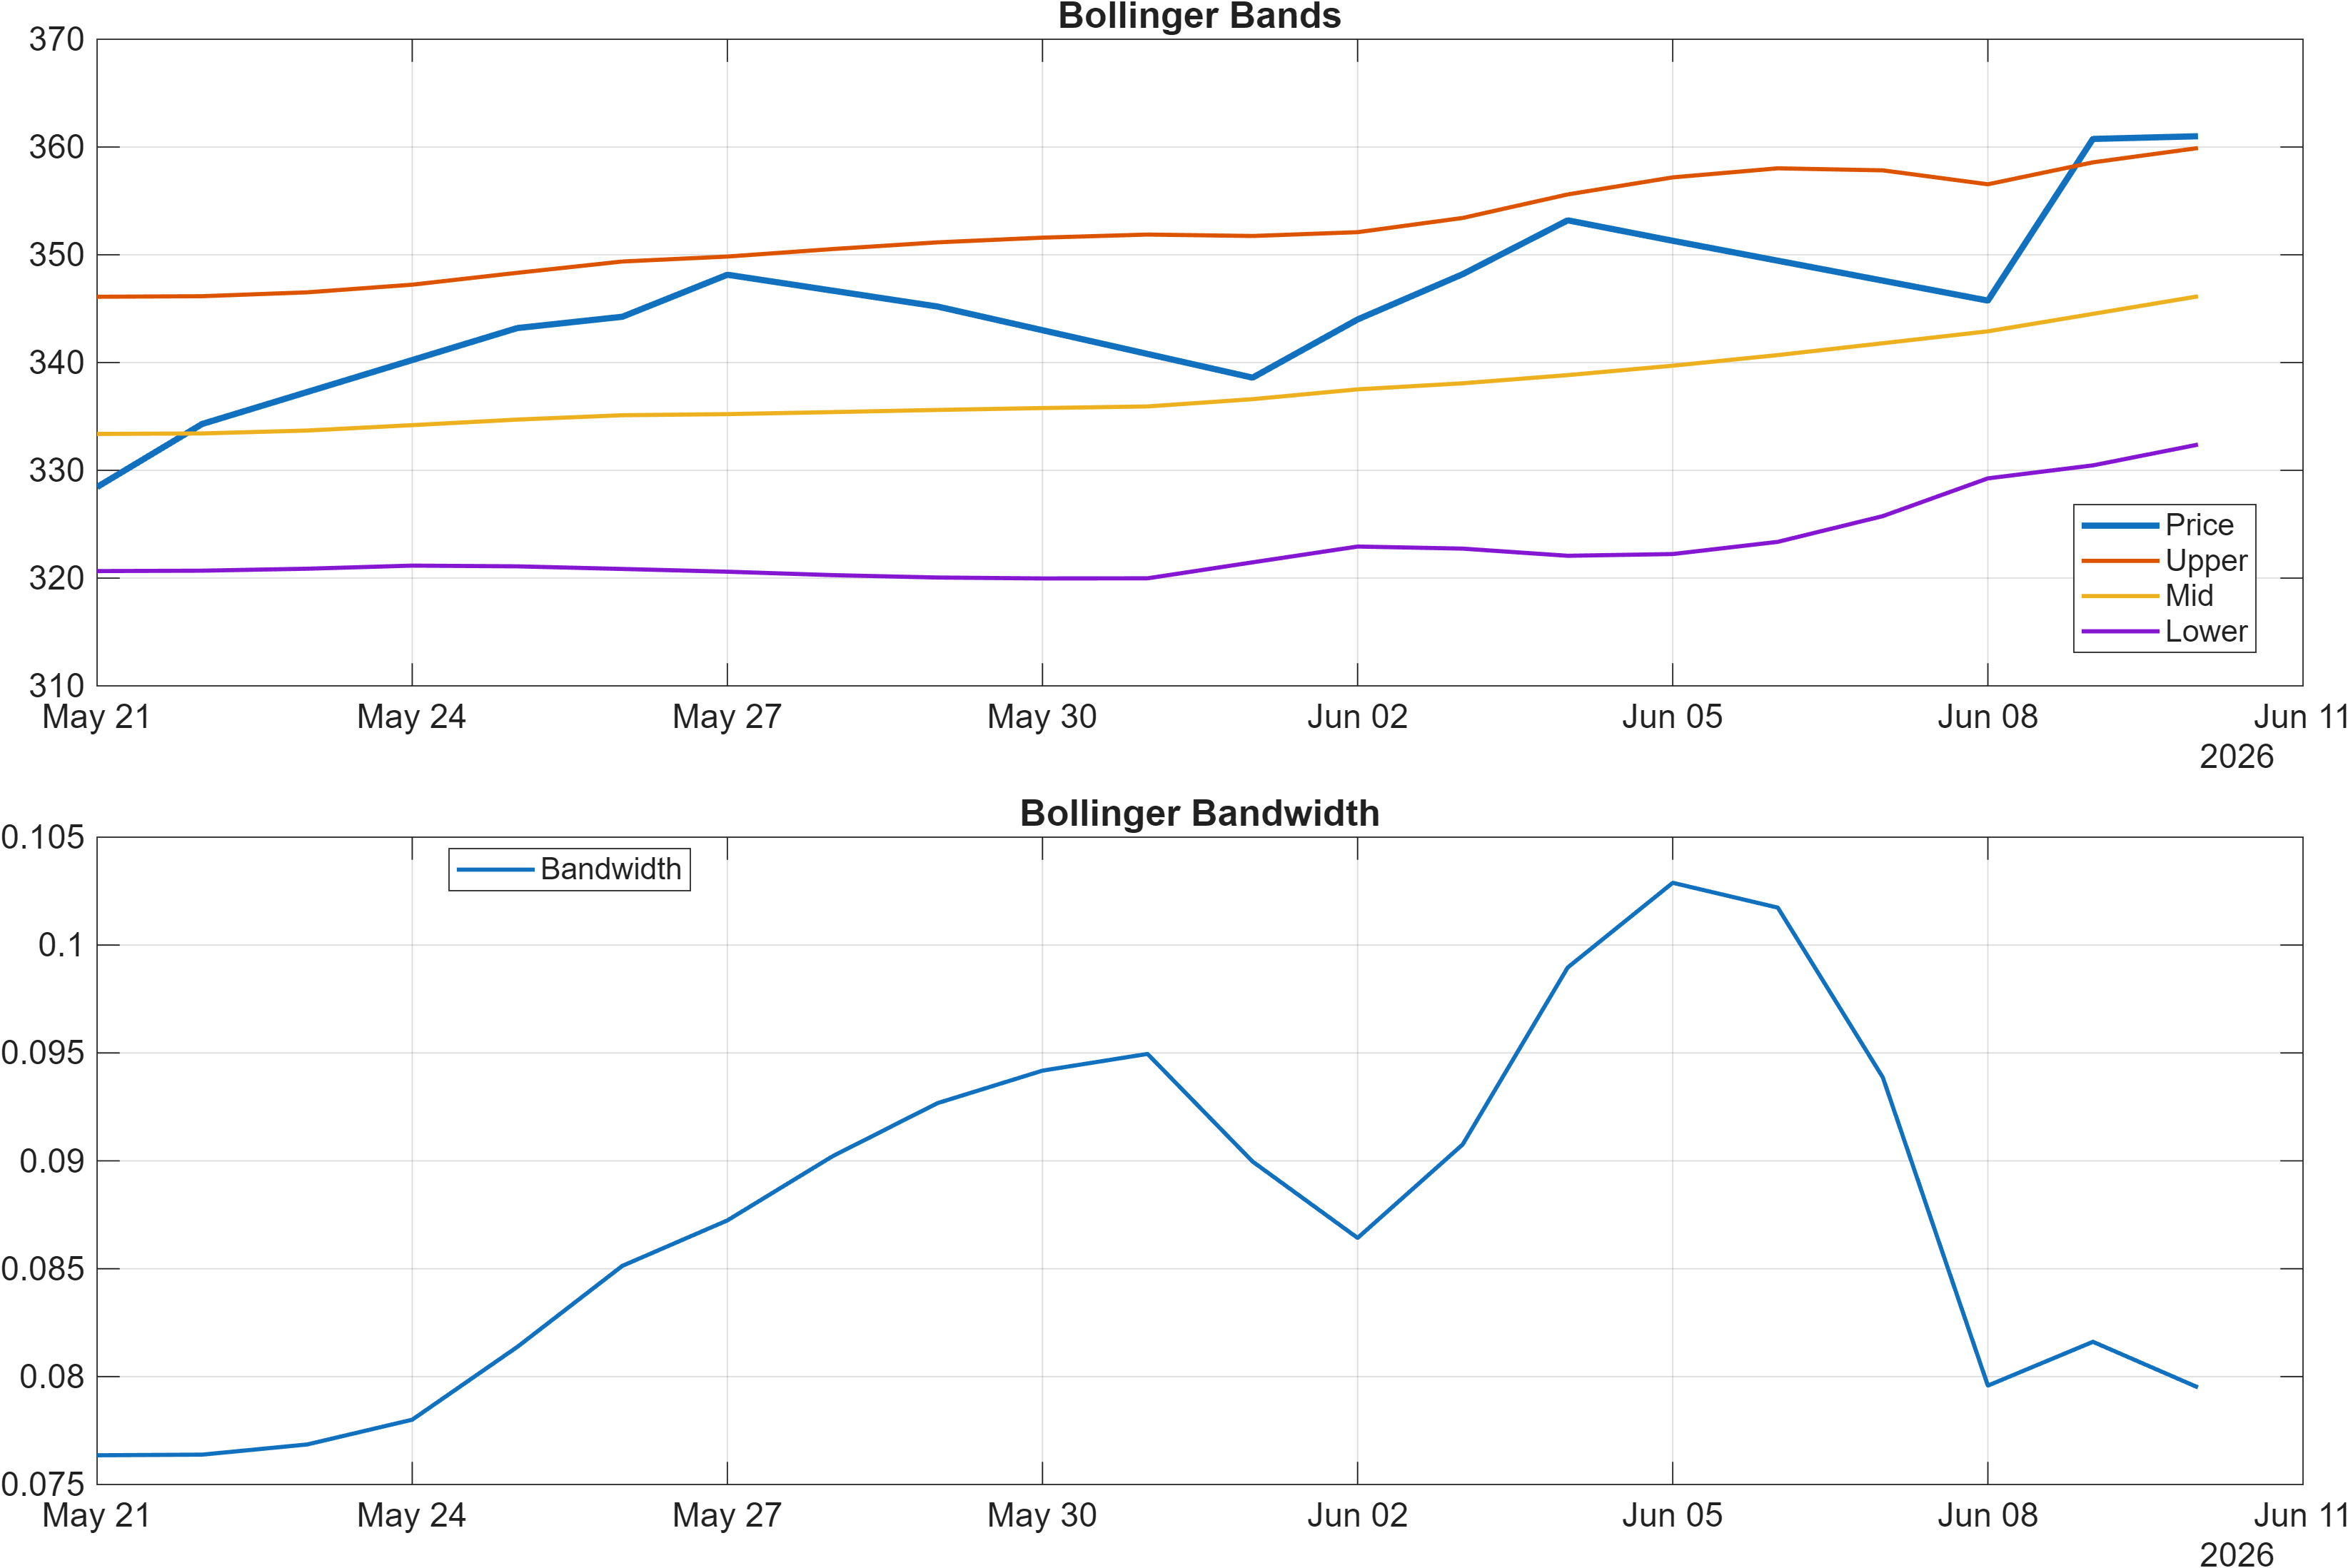
Interpretation: Bandwidth (volatility regime) latest = 0.0795.
Momentum is constructive; volatility is not yet in full expansion
The momentum layer is supportive on two independent measures: the RSI read carries a Bullish bias, and the MACD histogram at 1.0226 indicates positive momentum impulse consistent with trend continuation rather than distribution. Within the 18-signal framework, this aligns with the bullish readings visible in the signal table (e.g., RSI(14) and MACD Hist both flagged bullish there as well), reinforcing internal consistency across momentum tests.
Volatility conditions, however, suggest a different nuance. The Bollinger bandwidth at 0.0795 is characterized as the latest regime reading, and the corresponding 18-signal dashboard marks BB Width as Neutral. Neutral bandwidth frequently implies the market is not yet in a sustained volatility expansion phase—often a state where directional moves can continue but may require fresh catalysts or participation to broaden. This matters because trend continuations supported by steady (not spiking) volatility can be orderly, but they may also be more vulnerable to abrupt reversals if risk re-prices quickly.
A key risk-management interpretation is compression vs. expansion: if bandwidth begins to expand while momentum remains positive, that can validate continuation. If bandwidth expands while momentum indicators roll over, it can signal a transition toward more adverse price behavior. Given the cross-horizon rank drag (monthly #1065), monitoring whether momentum stays firm during any volatility change is particularly relevant for judging whether the short-term strength is maturing into a more durable regime.
4) Support / Resistance zones
Support ~ 311.3000 | Resistance ~ 353.4583
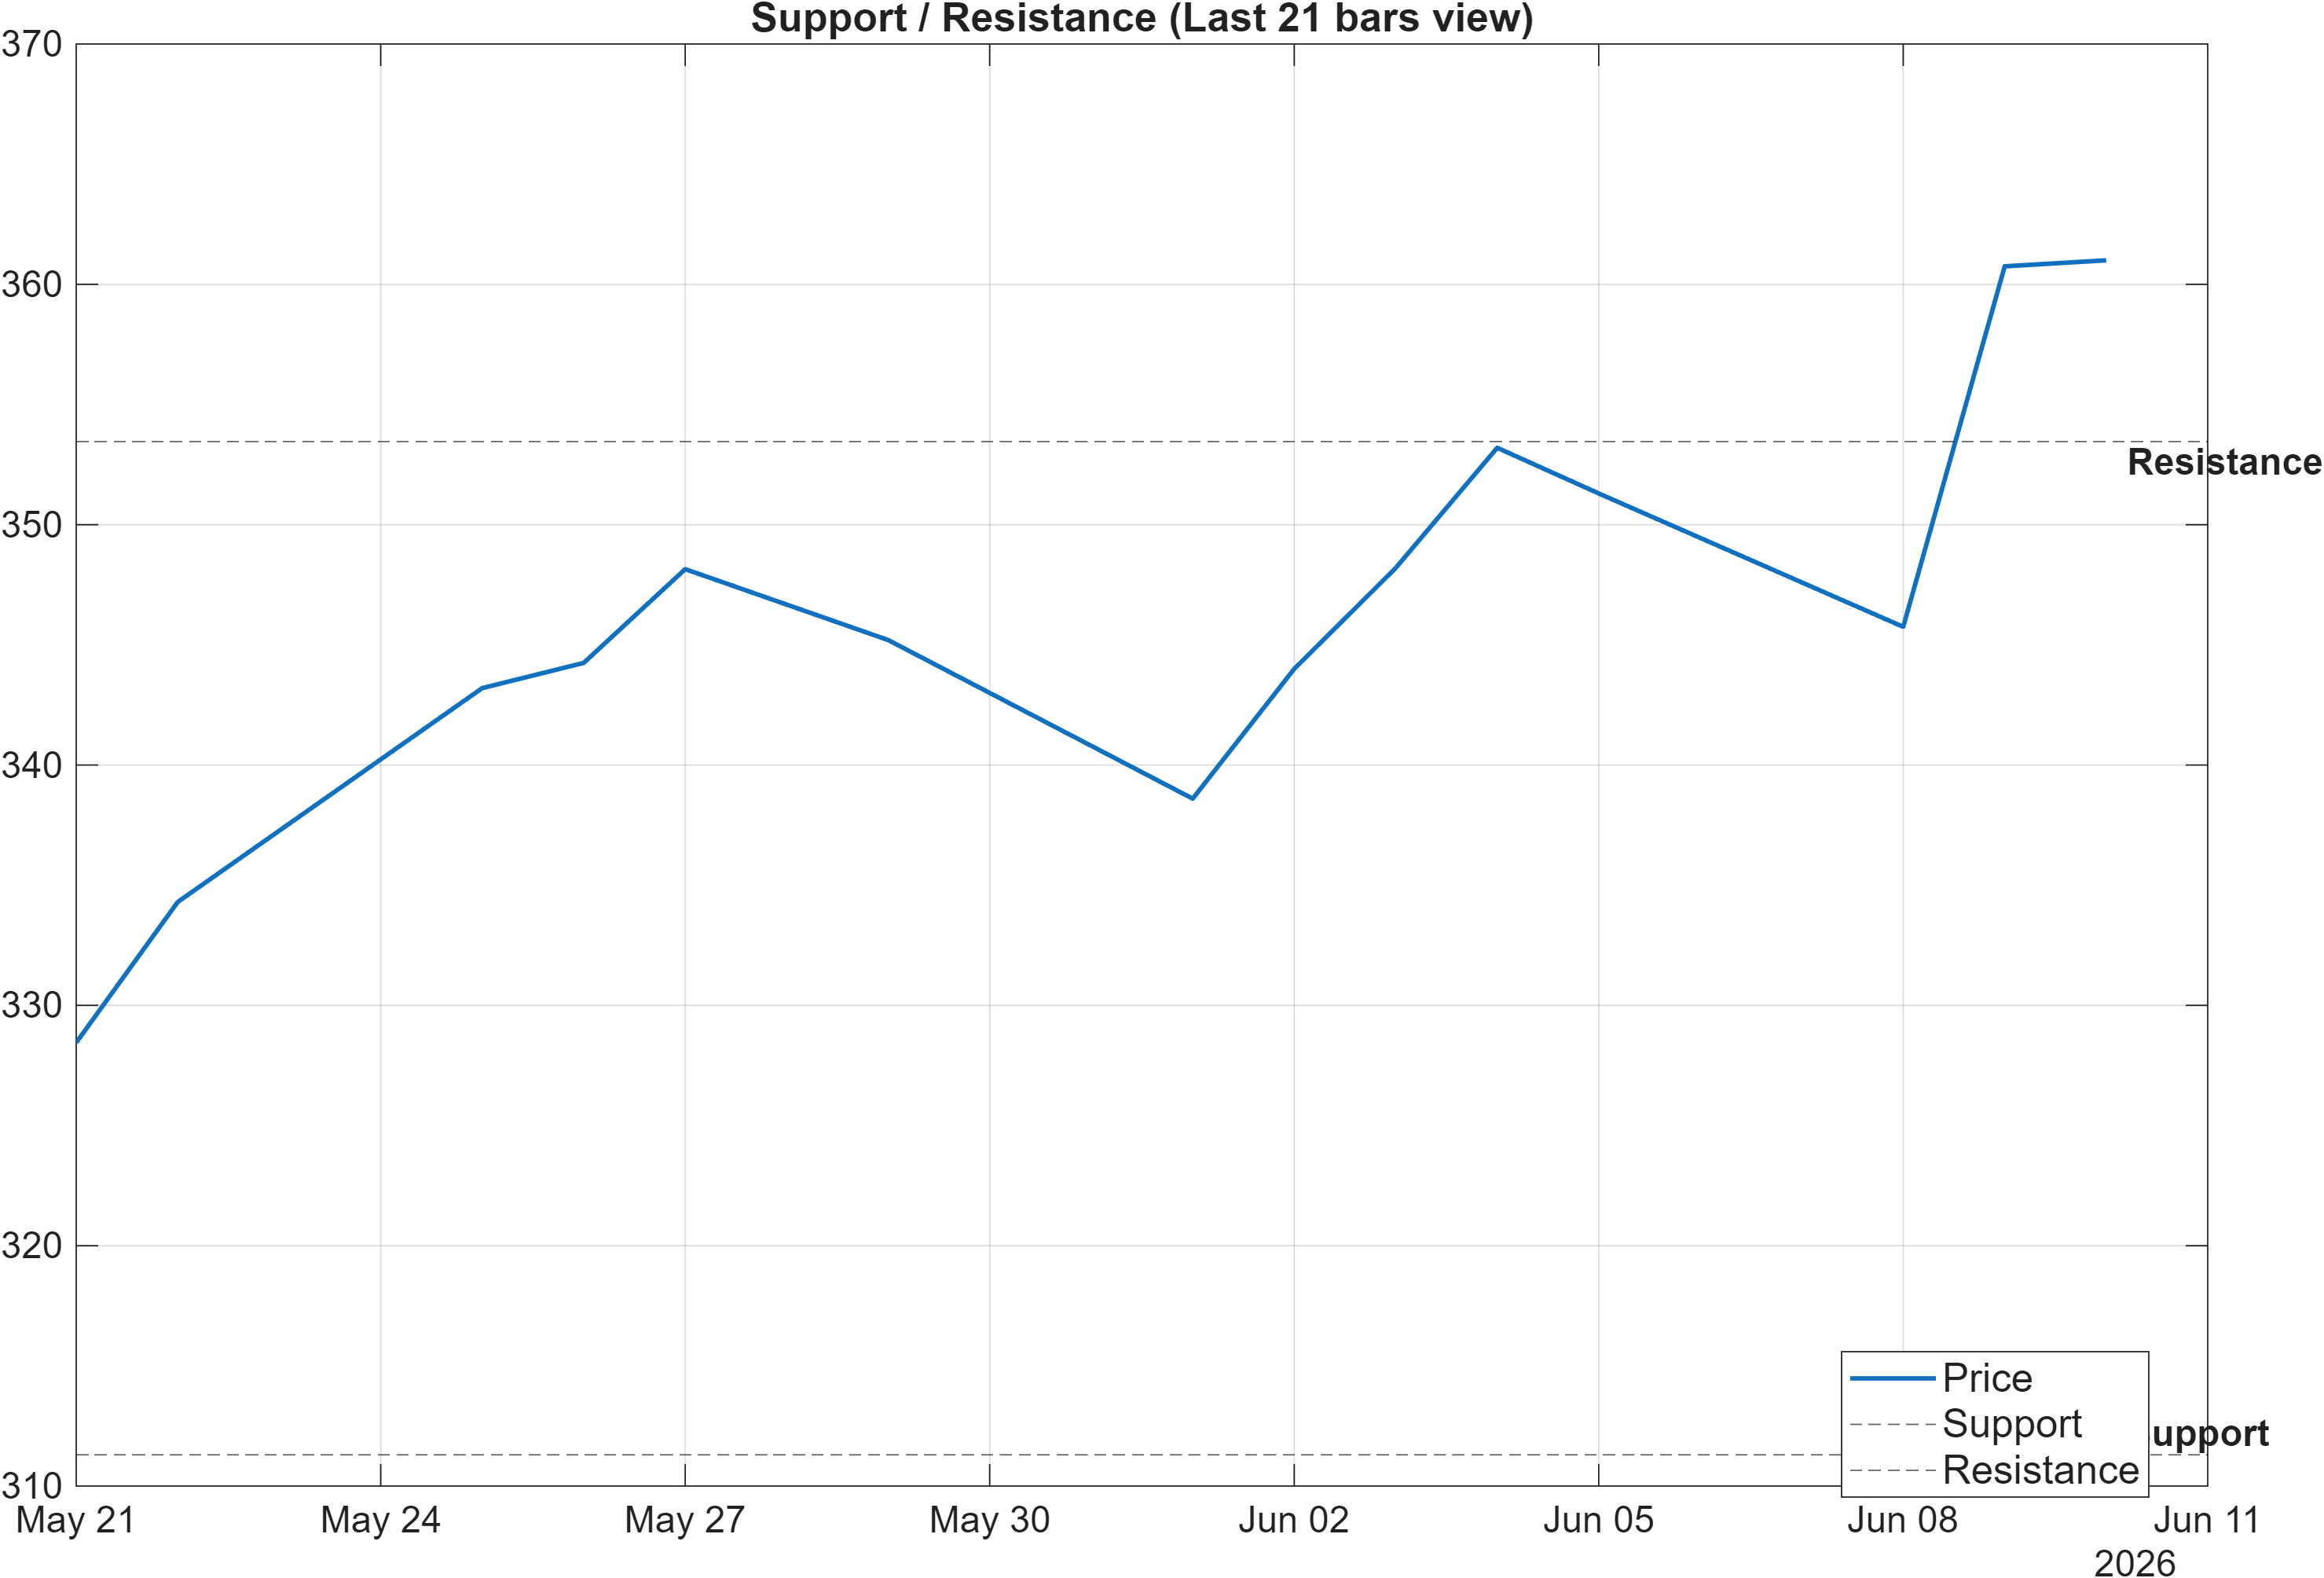
Scenario view: Break above resistance with volume → continuation. Close below support → signal deterioration risk.
Decision zones: where trend claims are tested
The level structure is tight enough to be operational: 311.3000 defines the primary support zone and 353.4583 marks the key resistance boundary. With moving-average alignment already bullish (close vs MA50 bullish; MA50 vs MA200 bullish), these levels function less as “forecast points” and more as validation gates for whether the bullish technical stack can persist.
A sustained push through 353.4583 accompanied by participation would be consistent with the report’s scenario framing and would better reconcile the currently bullish technical composite (overall technical score 0.655) with the weaker longer-window KGNAI ranks (monthly #1065, 6-monthly #981). In that case, resistance becomes a former ceiling that must hold as support on any retest.
Conversely, a close below 311.3000 would be a clean invalidation signal for the near-term bullish setup, particularly because it would likely coincide with deterioration in momentum measures (RSI bias) and could push volatility from neutral bandwidth (0.0795) toward expansion in a negative direction. The cross-horizon dispersion (daily strong vs monthly weak) makes this support line more important than usual: it separates a tactical uptrend from a potentially renewed downtrend inside a still-bearish medium/long regime.
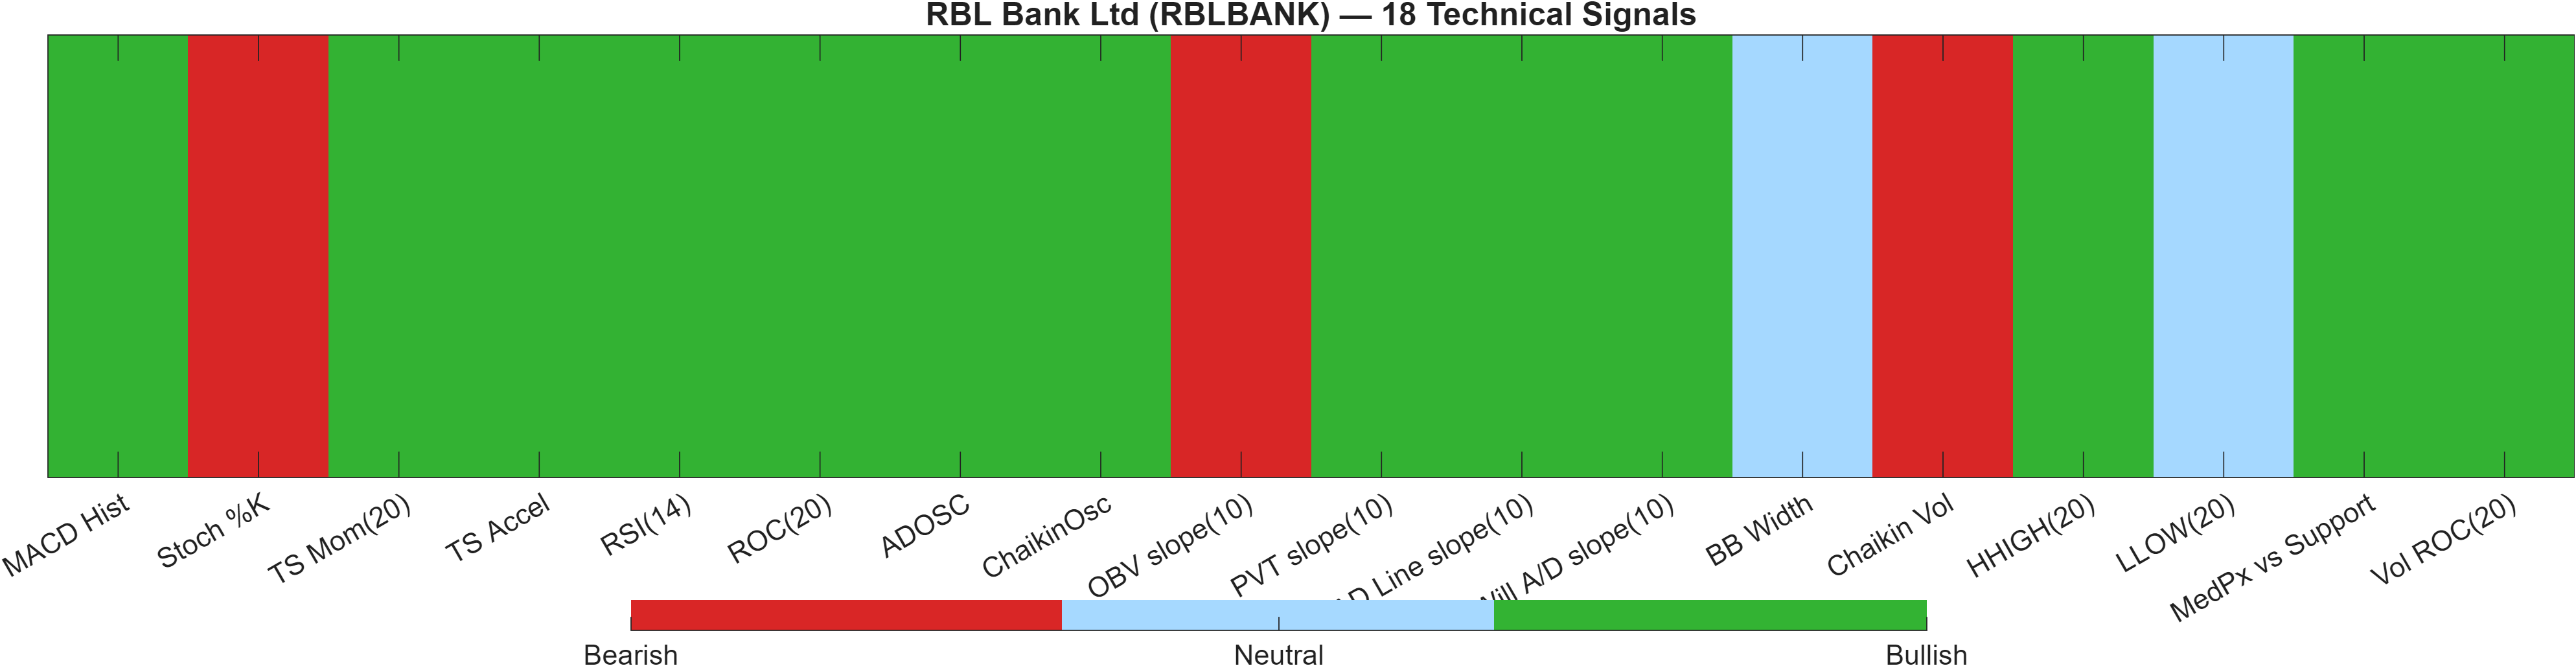
5) Quant Technical Dashboard (18 Signals)
KGNAI AI Technical Analysis Score (Deep Reinforcement Learning): Rank #68 out of 1220 (Rank 1 represents the strongest technical positioning and a higher probability of favorable price behavior. As ranks increase toward the maximum, the probability of favorable outcomes weakens and bearish positioning becomes more dominant.) | Label: Bullish | Score: 0.889
18-Signal Technical Confluence Score: 0.556 (Bullish)
Overall Technical Score (18-signal confluence + DRL rank blend): 0.655 (Bullish)
Note: The blended score reflects signal strength weighted against broader AI technical ranking, which may temporarily diverge.
Blended technical score breakdown: 0.655 (Bullish | Bull 13 / Bear 3 / Neutral 2)
Signal agreement vs dissent: why the composite is bullish despite pockets of caution
The technical dashboard presents a broadly aligned picture: 13 bullish signals vs 3 bearish and 2 neutral support a confluence score of 0.556, and the blended framework lifts the final view to an overall technical score of 0.655. Importantly, the separate AI technical model reinforces that assessment via DRL rank #68 and a high model score (0.889), suggesting the market’s recent price behavior is being classified as relatively strong versus peers.
The most useful information is in the dissenting cluster rather than the majority. Overbought-sensitive oscillators and participation proxies provide the main checks on the bullish case. For example, Stoch %K at 95.64 is flagged bearish, which is consistent with momentum being strong but potentially late-cycle in the immediate swing. Similarly, OBV slope(10) at -1.378e+06 is bearish, a participation warning that can appear when price advances are not uniformly confirmed by on-balance volume behavior. Chaikin Vol at 26.59 also registers bearish, aligning with the idea that the path may become less orderly if volatility characteristics shift.
Offsetting those checks are multiple momentum/flow measures remaining constructive, including the positive MACD framework (histogram positive) and bullish RSI bias, alongside breadth/accumulation-style signals in the table. With BB Width marked Neutral (and bandwidth 0.0795), the composite reads as supportive but not complacent: the setup is strongest if price holds above the defined support and if participation measures stop diverging.
Signal table (Bull/Bear/Neutral)
| Indicator | Value | Signal |
|---|---|---|
| MACD Hist | 1.023 | Bullish |
| Stoch %K | 95.64 | Bearish |
| TS Mom(20) | 26.45 | Bullish |
| TS Accel | 23.99 | Bullish |
| RSI(14) | 63.71 | Bullish |
| ROC(20) | 7.987 | Bullish |
| ADOSC | 92.55 | Bullish |
| ChaikinOsc | 1.081e+05 | Bullish |
| OBV slope(10) | -1.378e+06 | Bearish |
| PVT slope(10) | 2.495e+04 | Bullish |
| AD Line slope(10) | 4.298e+05 | Bullish |
| Will A/D slope(10) | 11.2 | Bullish |
| BB Width | 0.0795 | Neutral |
| Chaikin Vol | 26.59 | Bearish |
| HHIGH(20) | 362 | Bullish |
| LLOW(20) | 327.6 | Neutral |
| MedPx vs Support | 42.65 | Bullish |
| Vol ROC(20) | 387.3 | Bullish |
Interpretation: Indicator-level signals form the base confluence, which is then adjusted using a separate AI-driven technical ranking model. The final technical score summarizes this combined view.
6) News sentiment + extractive gist
Note: Instrument-specific news matches were not found, so the digest includes broader market/sector headlines. Links are provided for verification.
Sentiment score (avg): 0.096 | Positive: 44% | Neutral: 50% | Negative: 6%
KGNAI AI News Sentiment Score (normalized -1 to +1): 0.95 (as of 2026-02-05) | Label: Bullish | Overall news score: 0.92
Positive Developments
Recent coverage across major financial outlets indicates a modestly constructive backdrop for risk assets, with narratives emphasizing improving tone after prior declines and selective stock-specific momentum in parts of the market. In the KGNAI digest, the aggregate mix leans positive (44% positive vs 6% negative), consistent with a small positive average sentiment (0.096). While these items are not instrument-specific for RBLBANK, the pattern matters as contextual “risk-on / risk-off” framing: a constructive tape tends to reduce the penalty for buying breakouts and can help trend signals (like bullish MA alignment and positive MACD readings) travel further before mean reversion asserts.
Neutral / Mixed Developments
The neutral bucket remains the plurality at 50%, reflecting a market still balancing cross-currents. Macro- and geopolitics-linked narratives can coexist with supportive technical conditions, often producing choppier follow-through rather than clean directional extensions. For RBLBANK, this neutral majority fits the broader ranking dispersion: a strong daily rank (#118) can occur even when medium windows remain cautious (e.g., weekly #584). In this environment, confirmation tends to come from price behavior around levels rather than from headlines: sustained strength above resistance typically needs continued participation, while failures at key zones tend to reprice quickly.
Negative / Risk Signals
Risk signals in the digest are present but comparatively small (6% negative). The more relevant takeaway is not magnitude but sensitivity: when markets are influenced by uncertainty, bearish regime ranks (notably monthly #1065 and 6-monthly #981) can reassert even if the technical stack is currently bullish (overall technical score 0.655). That combination can produce fast transitions where a tactical rally gives way to retracement. From a process standpoint, negative-news intensity is less important than whether it coincides with technical deterioration—especially a loss of support at 311.3000 or a worsening in participation proxies that are already mixed (e.g., OBV slope bearish in the signal table).
- Whether sentiment remains mildly constructive (avg 0.096) during tests of 353.4583.
- Any shift in the positive/negative mix (currently 44% vs 6%) alongside changes in volatility (bandwidth 0.0795).
- Headline risk coinciding with a close below 311.3000, which would align narrative stress with technical invalidation.
Sources referenced: Reuters, Bloomberg, Yahoo Finance, MarketWatch, Investing.com
7) Sources
Instrument-specific source linkage is not available in the provided data beyond the aggregated digest note above. The original draft included a list of external links; per KGNAI publishing format, detailed headline lists are compressed into the structured sentiment summary.
You may also like: How KGNAI AI ranks instruments across global markets
Disclaimer: KGNAI provides AI-generated analytics and educational market commentary only. This is not financial advice. Markets involve risk. Always do your own research.